

Fall 2013
Treasury and Trade Solutions
Insights From Our Clients….What’s Next?
Panelists:
Moderators:
Sharon Petrey Assistant Treasurer
The Coca-Cola Company
Michael Fossaceca North America Sales Head, Corporate
Treasury and Trade Solutions, Citi
Joe Promo Assistant Treasurer
Global Treasury Services, Merck
Raeleen Medrano Assistant Treasurer
IBM
Asok Patnaik Segment Strategy & Cross Product Initiatives
Liquidity Management Services
Treasury and Trade Solutions, Citi
Panel Discussion
Perspectives from the Client Advisory Board Survey
Key Challenges & Next Steps : Panel Discussion
Panel & Audience perspectives : What should Citi invest in?
Appendix - Validations from Citi Treasury Diagnostics
1

13%
63%
25%
0% 50% 100%
The pool is NOT providing sufficient/anticipated benefits and we
expect to review it
The pool is providing sufficient/anticipated benefits and we
expect to expand usage (e.g. add more legal entities/currencies/balances)
The pool is providing sufficient/anticipated benefits and we
expect to maintain as-is
77%
45%41%
0%
10%
20%
30%
40%
50%
60%
70%
80%
90%
Cash concentration / Physical pooling
Single Currency Notional Pooling
Multi-currency Notional Pooling
1. Visibility, Funding, Liquidity & Risk Management 1a
How would you rate your visibility of global Cash
on a daily basis?
What are your key impediments to achieving 100%
visibility of global cash on daily basis?
What types of pooling structures do you use to manage
liquidity in your company? Please check all that apply.
If you have a Multi Currency Notional Pool, how
would you best describe its effectiveness?
2
50-75%9%
76-90%50%
Over 90%41%
5%
41%
45%
32%
27%
0% 20% 40% 60%
Others
The cost of getting to the last 10% visibility is not worth it
Some banks in emerging markets unable to provide daily statements
Lack of a global Treasury Management System
No impediments - we have very close to 100% visibility
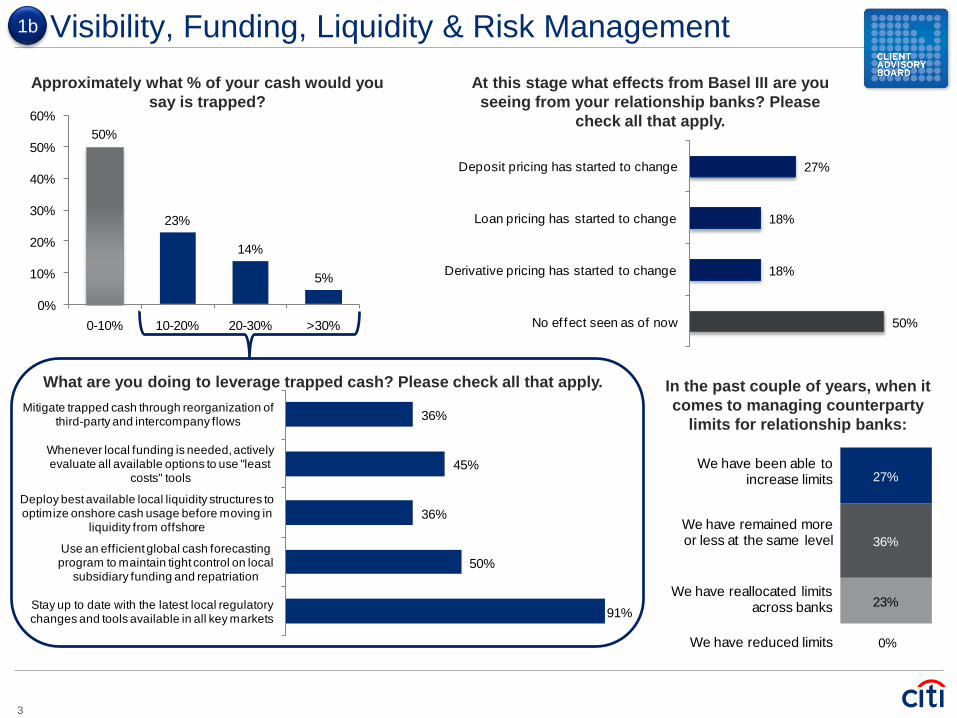
23%
36%
0%
27%We have been able to
increase limits
We have reduced limits
We have reallocated limits across banks
We have remained more or less at the same level
91%
50%
36%
45%
36%
Stay up to date with the latest local regulatory changes and tools available in all key markets
Use an efficient global cash forecasting program to maintain tight control on local
subsidiary funding and repatriation
Deploy best available local liquidity structures to optimize onshore cash usage before moving in
liquidity from offshore
Whenever local funding is needed, actively evaluate all available options to use "least
costs" tools
Mitigate trapped cash through reorganization of third-party and intercompany flows
2. Visibility, Funding, Liquidity & Risk Management 1b
Approximately what % of your cash would you
say is trapped?
What are you doing to leverage trapped cash? Please check all that apply. In the past couple of years, when it
comes to managing counterparty
limits for relationship banks:
At this stage what effects from Basel III are you
seeing from your relationship banks? Please
check all that apply.
3
50%
23%
14%
5%
0%
10%
20%
30%
40%
50%
60%
0-10% 10-20% 20-30% >30% 50%
18%
18%
27%
No ef fect seen as of now
Derivative pricing has started to change
Loan pricing has started to change
Deposit pricing has started to change
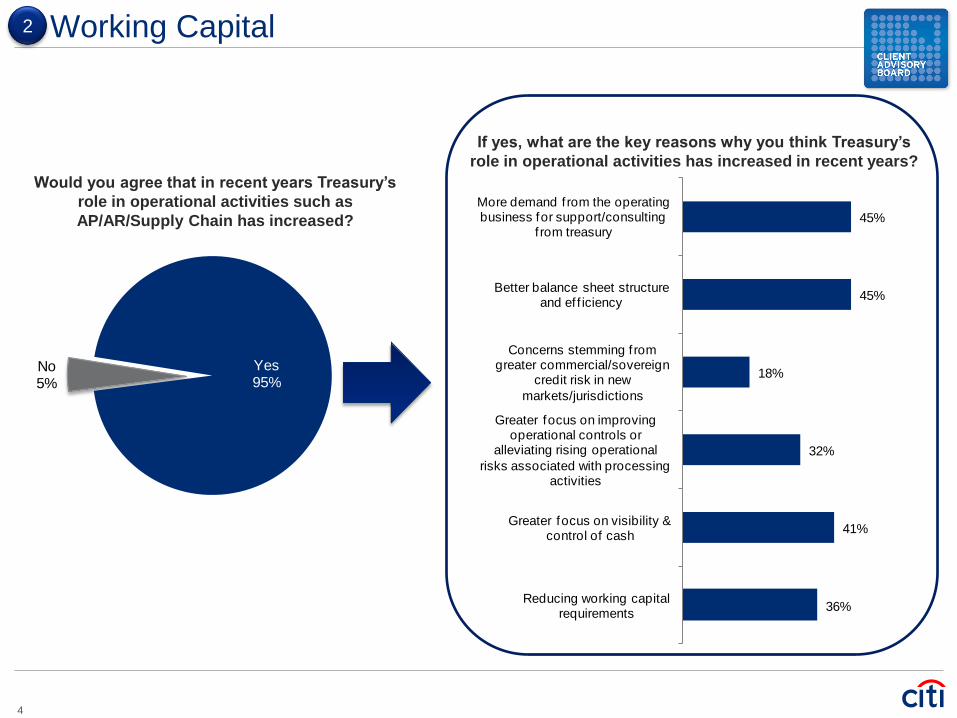
36%
41%
32%
18%
45%
45%
Reducing working capital requirements
Greater focus on visibility & control of cash
Greater focus on improving operational controls or
alleviating rising operational
risks associated with processing activities
Concerns stemming f rom greater commercial/sovereign
credit risk in new
markets/jurisdictions
Better balance sheet structure and ef f iciency
More demand f rom the operating business for support/consulting
f rom treasury
3. Working Capital 2
Would you agree that in recent years Treasury’s
role in operational activities such as
AP/AR/Supply Chain has increased?
If yes, what are the key reasons why you think Treasury’s
role in operational activities has increased in recent years?
4
Yes95%
No5%

8%
75%
42%
50%
75%
Others
Reducing bank cash and external debt held at subsidiaries
More ef fective FX risk management
More ef fective management of intercompany demand/revolving …
More ef fective management of intercompany term loans
4. Treasury Structure & Governance
Do you have one or more In House Banks or are
you considering setting up one in 2014/2015? If yes, what are the key factors that were/are
important in creating the In House Bank(s)?
How quantifiable are the benefits of
your IHB to your management?
3
Will your Treasury have any major transformation projects during 2014
and, if so, what are the main drivers? Please choose all that apply.
5
Yes55%
No41%
Not Sure4%
27%
50%
36%
9%
5%
Treasury-led banking restructuring or streamlining project
Treasury-led transformational project (e.g. material treasury organizational, …
Enterprise-led technology transformation project with impact on Treasury (e.g. ERP …
Enterprise led business transformation project with impact on Treasury (e.g. …
We do not have any notable projects ongoing or planned for 2014
58%
50%
17%
You are able to demonstrate clear,
financially quantifiable benefits
You focus partly on financially
quantifiable benefits and partly on
qualitative benefits
You focus more on qualitative benefits,
as quantifiable benefits are hard to
measure
0%
10%
20%
30%
40%
50%
60%
70%

> Treasury Trends > Working Capital Trends
Key Metrics from Citi Treasury Diagnostics
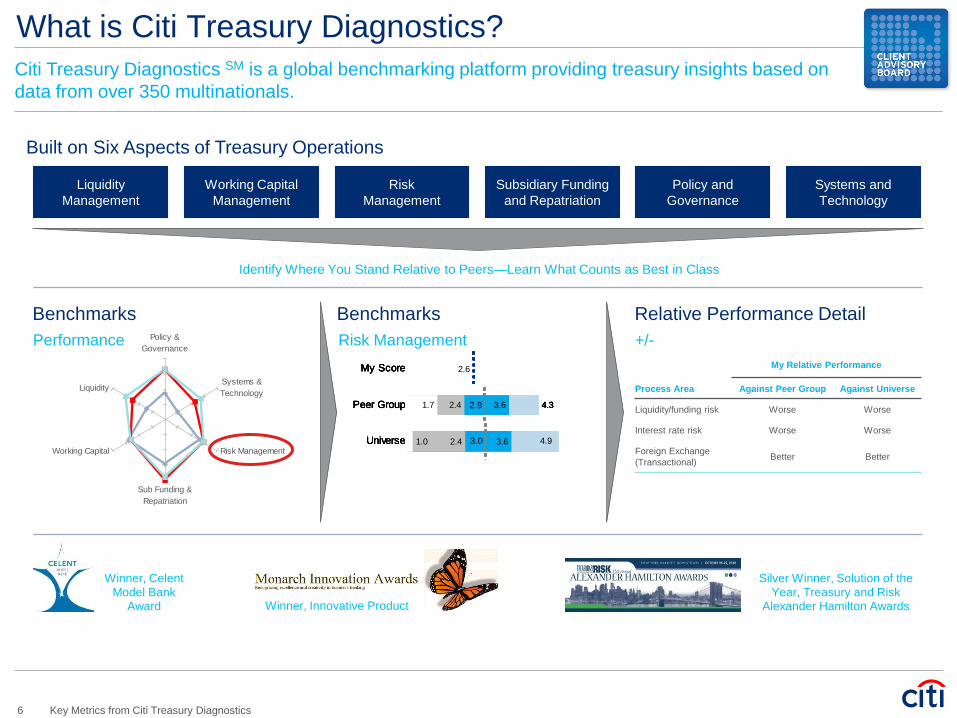
What is Citi Treasury Diagnostics?
Built on Six Aspects of Treasury Operations
Liquidity
Management
Working Capital
Management
Risk
Management
Subsidiary Funding
and Repatriation
Policy and
Governance
Systems and
Technology
Identify Where You Stand Relative to Peers—Learn What Counts as Best in Class
Benchmarks Benchmarks Relative Performance Detail
Winner, Celent
Model Bank Award
Silver Winner, Solution of the
Year, Treasury and Risk Alexander Hamilton Awards Winner, Innovative Product
Performance Risk Management +/- Policy &
Governance
Liquidity
Working Capital
Sub Funding &
Repatriation
Risk Management
Systems &
Technology
4.33.6
3.6
2.4
2.4 4.9
2.6
1.0
1.7
My Score
Peer Group
Universe 3.0
2.9 4.33.6
3.6
2.4
2.4 4.9
2.6
1.0
1.7
My Score
Peer Group
Universe 3.0
2.9 4.33.6
3.6
2.4
2.4 4.9
2.6
1.0
1.7
My Score
Peer Group
Universe 3.0
2.9 4.33.6
3.6
2.4
2.4 4.9
2.6
1.0
1.7
My Score
Peer Group
Universe 3.0
2.9 4.33.6
3.6
2.4
2.4 4.9
2.6
1.0
1.7
My Score
Peer Group
Universe 3.0
2.9 4.33.6
3.6
2.4
2.4 4.9
2.6
1.0
1.7
My Score
Peer Group
Universe 3.0
2.9 4.33.6
3.6
2.4
2.4 4.9
2.6
1.0
1.7
My Score
Peer Group
Universe 3.0
2.9 4.33.6
3.6
2.4
2.4 4.9
2.6
1.0
1.7
My Score
Peer Group
Universe 3.0
2.9
My Relative Performance
Process Area Against Peer Group Against Universe
Liquidity/funding risk Worse Worse
Interest rate risk Worse Worse
Foreign Exchange
(Transactional) Better Better
Citi Treasury Diagnostics SM is a global benchmarking platform providing treasury insights based on
data from over 350 multinationals.
6 Key Metrics from Citi Treasury Diagnostics
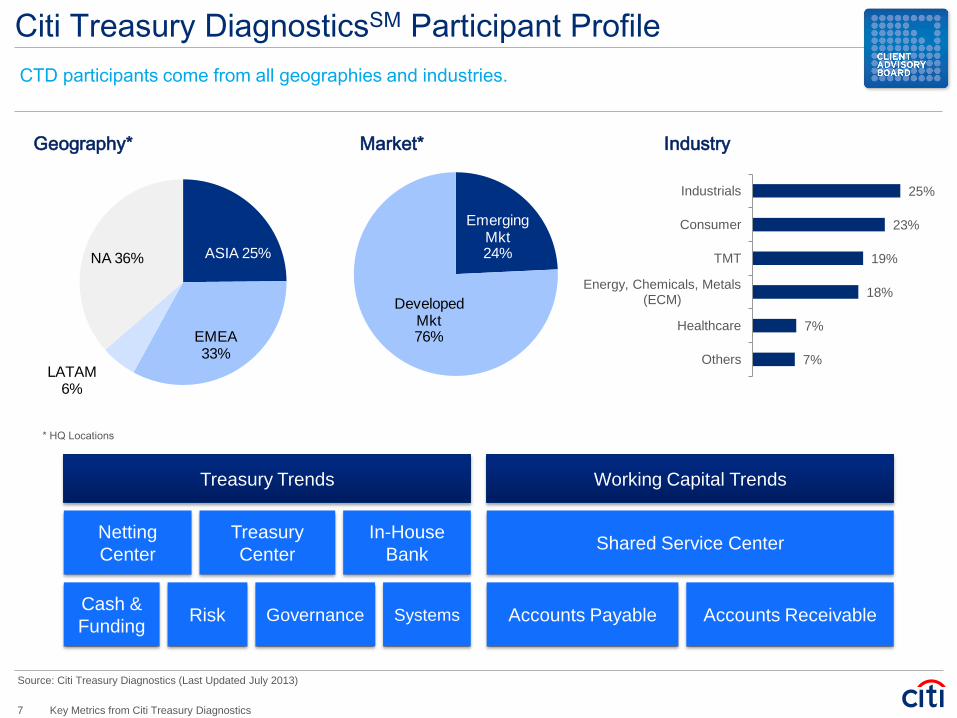
Citi Treasury DiagnosticsSM Participant Profile
CTD participants come from all geographies and industries.
Geography* Industry Market*
* HQ Locations
ASIA 25%
EMEA 33%
LATAM 6%
NA 36%
Emerging Mkt24%
Developed Mkt76%
7%
7%
18%
19%
23%
25%
Others
Healthcare
Energy, Chemicals, Metals (ECM)
TMT
Consumer
Industrials
Treasury Trends
Netting
Center
Treasury
Center
In-House
Bank
Cash &
Funding Risk Governance Systems
Working Capital Trends
Shared Service Center
Accounts Payable Accounts Receivable
Source: Citi Treasury Diagnostics (Last Updated July 2013)
7 Key Metrics from Citi Treasury Diagnostics

1. CTD Trends: Visibility, Funding and Risk Management
Cash & Funding
Visibility1
Forecast2
Risk
Treasury Risk Coverage3
“Post financial crisis, there is
greater emphasis on global
visibility, control & risk
management” 59%
42%
Daily Cash Balance Full Visibility
+17% Full visibility of daily cash
balance increased by 17%
Source: Citi Treasury Diagnostics (Last Updated July 2013)
+4%
32%
27%
Fully or Partially Automated Forecast
(facilitated by TWS/ERPs)
Fully or Partially
Automated Forecast
facilitated by TWS/ERPs
gained ground by 4%
2011-2013 Responses 2009 Responses
FX 83% 17%
Liquidity 78% 22%
Counterparty 84% 16%
71% 29% Interest Rate
36% 64% Commodity
Yes No
1. How much of your total cash balance do you have daily visibility to?
2. Do you forecast your cash flows?
3. Does your treasury policy cover all FX, Liquidity, Counterparty, Interest Rate, and Commodity risks?
1
8 Key Metrics from Citi Treasury Diagnostics
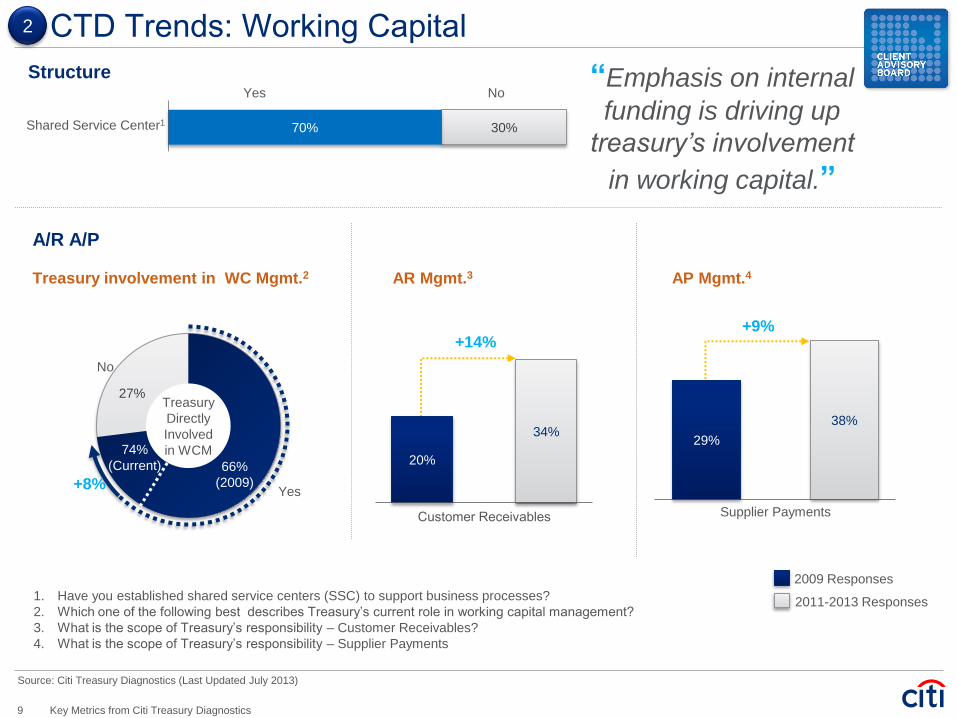
2. CTD Trends: Working Capital
Structure
A/R A/P
Treasury involvement in WC Mgmt.2 AR Mgmt.3 AP Mgmt.4
“Emphasis on internal
funding is driving up
treasury’s involvement
in working capital.”
30% Shared Service Center1
Yes No
70%
No
Yes
27% Treasury
Directly
Involved
in WCM
+8%
74%
(Current) 66%
(2009)
Supplier Payments
+9%
38%
29%
Customer Receivables
+14%
34%
20%
2011-2013 Responses
2009 Responses
Source: Citi Treasury Diagnostics (Last Updated July 2013)
1. Have you established shared service centers (SSC) to support business processes?
2. Which one of the following best describes Treasury’s current role in working capital management?
3. What is the scope of Treasury’s responsibility – Customer Receivables?
4. What is the scope of Treasury’s responsibility – Supplier Payments
2
9 Key Metrics from Citi Treasury Diagnostics
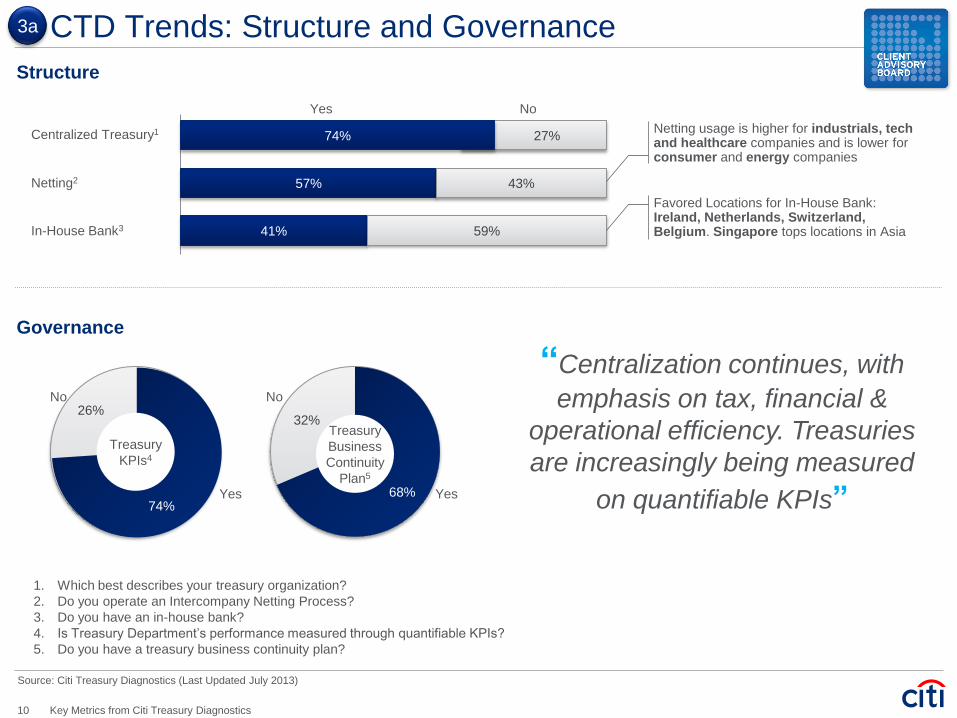
3. CTD Trends: Structure and Governance
Structure
Governance
Centralized Treasury1
Netting2
In-House Bank3
Yes No
27% 74%
57% 43%
41% 59%
Netting usage is higher for industrials, tech and healthcare companies and is lower for consumer and energy companies
Favored Locations for In-House Bank: Ireland, Netherlands, Switzerland, Belgium. Singapore tops locations in Asia
No
Yes
26%
74%
No
Yes
32% Treasury
Business
Continuity
Plan5
68%
Treasury
KPIs4
Source: Citi Treasury Diagnostics (Last Updated July 2013)
“Centralization continues, with
emphasis on tax, financial &
operational efficiency. Treasuries
are increasingly being measured
on quantifiable KPIs”
1. Which best describes your treasury organization?
2. Do you operate an Intercompany Netting Process?
3. Do you have an in-house bank?
4. Is Treasury Department’s performance measured through quantifiable KPIs?
5. Do you have a treasury business continuity plan?
3a
10 Key Metrics from Citi Treasury Diagnostics
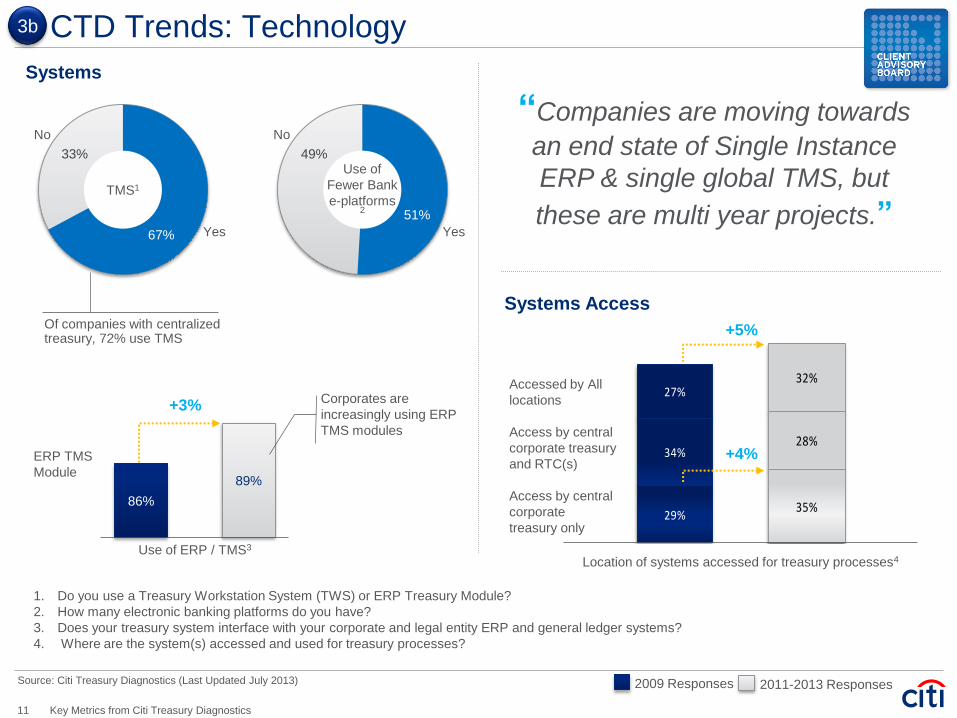
4. CTD Trends: Technology
Systems
Use of ERP / TMS3
89%
86%
Corporates are
increasingly using ERP
TMS modules
ERP TMS
Module
+3%
No
Yes
49% Use of
Fewer Bank
e-platforms 2
51%
No
Yes
33%
67%
TMS1
Of companies with centralized treasury, 72% use TMS
2011-2013 Responses 2009 Responses Source: Citi Treasury Diagnostics (Last Updated July 2013)
“Companies are moving towards
an end state of Single Instance
ERP & single global TMS, but
these are multi year projects.”
29% 35%
34% 28%
27% 32%
29% 35%
34% 28%
27% 32%
Location of systems accessed for treasury processes4
+4%
+5%
Access by central
corporate
treasury only
Access by central
corporate treasury
and RTC(s)
Accessed by All
locations
Systems Access
1. Do you use a Treasury Workstation System (TWS) or ERP Treasury Module?
2. How many electronic banking platforms do you have?
3. Does your treasury system interface with your corporate and legal entity ERP and general ledger systems?
4. Where are the system(s) accessed and used for treasury processes?
3b
11 Key Metrics from Citi Treasury Diagnostics

1. Industry Breakdown: Treasury Trends
“Trends appear to indicate that
best in class is generally
agnostic to industry verticals.”
Source: Citi Treasury Diagnostics (Last Updated July 2013)
42%
54%
50%
50%
49%
48%
58%
46%
50%
50%
51%
52%
TMT
ECM
Industrials
Healthcare
Consumer
Universe
In-House Bank (IHB)4
63%
68%
68%
60%
63%
63%
75%
80%
85%
75%
70%
77%
Universe
Consumer
Healthcare
Industrials
ECM
TMT
Centralized Treasury Centralized Risk Management
Centralization12
70% 69%
58%65% 66% 67%
0%
10%
20%
30%
40%
50%
60%
70%
80%
Universe Consumer Healthcare Industrials ECM TMT
Treasury KPIs3
1. Which best describes your treasury organization?
2. Is risk management centralized or regional?
3. Is Treasury Department’s performance measured through quantifiable KPIs?
4. Do you have an in-house bank?
4
12 Key Metrics from Citi Treasury Diagnostics

2. Industry Breakdown: Working Capital Trends
Source: Citi Treasury Diagnostics (Last Updated July 2013)
Shared Service Centers (SSCs)2
86%
63%
68%
71%
68%
71%
14%
37%
32%
29%
32%
30%
TMT
ECM
Industrials
Healthcare
Consumer
Universe
Treasury in Working Capital Management1
“Treasuries are playing a larger
role in Working Capital
Management but many have
not reached optimal state.”
2.3
2.3
2.1
2.5
2.3
2.7
Universe
Consumer
Healthcare
Industrials
ECM
TMT
Treasury Involvement in WC - Score (0-5)3
66% 73%86%
67%53%
75%
Universe Consumer Healthcare Industrials ECM TMT
1. Which one of the following best describes Treasury’s current role in working capital management?
2. Have you established shared service centers (SSC) to support business processes?
3. Overall calculated Treasury and Working Capital score
5
13 Key Metrics from Citi Treasury Diagnostics

0%
10%
20%
30%
40%
50%
60%
Universe Consumer Healthcare Industrials ECM TMT
Multiple systems with E-Banking One system per region with host to host links
Single processor with host to host interface Other
3. Industry Breakdown: Technology Trends
Source: Citi Treasury Diagnostics (Last Updated July 2013)
“In our wider client universe, there
is still much room for improvement
in treasury technology.”
67%
61%
64%
68%
62%
78%
Universe
Consumer
Healthcare
Industrials
ECM
TMT
TWS / ERP1
Payment Processing Systems2
22% 25%
28%
22%21%
16%
82%
81%
89%
83%
74%
84%75%
83%
67%
77%
65%
71%
Universe
Consumer
Healthcare
Industrials
ECM
TMT
Bank Relationship Management Cash Operations/Liquidity Management
Treasury Controls and Accounting
Treasury Processes supported by TWS / ERP3
1. Do you use a Treasury Workstation System (TWS) or ERP Treasury Module?
2. Have you rationalized your payment processing systems in any of the ways noted below?
3. What treasury processes does your TMS support? (Bank Relationship management; Cash Operations / Liquidity Management;
Treasury Controls and Accounting)
6
14 Key Metrics from Citi Treasury Diagnostics


![category insights] [category insights · The FMCG Business team endeavours to produce a monthly snapshot of category news and highlights, based on information from participating clients,](https://static.documents.pub/doc/80x56/5f698ac67e459328e25b1606/category-insights-category-the-fmcg-business-team-endeavours-to-produce-a-monthly.jpg)


