

INSTRUCTIONS FOR PREPARING
5–YEAR STRATEGIC PLANS
FOR THE FISCAL YEARS 2020 – 2024
LEGISLATIVE BUDGET OFFICE May 2018
1
Contents
Instructions for FY 2020 – 2024 Agency 5-Year Strategic Plan 2
Example Agency 14
Performance Measure Definitions, Appendix I 20
Strategic Planning Template for Mississippi State Government, Appendix II 24
Summary of Strategic Plan Structure, Appendix III 25
Glossary of Performance Budgeting Terms, Appendix IV 26
Building a Better Mississippi: The Statewide Strategic Plan for Performance and
Budgetary Success, Appendix V 30
2
Introduction:
The Mississippi Performance Budget and Strategic Planning Act of 1994, mandates the development of
5-year strategic plans for all state agencies. The strategic plans to be submitted this year will cover the
Fiscal Years 2020 through 2024.
The Legislature is continuing to lead an initiative to strengthen Mississippi government program
performance budgeting. State agencies are being asked to establish clear priorities that will reflect the
statewide vision, mission and philosophy as outlined in Building a Better Mississippi, The Statewide
Strategic Plan for Performance and Budgetary Success. In doing so state agencies will align their own
strategic plans to achieve established statewide priorities.
The Agency 5-Year Strategic Plan instructions emphasize the integration of the statewide goals and
benchmarks as an integral part of the state agency plan.
Purpose and Benefits:
Strategic planning requires that agency leaders thoughtfully set a long-range course of action for the
agency that takes into consideration the agency's mission, the agency's resources, and all external/internal
factors affecting the agency’s ability to meet targeted goals. The strategic plan should identify the
services to be provided by the agency that reflect the statewide vision, mission and philosophy. The
strategic plan should address issues which are of interest to the public served and should focus on results
rather than efforts. Strategic planning should be done at all levels of the agency and should include input
from the public served by the agency when possible.
An agency should regard this process as an opportunity to clarify its purpose and direction, and therefore,
develop a stronger agency identity. Strategic planning will enhance an agency's ability to make the
Legislature aware of anticipated future opportunities and challenges. Strategic planning is an ongoing
process. Each year, agencies will be required to submit a new (revised) strategic plan based upon a
review of the agency's mission and goals.
Strategic Planning:
➢ determines the optimal actions for a state agency to do to satisfy public expectations
➢ establishes accountability for outcomes
➢ allows for a plan to be reviewed and modified regularly
➢ should be realistic and recognizes limitations such as personnel issues, fiscal conditions and
budgetary trends
Changes in Budgetary Programs and Performance Measures:
The Legislature is in the fourth year of revitalizing Performance Budgeting in Mississippi. However, the
process is still in transition. As with last year, Performance Measures need to be integrated into the
3
Annual Budget Requests. Some agencies restructured their Budgetary Programs in last year’s Agency 5-
Year Strategic Plans, but not in the annual budget request. New Performance Measures were added to
the Agency 5-Year Strategic Plans, and now need to be incorporated into the Annual Budget Request.
The Legislature may have added Performance Measures to appropriation bills that were new and not
included in the Agency 5-Year Strategic Plans, nor in the Annual Budget Requests. (Note:
Approximately 35 agencies have Performance Measures in their appropriation bills with more being
added each year, so this will not apply to all agencies.)
Listed below are some steps to guide agencies in reporting their Performance Measures in both the
Agency Strategic Plan and in the Annual Budget Request:
1. The due date for Agency 5-Year Strategic Plans has been changed to Monday, July 16th, 2018.
2. Performance Measures in the Agency 5-Year Strategic Plans and in the Annual Budget
Request should match each other. This will provide a common base of Performance Measures
that can be refined in future years if necessary.
3. If your agency is one of the approximately 35 agencies that have Performance Measures in your
appropriation bill, and there are Performance Measures included in the bill that are not included
in the FY 2019 Strategic Plan, or the 2019 Annual Budget Request, then these should be included
in both the FY 2020 – FY 2024 Strategic Plan and Annual Budget Request. Please call your LBO
budget analyst to have these new Performance Measures added into the Online Budget Request
System (OBRS).
4. The program designations in the Annual Budget Request for FY 2020 should match the programs
contained in the Agency 5-Year Strategic Plan. If you have any questions, please call your LBO
budget analyst for further guidance.
5. In order to coordinate both the Agency 5-Year Strategic Plan and the Annual Budget Request, it
will be necessary to work on both simultaneously. Please note that the Agency 5-Year Strategic
Plan will be submitted to LBO and DFA first - BEFORE the Annual Budget Request.
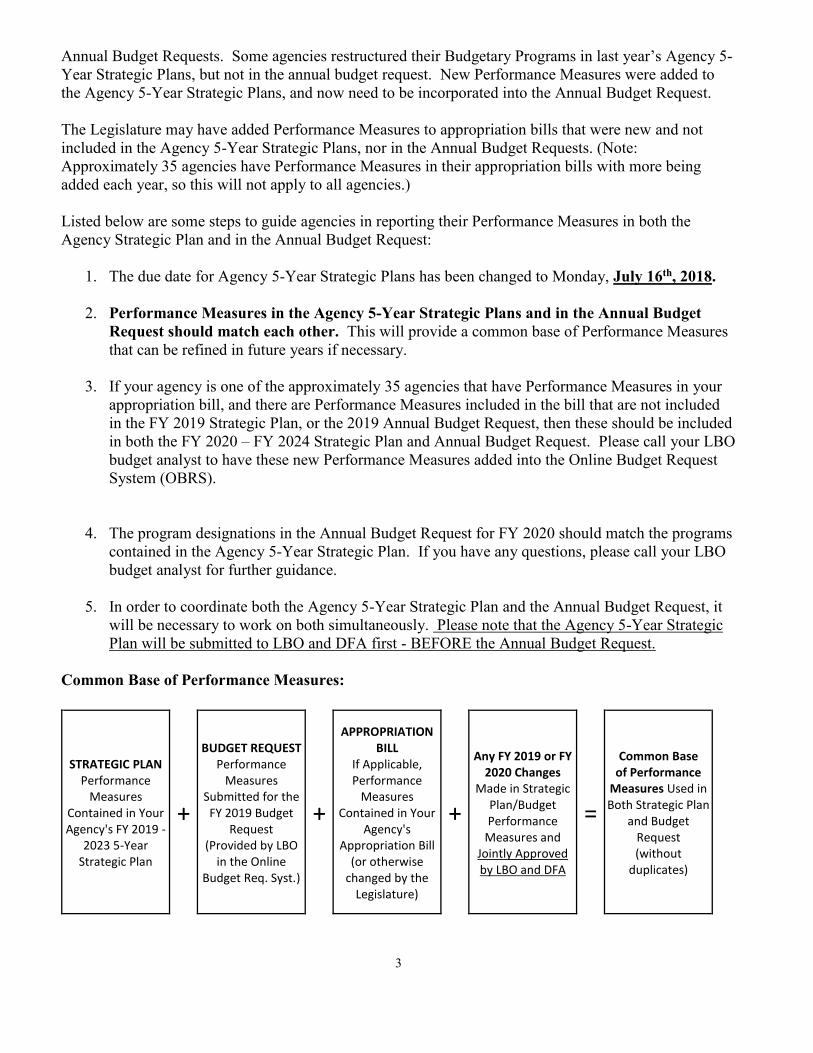
Common Base of Performance Measures:
STRATEGIC PLAN Performance
Measures Contained in Your Agency's FY 2019 -
2023 5-Year Strategic Plan
+
BUDGET REQUEST Performance
Measures Submitted for the FY 2019 Budget
Request (Provided by LBO
in the Online Budget Req. Syst.)
+
APPROPRIATION BILL
If Applicable, Performance
Measures Contained in Your
Agency's Appropriation Bill
(or otherwise changed by the
Legislature)
+
Any FY 2019 or FY 2020 Changes
Made in Strategic Plan/Budget Performance
Measures and Jointly Approved by LBO and DFA
=
Common Base of Performance
Measures Used in Both Strategic Plan
and Budget Request (without
duplicates)

4
Submitting the 5-Year Strategic Plan:
Along with the paper copies listed below, please send a PDF copy of your 5-Year Strategic Plan and
performance measurement data to the Legislative Budget Office. Use your Agency’s Budget Name and
Number in both the name of the PDF document and in the subject line of your e-mail i.e.: “Division of
Medicaid 328-00”. If you are submitting a plan for multiple budget units, separate the numbers by spaces
i.e.: “Human Services 651-00 571-00 651-02 651-09 651-12 etc.” Send to: [email protected] .
Supporting Information:
All agency plans must be presented in the format provided and must contain every required element
included in these instructions. Any additional information that agencies wish to provide in support of
their strategic plans may be included at the end of the strategic plan document.
Document Requirements:
In order to make review of the Agency 5-Year Strategic Plans proceed easier, please use the following
uniform, standard form:
1. The plan should be prepared on letter-size paper (8 1/2" x 11")
2. Pages should be numbered at the bottom of the page.
3. The plan should be bound with a single staple located in the top left-hand corner.
4. The plan should follow the format set out in the following section.
5. Any additional information to support the Agency 5-Year Strategic Plan.
DUE DATE:
The Agency 5-Year Strategic Plan will be due July 16, 2018 with the following distribution:
10 copies to the Legislative Budget Office
2 copies to the Department of Finance and Administration Office of Budget and Fund
Management

5
Policy on Adding, Deleting or Changing Performance Measures:
Agency program names and Performance Measures (titles or descriptions) will be pre-loaded into
the OBRS system. Agencies will not be able to make changes on their own. These are based on the
FY 2019 budget submission and should include any changes made either by having submitted a
joint letter to LBO and DFA for approval or by the Legislature during the legislative session.
Agencies will still enter all data for each Performance Measure.
Important: If for any reason the Performance Measures contained in the Online Budget Request
System (OBRS) are not correct or current, please call your budget analyst to have changes made.
Except during the Legislative Session, all requests for additions, deletions or other changes in an existing
Performance Measure will need to be jointly approved by both the Legislative Budget Office (LBO) and
the Department of Finance and Administration (DFA). See Mississippi Code § 27-103-129 (1). This
does not include any additions, deletions or changes already made by the Legislature or corrections made
to the Performance Measures pre-loaded into the OBRS system as mentioned above.
If you wish to add, delete or change a Performance Measure description (not the data), please use the
following procedure:
1. Send a joint e-mail to:
a. Your LBO Budget Analyst
b. Your DFA, Budget and Fund Management Analyst
2. In that memo,
a. For an addition, list the new measure you want to be considered.
b. For a deletion, list the measure you want to be considered for deletion.
c. For a change in an existing measure, state the change you want to be considered.
3. In all of the above cases, provide a detailed justification on which your request can be evaluated.
When both offices give their approvals by way of return e-mail, you may then make the changes.
Content of the Strategic Plan:
At a minimum, a state agency’s strategic plan should contain the following:
1. Comprehensive Mission Statement for the Agency
o Statement of Purpose
2. Statement of Agency Philosophy
o Values and Principles

6
3. Relevant Statewide Goals and Benchmarks
o The adoption of applicable statewide strategic plan performance priorities
4. Overview of the Agency 5-Year Strategic Plan
o A narrative overview which sets out the planned direction of the agency for the next five
years
5. External/Internal Assessment & Internal Management Systems
5.1 External/Internal Assessment
o Factors to be considered that have an impact on the accomplishment of agency goals
5.2 Internal Management Systems
o Agency's internal management system utilized to evaluate performance achievements in
relationship to targeted performance levels
6. Agency Goals, Objectives, Strategies and Measures by Program (See Appendix III, P. 24)
6.1 Agency Program Goals
o A statement of purpose for each budgetary program
6.2 Program Goal Objectives
o Activity proposed to accomplish program goal
o Outcome measure(s) should be listed for each objective
6.3 Program Objective Strategies
o A statement of strategy of how the agency will achieve program objective
o Output, efficiency, and explanatory measures should be listed for each strategy

7
Note: Not all agencies have Performance Targets in their appropriation bill.
Reviewing or Modifying Your FY 2020 – 2024 Agency 5-Year Strategic Plan:
Before reviewing or modifying the Agency 5-Year Strategic Plan for FY 2020 – 2024, please refer to
Appendix III (P. 25), Summary of Structure which shows the structure of the Program information
including Goals, Objectives, Strategies, and Performance Measures. Make sure that the plan follows this
outline along with the numbering/lettering conventions for each element in this outline. Notice that each
Objective must have at least one Outcome. Next, review the definitions of the various Performance
Measures contained in Appendix I. Please make sure the measures have been categorized correctly and
are not using an Output in place of an Outcome under Objectives.
Required Format:
This format reflects the minimum level of information to be included in the 5-Year Strategic Plan. Each
agency is encouraged to include any additional information necessary to adequately inform the
Legislature of the purpose and proposed direction of the agency.
1. Comprehensive Mission Statement for the Agency
This identifies what the agency does. The mission is the reason for the agency's existence.
Agencies should refer to their enabling statute to clearly identify the functions for which they are
Strategic Planning and Performance Budgeting System
Strategic Plan Performance Measure Appropriation Bill
Mission
Philosophy
Relevant Statewide Goals
Overview Narrative
External/Internal Assessment
Agency Program Goals
Program Objectives Outcome Measure Performance Target
Program Strategies Output Measure Performance Target
Efficiency Measure Performance Target
Explanatory Measure
8
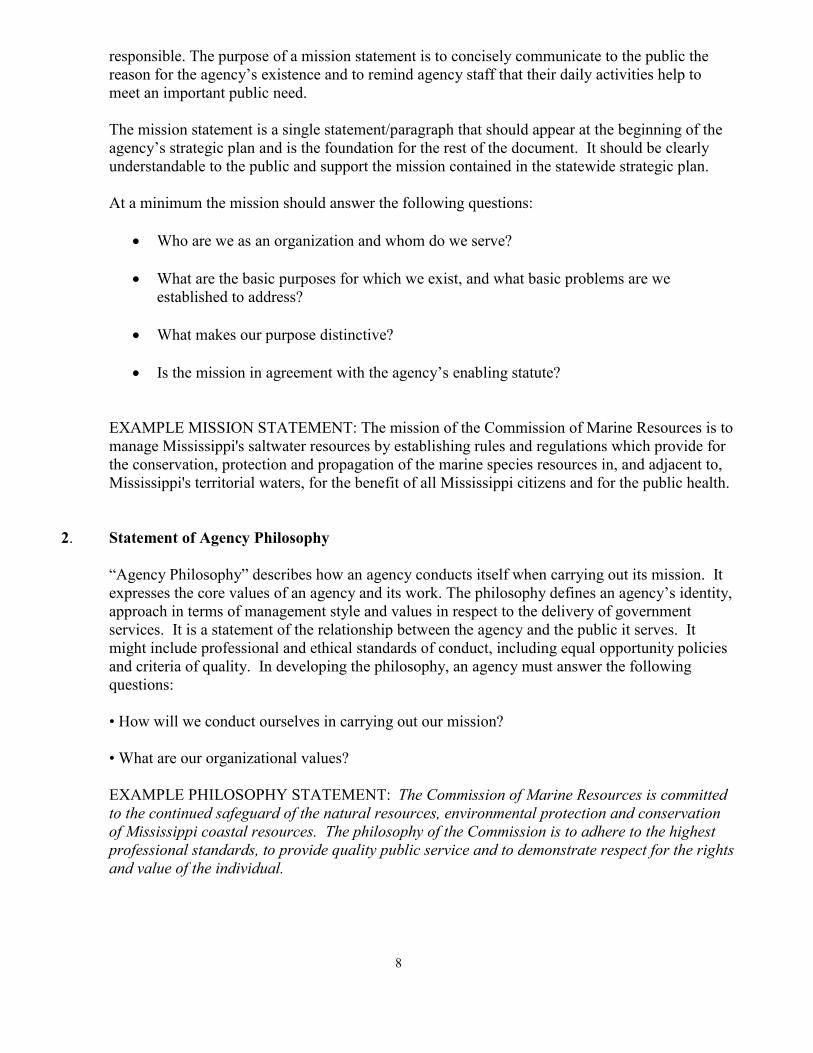
responsible. The purpose of a mission statement is to concisely communicate to the public the
reason for the agency’s existence and to remind agency staff that their daily activities help to
meet an important public need.
The mission statement is a single statement/paragraph that should appear at the beginning of the
agency’s strategic plan and is the foundation for the rest of the document. It should be clearly
understandable to the public and support the mission contained in the statewide strategic plan.
At a minimum the mission should answer the following questions:
• Who are we as an organization and whom do we serve?
• What are the basic purposes for which we exist, and what basic problems are we
established to address?
• What makes our purpose distinctive?
• Is the mission in agreement with the agency’s enabling statute?
EXAMPLE MISSION STATEMENT: The mission of the Commission of Marine Resources is to
manage Mississippi's saltwater resources by establishing rules and regulations which provide for
the conservation, protection and propagation of the marine species resources in, and adjacent to,
Mississippi's territorial waters, for the benefit of all Mississippi citizens and for the public health.
2. Statement of Agency Philosophy
“Agency Philosophy” describes how an agency conducts itself when carrying out its mission. It
expresses the core values of an agency and its work. The philosophy defines an agency’s identity,
approach in terms of management style and values in respect to the delivery of government
services. It is a statement of the relationship between the agency and the public it serves. It
might include professional and ethical standards of conduct, including equal opportunity policies
and criteria of quality. In developing the philosophy, an agency must answer the following
questions:
• How will we conduct ourselves in carrying out our mission?
• What are our organizational values?
EXAMPLE PHILOSOPHY STATEMENT: The Commission of Marine Resources is committed
to the continued safeguard of the natural resources, environmental protection and conservation
of Mississippi coastal resources. The philosophy of the Commission is to adhere to the highest
professional standards, to provide quality public service and to demonstrate respect for the rights
and value of the individual.

9
3. Relevant Statewide Goals and Benchmarks
The statewide goals and benchmarks are the origin for developing all other performance activities
proposed by a state agency. They are a declaration of what Mississippi’s leadership envisions to
accomplish with the resources provided to Mississippi state government.
There are eight Key Policy Areas contained in the Statewide Strategic Plan for Performance and
Budgetary Success (see attachment Appendix V):
• Economic Development
• Education
o Public Schools
o Higher Education
• Public Safety and Order
• Health
• Human Services
• Natural Resources
• Infrastructure
• Government and Citizens
The Statewide goals and benchmarks are the origin for developing all other performance activities
proposed by a state agency. They are a declaration of what Mississippi’s leadership envisions to
accomplish with the resources provided to Mississippi state government. Each agency is asked to
adopt Statewide Goals and Benchmarks that are relevant to the agency’s Mission and Goals.
Included with these policy areas are a listing of priority goals and benchmarks (a mixture of
various types of Performance Measures and goals). Decide which of the listed statewide priority
goals and benchmarks are relevant to your state Agency 5-Year Strategic Plan.
State agencies may have multiple key policy areas and many may include more than one key
policy goal or benchmark. Perhaps your agency can directly adopt these performance measures
and incorporate these measures with your agency’s own goals, objectives and strategies. Or, for
example, cannot provide the necessary data, and only include them indirectly by simply adopting
them as related measures in the Statewide Strategic Plan portion of your own agency’s strategic
plan.
In the process of selecting your relevant Statewide Goals and Benchmarks, your agency may:
A. have exact goals and benchmarks (Performance Measures) listed in the Statewide Plan. Use
them also as Agency Performance Measures exactly as listed. These would be agency
specific such as “Tuberculosis case rate per 100,000 per year” in the Health Key Policy Area
section of the Statewide Plan, or “Average ACT score of entering freshmen” in the Education:
Higher Education section.
10
B. have goals and benchmarks (Performance Measures) close to those listed in the Statewide
Plan. In this case select performance measures from the Statewide Strategic Plan that the
agency can support and are close to the agency’s mission.
C. not have a very close relationship with any of the goals and benchmarks listed. In this case
select broad category goals and benchmarks such as “Economic Development” or “Public
Safety”, or the goals and benchmarks under the “Government and Citizens” section.
Note: The term “Statewide Goals” always refers to goals contained in the Statewide Strategic
Plan, Building a Better Mississippi, The Statewide Strategic Plan for Performance and Budgetary
Success. It does not mean your agency’s statewide goals. It is just assumed that if your agency
provides services “statewide”, then these are referred to as your agency’s “goals”.
Example Statewide Goal #1: To develop a robust state economy that provides the opportunity for
productive employment for all Mississippians
Example Statewide Benchmarks #1:
• Percentage contribution of agriculture, forestry, fishing, and hunting sector to state’s gross
domestic product
• Number of jobs in agriculture, forestry, fishing, and hunting sector
Example Statewide Goal #2: To ensure that current and future generations have access to the
state’s abundant natural resources through protection, conservation, and wise development of
those resources
Example Statewide Benchmarks #2:
• Estimates of populations of invasive species, by species
• Measures of condition of the state’s marine species
• Percentage of oyster production acreage that is limited due to pollution
• Total square miles of ocean and tidal streams (total and as a percentage of total assessed)
under a fish consumption advisory during the year
4. Overview of the Agency 5-Year Strategic Plan
Each agency will provide a narrative overview which sets out the planned direction of the agency
for the next five years. This overview should include, but not be limited to, a statement of desired
agency goals, objectives and strategies for attaining these goals for the 5-year period. The
narrative should take a “big picture” approach in its description and may reflect agency priorities
and funding issues. Agencies should include any information that will provide a better
understanding of where the agency is headed and how the agency plans to get there.
11
5. External/Internal Assessment
Factors to be considered that have an impact on the accomplishment of agency goals and internal
management systems used to evaluate agency’s performance
5.1 Each agency will identify external/internal factors which influence its ability to achieve its
targeted performance goals. An assessment of these external/internal factors will enable the
agency to plan for opportunities and challenges presented by forces beyond the control of the
agency. These external/internal factors might include, but are not limited to: redirection of
agency mission due to a change in state statutes or regulations, changes in the economy, changes
in availability of federal funding, a change in statutes or regulations, changes in technology,
pending litigation, environmental impact, changes in the make-up of population served by the
agency, management policies in place, operational procedures, tracking procedures,
organizational structure and any other information. While the availability of state funding is a
consideration, in this process it will be more meaningful to identify those external/internal factors
which are not directly influenced by financial resources provided by the appropriation process.
Include discussion of any independent audits or reports that your agency completes regarding
your performance goals that are reported to outside agencies, including federal grant reporting or
contracts. This will allow the reporting of the agency’s complete external/internal assessments to
the Legislature.
➢ The identity of external/internal factors is an ongoing process that is important to the
development of each element of an agency’s strategic plan.
(See Agency Example)
5.2 Internal Management Systems Used to Evaluate Agency’s Performance
Provide a description of the agency's internal management system utilized to evaluate
performance achievements in relationship to targeted performance levels.
Each agency will identify internal management systems used to evaluate its performance. This
description of the agency's internal management system will need to include:
1. Management policies in place
2. Operational procedures, tracking procedures
3. Organizational structure
4. Any other information which will aid the Legislature in understanding how the agency
evaluates its performance and how this evaluation impacts the budgeting of funds. This
requirement has not changed from prior years. Include this in the External/Internal Assessment
section of your plan.

12
6. Agency Goals, Objectives, Strategies and Measures by Program (See Appendix III, P. 25)
Each agency is asked to reflect their agency’s goals and strategies in their own strategic plan to
accomplish the vision as outlined in the Statewide Strategic Plan.
6.1 Agency Goals by Program
Agency Goals are the general ends toward which agencies direct their efforts. Each budgetary
program must have at least one goal. A goal addresses issues by stating policy intention. The
goal is expressed in a manner that allows a future assessment to be made of whether the goal was
or is being achieved. It is both qualitative and quantifiable, but is not quantified. In other words,
it can be measured but a goal does not do the measuring. Goals stretch and challenge an agency,
but they are realistic and achievable.
The agency will specify expected accomplishments (objectives) and actions (strategies) to
achieve those objectives. The goal element of the strategic plan is typically no more than two
sentences per goal and includes the statutory citation(s), or general authorization, that provide
authority for the goal (citing the Statewide Strategic Plan is sufficient if appropriate).
Example Goal:
Conserve and maintain marine resources and other natural wildlife and enhance the quality of
fishing and other recreational activities. (See Miss. Code Ann. § 49-15-304)
6.2 Objectives by Program for each Goal
Objectives are the clear targets for the specific action. Each Goal in a budgetary program will
have one or more Objectives. They mark quantifiable interim steps toward achieving an agency’s
long range mission and goals. Linked directly to agency goals, objectives are measurable
statements of intent. Outcome based performance measurement is important for measuring a
program’s objective (See the Performance Measurement Definitions Appendix for further
explanation). They emphasize the results of agency actions at the end of a specific time period.
(Usually assumed to be a one year period)
➢ The Mississippi Performance Budget and Strategic Planning Act of 1994, mandates that
performance objectives be provided for each program of the agency for each of the five
years covered by the plan
➢ Each Objective is accompanied by a specific measurable outcome performance
indicator(s)
• The objective is to be realistic and attainable
• Objectives are related to a goal in the order of their priority
Example Objective: Increase the ratio of marine wildlife law enforcement officers to the area of
protected coastal boundaries.
Example Performance Indicator (Measure): Outcome - The number of marine wildlife law
enforcement officers in relation to the total square acres guarded as protected coastal boundaries.
(See the Performance Measure Definitions, Appendix I for further explanation)

13
6.3 Strategies by Program for each Objective
Strategies are methods to achieve goals and objectives. Each Objective in a budgetary program
will have one or more Strategies. They are specific courses of action to be taken. Formulated
from goals and objectives, a strategy is the means for transforming inputs into outputs and,
ultimately, outcomes with the best use of resources. A strategy reflects budgetary and other
resources.
o Each Strategy is accompanied by a specific measurable performance measures(s)
o Strategies must be easily understood by the public
o They appear in the strategic plan under each objective in the order of their priority
o More than one strategy may be required to accomplish a stated objective
o Question whether the agency has the authority to pursue the stated strategy
o Question the anticipated costs of implementing a strategy
Example Strategy: Implement a program to encourage private partnerships to share the expense
of protecting coastal resources that will benefit both industry and public.
Example Performance Indicator (See the Performance Measurement Appendix for further
explanation):
(Output) Number of private partnerships
(Output) Total expense of protecting coastal resources
(Efficiency) Percentage of expense shared by private partnerships
6.4 Action Plans
Action Plans are detailed methods specifying how a strategy is to be implemented. The agency’s
action plans are input-oriented and will spell out who is responsible for the required tasks for each
strategy and when the tasks will be completed. They generally address a shorter time frame (two
years or less) for action than the strategic plan. Action plans include a description of each task,
the resource and fiscal requirements of each task, and an identification of the agency division (or
even personnel) responsible for implementation.
Action plans provide a basis for managing an agency’s day-to-day operations.
Often referred to as “operational plans” or “implementation plans,” action plans are
maintained by the agency and are not submitted in the strategic plan.
NOTE: A 5-Year Strategic Plan for an example agency has been included for your information. This
example is provided simply to assist in the development of a format of a 5-Year Strategic Plan. In
following the example provided, please do not allow the explanation of the agency's strategic plan to be
restricted in any way.

14
EXAMPLE AGENCY
5-YEAR STRATEGIC PLAN
FOR THE FISCAL YEARS 2020 – 2024

15
COMMISSION ON MARINE RESOURCES
(This is a fictitious strategic plan based upon fictitious agency information)
1. Comprehensive Mission Statement:
The mission of the Commission of Marine Resources is to manage Mississippi's saltwater resources by
establishing rules and regulations which provide for the conservation, protection and propagation of the
marine species resources in, and adjacent to, Mississippi's territorial waters, for the benefit of all
Mississippi citizens and for the public health.
2. Philosophy
The Commission of Marine Resources is committed to the continued safeguard of the natural resources,
environmental protection and conservation of Mississippi coastal resources. The philosophy of the
Commission is to adhere to the highest professional standards, quality of public service and the respect
for the rights and value of the individual.
3. Relevant Statewide Goals and Benchmarks
Statewide Goal #1.: To develop a robust state economy that provides the opportunity for
productive employment for all Mississippians.
Relevant Benchmarks #1.:
1) Percentage contribution of agriculture, forestry, fishing, and hunting sector to state’s gross
domestic product.
2) Number of jobs in agriculture, forestry, fishing, and hunting sector
Statewide Goal #2.: To ensure that current and future generations have access to the state’s
abundant natural resources through protection, conservation, and wise development of those
resources.
Relevant Benchmarks #2.:
1) Estimates of populations of invasive species, by species
2) Measures of condition of the state’s marine species
3) Percentage of oyster production acreage that is limited due to pollution
4) Total square miles of ocean and tidal streams (total and as a percentage of total assessed)
under a fish consumption advisory during the year
4. Overview of the Agency 5-Year Strategic Plan:
The Commission of Marine Resources has targeted two activity areas as priorities for the next five years.
The Commission plans to expand Marine Law Enforcement efforts in order to conserve Mississippi's
valuable marine resources and to expand the Marine Fisheries Management Program to safeguard public
health.

16
Over the next three years, the Commission plans to increase the number of Marine Law Enforcement
staff by twenty. These twenty additional enforcement officers will be used to combat violations of
seafood laws and therefore, insure continued protection of our marine resources. The Commission would
like to add ten of these officers during FY 2020 at a cost of $30,000 each (including support costs). Five
additional positions would be added during FY 2021, with the remaining five being added during FY
2022. It is estimated that the addition of these enforcement officers will generate a savings of $10
million to the seafood industry.
The Commission also plans to expand the Marine Fisheries Management Program in an effort to
effectively manage Mississippi's marine resources and to safeguard the public health. Due to recent
outbreaks of hepatitis in oyster beds of the Mississippi Gulf, and other possible health hazards related to
the seafood industry, the Commission plans to expand its sampling of seafood and to provide for
additional marine resource research and data collection. These additional efforts will require the hiring
of two research analysts at a cost of $50,000 (including support costs) during FY 2020 and the upgrade
of existing scientific equipment at a cost of $100,000 over a period of 4 years (FY 2021 - FY 2024). It is
estimated that this expansion will reduce the number of hepatitis cases due to contaminated seafood by
85%.
The Commission plans to enhance the saltwater licensing system during FY 2020 and FY 2021 by
upgrading existing computer equipment. These enhancements will provide a more economical method
of processing saltwater licenses to fishermen in a shorter time frame.
During FY 2024, the Commission will be losing a federal grant in the amount of $100,000 in the Marine
Fisheries Management Program. Plans are being made to absorb this loss of federal funds which are
utilized to track marine finfish and shellfish populations. Through the use of available technology,
populations will continue to be tracked with the same efficiency even though two staff positions will be
deleted.
5. Agency's External/Internal Assessment
1) Significant changes in the numbers of commercial fishermen would impact the need for projects
concerning the management/improvement of native marine species.
2) Changes in technology could be used to enhance quality of marine resource management.
3) Many projects are reliant upon federal funding for support.
4) Environmental changes due to weather or pollution could severely impact the goals of these
programs
Through a process of quarterly meetings, the Commission determines how well the needs of
Mississippians have been met. Management policies are in place to address deficiencies in the process.
Budgetary constraints are considered when new or expanded projects are requested. All documentation
has been automated in an effort to increase personnel productivity.
6. Agency Goals, Objectives, Strategies and Measures by Program for FY 2020 through
FY 2024: (example does not include all programs of the agency or required years)
17
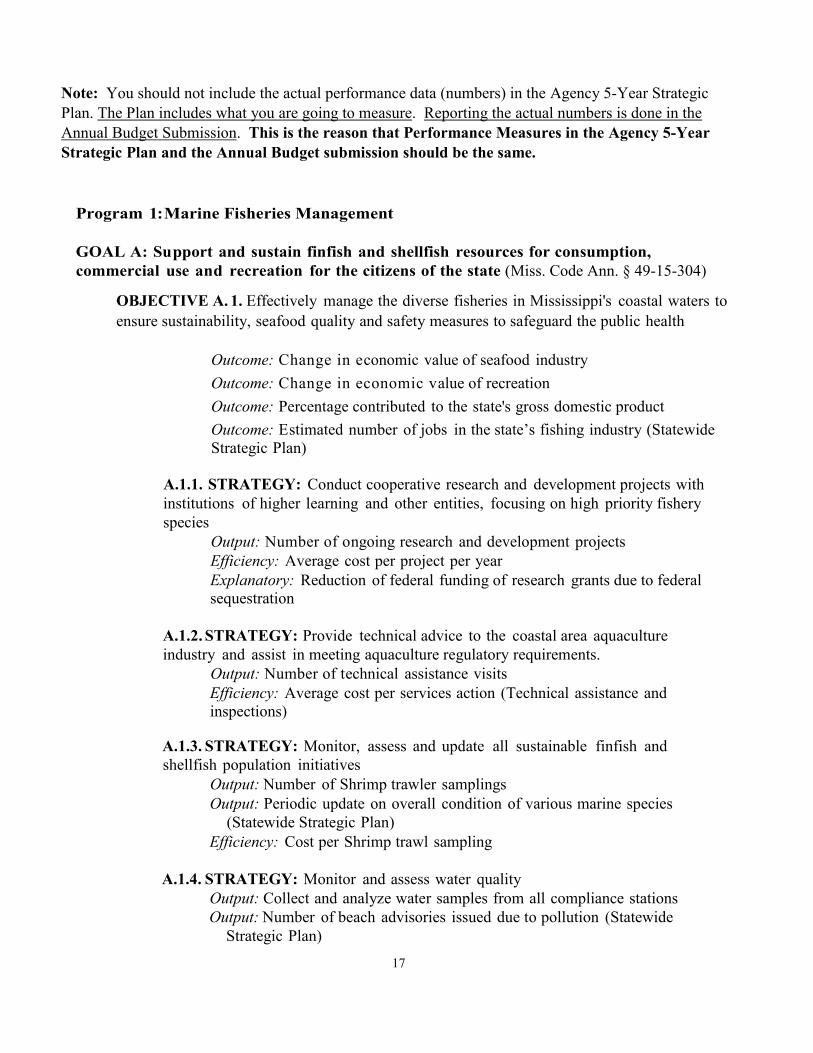
Note: You should not include the actual performance data (numbers) in the Agency 5-Year Strategic
Plan. The Plan includes what you are going to measure. Reporting the actual numbers is done in the
Annual Budget Submission. This is the reason that Performance Measures in the Agency 5-Year
Strategic Plan and the Annual Budget submission should be the same.
Program 1: Marine Fisheries Management
GOAL A: Support and sustain finfish and shellfish resources for consumption,
commercial use and recreation for the citizens of the state (Miss. Code Ann. § 49-15-304)
OBJECTIVE A. 1. Effectively manage the diverse fisheries in Mississippi's coastal waters to
ensure sustainability, seafood quality and safety measures to safeguard the public health
Outcome: Change in economic value of seafood industry
Outcome: Change in economic value of recreation
Outcome: Percentage contributed to the state's gross domestic product
Outcome: Estimated number of jobs in the state’s fishing industry (Statewide
Strategic Plan)
A.1.1. STRATEGY: Conduct cooperative research and development projects with
institutions of higher learning and other entities, focusing on high priority fishery
species
Output: Number of ongoing research and development projects
Efficiency: Average cost per project per year
Explanatory: Reduction of federal funding of research grants due to federal
sequestration
A.1.2. STRATEGY: Provide technical advice to the coastal area aquaculture
industry and assist in meeting aquaculture regulatory requirements.
Output: Number of technical assistance visits
Efficiency: Average cost per services action (Technical assistance and
inspections)
A.1.3. STRATEGY: Monitor, assess and update all sustainable finfish and
shellfish population initiatives
Output: Number of Shrimp trawler samplings
Output: Periodic update on overall condition of various marine species
(Statewide Strategic Plan)
Efficiency: Cost per Shrimp trawl sampling
A.1.4. STRATEGY: Monitor and assess water quality
Output: Collect and analyze water samples from all compliance stations
Output: Number of beach advisories issued due to pollution (Statewide
Strategic Plan)

18
Output: Number of oyster production acres limited due to pollution
(Statewide Strategic Plan)
Efficiency: Percentage of oyster production acreage limited due to pollution
(Statewide Strategic Plan)
Efficiency: Percentage of water samples within acceptable guidelines
Explanatory: Amount of inland precipitation and flooding
OBJECTIVE A.2. Rehabilitate, restore, cultivate and/or create shellfish habitat
Outcome: Rehabilitate, restore, cultivate and/or create shellfish habitat to
exceed pre-Katrina and BP Oil spill levels
A.2.1. STRATEGY: Restore and/or create oyster reefs
Output: Reefs restored
Output: Reefs created
Efficiency: Cost per reef restored
Efficiency: Cost per reef created
A.2.2. STRATEGY: Maintain long-term monitoring and assessment projects for
shellfish fisheries and regulatory mandates associated with managing these
resources Output: Number of on-going long-term monitoring and assessment projects Efficiency: Percent of program funds used for long term monitoring and
assessment projects
A.2.3. STRATEGY: Maintain or expand the Derelict Crab Trap program
Output: Number of derelict crab traps removed from ocean floor
Efficiency: Percent of recovered crab traps recycled and sold to the public
Explanatory: Decrease in the number of derelict traps left on the ocean floor
Program 2: Marine Law Enforcement
GOAL A: Operate and man a 24-hour patrol covering marine waters, shoreline and marshland
in Hancock, Harrison and Jackson Counties (Miss. Code Ann. § 49-15-21)
OBJECTIVE A.1. LAW ENFORCEMENT – Operate and staff two districts with a day shift
as well as a night shift providing all marine patrol services in Hancock, Harrison and Jackson
Outcome: Reduction in boating accidents and deaths per year
A.1.1. STRATEGY: Operate two sub-districts with two district managers (Captains)
during the day shift as well as a night shift, and a Lieutenant responsible for
each shift maintaining an average of 18 officers per sub-district
Output: Total number of calls from public answered
Output: Number of special marine events covered
Output: Boat and water safety classes held
Output: Total arrests

19
Output: Number of natural disasters covered
Efficiency: Cost per man hour of marine waters patrolled
Efficiency: Cost per boating & water safety class
Explanatory: Availability of staff due to unfunded positions
OBJECTIVE A.2.: SHELLFISH – Enforce rules and regulations regarding the harvest,
transportation and processing of both retail and wholesale shellfish
Outcome: Change in the number of reported incidences of foodborne illness due
to unsanitary or diseased oysters and other shellfish
A.2.1. STRATEGY: Man all open oyster check-in stations during harvest seasons Output: Total tons of oysters inspected Efficiency: Percent of harvest rejected Explanatory: Coliform bacteria rising past the federal standard of 35/100mL in
marine waters
20
Appendix I
Performance Measure Definitions
A. Program Output Measures – Outputs are the goods and services provided by an agency in
order to meet its goals and objectives. Output measures are the means of quantifying or
counting the amount of goods and services produced or provided by an agency. The number of
clients or people served, the number of items processed or produced or the number of units of a
particular service provided are used to identify program outputs. Output measures track the
agency’s performance in implementing its strategies.
When developing and selecting key output measures, the following questions should be
answered:
• Is the output measure reliable? Will it consistently measure the same thing and produce
accurate and verifiable information over a period of time? Will the data used in the measure
be available on a continuing basis?
• Is the output measure directly related to the agency’s strategies?
• Does the output measure show the quantity of work performed?
• Is the output measure clear? Are the terms used generally accepted and defined? Will the
measure be easily understood by those who are not familiar with the subject matter?
• Are any output measures already used in federal reporting applicable?
Examples of Program Output Measures:
• Public water systems surveyed and inspected (number of)
• Hunting and fishing licenses sold (number of)
• Paternities established (number of)
• Abuse and neglect investigations conducted (number of)
• Solid waste permits processed (number of)
• Elderly and disabled persons served (number of)
• Recipients enrolled in program (number of)
• Amount of state matching funds awarded (dollars)
• Heroin seized by law enforcement (pounds)
B. Program Efficiency Measures – Program efficiency measures are the ratios that identify the
effectiveness or productivity of a program. Program efficiency measures are expressed in a
quantifiable form and indicate an agency’s operational efficiency. Program Efficiency
measures are generally expressed in unit costs, units of time, or other ratio-based units
associated with producing a desired outcome or output.
The following questions should be addressed in developing program efficiency measures:
• Is the efficiency measure valid? Does it capture the information intended?
• Is the efficiency measure a useful or meaningful measure for the intended reader?

21
• Is the efficiency measure reliable? Will it produce accurate and verifiable information over a
period of time?
• Does it quantify significant efficiency aspects of agency operations?
• Will the data used to calculate the measure be available on a continuing basis?
• Is the measure responsive? Will it reflect changes in levels of performance?
• Does the measure produce relevant information that will justify the cost of collecting and
retaining the data?
• Are the terms used to describe the measure generally accepted and defined? Will those who
are unfamiliar with the subject be able to easily understand the measure?
Examples of Program Efficiency Measures:
• Average cost to inspect a public water system (Dollars)
• Average cost per hunting license to issue (Dollars)
• Time to issue hunting license by contracted vendor (Days)
• Frequency of each public water system inspection (Years Between Inspection)
• Average time to approve or deny air quality permits (Days)
• Average caseload per social worker in the foster care program (Cases per Worker)
• Cost to house inmate per day – maximum security (Dollars)
C. Program Outcome Measures – Program outcome measures are assessments of the result,
effect or consequence that will occur from carrying out a program or activity compared to its
intended purpose. They are tools to assess the effectiveness of an agency’s performance and the
public benefit derived from it. Outcomes are the results, or effects, of government action or
policy. Performance can be determined by comparing actual outcomes to targeted outcome
objectives of the agency. An outcome measure shows how the agency’s action will affect a
particular target group or issue area indicated in the objective.
Outputs and outcomes are not the same. Outputs reflect the quantity of services or goods
produced and outcomes reflect the result or impact of providing those services or goods. An
outcome measure must be directly related to the objective it is measuring; and there must be at
least one outcome measure for each objective. An outcome measure is typically expressed as a
percentage, rate, or ratio as long as it measures the overall result, effect or consequence of that
particular objective.
The differences between outcome measures and output measures are shown in the following
examples:
• The number of patients treated and discharged from a state mental hospital (output measure)
is not the same as the percentage of discharged patients who are capable of living
independently (outcome measure).
• The number of vaccinations given (output measure) is not an indicator of the incidence of the
disease in the population (outcome measure).
22
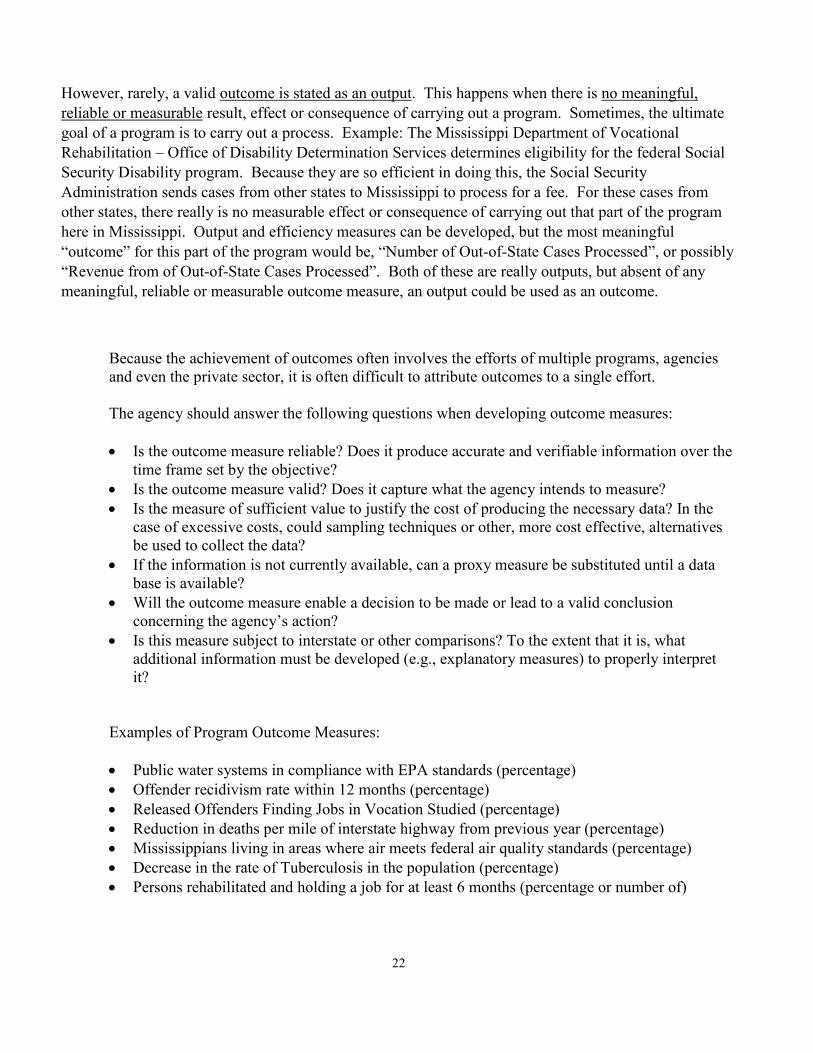
However, rarely, a valid outcome is stated as an output. This happens when there is no meaningful,
reliable or measurable result, effect or consequence of carrying out a program. Sometimes, the ultimate
goal of a program is to carry out a process. Example: The Mississippi Department of Vocational
Rehabilitation – Office of Disability Determination Services determines eligibility for the federal Social
Security Disability program. Because they are so efficient in doing this, the Social Security
Administration sends cases from other states to Mississippi to process for a fee. For these cases from
other states, there really is no measurable effect or consequence of carrying out that part of the program
here in Mississippi. Output and efficiency measures can be developed, but the most meaningful
“outcome” for this part of the program would be, “Number of Out-of-State Cases Processed”, or possibly
“Revenue from of Out-of-State Cases Processed”. Both of these are really outputs, but absent of any
meaningful, reliable or measurable outcome measure, an output could be used as an outcome.
Because the achievement of outcomes often involves the efforts of multiple programs, agencies
and even the private sector, it is often difficult to attribute outcomes to a single effort.
The agency should answer the following questions when developing outcome measures:
• Is the outcome measure reliable? Does it produce accurate and verifiable information over the
time frame set by the objective?
• Is the outcome measure valid? Does it capture what the agency intends to measure?
• Is the measure of sufficient value to justify the cost of producing the necessary data? In the
case of excessive costs, could sampling techniques or other, more cost effective, alternatives
be used to collect the data?
• If the information is not currently available, can a proxy measure be substituted until a data
base is available?
• Will the outcome measure enable a decision to be made or lead to a valid conclusion
concerning the agency’s action?
• Is this measure subject to interstate or other comparisons? To the extent that it is, what
additional information must be developed (e.g., explanatory measures) to properly interpret
it?
Examples of Program Outcome Measures:
• Public water systems in compliance with EPA standards (percentage)
• Offender recidivism rate within 12 months (percentage)
• Released Offenders Finding Jobs in Vocation Studied (percentage)
• Reduction in deaths per mile of interstate highway from previous year (percentage)
• Mississippians living in areas where air meets federal air quality standards (percentage)
• Decrease in the rate of Tuberculosis in the population (percentage)
• Persons rehabilitated and holding a job for at least 6 months (percentage or number of)

23
D. EXPLANATORY MEASURES - “Explanatory Measures” are quantitative indicators that
provide additional information that contributes to the understanding of an agency’s operating
environment. Whereas agency external/internal assessments contain narrative explanatory
information, explanatory measures are specific quantitative indicators that can help users
understand other reported measures, assess the entity’s performance, and evaluate the
significance of underlying factors that may have affected the reported performance, including
the unintended effects of a service. Input measures are a subset of explanatory measures.
There are two primary types of quantitative explanatory information that can be reported as
explanatory measures. These include (1.) factors substantially outside the control of the agency,
such as environmental and demographic characteristics, (2.) factors over which the agency has
some control, such as caseloads. The agency should answer following questions when
developing explanatory measures:
• Is the measure valid? Does it capture the information intended? Does it quantify significant
external/internal aspects of agency operations?
• Is the explanatory measure reliable? Will it produce accurate and verifiable information over a
period of time? Will the data used to calculate the measure be available on a continuing basis?
• Does the measure produce information that will justify the cost of collecting and retaining it?
• Is the measure clear? Are the terms used to describe the measure generally accepted and
defined? Will those who are unfamiliar with the subject be able to understand the measure?
The following are explanatory measures for a hypothetical agency:
• Number of Complaints Received by the Agency
• Reduction in federal funding (dollars)
• Costs of implementing federal mandates (dollars)
• Number of severe storms
• Number of increased non-state sources for a service
• Increase percentage in the state unemployment rate
• Increase in caseload due to immigration
24
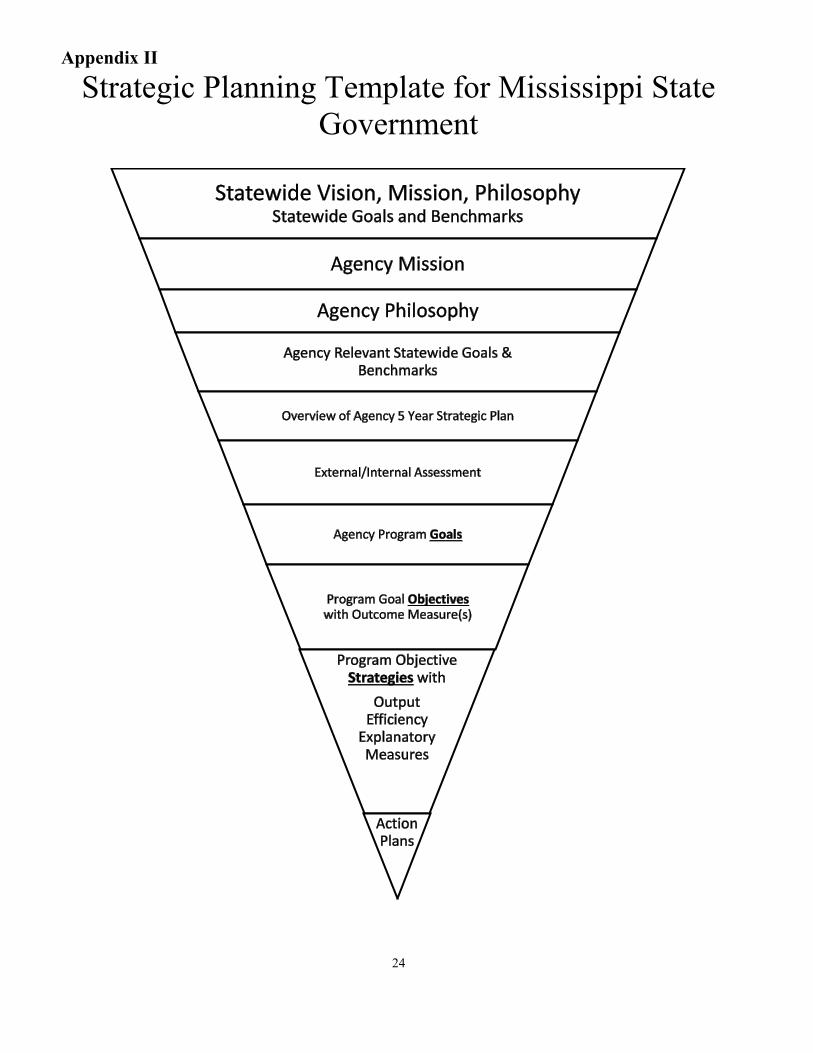
Appendix II
Strategic Planning Template for Mississippi State
Government

25
Appendix III
SUMMARY OF STRUCTURE: PROGRAM 1. GOAL A:
OBJECTIVE A.1.:
Outcome:
A.1.1. STRATEGY:
Output:
Efficiency:
Explanatory:
A.1.2. STRATEGY:
Output:
Efficiency:
Explanatory:
A.1.3. STRATEGY:
Efficiency:
Explanatory:
Output:
OBJECTIVE A.2.:
Outcome:
A.2.1. STRATEGY:
Output:
Efficiency:
Explanatory:
A.2.2. STRATEGY:
Output:
Efficiency:
Explanatory:
A.2.3. STRATEGY:
Output:
Efficiency:
Explanatory:
GOAL B: Repeat as above.
PROGRAM 2. Repeat as above.
26
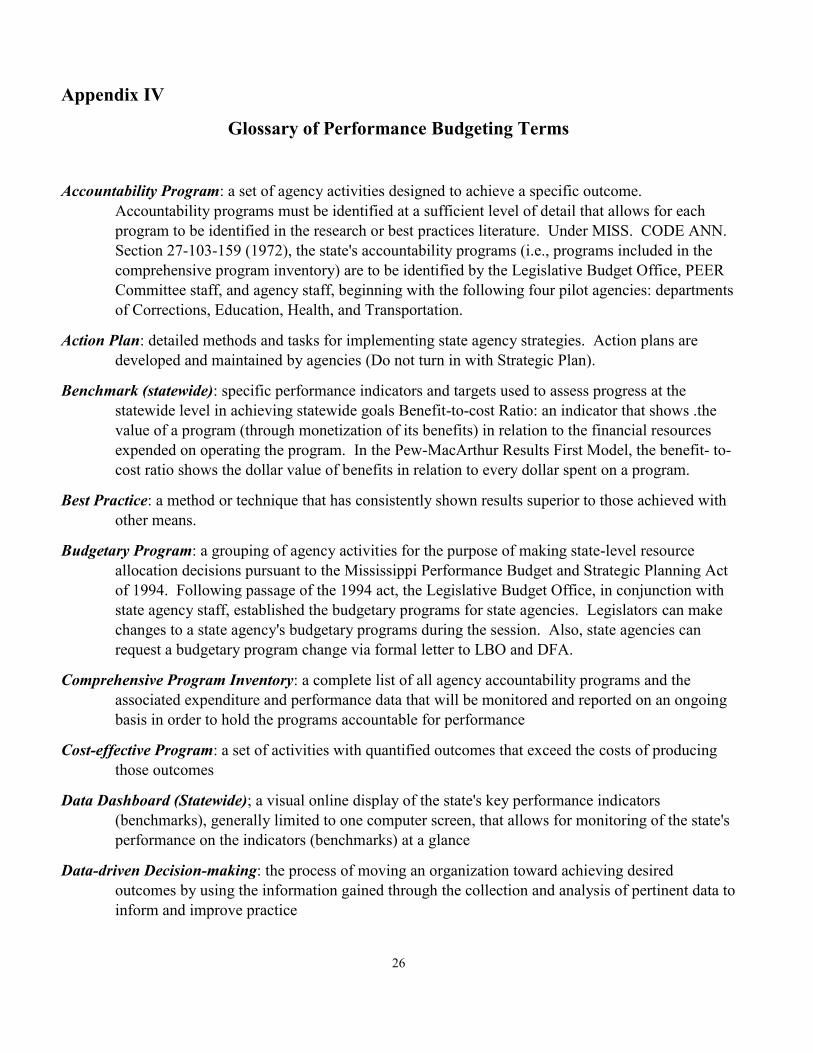
Appendix IV
Glossary of Performance Budgeting Terms
Accountability Program: a set of agency activities designed to achieve a specific outcome.
Accountability programs must be identified at a sufficient level of detail that allows for each
program to be identified in the research or best practices literature. Under MISS. CODE ANN.
Section 27-103-159 (1972), the state's accountability programs (i.e., programs included in the
comprehensive program inventory) are to be identified by the Legislative Budget Office, PEER
Committee staff, and agency staff, beginning with the following four pilot agencies: departments
of Corrections, Education, Health, and Transportation.
Action Plan: detailed methods and tasks for implementing state agency strategies. Action plans are
developed and maintained by agencies (Do not turn in with Strategic Plan).
Benchmark (statewide): specific performance indicators and targets used to assess progress at the
statewide level in achieving statewide goals Benefit-to-cost Ratio: an indicator that shows .the
value of a program (through monetization of its benefits) in relation to the financial resources
expended on operating the program. In the Pew-MacArthur Results First Model, the benefit- to-
cost ratio shows the dollar value of benefits in relation to every dollar spent on a program.
Best Practice: a method or technique that has consistently shown results superior to those achieved with
other means.
Budgetary Program: a grouping of agency activities for the purpose of making state-level resource
allocation decisions pursuant to the Mississippi Performance Budget and Strategic Planning Act
of 1994. Following passage of the 1994 act, the Legislative Budget Office, in conjunction with
state agency staff, established the budgetary programs for state agencies. Legislators can make
changes to a state agency's budgetary programs during the session. Also, state agencies can
request a budgetary program change via formal letter to LBO and DFA.
Comprehensive Program Inventory: a complete list of all agency accountability programs and the
associated expenditure and performance data that will be monitored and reported on an ongoing
basis in order to hold the programs accountable for performance
Cost-effective Program: a set of activities with quantified outcomes that exceed the costs of producing
those outcomes
Data Dashboard (Statewide); a visual online display of the state's key performance indicators
(benchmarks), generally limited to one computer screen, that allows for monitoring of the state's
performance on the indicators (benchmarks) at a glance
Data-driven Decision-making: the process of moving an organization toward achieving desired
outcomes by using the information gained through the collection and analysis of pertinent data to
inform and improve practice

27
Economy Measure: indicators that quantify an agency's cost, unit cost, or productivity associated with a
given outcome
Efficiency Measure: indicators that quantify an agency's cost, unit cost, or productivity associated with a
given output
Evidence-based program: a program or practice that has had multiple-site random controlled trials or
quasi-experimental comparison across heterogeneous populations demonstrating that the
program or practice is effective for the population
Explanatory Measures: quantitative indicators that provide additional information that contributes to the
understanding of an agency's operating environment and performance--e. g., data showing a
large increase in an agency's caseload
External/Internal Assessment: an evaluation of key factors that influence the agency and its
performance--e. g., organizational strengths, weaknesses, opportunities, and threats. Examples
of external factors include statutory changes and economic conditions. Examples of internal
factors include management policies and resource constraints.
Fidelity Audit: a comparison of the implementation of an intervention program to the key components
necessary to achieve the outcomes reported in the research literature
Goal:
- Statewide Goals: general ends toward which the state directs its efforts
- Agency Goals: general ends toward which agencies direct their efforts
Input: measure of the resources, both financial and human, committed to a program
Intervention Program: a set of activities designed to achieve a specific outcome or outcomes by
positively affecting the educational, economic, social, behavioral, and/or health status of citizens
and that may be subjected to experimental review for efficacy
Line-item Budgeting: a system of allocating resources to state budget units by major object of
expenditure--e. g., salaries and fringe benefits, travel, contractual services
Mission:
- Statewide Mission: a concise statement of the basic purpose and role of state government
- Agency Mission: the reason for an agency's existence
Net Present Value of Long-term Benefits minus Costs; the dollar value of program benefits minus costs
over the long-term, expressed in current dollars--i.e., adjusted for changes to the purchase value
of a dollar over time
Objective: target for specific action, stated in measurable terms, including a target date for
accomplishment
Outcome: performance measure that quantifies the providing a government good or service result, effect,
or consequence of providing a government good or service

28
Output: performance measure that quantifies the activities that an agency carries out and the goods and
services that it produces in order to meet its goals and objectives
Performance Budgeting: a method of allocating resources to programs based on consideration of how
efficiently and effectively each program can achieve desired results with the requested resources
Performance-based Management: a systematic approach to performance improvement through an
ongoing process of establishing performance objectives; measuring performance; collecting,
analyzing, and reporting performance data; and using that data to drive performance
improvement.
Performance-based Contracting: a results-oriented method of procuring services that specifies in the
legally binding agreement for services the outputs, quality, and/or outcomes to be achieved by
the service provider. At least a portion of the contractor's payment, contract extensions, or
contract renewals may be tied to the achievement of specific, measurable performance standards
and requirements.
Pew-MacArthur Results First Initiative: A project of the Pew Charitable Trusts and the John D. and
Catherine T. MacArthur Foundation that works with states to implement an innovative cost-
benefit analysis approach that helps them to invest in policies and programs that are proven to
work
Pew-MacArthur Results First Cost-Benefit Analysis Model: an econometric model that helps states to
calculate the benefit-to-cost ratio and net present value of long- term benefits of public sector
programs and policies
Pew-MacArthur Results First Approach: a disciplined practice designed to move public resources to
programs and policies proven to work through evidence-based research.
Philosophy:
- Statewide Philosophy: a statement of the core values and principles underlying state
government service+
- Agency Philosophy: the expression of the core values and principles for the conduct of an
agency in carrying out its mission
Program Premise: the theory that underpins a government's decision to intervene with its authority and
resources to contend with a problem that the free market alone could not correct.
Promising Practice: a program or practice that presents potential, based upon preliminary information,
for becoming a research-based or evidence-based program or practice
Research-based Program: a program or practice that has some research demonstrating effectiveness, but
that does not yet meet the standard of evidence-based practices
Return on Investment: dollar value of program benefits generated by each dollar invested in the
operation of the program
Scorecard: a tabular visualization of performance measures and their respective targets with visual
indicators to see how each measure is performing against its target at a glance

29
Statewide Strategic Plan: a blueprint for the activities of state government created through the alignment
of state agency goals, objectives, outcome measures, strategies, output measures, efficiency
measures, explanatory measures, and action plans with the priorities of government (i.e., state
government's vision, mission, philosophy, goals, and benchmarks) identified by leadership. A
statewide strategic plan seeks to improve the efficiency and effectiveness of state government by
coordinating the efforts of state agency programs and activities toward achieving priority
outcomes.
Strategy: method for achieving goals and objectives
Vision: an inspiring view of the preferred future

30
Appendix V
Building a Better Mississippi The Statewide Strategic Plan for Performance and Budgetary Success
July 2014
31
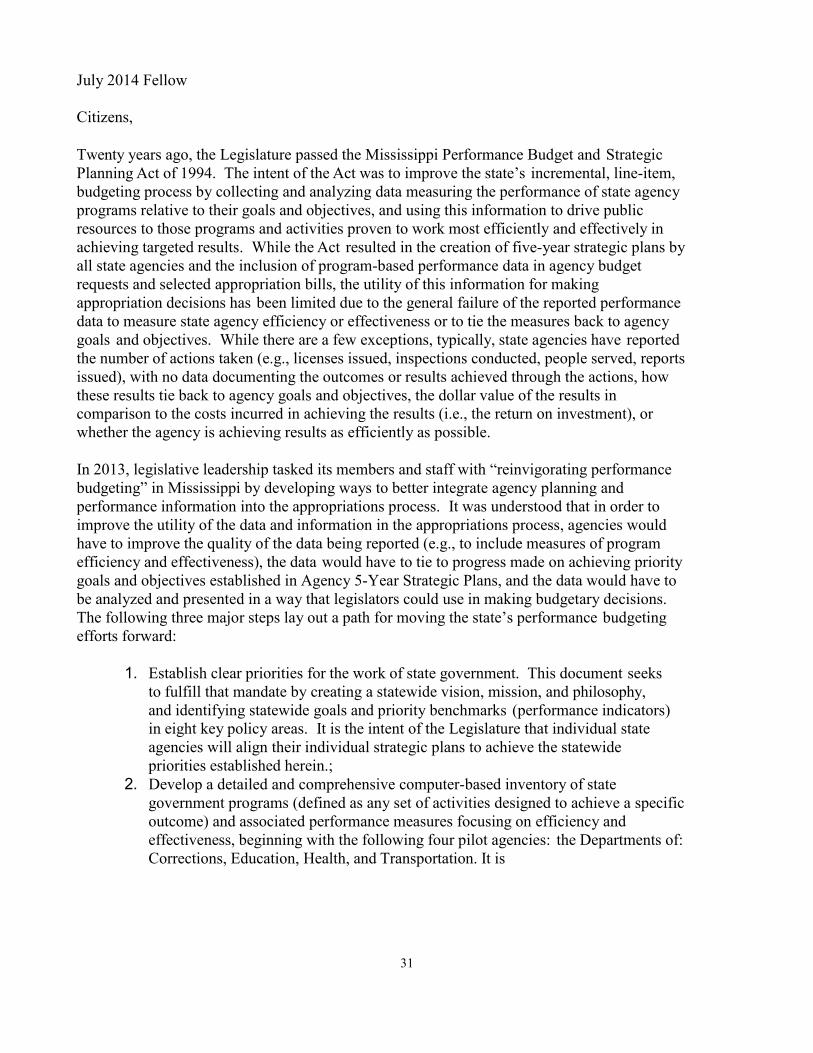
July 2014 Fellow
Citizens,
Twenty years ago, the Legislature passed the Mississippi Performance Budget and Strategic
Planning Act of 1994. The intent of the Act was to improve the state’s incremental, line-item,
budgeting process by collecting and analyzing data measuring the performance of state agency
programs relative to their goals and objectives, and using this information to drive public
resources to those programs and activities proven to work most efficiently and effectively in
achieving targeted results. While the Act resulted in the creation of five-year strategic plans by
all state agencies and the inclusion of program-based performance data in agency budget
requests and selected appropriation bills, the utility of this information for making
appropriation decisions has been limited due to the general failure of the reported performance
data to measure state agency efficiency or effectiveness or to tie the measures back to agency
goals and objectives. While there are a few exceptions, typically, state agencies have reported
the number of actions taken (e.g., licenses issued, inspections conducted, people served, reports
issued), with no data documenting the outcomes or results achieved through the actions, how
these results tie back to agency goals and objectives, the dollar value of the results in
comparison to the costs incurred in achieving the results (i.e., the return on investment), or
whether the agency is achieving results as efficiently as possible.
In 2013, legislative leadership tasked its members and staff with “reinvigorating performance
budgeting” in Mississippi by developing ways to better integrate agency planning and
performance information into the appropriations process. It was understood that in order to
improve the utility of the data and information in the appropriations process, agencies would
have to improve the quality of the data being reported (e.g., to include measures of program
efficiency and effectiveness), the data would have to tie to progress made on achieving priority
goals and objectives established in Agency 5-Year Strategic Plans, and the data would have to
be analyzed and presented in a way that legislators could use in making budgetary decisions.
The following three major steps lay out a path for moving the state’s performance budgeting
efforts forward:
1. Establish clear priorities for the work of state government. This document seeks
to fulfill that mandate by creating a statewide vision, mission, and philosophy,
and identifying statewide goals and priority benchmarks (performance indicators)
in eight key policy areas. It is the intent of the Legislature that individual state
agencies will align their individual strategic plans to achieve the statewide
priorities established herein.;
2. Develop a detailed and comprehensive computer-based inventory of state
government programs (defined as any set of activities designed to achieve a specific
outcome) and associated performance measures focusing on efficiency and
effectiveness, beginning with the following four pilot agencies: the Departments of:
Corrections, Education, Health, and Transportation. It is
32
the intent of the Legislature that all publicly funded activities, including
administrative activities, would be held accountable for achieving results as
efficiently as possible, regardless of the funding source, and regardless of whether
the program is carried out by full-time public employees or through a government
contract.;
3. Implement the Pew-MacArthur Results First Initiative to identify state government
programs that are proven, through evidence-based research, to work to achieve
desired results and to rank the programs according to their benefit to cost ratio (i.e.,
return on investment). The Initiative is still in its early stages of implementation,
with only the criminal justice economic model for calculating the benefit to cost
ratios of evidence-based programs complete and the education component currently
in development (evidence- based programs identified, but economic model not yet
complete). The Initiative’s goal is to develop inventories of evidence-based
programs and economic models for calculating the benefit to cost ratios of these
programs in all major policy areas of state government.
Legislative leadership has committed to providing the staff resources necessary to compile,
vet, analyze, and present this performance data and information in a format that will be useful
to legislators in making appropriation decisions. It is the intent of the Legislature that state
agencies, to the extent possible, will align their individual strategic plans with the statewide
priorities identified by the Legislature and that state agency management decisions and
appropriation decisions will be driven by these priorities.
The strategic planning and performance information obtained through these efforts will enable
the Legislature, as well as state agency personnel, to:
• monitor state agency human and financial resources committed to and progress
achieved on priority statewide goals and benchmarks;
• eliminate or improve the effectiveness of programs that are not working;
• shift state resources from programs that are not working to programs that do work
as identified through evidence-based research; and,
• move state government towards more efficient operations, both within individual state
agencies and from a state government-wide perspective by exploring opportunities
for shared services.
This document is a testimony to our commitment to move this great state forward by holding
state government accountable for maximizing the results that it achieves with your taxpayer
dollars. While our challenges are great, our strength and resolve to meet them is greater. By
using performance data to drive our state agency management and budgeting decisions, we
can and will build a better Mississippi.
Tate Reeves, Lieutenant Governor
Philip Gunn, Speaker
Terry Brown, President Pro Tempore

33
Greg Snowden, Speaker Pro Tempore
Eugene S. (Buck) Clarke, Chairman of Senate Appropriations Herb
Frierson, Chairman of House Appropriations
With special assistance from: Senator
Terry C. Burton Representative Toby
Barker

34
The Vision of Mississippi State Government
The Legislature envisions a lean and effective Mississippi state government that empowers its people
to live healthy, productive lives through the provision of quality, appropriate services and strategic
investment in the state’s human capital. Through this empowerment, our state’s citizens will
experience a better quality of life than the generation before them and will leave their individual
communities better for the generation that follows.
The Mission of Mississippi State Government
In general terms, the primary role of state government is to:
• protect the safety and well-being of its citizenry;
• preserve the dignity of every human life; and,
• promote economic growth and the public good through the advancement of the
individual.
The 10th Amendment to the United States Constitution reinforces the sovereign powers of the states
by providing that:
“the powers not delegated to the United States by the Constitution, nor prohibited by it to the States, are reserved to the States respectively, or to the people.”
In drafting this amendment, the framers of the Constitution recognized that when state and local
communities take the lead on public policy, the people are that much closer to the policymakers,
which makes the policymakers that much more accountable to the people.
The Philosophy of Mississippi State Government
The State of Mississippi provides quality and appropriate services to its citizenry guided by the
principles of:
• Preserving the liberty of all citizens by providing the least intrusive state government;
• Practicing accountability and transparency at every level of government; and,
• Placing ultimate value on efficiency and effectiveness of government service to
taxpayers and citizens.

35
Key Policy Areas
• Economic Development
• Education:
• Public Schools
• Higher Education
• Public Safety and Order
• Health
• Human Services
• Natural Resources
• Infrastructure
• Government and Citizens

28
ECONOMIC DEVELOPMENT
STATEWIDE GOAL
To develop a robust state economy that provides the opportunity for productive employment for all
Mississippians
BENCHMARKS
BUSINESS CLIMATE
• State business tax climate (comparison of more than 100 variables across five major areas of
taxation: business taxes, individual income taxes, sales taxes, unemployment insurance rates
and property taxes)
• Energy price per million British thermal units (BTUs): commercial sector
• Energy price per million British thermal units (BTUs): industrial sector
• Annual percentage change in resident population
COMMERCIAL ACTIVITY
• Per capita gross domestic product
• Percentage contribution of manufacturing sector to state’s gross domestic product
• Percentage contribution of agriculture, forestry, fishing, and hunting sector to state’s gross
domestic product
• Volume of cargo activity at the state’s ports, measured in twenty-foot equivalent units
(TEUs) and tonnage
• Number of passengers enplaning and deplaning at the state’s airports
• Number and frequency of passenger and cargo flights
• Tourism measured in number of visitors and dollars generated
• Number of new technology start-ups
• Venture capital investments measured in dollars and number of deals
JOB GROWTH
• Net job growth
• Annual percentage change in non-farm jobs
• Number of jobs in each of the Mississippi Development Authority’s seven targeted
industries: advanced manufacturing, aerospace, agribusiness, automotive, energy,
healthcare, and shipbuilding
• Number of jobs in manufacturing sector
• Number of jobs in agriculture, forestry, fishing, and hunting sector
• Number of jobs associated with new technology start-ups
• Number of new businesses and jobs resulting from Mississippi Development Authority global
business contacts (national recruitment, international investment and trade)
29
• Number of new businesses and jobs resulting from Mississippi Development Authority
minority and small business development contacts
EMPLOYMENT AND INCOME
• Percentage of the civilian non-institutional population 16 years and over employed
• Percentage of Mississippians receiving workforce training services who are employed one
year and five years after receiving training and their average salary
• Job vacancy rate, by industry and occupation
• Unemployment rate (unemployed persons actively looking for a job as a percentage of the size
of the labor force: the sum of employed and unemployed persons)
• Wage and salary disbursements (total earnings)
• Average annual pay
• Median household income
• Average pay and total payroll of jobs associated with new technology start-ups
• Percentage of workers whose family income falls above 150% of the federal poverty
guidelines

30
EDUCATION: PUBLIC SCHOOLS
STATEWIDE GOAL
To make available a quality K-12 public education for all Mississippians that prepares them, upon high
school graduation, to either enter the labor force with an employable skill or to successfully complete a
higher education program
BENCHMARKS
SPECIAL EDUCATION
• Number and percentage of special education students taking assessment tests, by test and grade
level
• Breakdown of the performance of special education students on assessment tests, by grade level,
test, achievement level on the test (number and percentage of students scoring at each
achievement level), and scaled score range for each achievement level
• Number and percentage of special education students who are alternately assessed, by test and
grade level
• Breakdown of the performance of special education students who are alternately assessed by
grade level, test, achievement level on the test (number and percentage of students scoring at
each achievement level), and scaled score range for each achievement level
• Number and percentage of special education students graduating from high school with a
standard diploma
CAREER AND TECHNICAL EDUCATION
• Percentage of high school students enrolled in a career and technical education program
• Percentage of high school students enrolled in career and technical education programs who earn
an approved Industry Certification, by career pathway
• Percentage of students earning an approved Industry Certification who obtain a job in
Mississippi in their area of certification
• Average starting salary of students earning an approved Industry Certification who obtain a job in
Mississippi in their area of certification
BASIC EDUCATION
Student Readiness
• Breakdown of the performance of children entering public school kindergarten on the
Kindergarten Readiness Test by achievement level on the test (number and percentage of
children scoring at each achievement level) and scaled score range for each achievement level
• Breakdown of the performance of students entering the first grade on a valid and reliable testing
instrument by achievement level on the test (number and percentage of students scoring at each
achievement level) and scaled score range for each achievement level
• Percentage of students at risk for academic failure as evidenced by the percentage of students,
31
by grade level, in grades 3 through 8 who score below the cutoff score for Basic achievement
on assessment tests, by test and scaled cutoff score
• Percentage of students at risk for academic failure as evidenced by the percentage of students,
by grade level, in grades 9 through 12 who fail subject area tests, by test and scaled cutoff score
for failure
• Number and percentage of students enrolled in remedial instructional programs, by grade
level and course
• Public high school dropout rate, by student cohort
Student Academic Achievement
• Percentage of public school students exiting the 3rd grade scoring proficient or above in reading
on the statewide assessment test, by achievement level and scaled score range for each achievement
level
• Breakdown of the performance of students on assessment tests (including subject area tests), by
grade level, test, achievement level on the test (number and percentage of students scoring at
each achievement level), and scaled score range for each achievement level
• Average composite ACT score for 11th grade public school students
• Public high school 4-year graduation rate, by student cohort
• Public high school completion rate, by student cohort
• Percentage of population age 25 and older with high school or more education
Quality of Learning Environment
• Percentage of public school core academic subject classes staffed with teachers who are highly
qualified according to No Child Left Behind criteria
• Percentage of public school teachers certified through alternative programs
• Percentage of public school teachers who continue teaching in public school classrooms five
years and ten years from their initial hire date
• Average number of years of teaching experience of full-time public school teachers
• Percentage of full-time public school teachers with less than 3 years of teaching
experience
• Breakdown of performance of public school principals on the Mississippi Principal
Evaluation System by performance level and score range for each performance level
• Percentage of public school students who attend public schools rated A or B in a valid and
reliable accountability rating system
• Percentage of public school students who attend public schools rated F in a valid and reliable
accountability rating system
• Number and percentage of public schools that improved performance in a valid and reliable
accountability rating system by one or more letter grades from the previous year

32
• Number and percentage of public schools that increased their accountability score in a valid
and reliable accountability rating system from the previous year’s score
• Number and percentage of public schools whose performance declined in a valid and reliable
accountability rating system by one or more letter grades from the previous year
• Number and percentage of public schools and districts that meet federal Annual
Measurable Objectives
• Percentage of public school students attending classes in buildings that are in poor
condition
• Number and percentage of students served under a school choice option, by type of option
Cost
• State cost per student
• Total cost per student
33
EDUCATION: HIGHER EDUCATION
STATEWIDE GOAL
To make available an accessible, quality public higher education at an affordable cost that prepares
Mississippians to become productive, financially self-sufficient members of society while meeting the
human resource needs of Mississippi and its employers, including the creation of new jobs through the
commercialization of university-based research
BENCHMARKS
COMMUNITY COLLEGES
College Readiness
• Average ACT score of first-year students enrolled in Associate of Arts (AA or “University
Parallel”) Degree program
• Percentage of first-year students (broken down by all first-year students and by only those first-
year students who graduated from a Mississippi public high school) enrolled in a developmental
(remedial) course, by type of degree program
• Percentage of students (broken down by all first-year students and by only those first- year
students who graduated from a Mississippi public high school) enrolled in a developmental
(remedial) course, by type of degree program, who successfully complete the course
Student Progress
• First-year retention rate for entering full-time freshmen enrolled in Associate of Arts/
University Parallel degree program
• First-year retention rate for entering full-time freshmen enrolled in Associate of Applied
Science (AAS or “Technical”) Degree program
• Percentage of full-time, first-time enrollment cohort who earns half of total required credit hours
for graduation by the end of the first year
• Percentage of part-time, first-time enrollment cohort who earns one quarter of total
required credit hours for graduation by the end of the first year
Student Graduation Rates
• Number of AA (university parallel) and AAS (technical) degrees awarded per 100
undergraduate full-time equivalent (FTE) enrollment
• Percentage of first-year, first-time, full-time community college students enrolled in the AA
(university parallel) program who graduate with an AA (university parallel) degree
• Percentage of first-year, first-time, full-time community college students enrolled in the AA
(university parallel) program who graduate with an AA (university parallel) degree within 3
years

34
• Percentage of community college students who transfer to a Mississippi public four-year higher
educational institution
• Percentage of community college students who transfer to an accredited four-year higher
educational institution
• Percentage of first-year, first-time, full-time community college students enrolled in an AAS
(technical) program who graduate with an AAS (technical) degree
• Percentage of first-year, first-time, full-time community college students enrolled in an AAS
(technical) program who graduate with an AAS (technical) degree within 3 years
• Percentage of first-year, first-time community college students enrolled in a certificate
program who graduate with a certificate
• Percentage of first-year, first-time community college students enrolled in a certificate
program who graduate with a certificate within 3 years
• Percentage of students enrolled in an Adult Basic Education (ABE) program who
complete the Adult Basic Education program
• Percentage of students enrolled in a General Educational Development (GED) program who
complete the General Educational Development program
• Percentage of state population over age 21 with an associate degree as highest level of
educational attainment
• Percentage of state population over age 21 with a certificate of achievement from a
community college as highest level of educational attainment
Workforce Development
• Licensure exam pass rate for community college students who successfully complete a technical
or certificate program in a field requiring state and or national licensure
• Percentage of AAS (technical) graduates employed in jobs in their field of study within a year of
graduation (job placement rate)
• Percentage of certificate graduates employed in jobs in their field of study within a year of
graduation (job placement rate)
• Average starting salary of AAS (technical) graduates
• Average starting salary of certificate graduates
• Wage gains of AA (university parallel) degree, AAS (technical) degree, and certificate
graduates
• Percentage of students trained through workforce education and training programs customized to
meet the needs of local industries who successfully complete the program
Cost
to students
• Dollars spent on remedial coursework
• Percentage of Mississippi median family income required to cover tuition and fees at
Mississippi community colleges
• Average student debt upon graduation

35
to taxpayers
• Total cost to the state of providing remedial classes at the state’s community colleges
• Total state expenditures per student

36
EDUCATION: HIGHER EDUCATION
BENCHMARKS
UNIVERSITIES: UNDERGRADUATE
College Readiness
• Average ACT score of entering freshmen
• Number and percentage of entering students graduating from Mississippi public high schools
who are enrolled in intermediate (remedial) courses during their first year, broken out by
math, English/reading, or both
• Percentage of fall intermediate (remedial) math students completing the course within 2 years
• Percentage of fall intermediate (remedial) English/reading students completing the course
within 2 years
Student Progress
• First-year retention rate (from fall to fall) for entering full-time freshmen
• Percentage of full-time students completing 24 credit hours within one academic year
• Percentage of part-time students completing 12 credit hours within one academic year
Student Graduation Rates
• Number of undergraduate degrees awarded per 100 undergraduate full-time equivalent (FTE)
enrollment
• Student graduation rates (first-time full-time freshmen cohort students graduating within 4 years;
first-time full-time freshmen cohort students graduating within 6 years; first-time full-time
freshmen cohort students graduating within 8 years)
• Number and percentage of degrees awarded to adult learners who enter college for the first time
at age 23 or older
• Percentage of state’s population age 25 years and over with a bachelor’s degree or higher
Graduates in High-need Disciplines
• Number of graduates in high-need disciplines (i.e., science, technology, engineering, math,
education, including non-teaching areas and nursing), by discipline
• Number of graduates in teaching from Mississippi public higher educational institutions
• Licensure exam pass rates for graduates with four-year degrees in a licensed field of study,
by field of study, including the percentage of graduates in teaching who pass Praxis II

37
• Percentage of graduates in high-need disciplines who enter and remain in practice in
Mississippi in the high-need discipline five years and ten years following graduation, by
discipline
• Percentage of teacher candidates from Mississippi public higher educational institutions who
become Mississippi public school teachers following graduation
• Percentage of teacher candidates from Mississippi public higher educational institutions who
remain teaching in Mississippi public school classrooms five and ten years following their initial
hire date
Cost
to students
• Percentage of Mississippi median family income required to cover tuition and fees at
Mississippi public four-year higher educational institutions
• Dollars spent on remedial coursework
• Average student debt on graduation to
taxpayers
• Total cost to the state of providing remedial classes at the state’s public four-year higher
educational institutions
• Total state expenditures per student
Quality of Learning Environment
• Percentage of teaching faculty with terminal degrees (doctorate and first professional
degrees)
UNIVERSITIES: GRADUATE
Graduation Rate
• Percentage of enrolled graduate students who complete graduate degree
• Number of graduate degrees awarded
Graduates in High-need Disciplines
• Number and percentage of graduate degrees awarded in science, technology,
engineering, and math
• Licensure exam pass rate for graduate school graduates, by discipline

38
• Percentage of graduates in high-need disciplines practicing in Mississippi, by discipline
• Percentage of Medical Doctor (M.D.) graduates remaining in Mississippi for residency
• Percentage of University of Mississippi Medical Center (UMMC) medical school
graduates practicing in Mississippi after licensure
Commercialization of Academic Research
• Dollar value of research grants and contracts awarded to Mississippi public universities
• Percentage of total federal research and development expenditures received by
Mississippi public universities
• Number of patents obtained by Mississippi public universities in emerging technologies
• Number of patents obtained by Mississippi public universities in emerging technologies that are
commercialized
• Number of private sector companies created as a result of activities at Mississippi public
universities

39
PUBLIC SAFETY AND ORDER
STATEWIDE GOAL
To protect the public’s safety, including providing timely and appropriate responses to
emergencies and disasters and to operate a fair and effective system of justice
BENCHMARKS
INCIDENCE OF CRIME
• Crimes per 100,000 population (includes the crimes of murder, rape, robbery, aggravated assault,
burglary, larceny-theft, and motor vehicle theft)
• Reported arrests per 100,000 juvenile population (arrests of youths 17 years and younger
divided into population of 10 to 17 year olds)
• Reported arrests for drug abuse violations per 100,000 population
• Driving under the Influence (DUI) arrests per 100,000 population
JUDICIARY (BENCHMARKS FOR STATE-FUNDED COURTS)
• Case clearance rates (the number of outgoing cases as a percentage of the number of incoming
cases)
• Time to case disposition (percentage of cases disposed within the time standard set for each
case type)
• Age of active pending caseload (number of days from case filing to the date of
measurement of the pending caseload)
• Collection of monetary penalties (percentage of monetary penalties collected and
distributed within established timelines)
• Average cost of processing a single case, by case type
CORRECTIONAL SYSTEM
• State prisoners per 100,000 population (includes only inmates sentenced to more than one year)
• Average annual incarceration cost per inmate
• Percentage of offenders without a General Educational Development certificate (GED), high
school diploma, or vocational certification upon incarceration who earned one prior to release
• Percentage of released offenders with a General Educational Development certificate (GED)
or higher
• Percentage of released offenders with marketable job skills
• Percentage of offenders who obtained a vocational certification in prison who obtain and retain a
job (one-year and five-year follow-up) in the vocation for which they were trained
• Percentage of released offenders served in re-entry program housing upon release
• Adult recidivism rate (re-incarceration within three years of initial release)

40
• Juvenile recidivism rate (re-incarceration within three years of initial release)
HIGHWAY SAFETY
• Highway fatalities per 100 million vehicle-miles of travel
• Alcohol-impaired driving fatalities per 100,000 population
EMERGENCY PREPAREDNESS
• Percentage of the state’s local emergency responders with Geographic Information System
(GIS) capacity
• Average emergency response time to natural and man-made disasters
• Number and percentage of Mississippi localities certified by the Mississippi Emergency
Management Agency (MEMA) as “emergency ready”
• Average time for businesses to recover following a natural or man-made disaster
• Number of active members of the Mississippi National Guard
• Number of active members of the Mississippi National Guard who are deployed
overseas
• Number of members of the Mississippi National Guard deployed to respond to a natural or man-
made disaster
• Average time between official call for Mississippi National Guard assistance in response to a
disaster and full deployment at the disaster site
41
Health
STATEWIDE GOAL
To protect Mississippians from risks to public health and to provide them with the health- related
information and access to quality healthcare necessary to increase the length and quality of their lives
BENCHMARKS
ACCESS TO CARE
• Number of health professional shortage areas
• Number of practitioners needed to remove health professional shortage area
designations, by type of practitioner
• Number of Advanced Practice Nurses (APNs) practicing in Mississippi, by public health district
• Number of Certified Nursing Assistants (CNAs) working in Mississippi, by public health
district
• Percentage of Mississippi population aged 19 through 64 uninsured
• Percentage of Mississippi population aged 19 through 64 underinsured
• Percentage of Mississippi population under 19 years of age who are insured
• Preventable hospitalizations (discharge rate among the Medicare population for
diagnoses amenable to non-hospital-based care)
• Number of persons treated in emergency rooms for non-emergency issues and costs, for Medicaid
patients and for all patients
• Percentage of population lacking access to dental care
• Percentage of population lacking access to mental health care
• Percentage of population lacking access to community-based mental health care
• Percentage of Mississippi Department of Mental Health (DMH) clients served in the
community versus in an institutional setting
• Percentage of Mississippi Department of Mental Health (DMH) institutionalized clients who
could be served in the community
• Percentage of people receiving mental health crisis services who were treated at
community mental health centers (versus in an institutional setting)
• Average length of time from mental health crisis to receipt of community mental health crisis
service
• Percentage of children with serious mental illness served by local Multidisciplinary
Assessment and Planning (MAP) teams
• Number of individuals on waiting list for home- and community-based services
• Transfer time (in minutes) from Level III and IV Trauma Centers to appropriate facilities for
treatment
42
MATERNAL AND CHILD HEALTH
• Teenage birth rate (live births per 1,000 women 15 to 19 years old)
• Infant mortality rate (infant deaths per 1,000 live births)
• Births of low birthweight (less than 5 pounds, 8 ounces) as a percentage of all births
• Percentage of women who received prenatal care in the first trimester
• Percentage of live births delivered prior to 37 weeks of gestation
• Percentage of newborns with positive and inconclusive genetic screens who received follow-
up
• Early and Periodic Screening, Diagnostic and Treatment (EPSDT)/well child screening rates
for Medicaid and Children’s Health Insurance Program (CHIP) children
• Percentage of children who have one or more emotional, behavioral, or developmental
conditions
COMMUNICABLE DISEASE
• Tuberculosis case rate per 100,000 per year
• Number of new cases of chlamydia per 100,000 per year
• Primary and secondary syphilis case rate per 100,000 per year
• New reports of HIV disease per 100,000 per year
• Number of reported cases of vaccine-preventable communicable diseases, including hepatitis
A, measles, mumps, pertussis, by disease
• Number of cases of mosquito-borne illness, by type, and associated number of deaths
• Percentage of children fully immunized by 2 years of age
• Adolescent vaccination rates, by recommended vaccine [meningococcal; combined tetanus,
diphtheria and pertussis (Tdap); human papillomavirus (HPV)]
• Hospital acquired infection rate
• Incidence of food-borne illness (salmonella)
NON-COMMUNICABLE DISEASE
• Percentage of population diagnosed with diabetes
• Rate of complications among diabetes patients
• Premature death rate due to cardiovascular disease
• Incidence of lung cancer per 100,000 per year
• Lung cancer death rate
• Incidence of breast cancer per 100,000 per year
• Breast cancer death rate
• Incidence of colon cancer per 100,000 per year
• Colon cancer death rate
• Percentage of adults who are obese [defined as a Body Mass Index (BMI) of 30 or more,
regardless of sex]
• Adult compliance with recommended levels of aerobic physical activity (percentage of adults
who report participating in 150 minutes or more of aerobic physical activity per week)
43
• Adult compliance with consumption of recommended daily portions of fruits and vegetables
[percentage of adult population reporting consumption of recommended daily portions of fruits
(2+) and vegetables (3+)]
• Prevalence of current smokers among public middle school students
• Prevalence of current smokers among public high school students
• Prevalence of current smokers among adults 18 years and older
• Percentage of children with asthma problems
• Asthma hospitalization rate
• Rate of substance abuse and alcoholism
• Rate of binge drinking [percentage of adults who self-report having 4 or more (women) or 5 or
more (men) alcoholic beverages on at least one occasion in the last month]
• Number of deaths due to drug injury of any intent (unintentional, suicide, homicide,
undetermined) per 100,000 population
• Prescription drug abuse deaths per 100,000 population per year
• Occupational fatalities (number of fatalities from occupational injuries per 100,000
workers)
• Deaths of persons ages 10-14 and 15-24 years by unintentional injuries (not including motor
vehicle injuries), motor vehicle injuries, homicide, and suicide (per 1,000 population per year)
• Deaths of persons ages 0-9 years by unintentional injuries (not including motor vehicle
injuries), motor vehicle injuries, and homicide (per 1,000 population per year)
• Age-adjusted death rate
• Premature death rate
HEALTH PROTECTION
• Percentage of Mississippi cities and towns achieving “healthy community” status
• Percentage of Mississippi population receiving fluoridated water
• Percentage of Mississippi population receiving water from a public water supply
• Percentage of Mississippi population receiving water from a public water supply whose water
supply is in compliance with the Safe Water Drinking Act
• The state’s scores on the National Health Security Preparedness Index, overall and by domain
(health surveillance, community planning and engagement, incident and information
management, surge management, and countermeasure management)

44
Human Services
STATEWIDE GOAL
To ensure that Mississippians are able to develop to their full potential by having their basic needs met,
including the need for adequate food and shelter and a healthy, stable, and nurturing family environment
or a competent and caring system of social support
BENCHMARKS
SOCIAL INDICATORS
• Percentage of population in poverty
• Affordability of housing (home price-to-income ratio and home price-to-rent ratios)
• Rate of homelessness (per 10,000 population)
• Number and percentage of children under age 18 living in families where no parent has full-
time, year-round employment
• Number and percentage of children under age 18 living in low-income families
PROTECTIVE SERVICES
• Substantiated incidence of child abuse or neglect (per 1,000 population)
• Number of children in agency custody
• Average time (in days) a child is held in emergency shelters and other temporary holding
facilities before being placed in foster care
• Average time (in months) a child is in foster care
• Average time (in days) between a child in foster care being declared legally eligible for
adoption and adoption
• Percentage of children in foster care legally eligible for adoption who are adopted, by
category [i.e., by age range (less than 1 year, 1-3 years, 4-6 years, 7-9 years, 10-14 years, 15+
years), special needs]
• Substantiated incidence of abuse of vulnerable adults (per 1,000 population)
• Percentage of child support cases current on payments
FOOD ASSISTANCE
• Percentage of households with food insecurity
• Average number of households monthly receiving food assistance through the
Supplemental Nutrition Assistance Program
• Percentage of Mississippi households receiving food assistance through the
Supplemental Nutrition Assistance Program
• Percentage of public school children receiving free or reduced meals in school
45
TEMPORARY ASSISTANCE FOR NEEDY FAMILIES (TANF)
• Number and percentage of children in single-parent families
• Births to unmarried women as a percentage of live births
• Percentage of females age 15 to 19 who delay childbearing until adulthood
• Number and percentage of families receiving Temporary Assistance for Needy Families (TANF)
during the year
• TANF work program participation rate
• Percentage of TANF participants in job training who enter employment
• Percentage of TANF participants in job training who enter employment at a salary
sufficient to make them ineligible to continue receiving TANF benefits
• Percentage of TANF participants in job training who remain employed (one-year and five- year
follow-up)
VOCATIONAL REHABILITATION
• Percentage of the population of persons with a disability who are employed
• Percentage of individuals completing vocational rehabilitation services who obtain
employment
• Percentage of individuals completing vocational rehabilitation services who obtain
employment with hourly rate of earnings equal to the federal or state minimum wage rate,
whichever is higher, or higher
• Percentage of individuals who obtain employment following completion of vocational
rehabilitation services who remain employed (one-year and five-year follow-up)
46
Natural Resources
STATEWIDE GOAL
To ensure that current and future generations have access to the state’s abundant natural resources
through restoration, protection, conservation, and wise development of those resources
BENCHMARKS
WATER
Quantity
• Maintenance of adequate groundwater (aquifer) capacity, by region
• Maintenance of adequate quantity of surface waters, by region
Flood Hazard Mitigation
• Number of dams in the Mississippi Department of Environmental Quality’s inventory
• Percentage of dams in the Mississippi Department of Environmental Quality’s inventory that
are under an enforcement order to drain or repair, by category of dam (high hazard, medium
hazard, low hazard)
• Percentage of flood hazard acreage updated to reflect most recent available flood data
Quality
• Miles of impaired rivers and streams (total and as a percentage of total river and stream mileage
assessed)
• Acres of impaired lake water (total and as a percentage of total lake water assessed)
• Mississippi waters that meet or exceed State Water Quality Standards
• Toxic releases: Total surface water discharges (in pounds)
• Number of beach advisories issued due to pollution
AIR QUALITY
• Number of days with air advisories
• Number of counties that meet National Ambient Air Quality standards for particulate matter
• Fugitive and point source toxic air emissions (in pounds)
LAND
• Percentage of forested land in a timber management program
• Acreage and economic value of brownfield sites reclaimed during the year

47
• Percentage of acreage of brownfield sites reclaimed within one year, two years, and three
years of initial identification
• Number and acreage of Comprehensive Environmental Response, Compensation and Liability
Act (CERCLA) “Superfund” sites listed on the national priorities list
• Percentage of acreage of superfund sites listed on the national priorities list reclaimed within
one year, two years, and three years of identification
• Percentage of underground storage tanks in the Underground Storage Tank Program that are
in compliance with regulatory requirements
• Percentage of underground storage tanks in the Underground Storage Tank Program that are
in active remediation
• Percentage of surface mining activity acreage in need of reclamation that is reclaimed
• Tons of solid waste material properly disposed in permitted facilities
• Percentage of citizens who have access to a recycling program
• Amount of material recycled each year
STATE PARKS
• Measure of condition of state park infrastructure
• Measure of condition of state park acreage
• Number of visitors to state parks and recreation areas
WILDLIFE AND FISHERIES
• Measures of condition of the state’s wildlife population
• Estimates of populations of invasive species, by species
• Measures of condition of the state’s marine species
• Percentage of oyster production acreage that is limited due to pollution
• Mileage of river and stream segments and acreage of lakes (total and as a percentage of total
assessed) under a fish consumption advisory during the year
ENERGY
• Per capita energy consumption in British thermal units (BTUs)
• Total energy production in trillion British thermal units (BTUs)
• Renewable energy production (in kilowatt hours)
• Number of alternative fuel and hybrid-electric vehicles registered in Mississippi

48
Infrastructure
STATEWIDE GOAL
To ensure the construction and maintenance of infrastructure (including roadways, waterways,
railways, airports, water and sewer systems, pipelines, electricity lines, broadband connections, public
buildings) adequate to meet the needs of citizens and the business community and to foster economic
growth
BENCHMARKS
TRANSPORTATION
• Roadway condition (percentage of state highway system rated good or better on the
pavement condition index, by route type; i.e., interstate, four-lanes, two-lanes)
• Number and percentage of bridges that are deficient and cost to correct deficiency, by
category of deficiency
• Public airport utilization, capacity, and connectivity
• Port utilization, capacity, and connectivity
• Measure of the state’s rail system capacity and condition
• Percentage of state’s rail mileage that can accommodate double stacked cars
• Ton-miles of freight shipped by railroad
• Number and percentage of the state’s public railroad crossings that are grade separated
• Public transit utilization and capacity
STATE BUILDINGS
• Percentage of total square footage of buildings housing state employees and operations that is
owned versus leased
• Cost per square foot of leased versus owned buildings housing state employees and
operations
• Cost of needed repairs to state buildings
PUBLIC UTILITIES
• Percentage of local sewer and water infrastructure in immediate need of repair and
replacement and associated costs
• Percentage of households with broadband service at home
• Percentage of homes passed by fiber optic infrastructure
• Average and peak broadband network speed
• Ratio of supply of electricity generation capacity to demand

STATEWIDE GOAL
To create an efficient government and an informed and engaged citizenry that helps to address
social problems through the payment of taxes, the election of capable leaders at all levels of
government, and participation in charitable organizations through contributions and
volunteerism
BENCHMARKS
COST OF GOVERNMENT
• Individual tax burden (state and local taxes as a percentage of personal income)
• Total state spending per capita
• Number of government employees per 10,000 population (broken out by federal, state,
and local)
• Per capita state and local debt outstanding
• Mississippi general obligation bond rating
• Issuance cost per $1,000 in general obligation debt
• Funded ratio of statewide pension systems
GOVERNMENT EFFICIENCY
• Administrative efficiency: Expenditures on state government administrative activities as
a percentage of total operational expenditures
• Average wait time for state government services
• Regulatory efficiency: average length of time to resolution of documented complaints
to professional licensing agencies
• Number and average cost of regulatory actions taken, by regulatory body and type of
action
• State dollars saved by providing government services online (e.g., document retrieval,
issuance of new business permits, license renewal)
• Percentage of state employees leaving state service within five years of employment
ENGAGED CITIZENRY
• Civic engagement (voting):
• Percentage of eligible population voting
• Percentage of registered population voting
• Percentage of state residents who volunteer


