
Insurance Stress Test 2014
Europe-wide stress test for the insurance sector

Preface
On the 30th of April EIOPA launched an EU wide insurance stress test. The exercise aims to test the overall resilience of the insurance sector and to identify its major vulnerabilities. The test package comprises two modules:
• The core module address the impact of adverse market scenarios, covering financial asset stresses (sovereigns, corporate bonds and equities) as well, as shocks to real estate assets prices’ and interest rates stresses complemented by a set of independent insurance-specific shocks
• The second module addresses the impact of a low yield environment
The exercise runs in close cooperation with national supervisory authorities (NSAs). The NSAs will collect data from undertakings in July 2014 and validate the information before it is aggregated at the EU level.
To improve consistency in the calculations, during August and September 2014, EIOPA in cooperation with NSAs will conduct an EU-wide validation of the data received. Results of the stress test analysis will be disclosed in November 2014.
In the remainder of this document the different scenarios tested in the 2014 stress test are discussed and a comparison is made with previous stress tests organized by EIOPA and/or the IMF. The different stress tests developed by EIOPA can also serve as inspiration for insurance companies to define stress tests in the context of the ORSA.
© 2014 Deloitte Belgium 2

Insurance Stress Test 2014• Module 1 4• Module 2 9
Comparison Insurance stress tests 11
Contact details 25
Contents
© 2014 Deloitte Belgium 3

Module 1
4© 2014 Deloitte Belgium
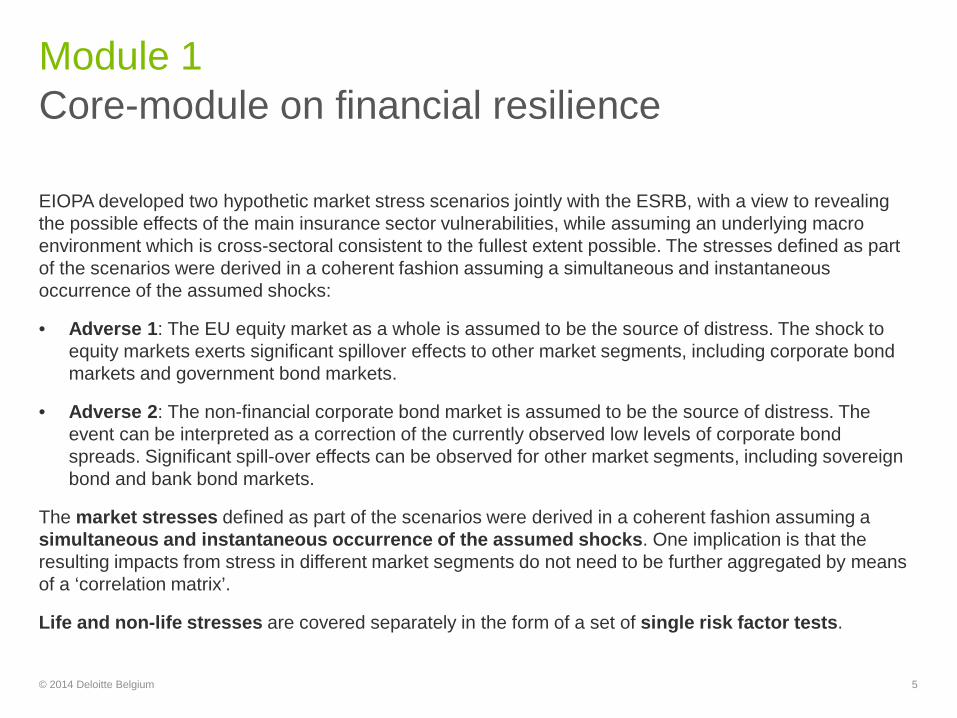
EIOPA developed two hypothetic market stress scenarios jointly with the ESRB, with a view to revealing the possible effects of the main insurance sector vulnerabilities, while assuming an underlying macro environment which is cross-sectoral consistent to the fullest extent possible. The stresses defined as part of the scenarios were derived in a coherent fashion assuming a simultaneous and instantaneous occurrence of the assumed shocks:
• Adverse 1: The EU equity market as a whole is assumed to be the source of distress. The shock to equity markets exerts significant spillover effects to other market segments, including corporate bond markets and government bond markets.
• Adverse 2: The non-financial corporate bond market is assumed to be the source of distress. The event can be interpreted as a correction of the currently observed low levels of corporate bond spreads. Significant spill-over effects can be observed for other market segments, including sovereign bond and bank bond markets.
The market stresses defined as part of the scenarios were derived in a coherent fashion assuming a simultaneous and instantaneous occurrence of the assumed shocks. One implication is that the resulting impacts from stress in different market segments do not need to be further aggregated by means of a ‘correlation matrix’.
Life and non-life stresses are covered separately in the form of a set of single risk factor tests.
Module 1Core-module on financial resilience
5© 2014 Deloitte Belgium

Core-module on financial resilienceModule 1
The tables below gives an overview of the stresses applied to the macro-economic variables in both scenarios and the single factor insurance stresses:
Next to the single factor insurance stresses the impact of 5 pre-defined catastrophe events has to be calculated: • Northern European windstorm• US Hurricane• Turkish Earthquake• Central and Eastern European Flood• Airport crash event© 2014 Deloitte Belgium 6
Interest Rates Stresses (bps) Equity Stresses Non-Life Stresses (shocks expressed respect euro swap rates) Stress Adverse 1 Adverse 2 Stress Adverse 1 Adverse 2
Stress Adverse 1
Adverse 2 MSCI Europe -41% -21% NatCat / ManCat 1-in-100 year event 1-in-200 year event
Maturity 1y -26 -35 Provisions deficiency 1,00% 3,00%
Maturity 2y -56 -42 Property Stresses Maturity 3y -67 -30 Stress Adverse 1 Adverse 2 Life Stresses Maturity 5y -78 -9 Commercial -49,00% -18,00% Stress Adverse 1 Adverse 2 Maturity 7y -85 0 Residential -17,10% -15,70% Longevity 10,00% 18,00%
Maturity 10y -91 8 Mortality 0.6 additional death 2 additional death
Maturity 20y -97 16
Maturity 30y -103 15 Mass Lapse Stress
Stress Adverse 1 Adverse 2
Mass lapse 20,00% 35,00%

Core-module on financial resilienceModule 1
The tables below gives an overview of the stresses applied on the bond spreads:
The spread shocks should be added to the total yield as observed @ 31/12/2013.
© 2014 Deloitte Belgium 7
Corporate Bond Stresses – Financials Fup (bps)
Corporate Bond Stresses –Financials covered Fup (bps)
Corporate Bond Stresses – Non-Financials Fup (bps)
Stress Adverse 1 Adverse 2 Stress Adverse 1 Adverse 2 Stress Adverse 1 Adverse 2 AAA 24 86 AAA 8 32 AAA 5 93AA 35 150 AA 38 63 AA 8 126A 101 206 A 48 68 A 14 134BBB 316 262 BBB 69 86 BBB 48 169BB 365 292 BB 84 97 BB 69 190B and lower 420 315 B and lower 93 105 B and lower 96 219Unrated 455 328 Unrated 99 109 Unrated 108 231
Sovereign Bond Stresses (bps) Sovereign Bond Stresses (bps) Sovereign Bond Stresses (bps) Stress Adverse 1 Adverse 2 Stress Adverse 1 Adverse 2 Stress Adverse 1 Adverse 2
AT 41 46 HU 286 278 SE 13 56BE 96 55 IE 217 149 SI 200 142BG 87 104 IT 195 90 SK 45 114CY 200 142 LT 47 136 UK 36 61CZ 76 147 LU 109 90 EU mean (info) 121 99DE 0 0 LV 82 108 EU std (info) 127 64DK 10 66 MT 33 27 IC 74 90ES 148 65 NL 17 37 NO 33 112FI 18 35 PL 132 139 CH 44 60FR 44 38 PT 282 86 US 46 61GR 594 251 RO 48 11 JP 80 125HR 85 105

Core-module on financial resilienceModule 1
The graph below gives an overview of the interest term structure under the different scenarios:
In scenario 1 the EUR swap rates decreased for all maturities, while in scenario 2 a steepening of the interest rate curve is observed, the short term interest rates decreased while the long term interest rates increased.
© 2014 Deloitte Belgium 8

Module 2
9© 2014 Deloitte Belgium

The 2014 EIOPA low yield exercise will provide an assessment of the financial consequences of a persistent low interest rate environment for the European insurance market. Two scenarios are tested:
• Low yield scenario 1: Japanese scenario, this scenario assesses the impact of a long-lasting low yield scenario with low rates for all maturities.
• Low yield scenario 2: Inverse scenario, this scenario assesses the impact of an atypical reverse-shocked interest rate curve. Such an atypical instantaneous shift/pivoting should illustrate unanticipated effects on asset & liability values and cash flows
Module 2Low interest rate environment
10© 2014 Deloitte Belgium
Comparison stress tests
11© 2014 Deloitte Belgium
EIOPA organized several stress tests the past years. A stress test is one of a range of supervisory tools for assessing the strength of individual institutions and evaluating the stability of the insurance sector.
The shocks applied to the different risk modules are intended to replicate a set of negative conditions. Whilst they might appear to be remote, they are nonetheless statistically possible events. Therefore the scenarios considered by EIOPA in the insurance stress tests can serve as inspiration for insurance companies in the context of the Own Risk and Solvency Assessment (ORSA) or the Forward Looking Assessment of Own Risks (FLAOR).
Therefore we have compared the scenarios tested during the different stress test exercises organized by EIOPA.
Insurance Stress TestsOverview of the recent stress tests
12© 2014 Deloitte Belgium
EIOPA Final Report on Public Consultation No. 13/009 on the Proposal for Guidelines on Forward Looking Assessment of Own Risks
5.48. The assessment also needs to consider the changes to the own funds position that might occur in stressed situations. The undertaking is expected to carry out stress tests and scenario analyses to assess the resilience of the business.

The table below gives an overview the most important characteristics of the different stress tests:
Insurance Stress TestsOverview of the recent stress tests
13© 2014 Deloitte Belgium
Reference Date Valuation Basis Stresses applied Risk aggregation
Stress Test 2011 31 December 2010 QIS5 Technical Specifications
• Market risk stresses
• Non-life stresses
• Life stresses
• Inflation scenario
• Market risk stresses occur simultaneously
• Market risk and insurance risks are aggregated via a correlation matrix
Low Yield Stress test 31 December 2010 QIS5 Technical
Specifications 2 low yield scenarios • N/A
IMF – NBB Stress Test 2012 30 June 2012
Level 2 Draft Implementing Measures (No
illiquidity premium or CCP)
• Market risk stresses
• Non-life stresses
• Life stresses
• Market risks are aggregated via a correlation matrix
• Market risk and insurance risks are aggregated via a correlation matrix
Stress Test 2014 31 December 2013Technical
Specifications preparatory phase
• Market risk stresses occur simultaneously
• Market risks and insurance risks are not aggregated

In July 2011 EIOPA published the results of the 2011 Insurance Stress Test*.
The results of this stress test indicate that overall the European insurance market is well prepared for potential future shocks as tested in this exercise. However, data showed that approximately 10% (13) of the participating groups and companies do not meet the MCR under the adverse scenario. 8% (10) fail to meet the MCR in the inflation scenario.
At the aggregate level, EIOPA identifies the main drivers of the results as being adverse developments in equity prices, interest rates and sovereign debt markets. On the liability side, non-life risks are more critical, triggered by increased claims inflation and natural disasters.
The results reported are for 58 groups and 71 companies due to aggregation of the results of companies within groups. This represents approximately 60% of the overall European insurance market and is above EIOPA’s aim to include at least 50% of the insurance market of each country as measured by gross premium income.
Insurance Stress TestsConclusions stress test 2011
14© 2014 Deloitte Belgium
* EIOPA, Press Release: EIOPA announced today the results of its second European insurance stress test, 4 July 2011
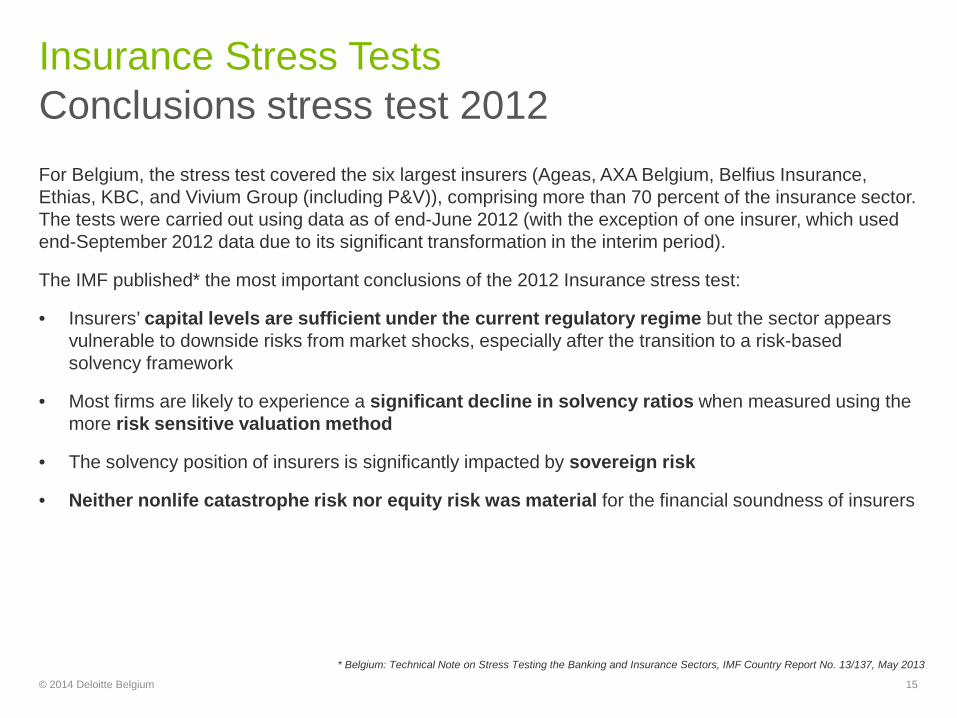
For Belgium, the stress test covered the six largest insurers (Ageas, AXA Belgium, Belfius Insurance, Ethias, KBC, and Vivium Group (including P&V)), comprising more than 70 percent of the insurance sector. The tests were carried out using data as of end-June 2012 (with the exception of one insurer, which used end-September 2012 data due to its significant transformation in the interim period).
The IMF published* the most important conclusions of the 2012 Insurance stress test:
• Insurers’ capital levels are sufficient under the current regulatory regime but the sector appears vulnerable to downside risks from market shocks, especially after the transition to a risk-based solvency framework
• Most firms are likely to experience a significant decline in solvency ratios when measured using the more risk sensitive valuation method
• The solvency position of insurers is significantly impacted by sovereign risk
• Neither nonlife catastrophe risk nor equity risk was material for the financial soundness of insurers
Insurance Stress TestsConclusions stress test 2012
15© 2014 Deloitte Belgium
* Belgium: Technical Note on Stress Testing the Banking and Insurance Sectors, IMF Country Report No. 13/137, May 2013

Market risk stresses
16© 2014 Deloitte Belgium

Comparison of the stresses appliedMarket Risk Stresses
The table on the next slides gives an overview of the stresses applied on the equity prices and credit spreads.
The shocks applied under the different stress tests differ a lot, however the different percentages should be interpreted with caution:
• The market risk stresses of the 2012 stress test are sensitivity tests which are aggregated with the other market risks afterwards, taking into account diversification gains, while the market risk stresses of 2011 and 2014 occur all at the same time (no diversification gains)
• The objective and the confidence interval of the different stress tests may have been different
© 2014 Deloitte Belgium 17

Comparison of the stresses appliedMarket Risk Stresses
The table below gives an overview of the interest rate stresses applied during the different stress tests.
© 2014 Deloitte Belgium 18
Corporate Bond stresses Equity StressesFinancials spread shock
Adverse 1 Adverse 2 Base Adverse Base Adverse Adverse 1 Adverse 2 Base Adverse Base AdverseAAA 0,24% 0,86% 0,30% 0,50% 0,10% 0,30% MSCI Europe -41,00% -21,00% -16,00% -23,70% -7,50% -15,00%AA 0,35% 1,50% 0,40% 0,70% 0,20% 0,40% Residential property -17,10% -15,70% N/A N/A -3,80% -11,60%A 1,01% 2,06% 0,50% 1,00% 0,30% 0,60% Commercial property -49,00% -18,00% N/A N/A -12,50% -25,00%BBB 3,16% 2,62% 1,00% 2,50% 0,40% 0,90%BB 3,65% 2,92% 2,50% 5,30% 0,90% 1,70% Sovereign Bond StressesB and low er 4,20% 3,15% 5,00% 6,10% 1,50% 3,00% Sovereign spread shocUnrated 4,55% 3,28% 1,10% 2,80% 0,60% 1,10% Adverse 1 Adverse 2 Base Adverse Base Adverse
Austria 41 46 34 52 24Financials covered spread shock Belgium 96 55 47 72 78
Adverse 1 Adverse 2 Base Adverse Base Adverse Finland 18 35 31 48 10,5AAA 0,08% 0,32% 0,30% 0,40% 0,10% 0,30% France 44 38 32 48 48AA 0,38% 0,63% 0,40% 0,50% 0,20% 0,40% Germany 0 0 0 0 0
Greece 594 251 525 801 255Non-Financials spread shock Ireland 217 149 104 156 258
Adverse 1 Adverse 2 Base Adverse Base Adverse Italy 195 90 72 108 136,5AAA 0,05% 0,93% 0,30% 0,40% 0,10% 0,30% Netherlands 17 37 21 33 22,5AA 0,08% 1,26% 0,40% 0,50% 0,20% 0,40% Portugal 282 86 142 247 246A 0,14% 1,34% 0,50% 0,70% 0,30% 0,60% Slovakia 45 114 52 83 33BBB 0,48% 1,69% 1,00% 1,50% 0,40% 0,90% Slovenia 200 142 124 182 39BB 0,69% 1,90% 1,50% 2,00% 0,90% 1,70% Spain 148 65 74 109 165B and low er 0,96% 2,19% 6,00% 12,60% 1,50% 3,00% Sw itzerland 44 60 41 61 0Unrated 1,08% 2,31% 1,10% 1,70% 0,60% 1,10% United Kingdom 36 61 34 51 28,5
2014
20122014
2012
2012
2011
2011
20112014
2014
2014 2012
2012
2011
2011

Comparison of the stresses appliedMarket Risk Stresses
The graph below shows the interest rate curves under the different stress tests:
The interest rate stresses applied in the different stress tests are very different, in 2011 parallel shocks were applied to the base curve, while different stresses were both the level and the shape of the curves were stressed in 2012 and 2014.
© 2014 Deloitte Belgium 19

Insurance risk stresses
20© 2014 Deloitte Belgium

Comparison of the insurance risk stressesInsurance risk stresses
The table below gives an overview of the insurance risk stresses applied during the different stress tests:
The tables above show that the insurance stresses applied during the different stress tests are very different.
© 2014 Deloitte Belgium 21
Non-life stresses2014 2012 2011
Adverse 1 Adverse 2 Base Adverse Base Adverse
NatCat / ManCat Largest 1/100 nat cat exposure
Largest 1/200 nat cat exposure Largest 1/40 nat cat exposure Largest 1/200 nat cat exposure with only 70%
recovery from reinsurer
Claims reserve deficiency 1% higher claims inflation 3% higher claims inflation N/A 2% higher claims inflation
Catastrophic scenarios 5 specific catastrophic scenarios N/A N/A
Life stresses
2014 2012 2011
Adverse 1 Adverse 2 Base Adverse Base AdverseLongevity 10% 18% N/A 23%
Mortality 0,6 additional death 2 additional death N/A 1,5 additional death, restrictions on recoveryrates on reinsurance
Mass lapse 20,00% 35,00% 30,00% N/A

Low yield stress test
22© 2014 Deloitte Belgium
Stress test 2011 and 2014Low yield stress
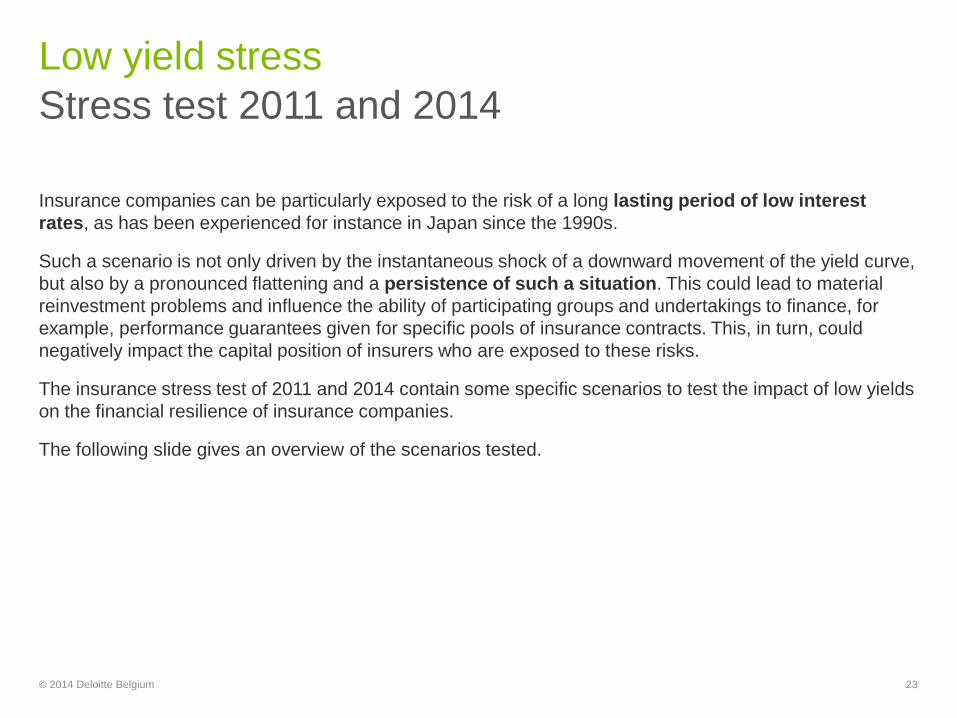
Insurance companies can be particularly exposed to the risk of a long lasting period of low interest rates, as has been experienced for instance in Japan since the 1990s.
Such a scenario is not only driven by the instantaneous shock of a downward movement of the yield curve, but also by a pronounced flattening and a persistence of such a situation. This could lead to material reinvestment problems and influence the ability of participating groups and undertakings to finance, for example, performance guarantees given for specific pools of insurance contracts. This, in turn, could negatively impact the capital position of insurers who are exposed to these risks.
The insurance stress test of 2011 and 2014 contain some specific scenarios to test the impact of low yields on the financial resilience of insurance companies.
The following slide gives an overview of the scenarios tested.
© 2014 Deloitte Belgium 23

Stress test 2011 and 2014Low yield stress
Low yield 2011:
• Scenario 1: A downward movement in the level of interest rates in accordance with an unconditional forward rate of 4.2%, and a pronounced u-shaped flatting of the curve in the shorter part of the maturity spectrum
• A downward movement in the yield curve to a level and shape similar to the Euro curve observed in recent years in August 2010
Low yield 2014:
• Low yield 1 is the Japanese interest curve of December 2011
• Low yield 2 assesses the impact of an atypical reverse-shocked interest rate curve© 2014 Deloitte Belgium 24

Contacts
25© 2014 Deloitte Belgium
Our contact details
© 2014 Deloitte Belgium 26
Email: [email protected]: + 32 2 800 24 94
Christophe VandewegheEnterprise Risk Services
Director, Actuarial & Financial Risk Advisory
Email: [email protected]: + 32 2 800 24 10
Frank Van den BerghEnterprise Risk Services
Manager, Actuarial & Financial Risk Advisory
Email: [email protected]: + 32 2 800 24 73
Arno De GrooteEnterprise Risk Services
Partner, Actuarial & Financial Risk Advisory

Deloitte refers to one or more of Deloitte Touche Tohmatsu Limited, a UK private company limited by guarantee (“DTTL”), its network of member firms, and their related entities. DTTL and each of its member firms are legally separate and independent entities. DTTL (also referred to as “Deloitte Global”) does not provide services to clients. Please see www.deloitte.com/about for a more detailed description of DTTL and its member firms.
Deloitte provides audit, tax, consulting, and financial advisory services to public and private clients spanning multiple industries. With a globally connected network of member firms in more than 150 countries and territories, Deloitte brings world-class capabilities and high-quality service to clients, delivering the insights they need to address their most complex business challenges. Deloitte’s more than 200,000 professionals are committed to becoming the standard of excellence.
This communication contains general information only, and none of Deloitte Touche Tohmatsu Limited, its member firms, or their related entities (collectively, the “Deloitte Network”) is, by means of this communication, rendering professional advice or services. No entity in the Deloitte network shall be responsible for any loss whatsoever sustained by any person who relies on this communication.
© 2014. For information, contact Deloitte Belgium


