
TRANSPORTATION RESEARCH RECORD 1305 123
Integrating GIS Technology in Urban Transportation Planning and Modeling
Pouucos PRASTAcos
The integration of Geographic Information System (GIS) technology in urban transportation planning and modeling is discussed. The problems faced today and the solution GIS systems could provide are identified. The design considerations and data needs for implementing a GIS-based urban transportation analysis system are analyzed and some of the commercially available GIS software is evaluated. Emphasis is placed on the use of a GIS in model-based transportation applications rather than on other potential uses of GIS. Several applications of GIS methodology for urban transportation analysis are described.
Traffic congestion has become one of the most pressing problems in urbanized areas around the world. The dominance of the automobile as the mode of choice, the continuing separation between jobs and housing, and the flight from the central business district (CBD) to the suburbs have contributed to unprecedented levels of traffic congestion and adversely affected air quality. Advances in technology can assist transportation organizations in their efforts to continuously develop elaborate new procedures for traffic management. One new technology that appears particularly promising is the evolving technology of the geographical information system (GIS).
The GIS is a computerized data base management system that can be used for storing, displaying, and analyzing spatial data. In the last 4 years, there has been a revolution in this field. Lower hardware costs coupled with the availability of powerful computer software has resulted in the widespread use of GIS methodologies for the solution of spatial problems. Traditionally, most GIS applications have been in the field of natural resources management (1,2) . Only recently, transportation planners and researchers have started to explore the benefits that arise by implementing GIS-based systems for analyzing the transportation infrastructure and demand (3-5).
Both transportation and GIS systems use locational data. GIS data bases in addition to the attribute data that can be found in all data bases contain geographic information. All elements in the data base are referenced to the same geographic coordinate system that permits the spatial analysis of the data. In transportation, all information have a locational component; however, the lack of any common georeferencing system makes it difficult to analyze this information. GIS technology could enhance transportation analysis by providing an environment for integrated data bases closely linked to models for decision support.
Urban MicroSystems, 1305 Franklin St., Suite 201, Oakland, Calif. 94612; and Institute of Applied Mathematics, Research Center of Crete, Heraklion, Greece.
GIS technology is being integrated into transportation planning at the urban level. Problems faced today have solutions that GIS systems could provide. Design considerations, data, and commercially available GIS software are needed for implementing a GIS-based urban transportation analysis system. Emphasis is placed on the use of the GIS in model-based transportation applications rather than on other potential uses for the GIS. Experience has been obtained with several applications of GIS methodology for urban transportation analysis and the integrating of GIS and transportation models .
TRANSPORTATION MODELS AND DATA INPUTS
Urban Transportation Planning and Forecasting
Urban transportation planning as practiced today in most of the western developed countries is based on aggregate modeling. The traditional urban transportation planning system (UTPS) for travel analysis and forecasting-containing features of trip generation, distribution , modal split, and assignment-relies heavily on aggregation of spatial networks and data . Land use and demographic information such as population, income, and car ownership are available at disaggregate geography levels; however, for transportation analysis purposes they are aggregated to traffic analysis zones (TA Zs). TAZs are assumed to be homogeneous; the socioeconomic and land use variations that exist within the zone are collapsed to an average zonal number without any reference to the variance of these attributes.
Transportation infrastructure is represented as a graph consisting of nodes and links . Links stand for road segments, whereas nodes represent street intersections. The network used for modeling purposes is an aggregation and simplification of the actual physical network. For example, in the San Francisco metropolitan region the street network contains more than 300,000 segments, whereas the network used for region-wide transportation analysis includes less than 20,000 links. The links are often coded without any reference to any kind of geographic reference system; as a result, it is cumbersome to relate network information to other areal attribute data. The models, therefore, are not sensitive to changes occurring at lower spatial levels.
This procedure, forced on planners because of computer limitations in the past, has several significant implications. Because depending on the level of disaggregation, TAZs can represent a population of as many as 10,000 people-in the San Francisco region for a population of 5,600,000 there are 770 zones-all intra-TAZ variations in attributes and net-
124
works are lost. This assumption is not overly restrictive for traditional high-density urban environments with T AZ zones occupying a relatively small area. However, most of the urban growth today occurs in the suburbs (6), where housing and employment .densities are substantially lower. In this case, a T AZ zone can cover a wide area and the assumption of homogeneity of travel and socioeconomic characteristics might be invalid.
Forecasts of future transit usage can be adversely affected by the aggregation of intra-T AZ networks and characteristics. Modal choice is heavily influenced by the time it takes trip makers to get to the transit station. Zonal averages for this variable , particularly in suburban TAZs , often show large access times, thus biasing model results (7). The zonal average is estimated without explicit consideration of the actual location of residents, although this information is available down to the block group level. With a common geographic reference system, zonal averages can be estimated as a the sum of the access time of the various subzonal areas weighted by the number of households.
Another problem with the modeling mechanism used today is the lack of any readily available library of models that can be easily applied. UTPS and PLANP ACK are two of the most widely used modeling systems. Both are mainframe-based systems that implement the traditional four-stage modeling process. The difficulty with implementing new algorithms and models within this environment stifles any attempt to experiment with new procedures. Data input has to obey a rigid structure, whereas the model output is provided in lengthy tables that make it difficult to quickly visualize the implications of the results. It is only recently that new modeling packages have been introduced for the PC that interact with the user in a graphic way.
Transportation Logistics
Transportation logistics is a critical component of the overall physical distribution management system of a company. It provides the link between production facilities and markets. It is concerned with decisions related to distribution planning, vehicle routing and scheduling, assigning customers to warehouses, designing optimal delivery patterns, etc. The emphasis in the field has been traditionally placed on analyzing logistical problems at the intercity, rather than the intracity , urban level (8).
One of the most important problems in the field is the vehicle routing problem (VRP)-assigning deliveries to trucks on the basis of demand and truck capacity, and determining the order in which deliveries should be made. The computerized procedures used are from the field of operations research (9, 10) with several commercial implementations currently available (11,12). A key input variable in VRP software is the transportation cost matrix, the distances and travel times between various locations in the system such as production facilities, warehouses, and final destinations.
The assumed travel cost matrix has to be accurate because travel cost minimization is usually the objective of most logistical problems. The lack of digital information on network structure has forced in the past the estimation of lravt:l uistance using paper maps, a labor-intensive procedure prone to
TRA NSPOR TA TION RESEARCH RECORD 1305
several human errors . In an urban environment , it can be difficult to estimate with accuracy on a map the distance between various location points. There is a multitude of paths or routes between any two points, and identifying the shortest path without the use of a computer can be a lengthy process.
Another problem with VRP software is the lack of mapping capabilities. Ease of use and understanding of the results would be greatly enhanced if the delivery routes were shown on the screen over the actual map of the area. Although most of the VRP software has some graphics capability, only a few programs can display maps . Those that have this capability (for example, RoadShow) display the map as a background video without giving users the capability to interact with the map.
BENEFITS FROM INTEGRATING GIS TECHNOLOGY IN TRANSPORTATION PLANNING
A GIS is a data base management system (DBMS) capable of storing, retrieving, analyzing, and displaying locational data . It differs from traditional DBMS systems because, in addition to attribute data , it contains information on the geographic location of all elements in the data base. This feature is accomplished by referencing all elements to a common geographic coordinate system. Longitude and latitude, state plane, Universal Transverse Mercator (UTM) and others are some of the coordinate systems used most often. By referencing all data to the same coordinate system, a GIS can relate and analyze different sets of spatial data bases.
Integrated Spatial Data Bases
The storage of all information in a GIS will result in the development of an integrated spatial data base that can be used for a variety of transportation and urban planning purposes. The data base would consist of several independent layers of data, all linked to the same coordinate system. Data should be maintained at the lowest possible level of disaggregation and then readily aggregated as the need arises.
Figure 1 shows the layers of a representative data base for urban transportation planning purposes. There are separate layers for the
• Major arterial and highway network, •Secondary and local streets network, • Rapid transit network, •Bus routes and stations, • TAZ boundaries, and •More disaggregate zonal system boundaries (census tracts
and blocks).
Additional nontransportation-related layers such as elevations and hydrology tables could be added. Or some of the layers could be merged if the additional level of detail is not needed. For example , the four layers of networks could be collapsed into one layer without any loss of information by specifying an appropriate set of attributes for each link such as lanes, slret:l lype, aud whether it is part of a bus route or not.

Prastacos
Major Arterial and Highway Network
secondary/Local Streets
Rapid Transit Network
I I 7 r •
I I [ l I
I I I I I
I I I l 7 7 l r [ . . .
Bus Routes and Stations __ l_~
TAZ Zones
Census Tracts
FIGURE 1 Layers of a GIS data base for transportation planning.
An integrated spatial data base would facilitate the respecification of the T AZ and networks used for policy simulation and forecasting. Currently, the redesign of the TAZ or the coded network systems is a major, labor-intensive project in its own right, often relying on imprecise algorithms and guesswork. Having all the data in a GIS, the design of a new zonal system could be easily done interactively or in an automated way if the GIS has the appropriate operators to aggregate spatial data.
Graphic Representation of the Model Results
GIS systems could also be used to graphically exhibit transportation model results. It is recognized that a "picture may be worth a thousand words ." This saying is particularly true when transportation data are viewed for which the large number of zones and network links makes imperative the extensive postprocessing of results before conclusions can be drawn. With a GIS system in place, the results of an equilibrium assignment or a routing algorithm could be immediately exhibited on the screen, superimposed on the network.
125
Geocoding or Address Matching
Geocoding is the process of determining the geographic coordinates of a point in space on the basis of information about its location . It can be performed using street addresses (if data on address ranges are available), TAZ zones, or other boundary information stored in the GIS. Most of the GISs available today have efficient algorithms for locating street addresses in the transportation network and for interpolating longitude and latitude positions. Once a data base has been assigned geographic coordinates, it can be analyzed to estimate spatial relationships.
The applications of geocoding in transportation planning are numerous . A geocoded parcel file can be easily aggregated to any T AZ or other zonal system. In dial-a-ride and carpooling applications, geocoding can indicate on the map the locations of all riders to be picked up or it can match riders to carpools. In travel surveys, the addresses of the trip ends can be translated to geographic locations and assigned to the appropriate TAZs. Transit agencies can use geocoded address lists for marketing purposes and analysis of ridership.
SOFTWARE CHARACTERISTICS
In order to be useful for transportation planning purposes, a GIS system must have certain characteristics. The most significant of these are described in the following paragraphs.
Vector-Based Information
With networks represented as links and nodes, it is of paramount importance for the GIS to be able to handle vectorbased information. Raster-based GISs are not of use in transportation planning except for a limited type of applications. Ability to efficiently store, retrieve, and graphically display large linear network data bases, interactive communication with the user, and on-screen editing of the network are a few other features that are deemed necessary.
Topology
Ability to handle network topology is another essential feature. Topological data describe the way spatial objects are connected. The topological structure of a transportation network defines the location and connectivity of the various links. On the basis of this information, paths between nodes can be easily estimated. Topology is the distinguishing factor between the GIS and computer-aided design and drafting (CADD) systems. CADD-based maps and networks can indicate arcs and nodes in a graphic way, but cannot tell where· link intersections occur or determine the path between any two points. Additionally, attribute data on a CADD mapping system are stored for display as graphic text and cannot therefore support data analysis.
Integration With Models
Beyond the ability to integrate and efficiently manage spatial data bases, a GIS-based transportation system must also have
126
the capability to support decision making. The objective of transportation planning is to generate and evaluate alternative solutions to the problems of traffic faced in cities . In order to achieve this objective, analytical techniques and models must be incorporated into the GIS framework. There are at least two major different ways for combining transportation models with GIS systems: (a) use the existing urban transportation modeling framework and the GIS independently, and (b) embed a transportation modeling functionality within the GIS.
In the former approach, a set of conversion routines is used to transfer data between the two systems. The GIS generates the necessary input data for the models, which produce solution files to be fed back for display and data base storage to the GIS. The two systems can be tightly or loosely integrated; if tightly integrated, the linkage is transparent to users and the two systems appear as one. An alternative and probably more efficient approach is to embed a transportation modeling functionality within the GIS system. This approach is accomplished by either developing a library of routines that can solve a variety of transportation problems and patching them to the GIS, or implementing in the GIS a set of transportation operators. Users manipulate and combine these operators to design their own models. Although this procedure might be more elegant (13), it does not take advantage of the existing computer code for various transportation problems and requires extensive additions to the GIS.
DATA SOURCES
Availability of digital data bases with information on urban street networks is the crucial factor that will influence the acceptability of GIS technology in transportation planning. A digital data base of a street network should contain two types of information, coordinate data and attribute data, the former to indicate the geographic location of nodes or street intersections and the latter to describe characteristics of the links and the system. Coordinate data are usually a pair of x and y coordinates, whereas attribute data can be numeric or alphanumeric. The set of attribute data in the data base can include a multitude of variables needed to support the intended applications. Street name, number of lanes, capacity, and traffic direction are the most common attributes. For geocoding, address ranges must be stored in the data base, whereas, for pavement maintenance applications, pavement type and condition should also be stored as attributes. The length of the link does not have to be explicitly stored in the data base because it can be estimated from the x and y coordinate pairs of the nodes at the two ends of the link.
Of particular significance for the adoption of GIS systems in transportation planning is the release of the topologically integrated geographic encoding and referencing (TIGER) file by the U.S. Bureau of the Census. The TIGER information system was designed to automate the mapping and related geographic activities required to support the 1990 census and the other survey programs of the census bureau (14,15). The objective of the TIGER development effort was to provide a digital data base that covers all of the United States and includes information on road networks (both Interstate and
TRANSPORTATION RESEARCH RECORD 1305
urban), railroad tracks, major power lines, pipelines, water features (rivers, lakes, and streams), and administrative or statistical areas (states, metropolitan areas, places, census tracts, census blocks).
Extracts from this file are released to the general public and can form the basis for building the base map in a GIS system. The released data files contain separate records for each street segment with information on
• Longitude and latitude of starting and ending points, • Street names, • Address ranges on each side of the street (for urban areas
only), and • Statistical or administrative areas on each side of the street.
This data structure does not explicitly contain data on nodes; however, it provides pointers to easily establish street intersections and identify nodes.
The FHWA sponsored a demonstration project to assess the value of the TIGER data as the base map of a GIS system for traffic management and transportation planning (16). The results have been particularly encouraging. With the appropriate software, TIGER data were used for developing digital data bases of a transportation network suitable for travel demand modeling, geocoding and indicating on a map data bases with information on traffic sign and accident locations, relating T AZ zones to census data, and designing a shortest path evacuation route.
Although TIGER files can provide the basis of a digital network data base, improvements and additions in the files are needed to support various transportation applications. For many urban regions, the TIGER files are outdated, and streets in recently developed areas and missing address ranges have to be added in. The route or street classification must be improved to reflect capacity, as well as street type (Interstate highway, state highway, or local street). Other attribute data such as number of lanes and traffic direction have to be added.
Other sources of digital network data include the digital line graphs (DLG) of the U.S . Geological Survey or files available from commercial vendors (e.g., ETAK). If digital data are not available, they must be digitized or scanned from paper maps. Aenal (photogrammetric) and satellite images are other sources for constructing digital networks. Recent advances in technology that integrate raster and vector graphics permit the drawing of the streets on top of the satellite images. Finally, the emerging technology of the global positioning system (GPS) is particularly useful for quickly identifying the longitude and latitude of any point on the street network.
AVAILABLE SOFTWARE
There are currently several commercial GIS packages and many more are expected to be published in the next few years. Although most of these systems can be used for storing geographic information, not all of them are suitable for transportation analysis purposes. The section below briefly reviews some currently available PC DOS-based GIS systems that can be used for transportation planning and modeling.
Prast a cos
ARC/INFO
This system is the most widely used GIS system available for a variety of computers (mainframes, minicomputers, workstations, and PCs). It is a powerful, command-driven GIS with extensive capabilities for data storage, editing, display, and geographic analysis. It supports transportation modeling in the NETWORK module. This module contains the following procedures of interest to transportation planners:
• ROUTE to determine the shortest path between any pair of nodes,
• ALLOCATE to assign links in the network to the closest center, and
• Geocoding routines to perform address matching.
ARC/INFO was designed as a general GIS system, it is therefore difficult to connect it to the already developed transportation models and algorithms. All transportation models have to be rewritten in the ARC macro language. Shaw (13,17) reported using the ARC macro language for modeling a capacity-restrained traffic assignment. The approach proposed is iterative and becomes prohibitively inefficient when a realworld network with a large number of origin-destination zones is used. Additionally, this procedure cannot handle problems of user equilibrium or stochastic assignment.
Mapinfo, Atlas GISs
Maplnfo and Atlas GISs are menu-based, user-friendly desktop mapping and GIS systems that can store and display street networks and zone boundaries. Both of these packages have sophisticated routines for geocoding, but only limited capabilities for transportation modeling. The proprietary data structure is not topological, hence paths and routes cannot be defined. However, because of their ability to display networks and zones and their ease of use, they can be used to display graphically the results of transportation models estimated outside of these two packages.
SPANS
SPANS (version 5.00) is a menu-driven, user-friendly GIS system with powerful spatial analysis capabilities. It is available on DOS, OS/2, and UNIX platforms. By using the quadtree method for storing information, SP ANS can handle both vector and raster data. It supports a complete topological linear network and is therefore amenable to transportation planning. Networks can be analyzed to model travel distance, travel time, and rate of flow. An optimal routing procedure is included in the system, as well as procedures for gravity modeling. New transportation procedures have to be developed with the SP ANS macro language because existing computer code cannot be easily integrated in the system.
TransCAD
TransCAD is a powerful and easy to use GIS-based transportation package. In contrast to the other software packages
127
mentioned that were developed as general GIS systems, TransCAD was specifically designed to serve as a platform for solving transportation, logistics, and operations research problems. The system, which is available only for PCs, consists of two parts; a GIS engine (available also as a separate product called GIS PLUS) and a toolbox of transportation models and procedures. The GIS engine is menu driven and, in addition to the standard GIS functions, can directly support transportation data structures such as nodes, links, networks, paths, and tours.
For transportation planners, a most significant component of the system is the toolbox, which consists of an expandable set of mathematical models and procedures that can be used for a variety of transportation problems. Version 1.2 of the software includes routines for
• Building networks from a set of links and nodes; • Estimating shortest paths between any pair of nodes (with
or without transfer penalties); • Solving the "traveling saleman" problem (routing and
scheduling); •Performing a traffic assignment (capacity constrained, user
equilibrium, incremental, stochastic); • Spatial interaction modeling (gravity models of the en
tropy type); and • Assigning service stations on a network (arc/node parti
tioning).
TransCAD also provides a platform for users to develop their own transportation-related models. These models can be developed as standalone programs in any DOS-compatible computer language (such as FORTRAN or C) and then linked to TransCAD. This capability is significant because users can easily integrate algorithms they already have without having to recode them in a different language.
Other Modeling Software
There are also other commercial software packages with transportation modeling and graphics capabilities. These packages, which include EMME/2, MINUTP, System II, and others, provide an elaborate implementation of the UTPS models coupled with user-friendly interfaces, graphic editors, and presentation graphics. However, none of these packages is a GIS, that is, possess full geographical and topological capabilities, and therefore none can be used for integrating data from a variety of sources.
SOME APPLICATIONS OF GIS IN URBAN TRANSPORTATION
The use of GIS-based systems for transportation planning is recent and few actual applications have been documented. Simkowitz (3), Lewis (18), and others discuss the use of GIS systems in FHW A and selected state departments of transportation for maintaining highway data bases at the state level. The following section presents some current applications of GIS systems for urban transportation planning and some results of experience in trying to integrate GIS with transportation models.
128
Use of a GIS to Generate Inputs to Transportation Models
Montgomery County, Maryland
The Maryland National Capital Park and Planning Commission (M-NCPPC), in Montgomery County, Maryland, is one of the early users of GIS technology for integrating transportation planning data bases (7, paper in this Record by Anderson). The SPANS GIS software was acquired in 1988 to aid transportation model development and data management. The initial application of SP ANS was to produce thematk (chluropleth) maps of zone level input data to the transportation model used.
The second and more sophisticated application of SP ANS was to provide land use data inputs to a series of subarea planning models. The regional TAZ system of 351 zones used in aggregate transportation planning was considered too coarse for subarea master planning, and evaluation of neighborhood level strategies for transportation system management (TSM). In order to model small areas, a new more detailed zone system was developed and coded to operate with the EMME/ 2 computer transportation modeling software. The land use input data for the transportation model were prepared by SPANS. On the basis of various input data and decision rules, SPANS allocates TAZ forecasts to subzones. The 255,000-record tax assessor parcel file, the digitized file of approved subdivisions, and attribute data for parcels, subzones, and zones are some of the data files maintained and analyzed by SPANS.
Another area in which M-NCPPC anticipates use of SPANS is the analysis of a household travel survey and, more specifically, the time-of-day travel behavior. Thematic and potential mapping techniques will be used to analyze and display the collected data to understand the spatial dimensions of peaking behavior. Potential mapping is a feature of SP ANS that allows users to sample large point data sets to produce contours of equal potential, similar to lines of equal elevation.
Los Angeles Metropolitan Area
The Southern California Association of Governments (SCAG), the planning agency for the Los Angeles metropolitan region, is in the process of developing a land use-transportation model to assess long-term growth patterns. The large volume of data and the need to relate information from different spatial levels necessitated the maintenance of all data under a GIS. ARC/ INFO was chosen as the GIS environment to provide an integrated data base.
The data base includes a variety of information. In addition to several socioeconomic variables for a variety of spatial levels, it includes the digitized master plans of all communities in the region, an accurate representation of the street network, and the exact location _of most employers. Existing land uses will be identified through aerophotography and then digitized and merged with the rest of the data base.
Use of GIS-Based Travel Analysis Models in New York City
The Metropolitan Transportation Authority (MT A) in New York City has used TransCAD since 1989 to support data man-
TRANSPORTA T!ON RESEARCH RECORD 1305
agement, modeling, and decision support for transportation planning. The network data base contains both the highway and subway networks of New York imported into TransCAD with the TCBuild utility. Census tract polygons were also imported into the system together with information on population, income, and other socioeconomic characteristics.
The models in TransCAD are extensively used for a variety of purposes. Transit travel time matrixes are estimated with procedures that consider both link costs and transfer penalties when the links belong to a different line. The transfer penalties represent the expected waiting time for a train or a bus on the target line. Highway travel matrixes are computed with the shortest path algorithms included in TransCAD. Other procedures in TransCAD are used to analyze trip making and forecast future travel patterns.
Integrating a Land Use-Transportation Model With a GIS
The objective of this effort is to combine the POLIS land use-transportation model developed by the Association of Bay Governments (ABAG) with a GIS package. POLIS (19) has been used by ABAG since 1985 to estimate future distribution of population and housing in the San Francisco Bay region. Its major difference from Lowry-based land use models is that future forecasts of jobs and housing location are explicitly affected by the transportation system, as well as housing availability, proximity to employment centers, zonal attractiveness, etc. Because the model is cast as a mathematical programming problem, households and employment allocation and trip flow patterns are estimated in a single iteration and are consistent with each other and the land use constraints.
The integration process consists of two major tasks: (a) combining the model with a GIS package to display the results of the allocation on a map, and (b) developing a GIS data base with all relevant planning information that generates the appropriate inputs for POLIS.
POLIS divides the bay area into 114 zones; however, the majority of the data is maintained at other spatial levels. Uevelopment potential information is available on a project basis, and has to be aggregated at the census tract and then POLIS zone level. Other economic and demographic information is available at the more than 2,000 census tracts, while travel cost data are maintained by the Metropolitan Transportation Commission at the more than 700 traffic analysis zones in the region. A series of ad hoc designed routines are used today for aggregating the data and developing the necessary input files for POLIS. This procedure has not been satisfactory, and often changes that occur at the lower spatial level are not reflected in the inputs for POLIS.
At this point, the focus is on the former task, integrating POLIS with a GIS package. The TransCAD software was selected because it can accommodate the existing model without extensive modifications and rewrites. Presently, the two systems are connected in a loose way through the exchange of files. DOS memory limitations do not permit the operation of POLIS on personal computers. POLIS runs on VAX computers and creates various output files with the results, which are then downloaded to the PC and imported in TransCAD.
Prastacos
POLIS will soon be installed on PCs using 386-specific compilers and a transparent connection will be developed between the two systems.
A GIS-Based Decision Support System for Routing and Scheduling
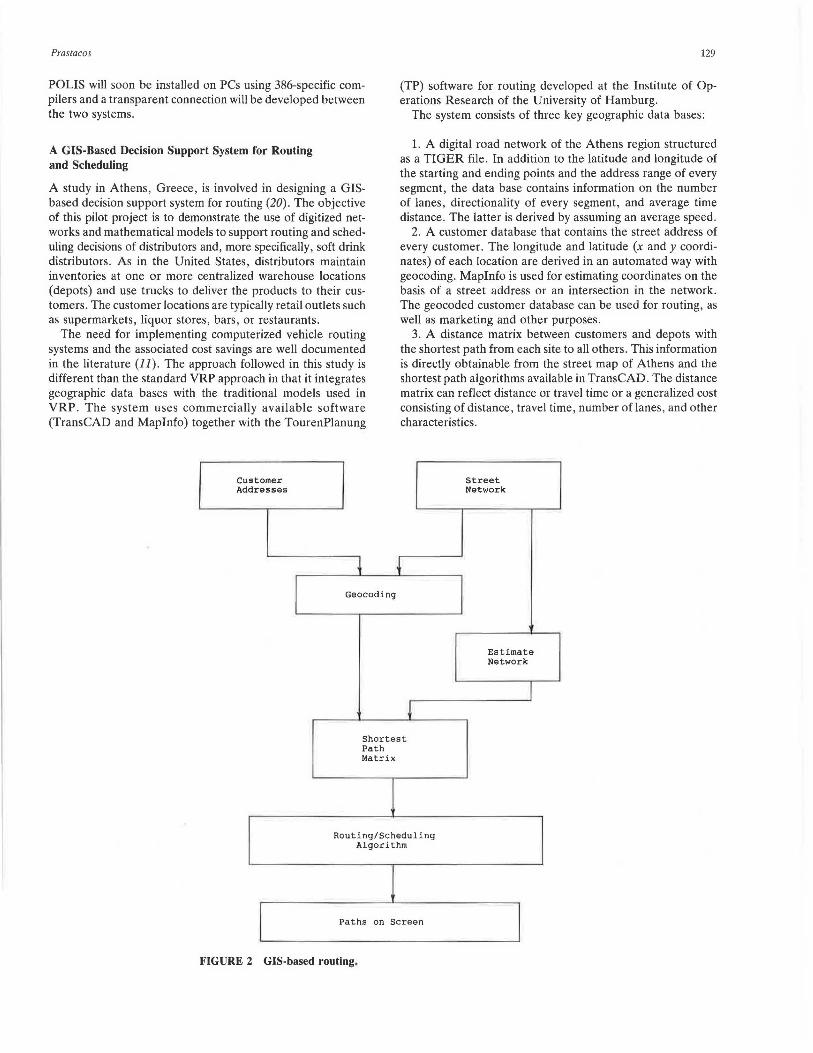
A study in Athens, Greece, is involved in designing a GISbased decision support system for routing (20). The objective of this pilot project is to demonstrate the use of digitized networks and mathematical models to support routing and scheduling decisions of distributors and, more specifically, soft drink distributors. As in the United States, distributors maintain inventories at one or more centralized warehouse locations (depots) and use trucks to deliver the products to their customers . The customer locations are typically retail outlets such as supermarkets, liquor stores, bars, or restaurants.
The need for implementing computerized vehicle routing systems and the associated cost savings are well documented in the literature (11). The approach followed in this study is different than the standard VRP approach in that it integrates geographic data bases with the traditional models used in VRP. The system uses commercially available software (TransCAD and Maplnfo) together with the TourenPlanung
Customer Addresses
Geocoding
129
(TP) software for routing developed at the Institute of Operations Research of the University of Hamburg.
The system consists of three key geographic data bases:
1. A digital road network of the Athens region structured as a TIGER file. In addition to the latitude and longitude of the starting and ending points and the address range of every segment, the data base contains information on the number of lanes, directionality of every segment, and average time distance. The latter is derived by assuming an average speed.
2. A customer database that contains the street address of every customer. The longitude and latitude (x and y coordinates) of each location are derived in an automated way with geocoding. Maplnfo is used for estimating coordinates on the basis of a street address or an intersection in the network. The geocoded customer database can be used for routing, as well as marketing and other purposes.
3. A distance matrix between customers and depots with the shortest path from each site to all others . This information is directly obtainable from the street map of Athens and the shortest path algorithms available in TransCAD. The distance matrix can reflect distance or travel time or a generalized cost consisting of distance, travel time, number of lanes, and other characteristics.
Street Network
4
Estimate Network
! Shortest Path Matrix
Routing/Scheduling Algorithm
Paths on Screen
I FIGURE 2 GIS-based routing.
130
In addition to these geographic data bases, there are data bases that contain information on the product demand for every customer (assumed to be known), fleet composition (number and capacity), and time windows for deliveries (that is, time intervals during which customers must be served), etc.
A key aspect of the complete system is the algorithm for assigning customers to delivery vehicles and then computing the sequence of deliveries. The VRP has been studied extensively and several heuristic algorithms have been proposed for its solution (10). However, most VRP formulations make simplifying assumptions by ignoring some of the constraints that frequently occur in practice (e.g., different types of vehicle, more than one route per vehicle, and time windows).
The TP software from the University of Hamburg selected for solving the routing problem (21) provides a system for simulating real-world routing decisions and its source code was made available to this project. The TP software is the result of an extensive research effort between the Institute of Operations Research and several companies in West Germany to design routing software that addresses most of the constraints encountered in practice.
The TP software can handle constraints related to
•Fleet composition (number, types); •Fleet capacity (as a function of volume or weight); • Time window constraints on deliveries; • Multiple delivery routes per vehicle per day; and • Constraints on the customers assigned to a particular
vehicle.
The TP software was integrated as a special procedure in TransCAD and the two systems work together. The sequence of operations in the complete system is shown in Figure 2. After geocoding the customer data base, the coordinate file is passed to TransCAD. Users specify the customers for whom delivery must be scheduled and TransCAD computes the cost (as distance or generalized cost) matrix and prepares the necessary input files for the routing algorithm. The results of the algorithm are stored in a data base, passed back to TransCAD, and exhibited on the screen.
CONCLUSIONS
The use of GIS technology is starting to be explored in urban transportation planning. This paper has presented some of the difficulties faced today and the benefits arising from the use of GIS systems. The few attempts made to use a GIS for modeling have demonstrated the power of the GIS to integrate data bases and to support decision making. With the emergence of powe.rful software geared to transport<ltion professionals and the availability of digital network data, GIS systems will be more widely used for transportation analysis.
A<.::KNOWLEUGMENTS
Part of this research was performed while the author was employed by the Association of Bay Area Governments. The author acknowledges the advice of Yiannis Paraschis and Manolis Diamandakis.
TRANSPORTA T!ON RESEARCH RECORD 1305
REFERENCES
1. P. Burroughs. Principles of Geographical Information Systems. Clarendon Press, Oxford, England, 1986.
2. Proc., 1987, 1988, and 1989 Annual UR/SA Conferences. URISA, Washington, D.C., 1989.
3. H. Simkowitz. Transportation Applications of Geographical Information Systems. Computers, Environment and Urban Systems. Vol. 12, No. 4, 1988, pp. 253-271.
4. T. L. Nyerges and K. J. Dueker. Geographic Information Systems in Transportation. Technical report, Office of Planning, FHWA, U.S. Department of Transportation, 1988.
5. M. Bacon and D . Moyer. Proc., 1990 Geographic Information Systems (GJS) for Transportation Symposium. AASHTO, Washington, D.C., 1990.
6. R. Cervero. Suburban Gridlock . Center for Urban Policy, New Brunswick, N.J., 1986.
7. M. Replogle. Integration of a Geographic Information System With Computer Transportation Models for Land Use and Transportation Planning. Proc., 2nd Conference on Application of Transportation Planning Methods, University of North Carolina, Charlotte, 1989.
8. D. Bowersox, D. Closs, and 0. Helferich. Logistical Management. Macmillan, New York, N.Y., 1986.
9. T. L. Magnanti. Combinatorial Optimization and Vehicle Fleet Planning: Perspectives and Prospects. Networks, Vol. 11, 1981, pp. 179-216.
10. B. Golden and A. Assad (eds.). Vehicle Routing: Methods and Studies. North Holland, Amsterdam, the Netherlands, 1988.
11. R. Schmonsees . Computerized Vehicle Routing Comes of Age. The Private Carrier, Vol. 23, No . 11, 1986, pp. 29-33.
12. J.M. Hooban. Marketing a Vehicle Routing Package. In Vehicle Routing: Methods and Studies, B. Golden and A. Assad (eds.), North-Ilolland, Amsterdam, 1988, pp. 447 468.
13. S. Shaw. Design Considerations for a GIS-based Transportation Network Analysis System. In Proc., GISILJS '89, Vol. 1, American Congress on Surveying and Mapping, Washington, D.C., 1989, pp. 20-29.
14. R. Marx. The TIGER System: Automating the Geographic Structure of the United States Census. Government Publications Review, Vol. 13, 1986, pp. 181-201.
15 . LaMachia, 1990. The TIGER File and Transportation Issues. In Proc., 1990 Geographic Information Systems for Transportation Symposium, M. Bacon and D . Moyer (eds.), AASHTO, Washington, D.C., 1990, pp. 77-87 .
16. J. Fleck and H. Simkowitz. Using the Census TIGER File for Transportation Planning: Results from a FHW A Demonstration Project. Proc., 2nd Conference on Application of Transportation Planning Methods, University of North Carolina, Charlotte, 1989.
17. S. Shaw. GIS as Decision Support Tools in Transportation Analysis. In Proc., 1989 ESRI User Conference, ESRI, Redlands, Calif., 1989.
18. S. Lewis. The Use of GIS in the Fe.cle.ral Highway Administration's Office of Policy Development. In Proc., 1990 Geographic Information Systems (GJS) for Transportation Symposium, M. Bacon and D. Moyer (eds.), AASHTO, Washington, D.C., 1990, pp. 53-62.
19. P. Prastacos . Urban Development Models for the San Francisco Region: From PLUM to POLIS. In Transportation Research Record 1046, TRB, National Research Council, Washington, D.C., 1986, pp. 37-44.
20. P. Prastacns ancl Y. Paraschis. A GIS-based Decision Support System for Transportation Logistics. Proc., 2nd European Conference on GIS. EGIS Foundation, Utrecht, the Netherlands, 1991.
21. B. Fleischmann. The Vehicle Routing Problem With Multiple Use of the Vehicles . Working Paper , University of Hamburg, Institute fur Unternehmensfarschung, Hambu1g, Gt:1111any, 1990.
Publication of this paper sponsored by Committee on Transportation Data and Information Systems.


