

Intelligent meter and ITK I iti ti f th ft t lKey Initiatives for theft control
BSES ExperienceArvind Gujral, Head (Operation), BSES Delhi
AFRICA UTILITY WEEKd h22nd to 24th May-2012
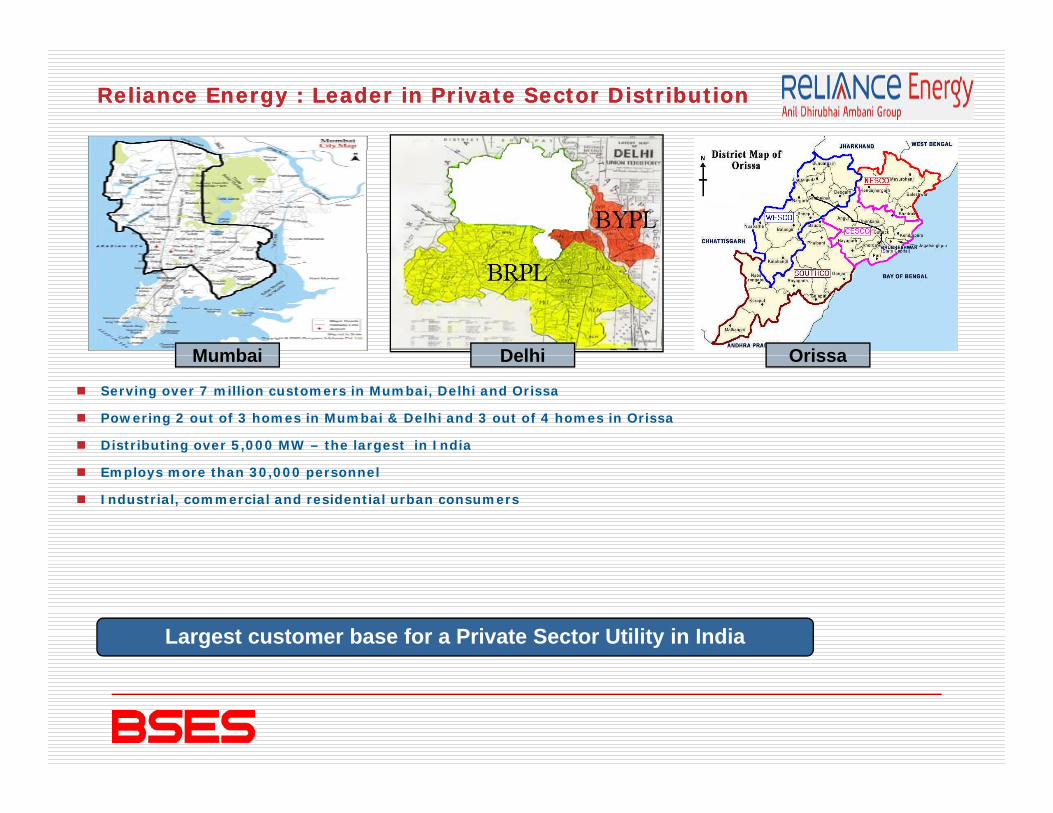
Reliance Energy : Leader in Private Sector DistributionReliance Energy : Leader in Private Sector Distribution
Mumbai Delhi Orissa
Serving over 7 million customers in Mumbai, Delhi and Orissa
Powering 2 out of 3 homes in Mumbai & Delhi and 3 out of 4 homes in Orissa
Distributing over 5,000 MW – the largest in India
Mumbai Delhi Orissa
Employs more than 30,000 personnel
Industrial, commercial and residential urban consumers
Largest customer base for a Private Sector Utility in India
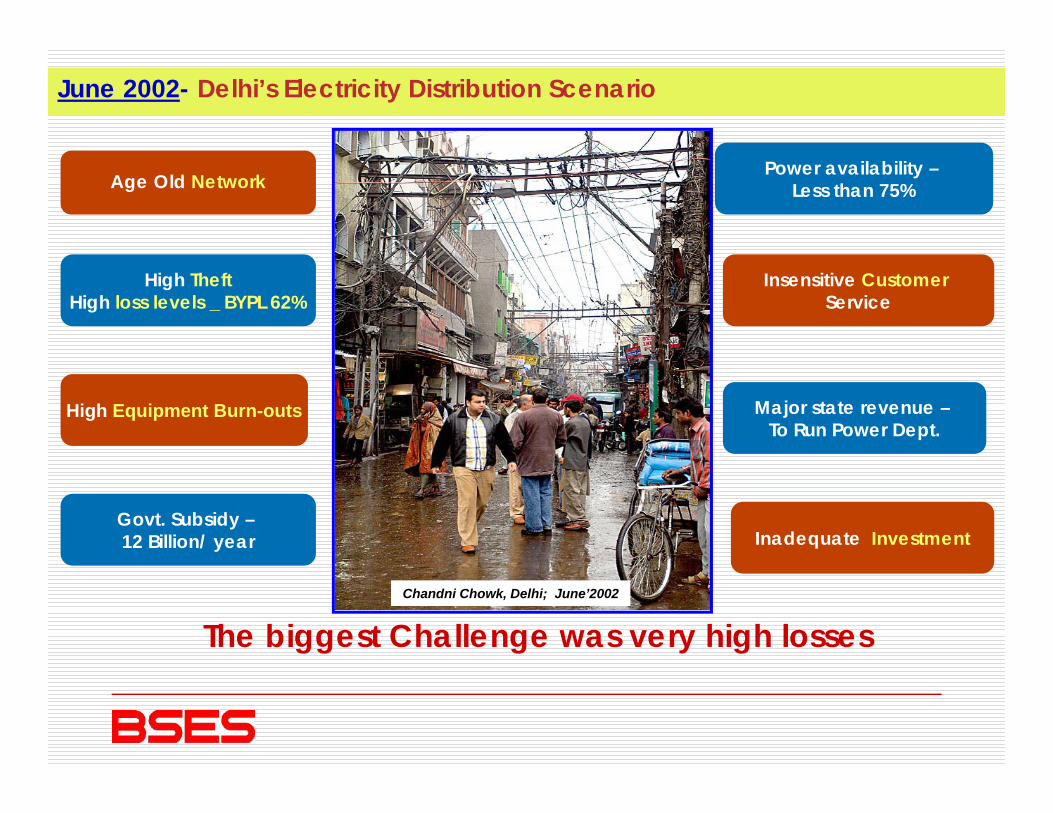
June 2002- Delhi’s Electricity Distribution Scenario
Age Old NetworkPower availability –
Less than 75%
Insensitive CustomerService
High TheftHigh loss levels _ BYPL 62%
Major state revenue –To Run Power Dept.
High Equipment Burn-outs
Inadequate InvestmentGovt. Subsidy –12 Billion/ year
The biggest Challenge was very high losses Chandni Chowk, Delhi; June’2002

BSES Delhi Discoms – A Synopsis
Reliance Infrastructure Ltd. acquired 51% stake in July
NDPLNDPL
BRPLBYPL
acquired 51% stake in July 2002 in two out of three
Discoms
SN Particulars Unit BSES Delhi Discoms
MES NDMC
1 Area sq. km 950
2 Total Registered Customers Million 2.83 Peak Demand MW 3350
4 Consumption per year MU 17,500
5 Employees Nos. 7,218
6 Customer Density Cons/sq km 2,964
7 Revenue( as per ARR 2011-12) Billion USD 1.44
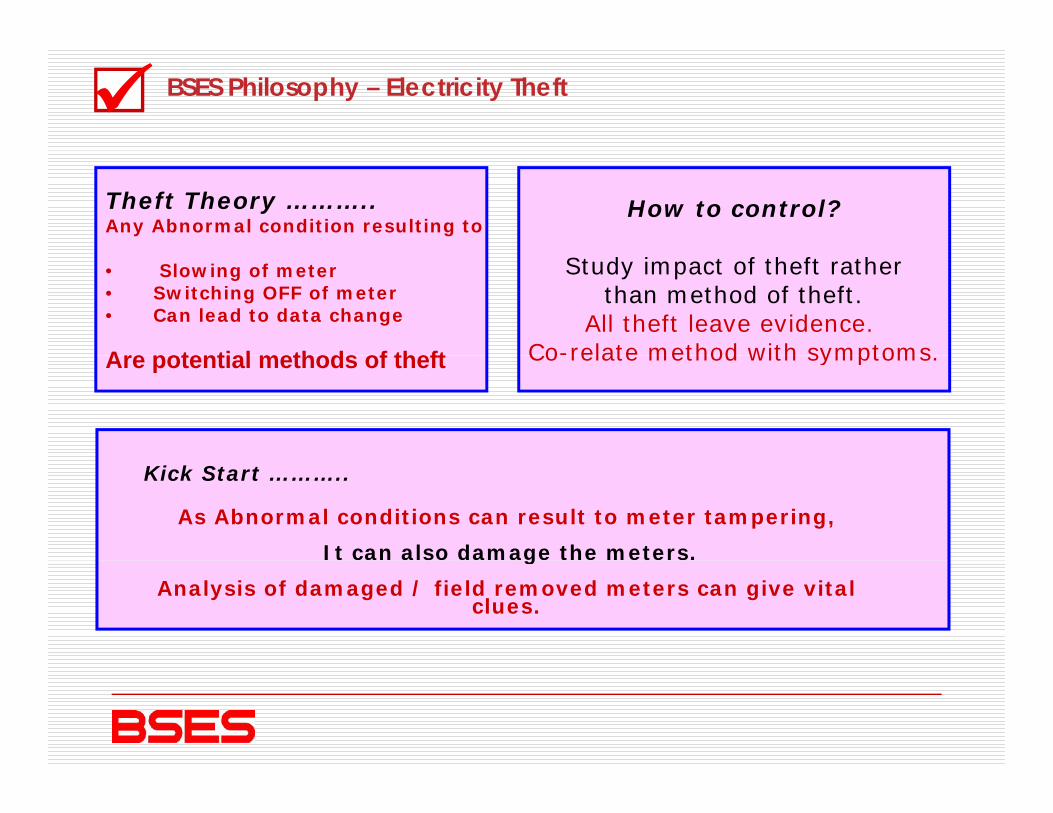
BSES Philosophy – Electricity Theft
How to control?Theft Theory ………..Any Abnormal condition resulting to
Study impact of theft rather than method of theft.
All theft leave evidence. Co-relate method with symptoms
• Slowing of meter• Switching OFF of meter• Can lead to data change
Are potential methods of theft Co relate method with symptoms.Are potential methods of theft
Kick Start ………..
As Abnormal conditions can result to meter tampering,
It can also damage the meters.g
Analysis of damaged / field removed meters can give vital clues.
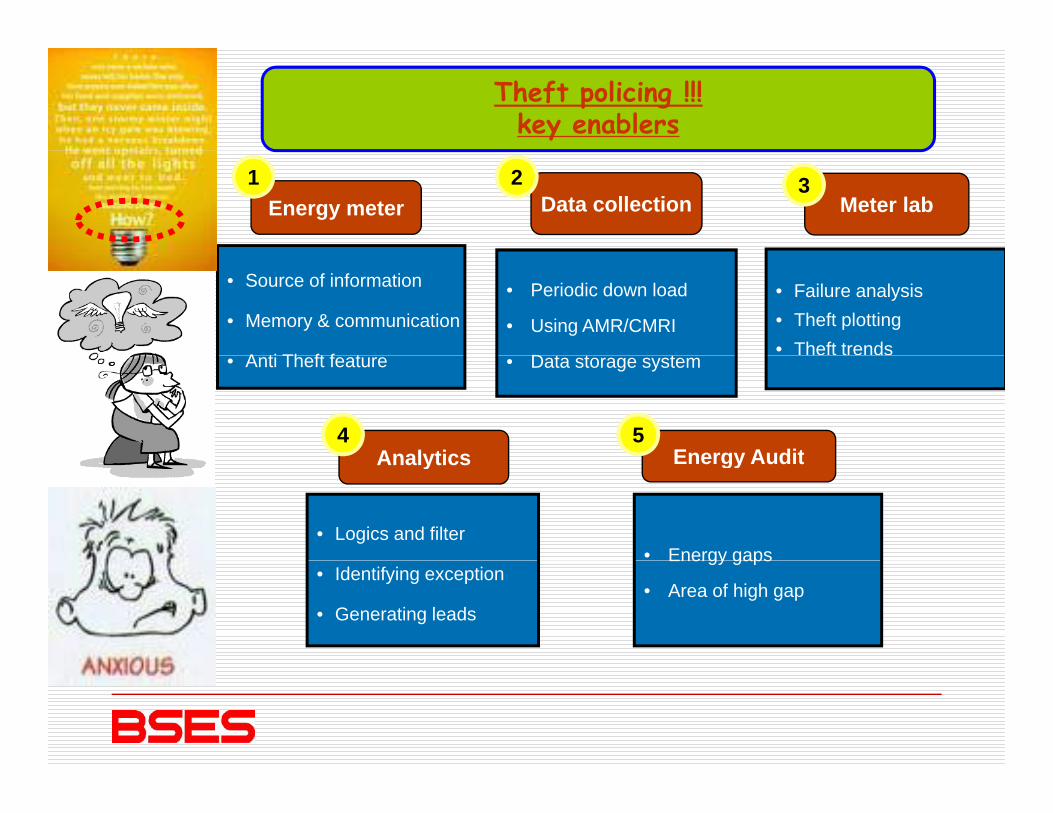
Theft policing !!! key enablers
Data collectionEnergy meter Meter lab1 2 3
• Periodic down load
• Using AMR/CMRI
D t t t
• Source of information
• Memory & communication
A ti Th ft f t
• Failure analysis• Theft plotting• Theft trends
• Data storage system• Anti Theft feature
Analytics4
Energy Audit5
Analytics
• Logics and filter
Energy Audit
• Energy gaps• Identifying exception
• Generating leads
Energy gaps
• Area of high gap
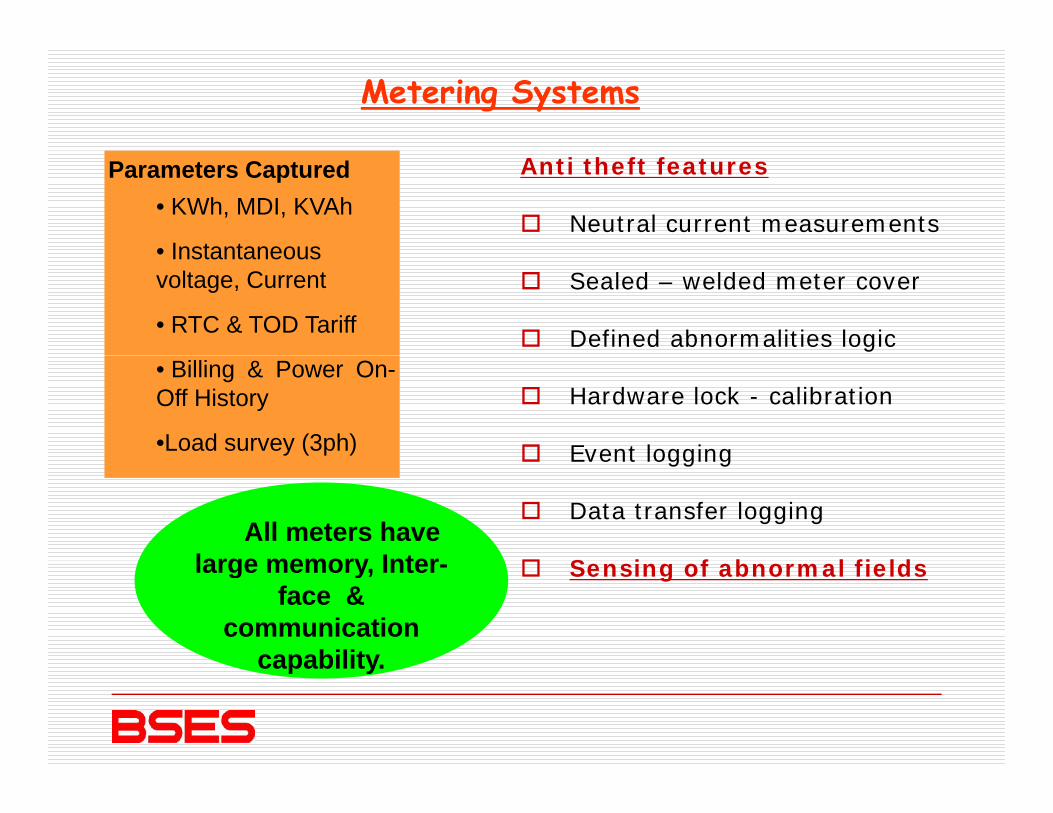
Metering Systems
Anti theft features
Neutral current measurements
Parameters Captured• KWh, MDI, KVAh
• InstantaneousSealed – welded meter cover
Defined abnormalities logic
• Instantaneousvoltage, Current
• RTC & TOD Tariff
Hardware lock - calibration
Event logging
• Billing & Power On-Off History
•Load survey (3ph) Event logging
Data transfer logging
S i f b l fi ldAll meters have
large memory Inter Sensing of abnormal fieldslarge memory, Inter-face &
communication capabilitycapability.
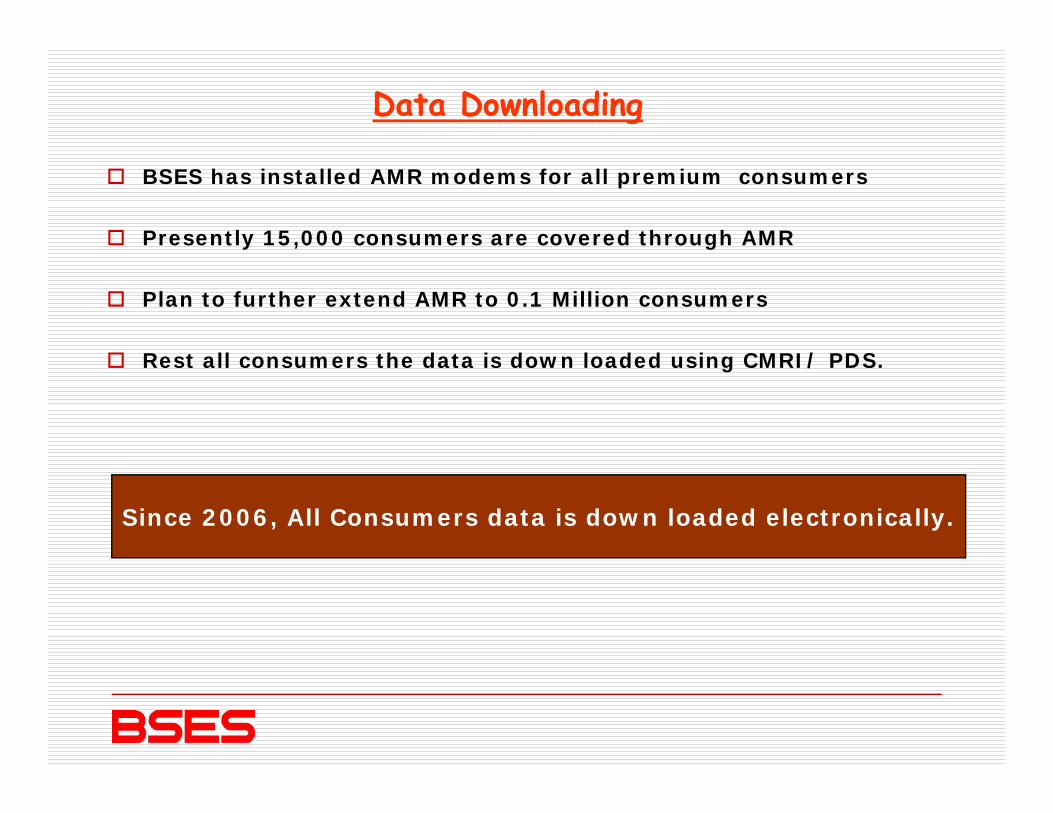
Data Downloading
BSES has installed AMR modems for all premium consumers
Presently 15,000 consumers are covered through AMR
Plan to further extend AMR to 0.1 Million consumers
R t ll th d t i d l d d i CMRI/ PDSRest all consumers the data is down loaded using CMRI/ PDS.
Since 2006, All Consumers data is down loaded electronically.

Meter Test Lab
100% removed meter are tested in meter lab
Cause of failurePhysical condition
Accuracy
Cause of failure
Trend of failure
Functionality
Data down load
In front of consumers
Identify man made failure
Evidence - prosecution
Meter Photograph
Meter Test reportRating of consumers
Tracking movements
Meter Test report
Preventive action
Both lab NABL

Failure analysis Theft plotting
Meter Failure Analysis And Plotting The Theft Methods
Plotting theft on map
Sealing in b
Failure l i
Identifyi Feed backRemoval f
Cluster 1
Method A
bag analysis)
ng theftof meter
Cluster 5
Case 244
Method B
Case 1356Cluster:
Method D
Cluster 3
High A,DCluster 4
Method CCluster 8
Method D233 ases
Cluster
Method CCluster 7
Mrthod D
Method D
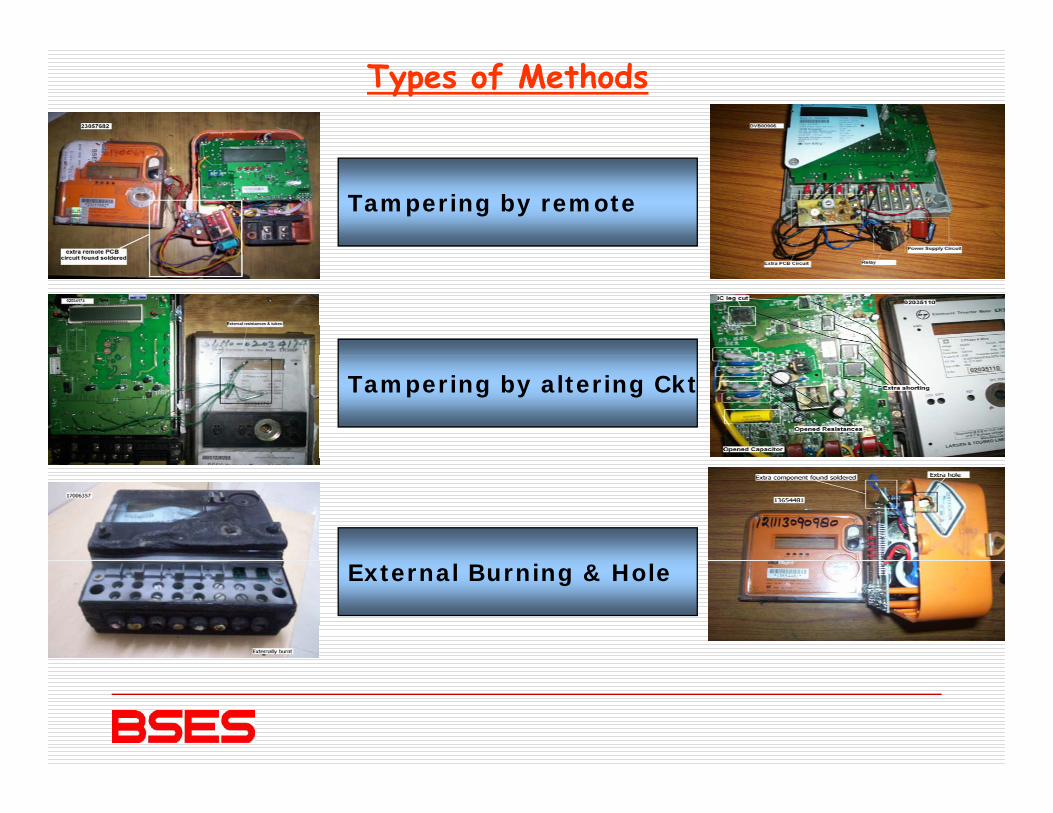
Types of Methods
Tampering by remote
Tampering by altering Ckt
External Burning & Hole

By External Methods By External Methods Tampering DevicesTampering Devices
Hi h T l fi ldHigh Tesla field
Remote control
High Frequency – RF field
High Voltage – Ignition coils
Spark Gun
Rare Earth magnet

M t Data
Theft Control Mechanism
Meter AnalyticsData download
Field removed
Meter S ifi ti Theft
removed meter
Specifications Theft plotting
Meter Lab- Analysis forfailure causes
Theft
leads
d
Theft method
Designing anti-theft features
Meter Technical Team
Energy Audit-High Gap
areas
Enforcement Cell

Effect of theft method
Anti Theft Feature In Meter
method
Immunity No effect
Anti Event
loggingDetection of
eventTheft
method
gg g
Direct Symptoms
Used Analytics Cell
event
Symptoms Cell
Helps to analytics
Indirect symptoms –
Addl analyticsAddln parameters
Use deterrent mode – check legality
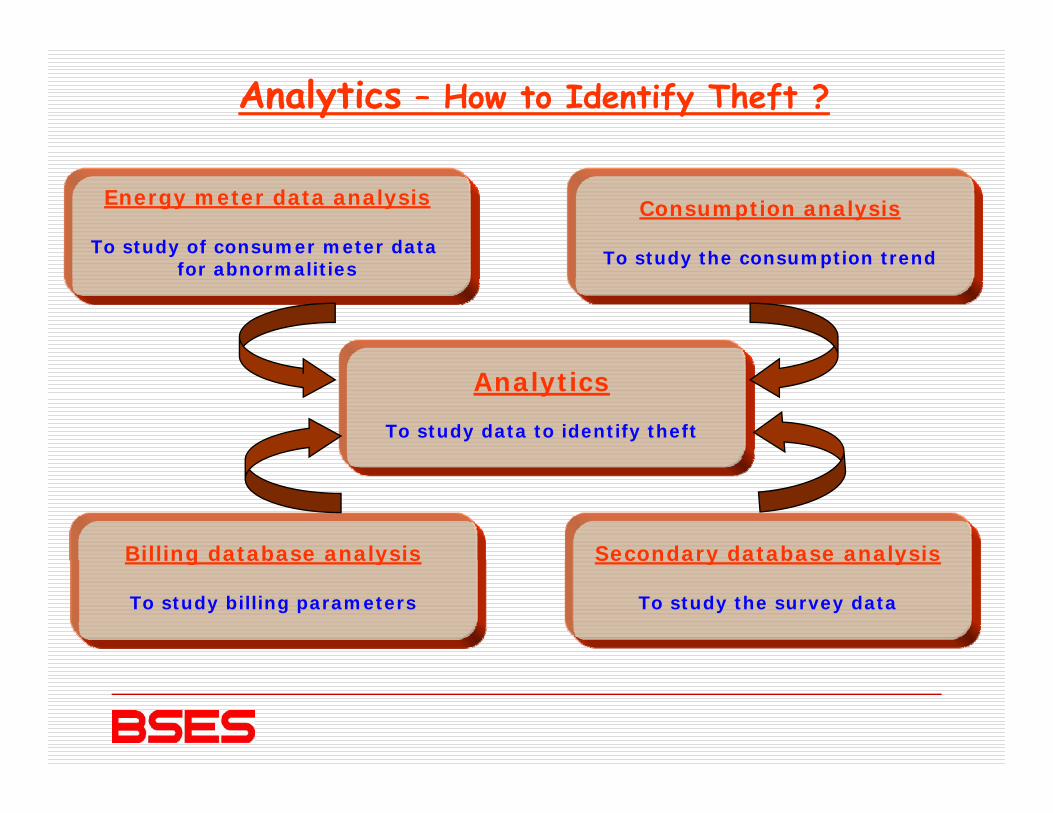
Analytics – How to Identify Theft ?
Energy meter data analysis
To study of consumer meter data
Consumption analysis
T t d th ti t dTo study of consumer meter data for abnormalities To study the consumption trend
Analytics
To study data to identify theft
Billing database analysis Secondary database analysisBilling database analysis
To study billing parameters
Secondary database analysis
To study the survey data
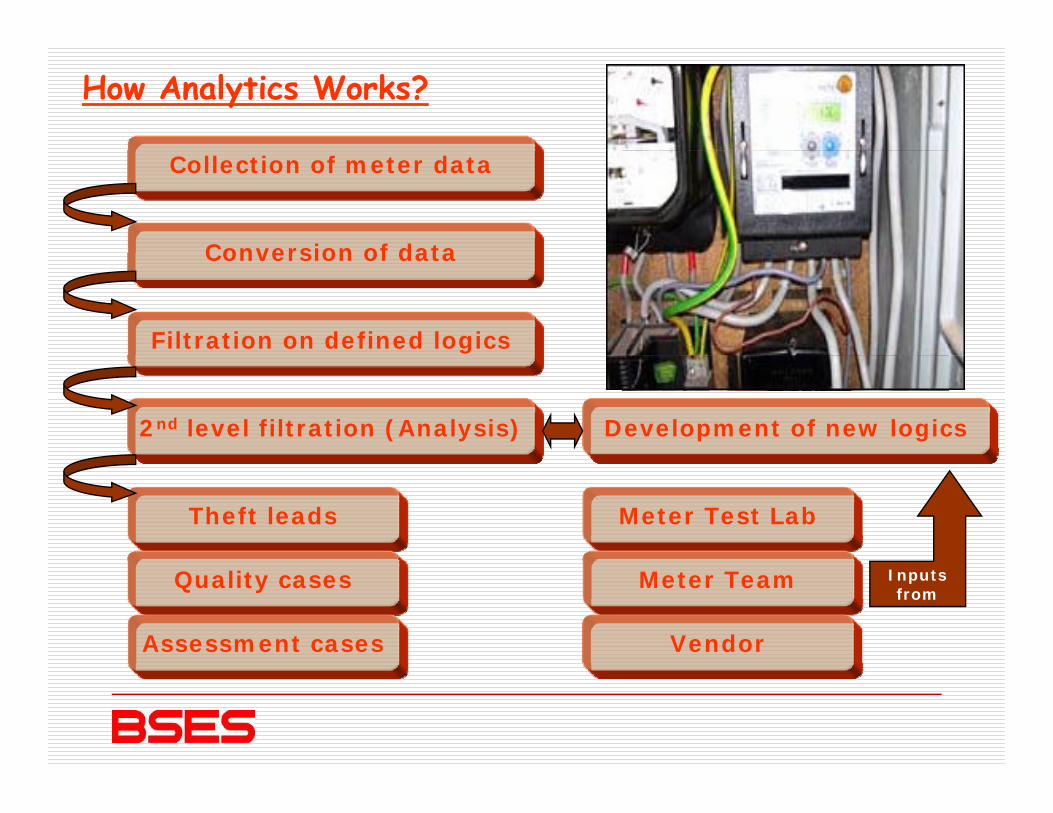
How Analytics Works?
Collection of meter data
Conversion of dataConversion of data
Filtration on defined logics
2nd level filtration (Analysis) Development of new logics
Theft leads Meter Test Lab
Quality cases
Assessment cases
Meter Team
Vendor
Inputsfrom
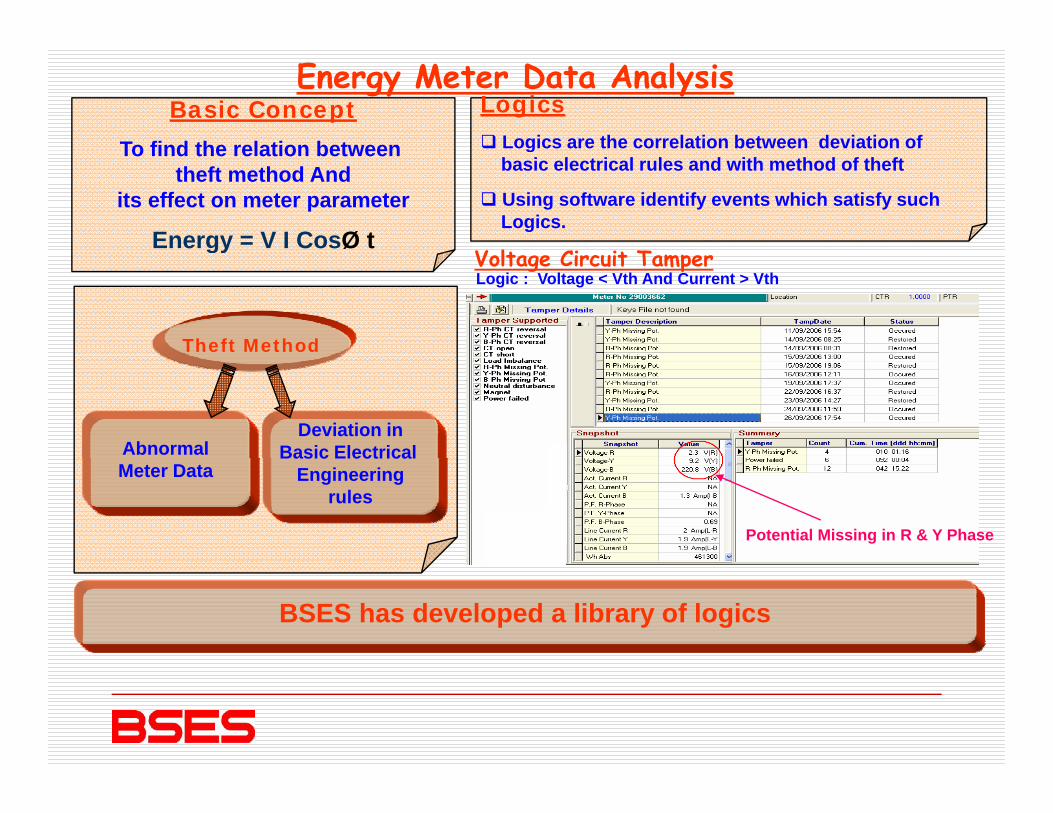
Basic Concept
To find the relation between
LogicsLogics are the correlation between deviation of
Energy Meter Data Analysis
To find the relation between theft method And
its effect on meter parameter
Energy = V I CosØ t
gbasic electrical rules and with method of theft
Using software identify events which satisfy suchLogics.
V lt Ci it Tgy
Theft Method
Voltage Circuit TamperLogic : Voltage < Vth And Current > Vth
AbnormalDeviation in
Basic ElectricalMeter Data
Basic Electrical Engineering
rules
Potential Missing in R & Y Phase
BSES has developed a library of logics

Billing pattern study
B t d t dConsumption Graph Year-2008
By trend studymonth by month
0100200300400500
KWH Units
Year-2009
Fall in consumption in same 0
Jan
Feb
Mar
Apr
May Jun
Jul
Aug
Sep
Oct
Nov
DecMonth
Fall in consumption in same month for different year
By trend studyof 24 hrs.
Domestic consumer, but no Consumption in night hours.
Predefined ratio of consumption / MD for different categoryDomestic : 96 units/ MDCommercial : 165 units / MDIndustrial : 150 units / MD

T t d th t l ti / d fi d b h k
Consumption Analysis
Benchmarking
To study the actual consumption v/s predefined benchmarks
By Survey By Grouping
Hotels Industry ….. BTS ATM …..y ….. …..
AC Rooms I d t T
Benchmark decided by the average consumptionAC Rooms
OccupancyAmbience---------
Industry TypeWorking Hrs.---------
of similar type of consumers
* Wide variation found in different hotels.* Consumption of CNG pumps in Mumbai found double as compare to Delhi.
Secondary data collected from various sources.
Secondary Data Analysis
The data available in the secondary data are reconciled in billing database to conclude unbilled cases.
For example , through internet sites of Reserve bank of India & all For example , through internet sites of Reserve bank of India & all other banks operating in India, list of all bank branches operating in our service area was obtained.
This list was reconciled with the billing database to confirm that all b k b h b i bill dbank branches were being billed.
To our surprise we found around 1% of the bank branches were not in the billing net.
Secondary data analysis – a useful tool for tariff misuse
Logics development is a continuous exercise
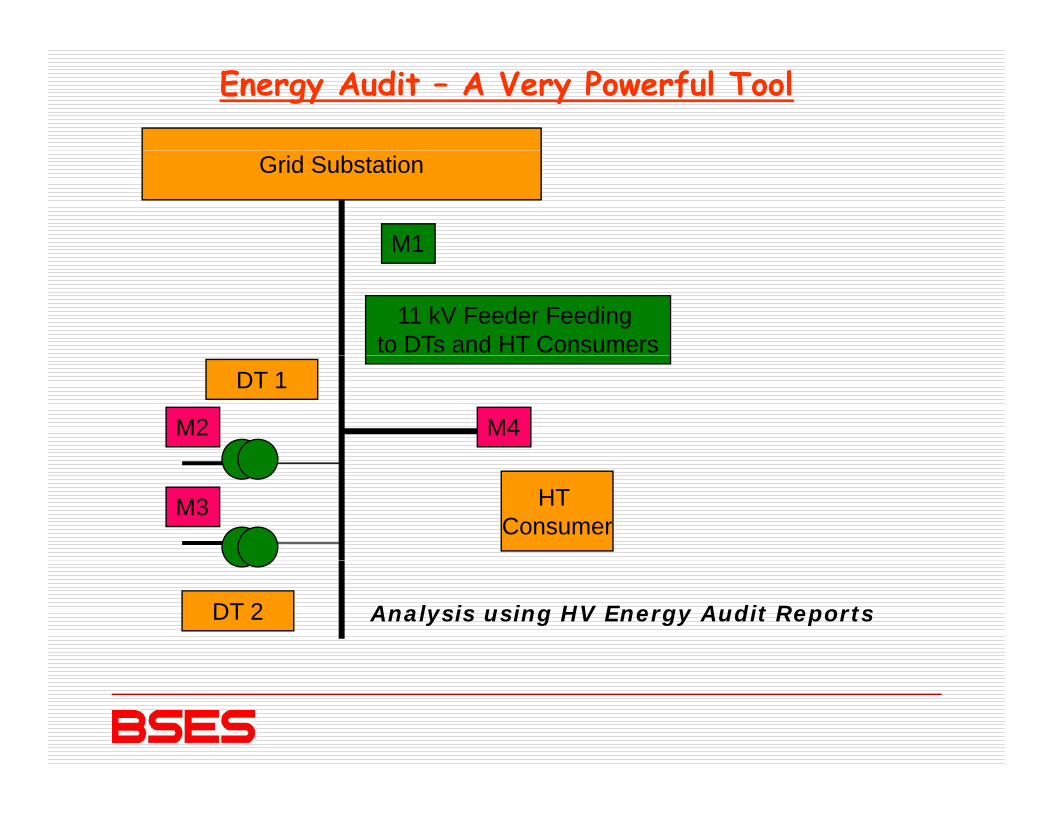
Energy Audit – A Very Powerful Tool
Grid Substation
M1
11 kV Feeder Feeding to DTs and HT Consumers
M4
DT 1
M2
M3 HT Consumer
Analysis using HV Energy Audit ReportsDT 2
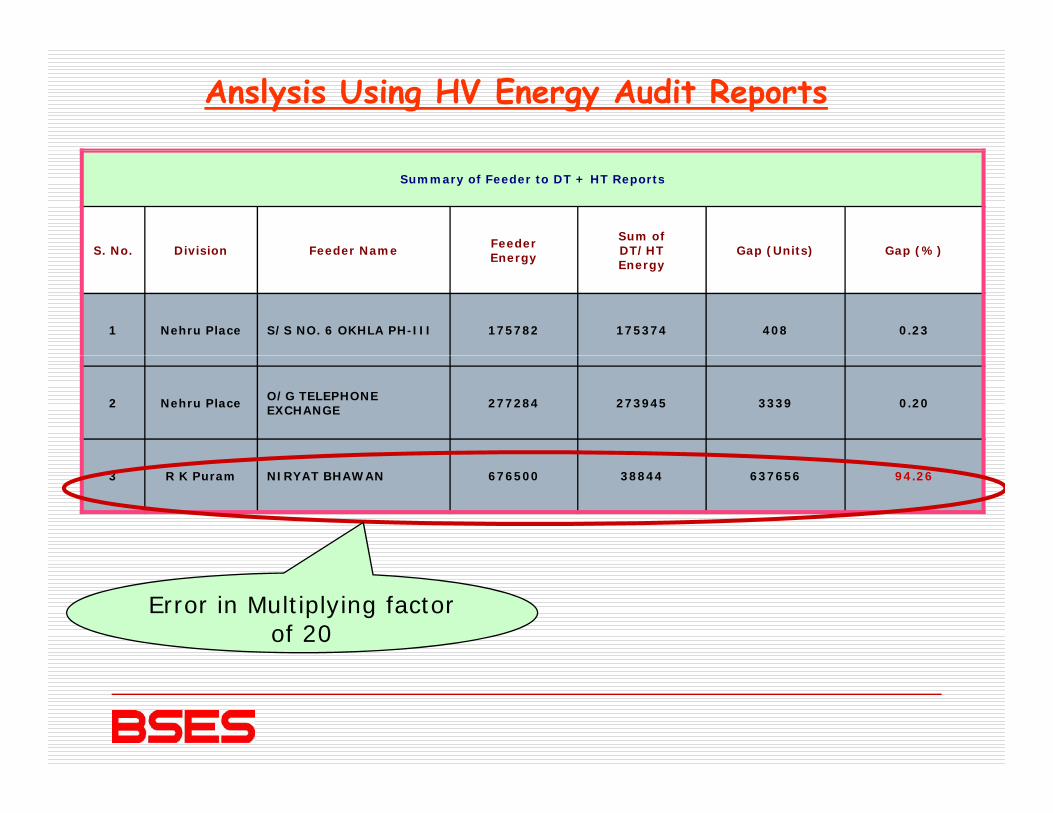
Anslysis Using HV Energy Audit Reports
Summary of Feeder to DT + HT Reports
S. No. Division Feeder Name Feeder Sum ofDT/HT Gap (Units) Gap (%)S. No. Division Feeder Name Energy DT/HTEnergy
Gap (Units) Gap (%)
1 Nehru Place S/S NO. 6 OKHLA PH-III 175782 175374 408 0.23
2 Nehru Place O/G TELEPHONE EXCHANGE 277284 273945 3339 0.20
3 R K Puram NIRYAT BHAWAN 676500 38844 637656 94.26
Error in Multiplying factor of 20

Secondary Data Analysis
26 no. flats indulged ini di t lusing direct supply

Electricity Theft Policing - BSES
Detection
Action (Raid)Prevention
ProsecutionProsecution

AT&C Loss Reduction Performance
BSES DELHI BYPL BRPL
61.88
54.29
47.445 06
43.8850.12
50.00
60.00
70.00
Year analytics initiative was
started
29.5
23.2211
45.0640.64
35.53
29.9227.1
211
39.03
30.00
40.00
50.00 started
21.1 1921.1 19.217
10.00
20.00
2002-03 2003-04 2004-05 2005-06 2006-07 2007-08 2008-09 2009-10 2010-112002 03 2003 04 2004 05 2005 06 2006 07 2007 08 2008 09 2009 10 2010 11
AT&C Loss in % including collection efficiency

Any Queries ?
ThanksGraciasObrigadoThanks
Arvind Gujral91-11-39999959, Mobile - 0091 9350718353
E il i d j l@ li dEmail: [email protected]


