
Eastern Education Journal Vol 42(1) Winter 2013-2014
pp 3 - 29
3
IB SCIENCE TEACHERS’ CHOICES
International Baccalaureate Science Teachers’ Choices in Curriculum and Instruction
January 15, 2012 Lanett S. Jauss PhD
North Kansas City High School Home: 109 E. 12th St.
Higginsville, MO 64037 660-422-1298
Lloyd Barrow University of Missouri
321 Townsend Hall Columbia, MO 65211
573-882-7457 [email protected]
Research
This research has been published as part of a dissertation but not in an article in a journal.
Eastern Education Journal Vol 42(1) Winter 2013-2014
pp 3 - 29
4
ABSTRACT
This study was designed to investigate the choices International Baccalaureate (IB)
science teachers make for Internal Assessment (IA). Data was gathered via a survey of IB
science teachers. Their responses were analyzed based upon the teachers’ demographics. IB
science teachers use a variety of IA activities, with hands-on activities and worksheets being
most common. They do not emphasize inquiry although some aspects are included. They prefer
to use activities designed by themselves or other teachers.
Key Words
International Baccalaureate, internal assessment, inquiry

Eastern Education Journal Vol 42(1) Winter 2013-2014
pp 3 - 29
5
Introduction
Increased rigor in curriculum is a continuous focus among researchers, educators,
parents, politicians, and the public. Literacy in educational areas such as reading, mathematics,
and science is constantly being examined. Although some urge that caution should be used when
comparing United States curriculum and practices globally, there is a move “toward a common
yardstick.” (Cavanaugh, 2009) In this age of concern for increased rigor, literacy, and the
positive social and intellectual development of our students, there is one curricular program that
has gained increased recognition as fulfilling many of the aspects deemed essential for a quality
program. This program is the International Baccalaureate (IB) program. The International
Baccalaureate Organization (IBO) website states,
“The International Baccalaureate® (IB) is a non-profit educational foundation,
motivated by its mission, focused on the student. Our three programmes for students
aged 3 to 19 help develop the intellectual, personal, emotional and social skills to
live, learn and work in a rapidly globalizing world. Founded in 1968, we currently
work with 3,371 schools in 141 countries to develop and offer three challenging
programmes to over 1,010,000 students aged 3 to 19 years.” (“About the
International Baccalaureate,” n.d.)
Their mission statement is:
The International Baccalaureate aims to develop inquiring, knowledgeable and
caring young people who help to create a better and more peaceful world through
intercultural understanding and respect. (International Baccalaureate, 2005-2007,
Mission, p. 1)
Currently there are 762 IB diploma high schools in the United States and its territories.
The IB program is a high school diploma program which, along with a core of six
subjects, science, mathematics, history, communication arts, fine arts, and foreign
language, requires all students to complete three additional components. These include:
an extended essay about a research topic of their choice; a theory of knowledge (TOK)
class; and a creativity, action, and service (CAS) component where students volunteer in
various programs and community activities. Along with the separate TOK class, there
are TOK objectives included in each of the six subject areas. IB teachers are encouraged
Eastern Education Journal Vol 42(1) Winter 2013-2014
pp 3 - 29
6
to teach some of the objectives while others are a required part of the tested curriculum.
These objectives lend themselves to more open-ended discussions in student inquiry.
IB science includes biology, chemistry, and physics. Curriculum within each group
includes: major topics of study; options which explore these topics in more depth; and Internal
Assessments (IA). The IA is the practical laboratory work students complete under the direction
of their teacher. Students complete between forty and sixty hours of activities which support the
topics of the course. At the end of the course students complete a culminating examination
which assesses their knowledge of the curriculum area. Part of students’ final score is based
upon their completion of the IA portion which includes a minimum of two open inquiries.
Support is widespread that students should experience inquiry in science classrooms
(Lunetta et al., 2007), although there are disagreements about definitions for inquiry (Asay &
Orgill, 2010; Minner, Levy, & Century, 2010) and different styles of inquiry are found in the
literature (Asay & Orgill, 2010). One of the aims of the IB program is to “develop inquiring
minds” (International Baccalaureate 2005-2007) in students and one of the main focuses of
current reform in science education is to integrate inquiry-based practices in science classrooms
(National Research Council [NRC], 1996, 2002). This research focuses upon the choices IB
science teachers make regarding inquiry. This study was conducted prior to the release of the
frameworks for K-12 science (NRC, 2011).
Review of Literature
Rigorous science curriculum has gained increased focus since the No Child Left Behind
(NCLB) Act (2002) was signed into law. One component of the act is to provide for the
improved academic achievement of students by encouraging educational entities to “develop
more rigorous mathematics and science curricula that are aligned with challenging state and local

Eastern Education Journal Vol 42(1) Winter 2013-2014
pp 3 - 29
7
content standards and with the standards expected for postsecondary study in engineering,
mathematics, and science” (NCLB, 2002, p. 1643).
“Engaging students in more challenging coursework (that) appears to boost learning and
achievement” (Clemmitt, 2006, p. 1) is a goal of both the IB and Advanced Placement (AP)
programs. A study by the NRC examined AP and IB programs by focusing on questions about
advanced study to gain “improved, research-based understanding of teaching and learning”
(Gollub, Bertenthal, Labov, & Curtis, 2002, p. 1). This study relied on materials and testimony
from individuals who were officials of the organizations, teachers for the programs, or students
in the two programs. There were two areas of emphasis in the study on the consistency of the
programs: (a) research on cognition and learning and (b) availability of equal access to the
advanced study programs. They reported “frequent inconsistencies” (p. 2) with both programs
on cognition and learning research, and limited access to these programs for minorities and
students in inner-city and rural schools. An ERIC search found only two studies on IB. One
(Talbot, 2000) focused on TOK in science. The other (Mathews and Kitchen, 2007) investigated
stakeholders’ impressions of the IB program as a “school within a school” gifted program.
The National Center for Education Statistics, as part of the National Assessment of
Educational Progress (NAEP) High School Transcripts Study (2007), showed “high school
graduates who took neither AP/IB mathematics courses nor AP/IB science courses earned a
lower overall mean GPA than the AP/IB course-taking subgroups” (Perkins, Kleiner, Roey, &
Brown, 2004, p. 2). Sadler and Tai (2007) investigated whether it was better for students
preparing for college to take an AP course and get a lower grade or take a “regular” course and
get an A grade. They found when taking variations in college grading systems into account,
there was “strong evidence to support adding bonus points to students’ high school course grades

Eastern Education Journal Vol 42(1) Winter 2013-2014
pp 3 - 29
8
in the sciences, namely, on a 4-point scale, 1 point for AP courses and .5 for honors courses” (p.
5). Colleges assume students’ success in the advanced courses predicts success in college
courses, especially in mathematics and science.
Achievement levels of students who participated in AP or IB programs have been
examined in two empirical studies. The Pfeiffenberger, Zolanda, and Jones (1991) study focused
on the dynamics of writing tests for AP physics and examined data from the National
Assessment of Educational Progress (NAEP) and the International Assessment of Educational
Progress on physics achievement. The discouraging news was that “student performance seldom
meets the expectations of the test development committees…and…low rate of participation
among women and some minorities” (p. 37). They reported that from 1956-1990 there was an
increase in the number of students taking the AP exam but not a significant decrease in the
scores on the examination. Poelzer and Feldhusen (1996) noted IB students in all science areas
had higher achievement levels on pre and post tests administered than did non-IB students.
There is controversy regarding whether AP or IB courses affect persistence to college
graduation or performance in college. Klopfenstein and Thomas (2005) stated, “Our findings
suggest that while a rigorous high school curriculum clearly impacts the likelihood of early
success in college, AP courses are not a necessary component of a rigorous curriculum” (p. 14).
In contrast, Adelman (1999, 2006) concluded that a rigorous high school course load is a factor
in college success, with AP courses being one factor that influenced completion of a bachelor’s
degree. He concluded that “taking at least three Carnegie Units in core laboratory science
(biology, chemistry, and physics) is more critical than taking AP classes, even though AP
courses contribute to the highest level of academic intensity in a high school curriculum” (2006,
Eastern Education Journal Vol 42(1) Winter 2013-2014
pp 3 - 29
9
p. 2). The only studies that have examined curriculum taught in high school classrooms have
been sponsored by the AP and IB organizations reported on their web sites.
Although discussion regarding rigorous curriculum tends to include both AP and IB,
there are distinct differences. Matthews and Hill (2005) noted, “Unlike most AP courses, an IB
course does not allow students to skip the final examination without penalty” (p. xii). They
described the differences between the two examinations:
It is one thing for students to prepare for AP examinations in subjects they like and
do well in. It is another kind of challenge to prepare for external examinations that
cover an entire curriculum, integrate one’s learning in the Theory of Knowledge
course, and write an extended essay and perform community service, (p. 102)
alluding to IB as the more challenging of the two programs.
According to Kyburg, Hertberg-Davis, and Callahan (2007), minority IB students
believed their teachers knew them on a personal level and were “confident that their teachers
possess expert knowledge in their fields” (p. 205). They thought the TOK component of the IB
curriculum “especially encourages students to challenge conventional ways of approaching
problems or thinking about things, and the required extended essay is one area where students
have more latitude to choose topics of personal interest” (p. 205).
There is much autonomy given to teachers in the IB program, allowing them freedom of
choice in the types of activities and options for students. Numerous studies have been conducted
which examined teachers’ choices and the factors affecting those choices, both generally and
specifically in science education (Ackay & Yager, 2010; Aikenhead, 1984; Akinoglu, 2008;
Burris, et. al, 2007; Crawford, 2007; Deemer, 2004; Henry, 1994; Ingram, Louis, & Schroeder,
2004; Jones & Carter, 2007; Putnam, 1984; Westerman, 1991). It is well documented that
teachers’ choices impact the lives of their students (Coleman & Cross, 2001; Croft, 2003;
Lindsey, 1980; Wright, et. al, 1997). Westerman (1991) studied how factors influence expert

Eastern Education Journal Vol 42(1) Winter 2013-2014
pp 3 - 29
10
and novice teachers differently. Henry (1994) reported informal student outcomes and teacher
enjoyment as major factors affecting teachers’ decisions, while Deemer (2004) focused upon
school culture. Ingram et al. (2004) examined how the decisions teachers make are data driven
because teachers look at the results on standardized assessments to make some of their decisions.
Lunetta, Hofstein, and Clough (2007) noted teachers’ decisions are driven by learning outcomes
which frequently are determined by high-stakes tests. Also, it was found that teachers’ decisions
are most influenced by how they were taught and some find it hard to break this mold (Ackay &
Yager, 2010; Blanchard et al., 2008 & 2010).
“Individual teachers have substantial leeway in implementing AP and IB courses.
Therefore, the nature and quality of instruction may vary considerably from classroom to
classroom” (Gollub et al., 2002, p. 10). Studies conducted to probe the relationship between
teacher behavior and student learning and achievement found a definite relationship (Brophy,
1979; Burton, et al, 2002; Haycock, 1998; Schroeder et al. 2007; Wenglinsky, 2002; Wright, et
al, 1997). Kyburg et al. (2007) listed two key factors which contributed to minority students’
academic growth. One of these was teachers providing “scaffolding to support and challenge
students” (p. 173). This support included time spent with students before and after school,
lunchtime discussion groups, and college visits subsidized by the school. “Differences in teacher
effectiveness were found to be the dominant factor affecting student academic gain” (Wright et
al., 1997, p. 66).
Inquiry as a curricular component, both inquiry teaching and inquiry by students, has
been investigated extensively in science education as an important component of students’
learning (Ackay & Yager, 2010; Akinoglu, 2008; Blanchard 2008 & 2010; Crawford, 2007;
Forbes & Davis 2010; Kang, Orgill & Crippen, 2008; Lebak & Tinsley, 2010; Wang & Lin,

Eastern Education Journal Vol 42(1) Winter 2013-2014
pp 3 - 29
11
2008). Fradd and Lee (1999) found that many science teachers have not embraced inquiry as a
pedagogical approach due to the complexity of teaching in a nontraditional manner. Alozie,
Moje, and Krajcik (2009) found that constraints such as time limited the use of inquiry in the
classroom. Blanchard et al. (2010) found constraints imposed by standardized assessments
limited inquiry, especially when curriculum supports were not in place. Beyer et al. (2009)
showed little support for teachers choosing inquiry and suggested incorporating educative
materials for teacher use in their curriculum as better than providing professional development
for teachers to promote inquiry.
The standard for what is inquiry has come from Inquiry and the National Science
Education Standards (NRC, 2000). It identifies classroom inquiry as having five essential
components: (a) learner engages in scientifically oriented questions; (b) learner gives priority to
evidence in responding to questions; (c) learner formulates explanations from evidence; (d)
learner connects explanations to scientific knowledge; and (e) learner communicates and justifies
explanations (NRC 2000). In practice there is a continuum of instructional approaches ranging
from entirely teacher directed to completely open-ended inquiry (Blanchard et al., 2010).
Purpose
This study’s foci included the choices IB science teachers make for IA activities, IA
resources, and IA categories. The relationship between teachers’ demographics and these
choices was examined.
The following research questions were used to gather information on these foci:
Research Question 1: What curricular choices do IB science teachers make related to IA
activities?

Eastern Education Journal Vol 42(1) Winter 2013-2014
pp 3 - 29
12
Research Question 2: What choices do IB science teachers make regarding the level of use for
the different categories of IA?
Research Question 3: To what degree do IB science teachers’ courses taught, years of
experience (total and IB), level of education, undergraduate major, graduate major, school
population, and percentage of students enrolled in IB affect their IA choices?
Methodology
Sample
Fifty-three teachers who responded to the survey had attended either a Level 3 IB
conference in Reston, Virginia or a round-table discussion meeting in Kansas City, Missouri.
Participants from the Reston conference were initially contacted electronically by International
Baccalaureate – North America (IBNA) with a letter introducing the study and asking for their
participation. Surveys were e-mailed directly to the teachers who volunteered to participate.
Participants from the Kansas City, Missouri round-table discussion were either given a survey on
the day of the discussion or received an e-mail. All teachers in the sample were IB science
teachers. This sample of teachers included 25 biology teachers, 18 chemistry teachers, and 10
physics teachers.
Design
A survey was selected as the best approach to quickly and easily reach many people in
widely scattered areas (Van Dalen, 1966). Schaefer and Dillman (1998) stated that “the cost and
speed advantages of e-mail make it ideal for a first mode of contact in surveys” (p. 379). Since
the IB science teachers in this study were located throughout North America, ease of reaching
many of them in a timely fashion was essential. Participants in this study were given the choice
Eastern Education Journal Vol 42(1) Winter 2013-2014
pp 3 - 29
13
as to whether they wanted the survey sent by regular mail or as an e-mail attachment. All 40
Reston participants preferred receiving and responding to their survey through e-mail. Eight
(62%) of the Kansas City participants completed the survey at the roundtable discussion; the rest
returned the survey electronically.
An initial survey was designed and then piloted with 12 individuals to determine whether
the format and style of the survey were appropriate. Respondents made comments about
improvements, areas where clarification was needed, or additions they would suggest. The
survey was revised based upon suggestions from the pilot and a panel of science educators to
provide validity.
This survey was designed to ascertain information from IB science (biology, chemistry,
and physics) teachers related to their IB curriculum in the areas of resources for IA, areas of
emphasis for IA, and types of IA activities. Items for the list of IA activities came from activities
listed in various IBO publications including curriculum guides and the National Survey of
Science and Mathematics Education (Weiss, Banilower, McMahon, & Smith, 2001). The 2006-
2007 and 2007-2008 school years provided the data about these choices. During this time a
major curriculum change occurred. This curriculum change involved renaming the categories by
which students were assessed on their IA’s and changing the focus of the mark schemes to be
focused on inquiry design, data collection and processing instead of the general planning A and
B categories which existed before.
Science teachers recorded their frequency levels for the different IA categories. For the
2006-2007 school year choices for these categories included: Planning A, Planning B, Data
Collection, Data Processing and Presentation, and Conclusion and Evaluation. Planning A and B
included aspects of design including a research question, hypothesis, materials and procedure

Eastern Education Journal Vol 42(1) Winter 2013-2014
pp 3 - 29
14
written by the student. For the 2007-2008 school years these choices included: Design, Data
Collection and Processing, and Conclusion and Evaluation. IB teachers are expected to do a
minimum of two activities in each of these categories during the total implementation of the
course but may do more. Categories for frequency levels identified on the survey were:
Minimum (2 IA’s only), Rarely (3-6 IA’s), Sometimes (7-12 IA’s), and Often (more than 12
IA’s). The category Conclusion and Evaluation was the same for both 2006-2007 and 2007-2008
so teachers responded only once for this category.
The survey included a section which asked participants to record the number of times
different activities on a list were used in their IA for one school year. They could also record
additional activities not listed. Subsequently, a scale allowed teachers to identify the number of
times they used particular resources from the list. Section II also requested teachers to identify
the frequency they used the different categories of IA. The demographics section identified
experience for both total teaching and IB teaching, undergraduate major, advanced degree,
advanced degree major, type and size of school where they teach, percentage of students enrolled
in IB at the school, and any further comments.
Surveys were e-mailed to IB science conference participants or given directly to
roundtable attendees who agreed to participate in the study. In addition to the survey, a letter of
introduction and suggested reply deadline were provided. Participants were given two weeks to
return the survey. After those two weeks, a follow-up e-mail was sent to all non-respondents.
Data Analysis
Descriptive statistics were calculated for demographics: science course taught, total
number of years teaching, number of years IB teaching experience, undergraduate major, highest
earned degree, graduate major, total school population, and percent of students enrolled in IB.

Eastern Education Journal Vol 42(1) Winter 2013-2014
pp 3 - 29
15
Pearson’s product-moment correlations and linear regression values were computed as tests of
statistical significance of the three research questions.
Results
Demographics
Demographic information was used to determine the factors which affected IB science
teachers’ choices for curriculum and instruction. Twenty-five (47%) respondents taught
biology, 18 (34%) taught chemistry, and 10 (19%) taught physics. The mean total years of
teaching experience were 15.8 (SD = 15.8). Forty-four teachers (85%) held a master’s degree or
higher. Forty-three (81.1%) teachers held an undergraduate major in a science field. Their
graduate majors were in education for 26 respondents (50%). The mean value for the population
of students in the schools where they taught was 1688.2 (SD = 663.04). The mean percentage
for students enrolled in IB was 21.57% (SD = 22.74).
Internal Assessment
Internal Assessment
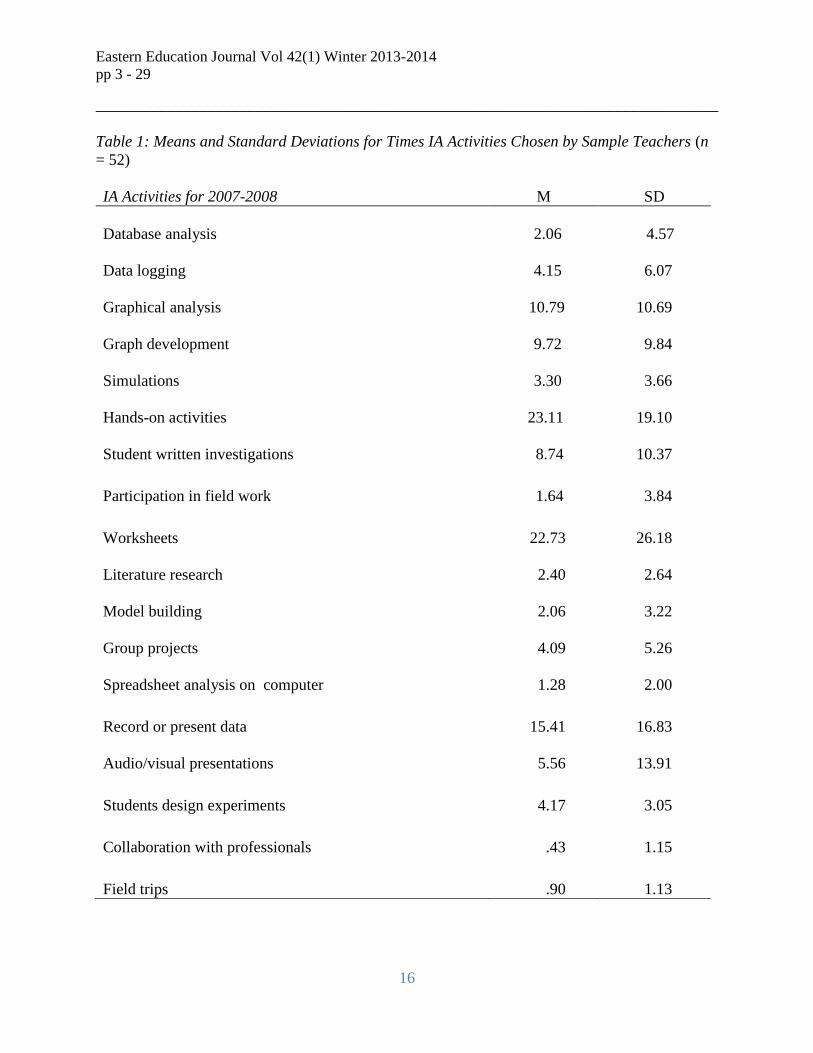
Table 1 summarizes the means and standard deviations for all teachers’ IA activity use.
Hands-on activities and worksheets had means of 23.11 (SD = 19.10) and 22.73 (SD = 26.18)
respectively. Recording or presenting data had a mean of 15.41 (SD = 16.83) and graphical
analysis had a mean of 10.79 (SD = 10.69). The mean for graph development averaged 9.72 (SD
= 9.84), while students’ design experiments and data logging had similar means, 4.17 (SD =
3.05) and 4.15 (SD = 6.07) respectively. The IA activities which had the lowest level of use
were field trips and collaboration with professionals.
Eastern Education Journal Vol 42(1) Winter 2013-2014
pp 3 - 29
16
______________________________________________________________________________
Table 1: Means and Standard Deviations for Times IA Activities Chosen by Sample Teachers (n
= 52)
IA Activities for 2007-2008
M
SD
Database analysis
2.06
4.57
Data logging
4.15
6.07
Graphical analysis
10.79
10.69
Graph development
9.72
9.84
Simulations
3.30
3.66
Hands-on activities
23.11
19.10
Student written investigations
8.74
10.37
Participation in field work
1.64
3.84
Worksheets
22.73
26.18
Literature research
2.40
2.64
Model building
2.06
3.22
Group projects
4.09
5.26
Spreadsheet analysis on computer
1.28
2.00
Record or present data
15.41
16.83
Audio/visual presentations
5.56
13.91
Students design experiments
4.17
3.05
Collaboration with professionals
.43
1.15
Field trips
.90
1.13

Eastern Education Journal Vol 42(1) Winter 2013-2014
pp 3 - 29
17
The significant relationships listed in Table 2 for linear regression occurred when science
course taught was the independent variable and the IA activities data logging, graphical analysis,
graph development, participation in field work, literature research, and spreadsheet analysis on
the computer were dependent variables. Significant relationships were also shown between
years of IB teaching experience and collaboration with professionals. Graduate major as an
independent variable showed a significant relationship with the IA activity record and present
data.
Table 2: Linear Regression Data IA Activities as the Dependent Variable and Demographics as
the Independent Variables (n= 52)
Dependent Variable
IA Activity
Independent Variable
Demographic
R2
B
SE B
Beta
p
Data logging
Science course
.235
3.250
1.057
.403
.004
Graphical analysis
.100
-4.715
2.081
-.317
.028
Graph development
.124
-4.793
1.878
-.352
.014
Participation in field
work
.103
-1.727
.750
-.322
.026
Literature research
.088
-.988
.470
-.296
.041
Spreadsheet analysis
on a computer
.229
.841
.353
.313
.022
Eastern Education Journal Vol 42(1) Winter 2013-2014
pp 3 - 29
18
Collaboration with
professionals
IB teaching
experience
.156
-.080
.039
-.285
.046
Record & present
data
Graduate major
.082
-4.338
2.027
-.287
.037
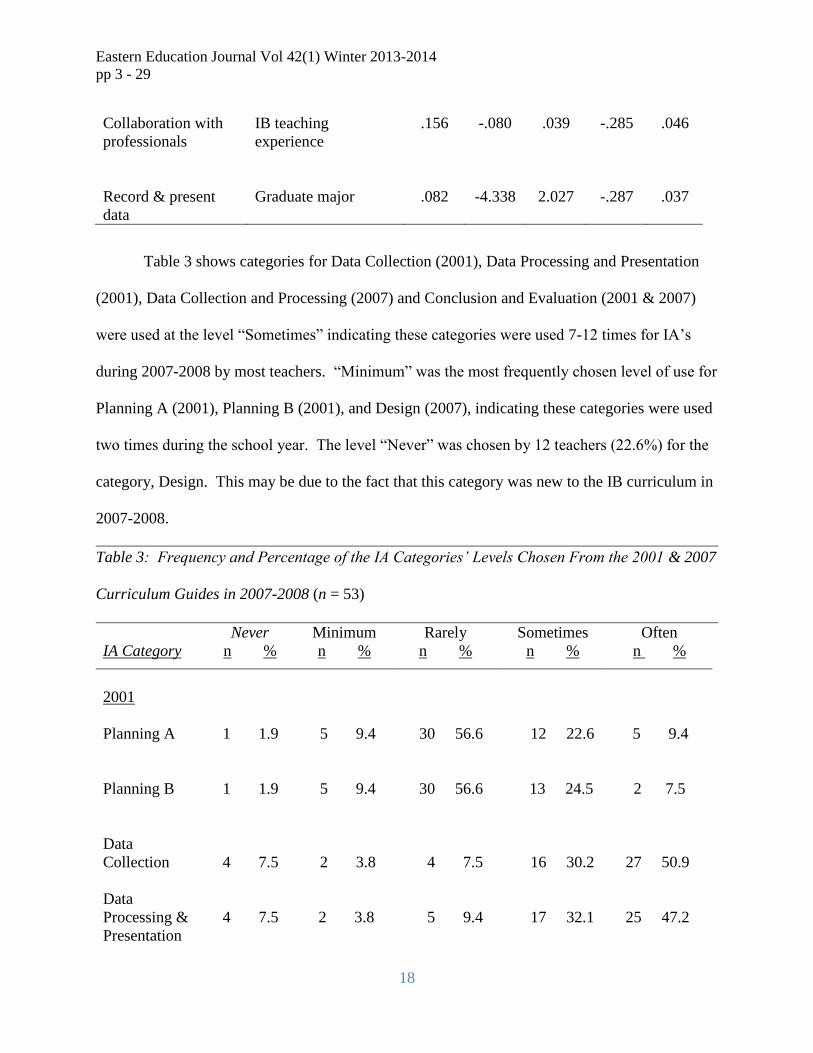
Table 3 shows categories for Data Collection (2001), Data Processing and Presentation
(2001), Data Collection and Processing (2007) and Conclusion and Evaluation (2001 & 2007)
were used at the level “Sometimes” indicating these categories were used 7-12 times for IA’s
during 2007-2008 by most teachers. “Minimum” was the most frequently chosen level of use for
Planning A (2001), Planning B (2001), and Design (2007), indicating these categories were used
two times during the school year. The level “Never” was chosen by 12 teachers (22.6%) for the
category, Design. This may be due to the fact that this category was new to the IB curriculum in
2007-2008.
Table 3: Frequency and Percentage of the IA Categories’ Levels Chosen From the 2001 & 2007
Curriculum Guides in 2007-2008 (n = 53)
IA Category
Never
n %
Minimum
n %
Rarely
n %
Sometimes
n %
Often
n %
2001
Planning A
1 1.9
5 9.4
30 56.6
12 22.6
5 9.4
Planning B
1 1.9
5 9.4
30 56.6
13 24.5
2 7.5
Data
Collection
4 7.5
2 3.8
4 7.5
16 30.2
27 50.9
Data
Processing &
Presentation
4 7.5
2 3.8
5 9.4
17 32.1
25 47.2
Eastern Education Journal Vol 42(1) Winter 2013-2014
pp 3 - 29
19
2007
Design
12 22.6
5 9.4
28 52.8
6 11.3
2 3.8
Data
Collection &
Processing
6 11.3
2 3.8
4 7.5
17 32.1
24 45.3
2001 & 2007
Conclusion &
Evaluation
0 0
3 5.7
10 18.9
17 32.1
23 43.4
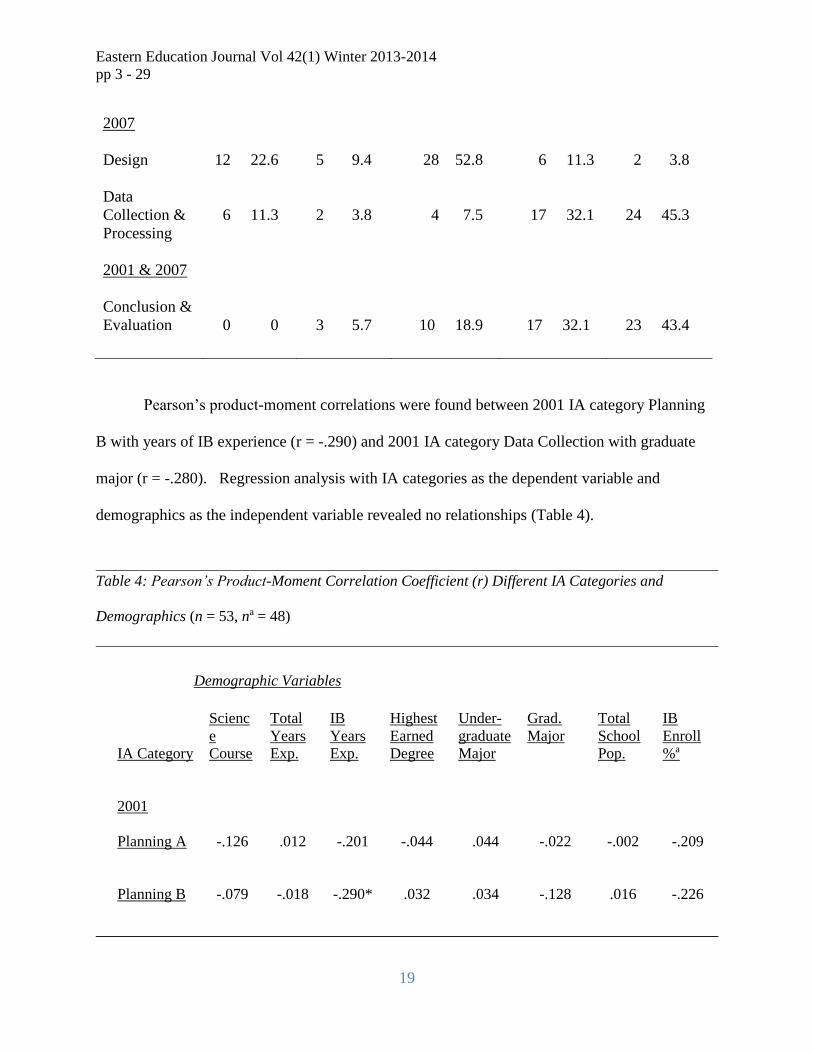
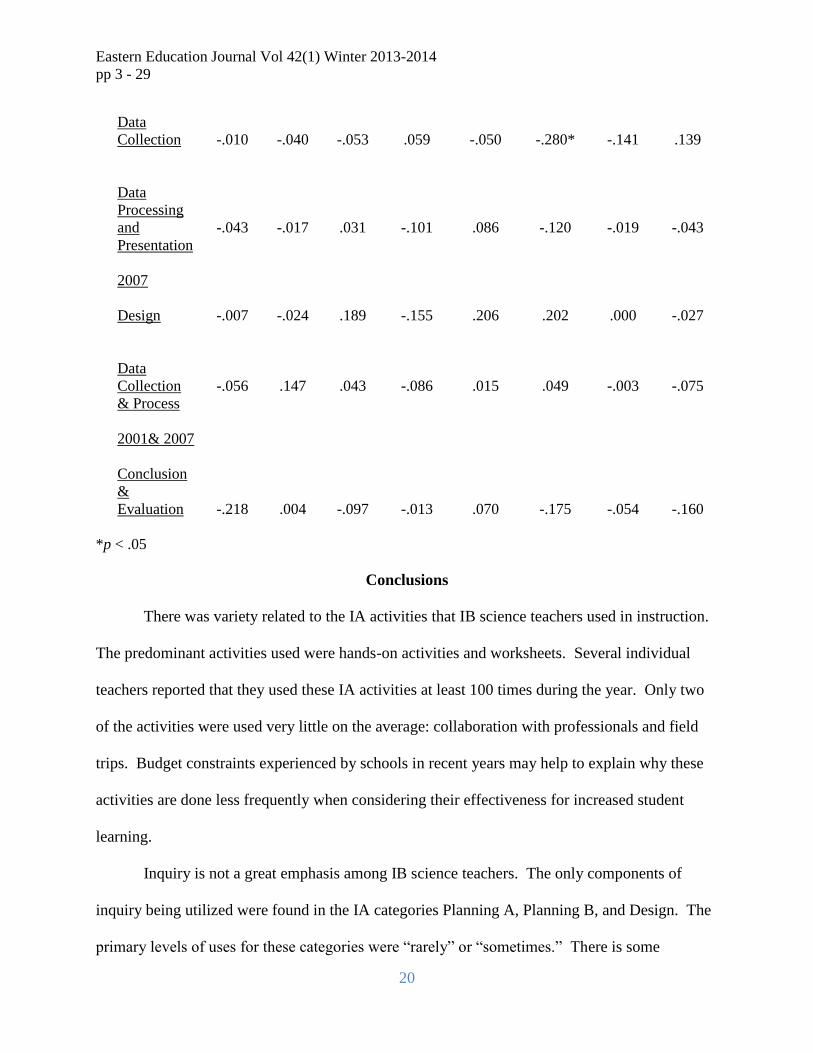
Pearson’s product-moment correlations were found between 2001 IA category Planning
B with years of IB experience (r = -.290) and 2001 IA category Data Collection with graduate
major (r = -.280). Regression analysis with IA categories as the dependent variable and
demographics as the independent variable revealed no relationships (Table 4).
Table 4: Pearson’s Product-Moment Correlation Coefficient (r) Different IA Categories and
Demographics (n = 53, na = 48)
Demographic Variables
IA Category
Scienc
e
Course
Total
Years
Exp.
IB
Years
Exp.
Highest
Earned
Degree
Under-
graduate
Major
Grad.
Major
Total
School
Pop.
IB
Enroll
%a
2001
Planning A
-.126
.012
-.201
-.044
.044
-.022
-.002
-.209
Planning B
-.079
-.018
-.290*
.032
.034
-.128
.016
-.226
Eastern Education Journal Vol 42(1) Winter 2013-2014
pp 3 - 29
20
*p < .05
Conclusions
There was variety related to the IA activities that IB science teachers used in instruction.
The predominant activities used were hands-on activities and worksheets. Several individual
teachers reported that they used these IA activities at least 100 times during the year. Only two
of the activities were used very little on the average: collaboration with professionals and field
trips. Budget constraints experienced by schools in recent years may help to explain why these
activities are done less frequently when considering their effectiveness for increased student
learning.
Inquiry is not a great emphasis among IB science teachers. The only components of
inquiry being utilized were found in the IA categories Planning A, Planning B, and Design. The
primary levels of uses for these categories were “rarely” or “sometimes.” There is some
Data
Collection
-.010
-.040
-.053
.059
-.050
-.280*
-.141
.139
Data
Processing
and
Presentation
-.043
-.017
.031
-.101
.086
-.120
-.019
-.043
2007
Design
-.007
-.024
.189
-.155
.206
.202
.000
-.027
Data
Collection
& Process
-.056
.147
.043
-.086
.015
.049
-.003
-.075
2001& 2007
Conclusion
&
Evaluation
-.218
.004
-.097
-.013
.070
-.175
-.054
-.160
Eastern Education Journal Vol 42(1) Winter 2013-2014
pp 3 - 29
21
emphasis among IB science teachers on Data Collection and Processing, which are important
aspects of inquiry listed in NSTA’s inquiry position statement (NSTA, 2004).
Teachers who cited reasons related to experience and background such as “I was
successful with this last year,” supported Aikenhead’s (1984) conclusion that teachers may draw
upon instructional resources such as last year’s lesson plans and their own experiences to make
“holistic” decisions which integrated science with practical knowledge. Similarly, Henry (1994)
noted that informal student outcomes, teacher enjoyment, and teacher compatibility were some
of the most prevalent reasons teachers utilize for making curricular choices. This supports Doyle
and Ponder (1977-78) who noted that teachers base their decision making on practicality which
is affected by three criteria: instrumentality, congruence, and cost.
Hands-on activities as the most frequently used IA activity supports Van den Berg, Katu,
and Lunetta (1994), who proposed that when teaching circuits to high school students, hands-on
activities were effective for modeling what was involved in circuits. They also found hands-on
activities alone were ineffective in teaching all of the scientific relationships required for a
complete understanding of circuits. It is important to note this study found that simulations had
one of the lowest usage means for IA activities.
Lunetta (1998) proposed that the number of hands-on activities should not be the
predominant factor affecting science learning. He considered it to be better for students to do a
few “authentic” activities than to do many which are superficial. He recommends to encourage
students in minds-on as well as hands-on activities, which is influenced by factors such as cost
and safety (Lunetta et al., 2007).
Worksheets were the second-most used activity for IA’s. This could mean IB science
teachers understand and utilize the ideas suggested by NCR (2006) that when the goal for
Eastern Education Journal Vol 42(1) Winter 2013-2014
pp 3 - 29
22
instruction was student mastery of subject matter, other forms of science instruction could be just
as effective as laboratory activities. Weiss, Pasley, Smith, Banilower, and Heck (2003) in their
Inside the Classroom proposed that the “quality of lessons did not depend on whether the teacher
used a ‘reform-oriented’ approach or a traditional approach. Some lessons judged to be effective
were traditional in nature, using lectures and worksheets” (p. 24).
Since worksheets were identified as one of the most prominent IA activities, this seems to
indicate IB teachers are limiting authentic laboratory experiences (Hawkes, 2004). Activities
like students’ design experiments and participation in field work were considerably lower in
frequency than worksheets. Although data collection and data processing were some of the most
frequently used categories for IA’s, the design category was significantly lower. It is not known
how students are directed to collect data, but it may be after the teacher directs students to collect
certain data or ask students to complete “cookbook” laboratories. If so, this does not allow
students “to identify and ask appropriate questions that can be answered through scientific
investigations” (NSTA, 2004, p. 2) or become involved in laboratory processes and developing
safe and conscientious laboratory practices (NSTA, 2007).
Hofstein and Lunetta (2004) cautioned that although it is important to use laboratory
activities in instruction, inquiry alone is not sufficient to assure students achieve a complete
understanding of science. Coulter (1966) found that inductive laboratory approaches were not
only just as effective as a deductive approach for student instruction and success, but they also
were better suited to teaching cause and effect relationships and making judgments after
examining evidence. Gardiner and Farregher (1997) found that even when the laboratory
activities performed by students were qualitative and confirmatory and less than those required
by the course outline, students still were able to answer laboratory-based questions on exams.
Eastern Education Journal Vol 42(1) Winter 2013-2014
pp 3 - 29
23
Inquiry is not a major emphasis among the IB science teachers participating in this study
even though the IB mission states it is important. One possible reason for this may be that IB
science teachers do not have the pedagogical content knowledge necessary to be comfortable
choosing to include more inquiry in their curriculum, or they feel that inquiry will take time
away from preparing for the IB examinations (Wood, 2002). Blanchard et al. (2010) state,
“Findings suggest that inquiry methods and high-stakes test performance are not incompatible”
(p. 609).
Currently this issue is dealt with as IBO modifies students’ scores on IA’s and
encourages increased inquiry. This is not enough. If teachers are uncomfortable and unprepared
to incorporate inquiry into their curriculum and instruction, then credentials for IB teachers may
need to include that teachers have the ability, desire, or support to use inquiry. Professional
development regarding what inquiry is and how to use it can be provided for IB teachers or
materials be provided which help teachers learn how to incorporate inquiry into their
instructional practices (Beyer et al., 2009; Wood, 2002).
Bibliography
Eastern Education Journal Vol 42(1) Winter 2013-2014
pp 3 - 29
24
Ackay, H. & Yager, R. (2010). Accomplishing the visions for teacher education programs
advocated in the National Science Education Standards. Journal of Science Teacher
Education, 21, 643-664.
Adelman, C. (1999). Answers in the tool box: The academic intensity, attendance patterns and
bachelor’s degree attainment, Education Resources Information Center: ED 431363.
Retrieved June 25, 2007, from http://eric.ed.gov.
Adelman, C. (2006). The toolbox revisited: Paths to degree completion from high school through
college. [Forum brief] Retrieved June 24, 2007, from
http://www.aypf.org/forumbriefs/2006/fb031706.htm.
Aikenhead, G.S. (1984). Teacher decision making: The case of Prairie High. Journal of
Research in Science Teaching, 21, 167-186.
Akinoglu, O. (2008). Assessment of the inquiry-based project application in science education
upon Turkish science teachers’ perspectives. Education, 129(2), 202-215.
Alozie, N. M., Moje, E. B., & Krajcik, J. S. (2009). An analysis of the supports and constraints
for scientific discussion in high school project-based science. Science Education, 94, 395-
427.
Asay, L.D. & Orgill, M. (2010). Analysis of essential features of inquiry found in articles
published in The Science Teacher, 1998-2007. Journal of Science Teacher Education, 21,
57-79.
Beyer, C. J., Delgado, C., Davis, E. A., Krajcik, J. (2009). Investigating teacher learning supports
in high school biology curricular programs to inform the design of educative curricular
materials. Journal of Research in Science Teaching, 46(9), 977-998.
Blanchard, M. R., Southerland, S. A., & Granger, E. M. (2008). No silver bullet for inquiry:
Making sense of teacher change following an inquiry-based research experience for
teachers. In J. Bianchini & M Windschitl (Eds), Science Teacher Education. Retrieved
January 14, 2011, from www.interscience.wiley.com.
Blanchard, M. R., Southerland, S. A., Osborne, J. W., Sampson, V. D., Annetta, L. A.& Granger,
E. M. (2010). Is inquiry possible in light of accountability?: A quantitative comparison of
the relative effectiveness of guided inquiry and verification laboratory instruction.
Science Education. Retrieved January 14, 2011, from www.interscience.wiley.com.
Brophy, J. E. (1979). Teacher behavior and its effects. Journal of Educational Psychology, 71(6),
733-750.
Burris, C.C., Welner, K.G., Wiley, E.W., & Murphy, J. (2007). A world class curriculum for all.
Educational Leadership, 64, 53-56.
Eastern Education Journal Vol 42(1) Winter 2013-2014
pp 3 - 29
25
Burton, N.W., Whitman, N.B., Yepes-Baraya, M., Cline, F., & Kim, R.M. (2002). Minority
students success: The role of teachers in advanced placement courses. Report Prepared
for the Advanced Placement Research Committee: College Entrance Examination Board.
Retrieved June 25, 2007, from
http://apcentral.collegeboard.com/apc/public/repository/ap02_minority_pop_11805.pdf.
Cavanaugh, S. (2009). Pressure for international benchmarks builds. Education Week, Jan 2,
2009, 6.
Clemmitt, M. (2006). AP and IB programs. CQ Researcher, 16(9). Retrieved March 11, 2007,
from
http://proxy.mul.missouri.edu:2595/cqresearcher/document.php?id=cqresrre2006030300
&.
Coleman, L. J., & Cross, T. L. (2001). Being gifted in school: An introduction to development,
guidance, and teaching. Waco, TX: Prufrock Press.
Coulter, J.C. (1966). The effectiveness of inductive laboratory, inductive demonstration, and
deductive laboratory in biology. Journal of Research in Science Teaching, 4, 185-186.
Crawford, B. A. (2007) Learning to teach science as inquiry in the rough and tumble of practice.
Journal of Research in Science Teaching, 44(4), 613-642.
Croft, L. J. (2003). Teachers of the gifted: Gifted teachers. In N. Colangelo & G. A. Davis
(Eds.), Handbook of gifted education (3rd ed., pp. 558-571). Boston: Allyn & Bacon.
Deemer, S.A. (2004). Classroom goal orientation in high school classrooms: Revealing links
between teacher beliefs and classroom environments. Educational Research, 46, 73-90.
Doyle, W. & Ponder, G. (1977/78). The practicality ethic in teacher decision making.
Interchange, 8(3), 1-12.
Fradd, S. H., & Lee, O. (1999). Teachers’ roles in promoting science inquiry with students from
diverse language backgrounds. Educational Researcher, 28(6), 14-20, 42.
Forbes, C. T. & Davis, E. A. (2010) Curriculum design for inquiry: Preservice elementary
teachers’ mobilization and adaptation of science curriculum materials. Journal of
Research in Science Teaching, 47(7), 820-839.
Gardiner, P.G. & Farregher, P. (1997). The quantity and quality of biology lab work in British
Columbia high schools. Paper presented at the Annual meeting of the National
Association for Research in Science Teaching, March 23, 1997.
Gollub, J. P., Bertenthal, M.W., Labov, J. B., & Curtis, P.C. (ed.) (2002). Learning and
understanding: Improving advanced study of mathematics and science. [Free Executive
Summary] Retrieved on June 24, 2007, from http://www.nap.edu/catalog/10129.html.
Eastern Education Journal Vol 42(1) Winter 2013-2014
pp 3 - 29
26
Hawkes, S.J. (2004). Chemistry is not a laboratory science. Journal of Chemical Education, 81,
1257.
Haycock, K. (1998). Good teaching matters. [Electronic Version] Thinking K-16, 3(2),
Washington, DC: Education Trust.
Henry, M.A. (1994), Differentiating the expert and experienced teacher: Quantitative differences
in instructional decision making. Paper presented at the Annual Meeting of the American
Association of Colleges for Teacher Education, Chicago, IL, February 16-19, 1994.
Hofstein, A. & Lunetta, V.N. (2004). The laboratory in science education: Foundations for the
twenty-first century. Science Education, 88, 28-54 [Electronic version] Retrieved June
25, 2004 from www.interscience.wiley.com.
Ingram, D., Louis, K.S., & Schroeder, R.G. (2004). Accountability policies and teacher decision
making: Barriers to the use of data to improve practice. Teachers College Record, 106,
1258-1287.
International Baccalaureate (2005-2007). Mission, Retrieved June 8, 2007, from the World Wide
Web: http://www.ibo.org/mission/index.cfm.
International Baccalaureate About the International Baccalaureate, Retrieved April 6, 2012, from
the World Wide Web: http://ibo.org/general/who.cfm.
Jones, M.G., & Carter, G. (2007). In S.K. Abell & N. G. Lederman (Editors), Handbook of
research on science education (pp. 1067-1104) Mahwah, NJ: Lawrence Erlbaum
Associates.
Kang, N., Orgill, M., & Crippen, K. J. (2008). Understanding teachers’ conceptions of classroom
inquiry with a teaching scenario survey instrument. Journal of Science Teacher
Education, 19, 337-354.
Klopfenstein, K., & Thomas, M.K. (2005). The advanced placement performance advantage:
Fact or fiction? Retrieved June, 22, 2007 from the World Wide Web:
http://www.aeaweb.org/annual_mtg_papers/2005/0108_1015_0302.pdf.
Kyburg, R.M., Hertberg-Davis, H., & Callahan, C.M. (2007). Advanced Placement and
International Baccalaureate programs: Optimal learning environments for talented
minorities? Journal of Advanced Academics, 18, 172-215.
Lebak, K. & Tinsley, R. (2010) Can inquiry and reflection be contagious? Science teacher,
students, and action research. Journal of Science Teacher Education, 21, 953-970.
Lindsey, M. (1980). Training teachers of the gifted and talented. New York: Teacher's College
Press.
Eastern Education Journal Vol 42(1) Winter 2013-2014
pp 3 - 29
27
Lunetta, V.N. (1998). The school science laboratory: Historical perspectives and contexts in
contemporary teaching. In Fraser, B.J. & Tobin, K.G. (Eds.) International Handbook of
Science Education. (pp. 249-262). Dorbrecht, The Netherlands: Klumer Academic
Publishers.
Lunetta V.N., Hofstein, A. and Clough, M., (2007). Learning and teaching in the school science
laboratory: an analysis of research, theory, and practice. In N. Lederman. and S. Abel
(Eds.), Handbook of research on science education. (pp. 393-441), Mahwah, NJ:
Lawrence Erlbaum.
Matthews, J., & Hill, I. (2005). Supertest: How the International Baccalaureate can strengthen
our schools. Chicago: Open Court.
Matthews, D., & Kitchen, J. (2007). School-Within-a-School Gifted Programs: Perceptions of
Students and Teachers in Public Secondary Schools. Gifted Child Quarterly, 51(3), 256-
271.
Mehta, M.J., & Sivadas, E. (1995). Comparing response rates and response content in mail
versus electronic mail surveys. Journal of the Market Research Society, 37, 429-439.
Minner, D. D., Levy, A. J., & Century, J. (2010). Inquiry-based science instruction – What it is
and does it matter? Results from a research synthesis years 1984 to 2002. Journal of
Research in Science Teaching, 47(4), 474-496.
National Center for Educational Statistics. (2007). America’s High School Graduates: Results
from the 2005 NAEP High School Transcript Study, Retrieved January 2, 2012 from
http://nces.ed.gov/pubsearch/pubsinfo.asp?pubid=2007467.
National Research Council. (1996). National science education standards. Washington D.C.:
National Academy Press.
National Research Council. (2000). Inquiry and the national science education standards.
Washington D.C.: National Academy Press.
National Research Council. (2002). Learning and understanding: Improving advanced study of
mathematics and science in U. S. high schools. Washington D.C.: National Academy
Press.
National Research Council. (2006). America’s lab report: Investigations in high school science.
Washington D.C.: National Academy Press.
National Research Council. (2011). A framework for k-12 science education: Practices, cross-
cutting concepts, and core ideas. Washington D.C.: National Academy Press.
Eastern Education Journal Vol 42(1) Winter 2013-2014
pp 3 - 29
28
National Science Teachers Association. (2004). Scientific inquiry. National Science Teachers
Position Statement, Retrieved June 25, 2007 from
http://www.nsta.org/about/positions/inquiry/aspx.
National Science Teachers Association. (2007). The integral role of laboratory investigations in
science instruction. NSTA Position Statements, Retrieved June 25, 2007 from
http://www.nsta.org/positionstatement&psid=16&pring=y.
No Child Left Behind Act (NCLB). (2002). Pub. L. No. 107-110,115 Stat.1425. Retrieved June
26, 2007, from http://www.ed.gov/legislation/ESEA02.
Perkins, R., Kleiner, B. Roey, S., and Brown, J. (2004). The high school transcript study: A
decade of change in curricula and achievement, 1990-2000, Educational Statistics
Quarterly, 6 (1 & 2), Retrieved June 24, 2007, from
http://nces.ed.gov/programs/quarterly/vol_6/1_2/2_1.asp.
Pfeiffenberger, W., Zolanda, A.M., & Jones, L. (1991). Testing physics achievement: Trends
over time and place. Physics Today, 44 (9), 30-37.
Poelzer, G., & Feldhusen, J. (1996). An empirical study of the achievement of International
Baccalaureate students in biology, chemistry, and physics – in Alberta, Journal of
Secondary Gifted Education, 8 (1), 28. Retrieved March 11, 2007, from the Academic
Search Elite database.
Putnam, J.G. (1984). One exceptional teacher’s systematic decision-making model. Paper
presented at the Annual Meeting of the American Educational Research Association,
Montreal, Canada, April 11-15, 1983.
Sadler, P.M., & Tai, R.H. (2007) Weighting for recognition: Accounting for Advanced
Placement and honors courses when calculating high school grade point average. NASSP
Bulletin, 91, 5-32.
Schaefer, D.R., & Dillman, D.A. (1998). Development of a standard e-mail methodology:
Results of an experiment. Public Opinion Quarterly, 62, 378-398.
Schroeder, C. M., Scott, T. P., Tolson, H., Huang, T., & Lee, Y. (2007). A meta-analysis of
national research: Effects of teaching strategies on student achievement in science in the
United States. Journal of Research in Science Teaching, 44(10), 1436-1460.
Talbot, C. (2000). Ideas and evidence in science. School Science Review. 82 (298), 13-22.
Van Dalen, D. (1966). Understanding educational research. New York: McGraw-Hill.
Eastern Education Journal Vol 42(1) Winter 2013-2014
pp 3 - 29
29
Van den Berg, E., Katu, N., & Lunetta, V.N. (1994). The role of experiments in conceptual
change: A teaching – experiment study of electric circuits. Paper presented at the Annual
Meeting of the National Association for Research in Science Teaching, Anaheim, CA,
March 26-29, 1994.
Wang, J. & Lin, S. (2008). Examining reflective thinking: A study of changes in methods
students’ conceptions and understandings of inquiry teaching. International Journal of
Science and Mathematics Education, 6, 459-479.
Weiss, I.R., Banilower, E.R., McMahon, K.C., Smith, P.S. (2001). Report of the 2000 national
survey of science and mathematics education. Retrieved June 25, 2007, from
http://horizon-research.com/reports.
Weiss, I.R., Pasley, J.D., Smith, P.S., Banilower, E.R., Heck, D.J. (2003) Looking inside the
classroom. Retrieved April 12, 2008. from http://horizons-research.com/inside the
classroom/reports/looking/complete.pdf.
Weiss, I.R., & Pasley, J.D. (2004) What is high quality instruction? Educational Leadership, 61
(5), 24-28.
Wenglinsky, H. (2002). How schools matter: The link between teacher classroom practices and
student academic performance. Education policy analysis archives, 10(12), Retrieved
June 25, 2007, from http://epaa.asu.edu/epaa/v10n12/.
Westerman, D.A. (1991). Expert and novice teacher decision making. Journal of Teacher
Education, 42, 292-305.
Wood, W. B. (2002). Advanced High School Biology in an Era of Rapid Change: A Summary of
the Biology Panel Report from the NRC Committee on Programs for Advanced Study of
Mathematics and Science in American High Schools. Cell Biology Education, 1(4), 123-
127.
Wright, S. P., Horn, S. P., & Sanders, W. L. (1997). Teacher and classroom context effects on
student achievement: Implications for teacher evaluation. Journal of Personnel Evaluation
in Education, 11, 57-67.


