
International Journal of Special Education Vol. 34, 1, 2019
17
Results of a Year-Long Professional Learning Program for Special Educators and Related
Service Providers
Kimberly A. Murza
Audiology and Speech-Language Sciences Department
University of Northern Colorado, Greely, U.S
Debbie L. Hahs-Vaughn
Methodology, Measurement, and Analysis Program
International Journal of Special Education Vol. 34, 1, 2019
18
University of Central Florida, Orlando, U.S.
P. Charlie Buckley
Department of Special Education, Early Childhood, and Culturally and Linguistically Diverse
Education, Metropolitan State University of Denver, Denver, U.S.
Tami Cassel
Exceptional Student Services, Colorado Department of Education Denver, U.S.
Abstract: The purpose of this study was to determine if certain variables predicted whether educators
dropped out of a year-long, voluntary, professional learning program and whether participant
characteristics predicted their attitudes and behaviors at the end of the program. Special educators
volunteered to participate in the year-long program with their educational teams. A total of 206
educators and related service providers enrolled and completed at least one assignment. Of these
participants, those who attended the single face-to-face meeting and those who took the program for
college credit were statistically significantly more likely to complete the program than their peers. None
of the other participant characteristics (e.g., age, years of experience, setting, role, knowledge and skill
level, initial attitudes) predicted completion. These findings along with the additional study results
suggest there are many unanswered questions in regard to what keeps individual school professionals
inspired and motivated to change their practice.
International Journal of Special Education Vol. 34, 1, 2019
19
Across the globe, educators engage in professional development with the primary aim to increase
their ability to positively impact students (Brown-Easton, 2013). However, not all professional
development activities have been shown to be effective in improving student outcomes. For
example, the oft-occurring single-day training without follow-up or evaluation does not lead to
teacher behavior change or increases in student achievement (Graner, Ault, Mellard, &
Gingerich, 2012). Fortunately, standards for professional learning based on empirical evidence
do exist. For example, Learning Forward, formerly named the National Staff Development
Council (NSDC) has developed standards for high-quality professional learning (see
https://learningforward.org/standards-for-professional-learning) that are evidence-based
(Bergquist, 2006; Slabine, 2011; Wei, Darling-Hammond, & Adamson, 2010).
Special education teachers, para-educators and related service providers such as speech-
language pathologists also have a need to engage in high-quality professional learning to meet
the diverse needs of students in their classrooms and therapy rooms. These school professionals
are called upon to implement scientifically based practices to support learning for students who
struggle, including those with language impairments and autism spectrum disorder (ASD) (e.g.,
Individuals with Disabilities Education Act [IDEA], 2004). A critical focus for this work,
especially for children with autism spectrum disorder (ASD), is increasing social communication
and engagement as social communication and social interaction deficits are diagnostic criteria for
identifying ASD (American Psychiatric Association, 2013). Currently, there is strong evidence
to support the use of naturalistic developmental behavioral interventions (NDBIs) to target social
communication and engagement in children with ASD (see Schreibman et al., 2015). These
interventions share several characteristics. They all:
1. Occur in natural environments
2. Target naturally-occurring social activities
3. Are more child-directed that traditional Applied Behavior Analysis (ABA)
approaches
4. Use strategies to promote spontaneity, initiative, and generalization
5. Focus on developmental targets such as joint attention and imitation
6. Incorporate collaboration with family members
The purpose of this study was to investigate the preliminary efficacy of the Social
Communication and Engagement Triad (SCET; authors) professional learning program. The
content of the SCET program was designed using the characteristics of NDBIs listed above and
the process of delivery of the program incorporated principles of high-quality professional
learning. Participants in the year-long SCET Program were special educators, para-educators
and related service providers across the state of Colorado.
Background
High-Quality Professional Learning
There is a body of research to support which aspects need to be included for the professional
learning program to be considered a “high-quality” adult learning experience. For example,
Dunst, Trivette, and Hamby (2010) completed a rigorous systematic review and meta-analysis of
the effectiveness of adult learning methods and strategies. Their analysis included 58

International Journal of Special Education Vol. 34, 1, 2019
20
randomized controlled trials representing 2,095 treatment participants and 2,213 control
participants. They looked specifically at the effect of four adult learning methods and found
positive and moderate-large effect sizes for three of the four methods: coaching (d = .91; CI =
.78 to 1.04), just-in-time training (d = .52; CI = .37 to .68), and guided design (d = .49; CI = .39
to .58
In addition, Graner and colleagues (2012) suggest there are several guiding principles for
developing successful professional learning experiences for educators, “The professional
development experience must balance the need for and impact of the intervention while
recognizing the knowledge of the participants” (p. 7). In order to achieve this, they suggest
attending to three principles: the need for orientation and motivation, the need for human sense
making, and the need to balance content and coherence.
These three principles align well with what we know about adult learning. For example,
in Dunst and colleagues’ (2010) meta-analysis, several factors were determined to positively
impact the success of professional learning activities. These included active engagement and
experiential learning, instructor support/facilitation and feedback, learner reflection and critical
thinking, real world relevance and immediate applicability, and self-assessment of progress. All
of these principles of effective professional learning align with Desimone’s (2009) conceptual
framework for studying the effects of professional development on teachers and students.
Desimone’s framework includes these five core features of professional development: content
focus, active learning, coherence, duration, and collective participation.
Mode of Delivery
Rapid advances in technology have allowed professional learning opportunities to reach
educators that may not have been able to access programs due to location or lack of resources
(O’Dwyer, Carey, & Kleiman, 2007). However, there remains concern about what might be lost
in online delivery of professional learning (Fishman et al., 2013). For example, can online
learning provide the same type of support for educators or does the format prevent participants
from building trust and collegiality? Many online learning platforms provide collaborative tools
(e.g., discussion boards, group video conferencing) but it remains unclear whether these
platforms are equally effective in promoting active learning for educators (Garet, Porter,
Desimone, Birman, & Yoon, 2001).
More recently, researchers have explored the efficacy of online professional learning in
changing educators’ knowledge and practice. Several studies have demonstrated that online
professional learning programs are efficacious in improving both knowledge and practices of
educators (e.g., Masters et al., 2010). Although the research comparing online formats to face-
to-face delivery is limited, results from three studies support the notion that educators’ learning
and practice are positively impacted no matter the delivery mode (Fishman et al., 2013; Shaha,
Glassett, & Copas, 2015).
Evaluating Professional Learning
When educators participate in a professional learning program, they are asked to engage in a
variety of activities to learn new practices and procedures. A significant issue is the cost benefit

International Journal of Special Education Vol. 34, 1, 2019
21
of these activities—that is, whether the educators’ personal investment of time and effort and the
school system’s investment of financial resources yield sufficient results. Although the intent of
professional learning in schools is ultimately to improve student outcomes, research suggests that
participant satisfaction is largely the only form of evaluation being conducted. For example,
Muijs and Lindsay (2008) conducted a survey of 223 professional learning facilitators and 416
teachers from a randomly selected sample of 1,000 schools. More than 75% of professional
learning coordinators reported that participant satisfaction was evaluated “usually” or “always,”
whereas participants’ use of the innovation and student outcomes was consistently evaluated
(“usually” or “always”) less than 40% of the time.
Guskey (2005) has argued there are five critical stages of professional learning that build
on one another across the learning process. These stages, based on Kirkpatrick’s model (1959),
increase in complexity and include the following:
1. Participants’ reactions
2. Participants’ learning
3. Organizational support and change
4. Participants’ use of new knowledge and skills
5. Student learning outcomes
Researchers have shown that professionals who are asked to adopt an innovation when
they participate in professional learning programs do so in predictable ways (Guskey, 2005; Hall
& Hord, 1987). Hall and Hord (1987) suggest it behooves professional developers to understand
and evaluate this change process so that they may facilitate change in school professionals. The
Concerns-Based Adoption Model (CBAM) is a system Hall and Hord originally published in
1987 that includes specific tools to evaluate the adoption process. Tools from the CBAM were
used in the evaluation of the SCET Program and will be discussed in the methods section of this
paper.
The Social Communication and Engagement Triad Design
Although the design, delivery, and evaluation of professional learning is critical to its success,
the content has to also be worthy of educators’ time and effort. As the incidence of autism
spectrum disorder (ASD) continues to rise (Atladottir et al., 2007; Centers for Disease Control
and Prevention, 2012, 2014; Nassar et al., 2009) with the CDC estimating a prevalence rate of 1
in 68 individuals diagnosed with an ASD (2014), educators find themselves serving more
children with ASD often without adequate pre-service preparation (Myles, Simpson, & deBoer,
2008). To address the growing needs of educators, the National Research Council was charged
by the U.S. Department of Education with creating a framework for educating children with
ASD based on available research. They recommended that intervention programs address the
core deficits in ASD (e.g., social communication and engagement) with goals that focus on
initiation of spontaneous communication during functional activities and the generalization of
goals across, activities, communication partners and environments (National Research Council,
2001).
Using these recommendations and the previously mentioned principles of naturalistic
developmental behavioral interventions (NDBIs) (see Schreibman et al., 2015) as a framework,
International Journal of Special Education Vol. 34, 1, 2019
22
the researchers developed the Social Communication and Engagement Triad (SCET). The SCET
teaches educators how to complete authentic assessments while considering (a) the students’
communication and engagement, (b) the communication partner and the strategies he/she uses
that lead to success, and (c) the environmental strategies that support communication and
engagement. Professional development activities were designed to teach educational teams how
to use their assessment data to support all opportunities for communicative interactions for
students at all language levels including students with ASD.
The purpose of this study was twofold. First, the researchers were interested in whether
certain variables predicted whether educators dropped out of the SCET Professional Learning
Program. The program was unique compared to many professional learning programs because
participation was completely voluntary at every stage and the program was much more intense
than typical single “sit and get” types of professional learning programs (i.e., 75 hours of work
over an academic school year). Interested participants registered to participate and were able to
earn university credit or Colorado Department of Education continuing education credits for
activities they completed. It was made clear that they had the option to end their participation at
any point but were encouraged by the instructors to continue. The second purpose of this
research was to determine whether characteristics of participants’ including their baseline
attitudes and behaviors related to the SCET Professional Learning Program predicted their
attitudes and behaviors at the completion of the program. The following research questions were
posed:
1. To what extent do baseline Stages of Concern and Levels of Use, as well as participant
characteristics, predict program completion?
2. To what extent do baseline Stages of Concern and Levels of Use, as well as participant
characteristics, predict post-training Stages of Concern?
3. To what extent do baseline Stages of Concern and Levels of Use, as well as participant
characteristics, predict post-training Levels of Use?
Methods
Professional Development Context
The Social Communication and Engagement Triad (SCET) professional learning program was
designed to provide a year-long experience to educators, para-educators, and related service
providers across the state of Colorado. In May of 2016, an announcement was emailed to
educators across the state announcing the program and previewing additional information to be
sent out after the summer break. In August 2016 a flyer was emailed to educators across the
state explaining the program components and requirements and information about registration.
Participants were also informed they had an opportunity to earn either Colorado Department
of Education (CDE) contact hours or university credit for completion of course components. If
they completed at least 80% of the Module 1-4 activities, they earned contact hours with CDE or
1 credit hour with the university. If they completed at least 80% of Modules 5-6, they earned
contact hours with CDE or 1 credit hour with the university. Interested educators were asked to
apply to register for the course. Applicants registering in teams were given priority. SCET
Program Content and Requirements are provided in Table 1 below.

International Journal of Special Education Vol. 34, 1, 2019
23
Table 1: Social Communication and Engagement Triad Program Content and Requirements
Program description
The Social Communication and Engagement Triad Program is designed for school teams supporting individualized
education programs for students with communication disorders. Participants will work collaboratively to support
communicative engagement for students at all language levels, using all means of communication.
Participant Learning Objectives
1. Identify how communicative engagement is impacted by: theory of mind, joint attention, and emotional regulation.
2. Identify naturally occurring opportunities to support communicative engagement for each part of the school day
with different communication partners using a variety of communicative functions.
3. Recognize and use communication partner strategies to promote full engagement.
4. Create communication goals that align with standards, link to assessment information, and promote opportunities
for engagement.
5. Collaboratively collect and analyse meaningful data that increase communication and engagement.
Module Participant Learning Outcomes Activities/Assignments Total Time
Module 1:
Introduction to the
course
1. Define the course purpose.
2. Successfully navigate the online learning
platform.
Student Goal and Lesson Plan
Scavenger Hunt
Introduction
4 hours
Module 2: Big
Ideas of
Engagement
1. Identify how communicative engagement
is impacted by theory of mind, joint
attention, and emotional regulation
Module 2 Discussion Board
Module 2 Reflection Question
Module 2 Knowledge Check
9 hours
Module 3:
Communication
Partner and
Environment
1. Recognize and use communication partner
strategies.
2. Modify and adapt communicative
environment.
Module 3 Discussion Board
Module 3 Reflection Question
Module 3 Knowledge Check
Assessment of Communication
Partner Strategies
12
hours
Module 4: The
Child and
Communicative
Assessment
1. Apply knowledge of communication,
language, and engagement to determine
under which circumstances a child is
communicatively engaged.
2. Evaluate what kinds and levels of support
are needed to facilitate communicative
engagement across contexts.
Module 4 Discussion Board
Module 4 Reflection Question
Module 4 Knowledge Check
Assessment of Communicative
Functions
Social Communication
Engagement Tool
18
hours
Face-to-Face
Workshop:
Bringing it all
Together
1. Collaboratively create a diagnostic teaching
session plan based on assessment data.
Diagnostic teaching assessment
plan
8 hours
Module 5: Goals
and Progress
Monitoring
1. Design progress monitoring goals that align
with standards, link to assessment
information, and promote opportunities for
communicative engagement.
2. Collaboratively collect and analyze
meaningful data that informs instruction to
increase communicative engagement.
Module 5 Discussion Board
Module 5 Reflection Question
Module 5 Knowledge Check
Diagnostic Teaching Session
(Social Communication Goal
and Intervention Plan #2
12
hours
Module 6:
Collaboration and
Coaching
1. Design and carryout a professional learning
community plan with your team.
2. Support colleagues in their adoption of the
social communication and engagement triad
using the Appreciative Inquiry framework.
Module 6 Discussion Board
Module 6 Reflection Question
Module 6 Knowledge Check
Professional Learning
Community Plan
12
hours

International Journal of Special Education Vol. 34, 1, 2019
24
Data Collection and Procedures
Quantitative data were collected using three instruments. A 28-question demographic survey
was designed. This survey was then created in Qualtrics, an electronic survey development,
distribution, and management system. An explanation of the research study was provided at the
start of the survey according to university IRB approval. SCET participants answered the
question, “Do you wish to take part in this research study” before moving on to the remaining
survey questions. This served as their informed consent documentation. Only those participants
who indicated “yes” were included in the results of this study.
The remaining two assessment measures were the Stages of Concern (SoC)
Questionnaire (Hall & Loucks, 1979) and the Levels of Use Branching Interview (Loucks,
Newlove, & Hall, 1975) both part of the Concerns Based Adoption Model (CBAM; Hall &
Hord, 1987). The SoC Questionnaire allows thoughts, feeling, and perceptions to be measured
as educators are engaged in professional learning. This 35-item research validated (Bailey &
Palsha, 1992) instrument allows participants to be categorized into one of seven stages of
concern according to their responses to the questions. These stages of concern reflect the
predictable pattern of adoption seen in individuals who engage in learning a new innovation.
Participants typically move from an unconcerned stage (stage 0) to stages focusing on the impact
of their implementation (stages 4-6). Research participants were asked to take an online SoC
Questionnaire at two time-points; the fall of 2016 before they began any learning modules and,
in the spring of 2017, after they completed the program.
The Levels of Use (LoU) Branching Interview was also used as a pre- and post-
assessment measure. This component of CBAM examines the actual implementation of
participants. Similar to the SoC, individuals who are asked to adopt an innovation follow a
predictable pattern of adoption (Loucks et al., 1975). Participants start as non-users (levels 0-II)
and move up to advanced users (levels IVB-VI) given high-quality professional learning
opportunities. To gather these data, Loucks et al. (1975) developed a framework for interviews to
determine adopters’ use called the LoU Branching interview.
Participants signed up online to complete interviews with graduate research assistants.
After undergoing training, four graduate research assistants completed all pre- and post-
assessment interviews based on their availability and the availability of the participants. Each
interview was conducted over the phone and recorded. Two additional graduate research
assistants completed training until they reached 100% inter-rater reliability with the first author
using interviews from a separate study. These research assistants then completed ratings of all of
the recordings independently and were blinded to whether the recordings were gathered at pre- or
post-test. Initial inter-rater reliability was calculated at 83%. The research assistants then met to
discuss disagreements and were able to reach consensus on ratings for 100% of the interviews.
Missing Data
Missing data were imputed using the expectation-maximization (EM) algorithm. The EM
algorithm for missing data replacement is an iterative process that produces maximum likelihood
estimates were missing values are estimated in an iterative fashion via a regression-based process
International Journal of Special Education Vol. 34, 1, 2019
25
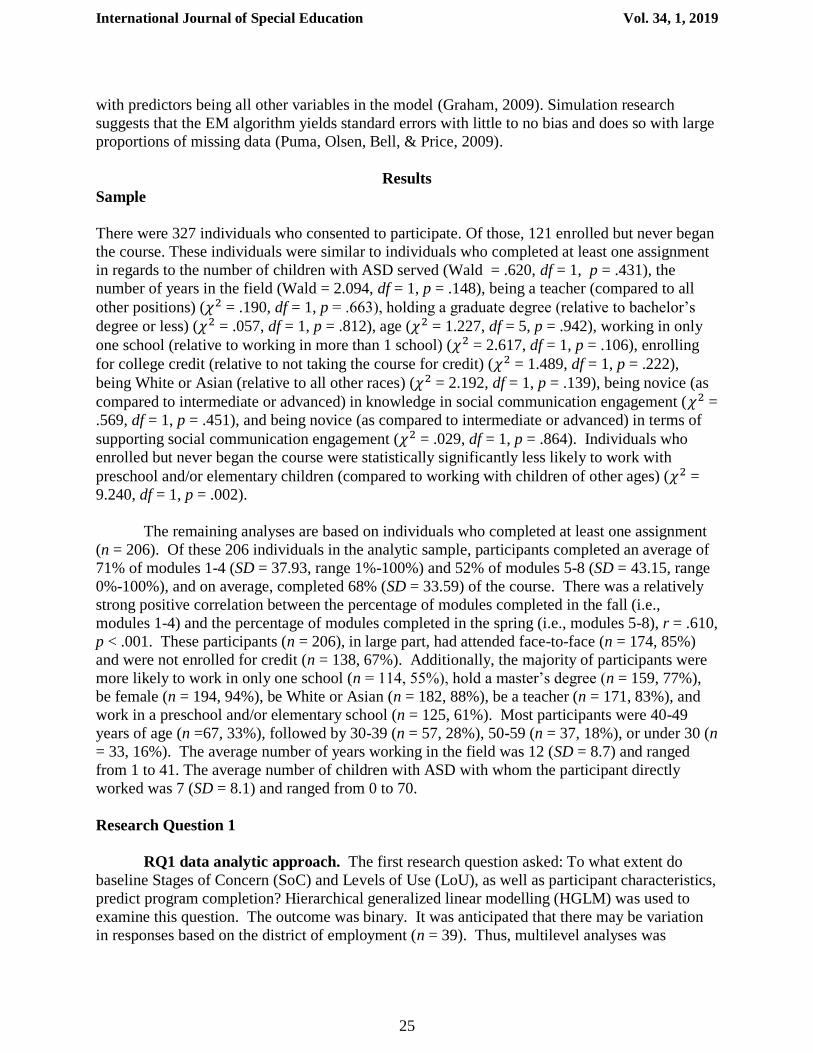
with predictors being all other variables in the model (Graham, 2009). Simulation research
suggests that the EM algorithm yields standard errors with little to no bias and does so with large
proportions of missing data (Puma, Olsen, Bell, & Price, 2009).
Results
Sample
There were 327 individuals who consented to participate. Of those, 121 enrolled but never began
the course. These individuals were similar to individuals who completed at least one assignment
in regards to the number of children with ASD served (Wald = .620, df = 1, p = .431), the
number of years in the field (Wald = 2.094, df = 1, p = .148), being a teacher (compared to all
other positions) (𝜒2 = .190, df = 1, p = .663), holding a graduate degree (relative to bachelor’s
degree or less) (𝜒2 = .057, df = 1, p = .812), age (𝜒2 = 1.227, df = 5, p = .942), working in only
one school (relative to working in more than 1 school) (𝜒2 = 2.617, df = 1, p = .106), enrolling
for college credit (relative to not taking the course for credit) (𝜒2 = 1.489, df = 1, p = .222),
being White or Asian (relative to all other races) (𝜒2 = 2.192, df = 1, p = .139), being novice (as
compared to intermediate or advanced) in knowledge in social communication engagement (𝜒2 =
.569, df = 1, p = .451), and being novice (as compared to intermediate or advanced) in terms of
supporting social communication engagement (𝜒2 = .029, df = 1, p = .864). Individuals who
enrolled but never began the course were statistically significantly less likely to work with
preschool and/or elementary children (compared to working with children of other ages) (𝜒2 =
9.240, df = 1, p = .002).
The remaining analyses are based on individuals who completed at least one assignment
(n = 206). Of these 206 individuals in the analytic sample, participants completed an average of
71% of modules 1-4 (SD = 37.93, range 1%-100%) and 52% of modules 5-8 (SD = 43.15, range
0%-100%), and on average, completed 68% (SD = 33.59) of the course. There was a relatively
strong positive correlation between the percentage of modules completed in the fall (i.e.,
modules 1-4) and the percentage of modules completed in the spring (i.e., modules 5-8), r = .610,
p < .001. These participants (n = 206), in large part, had attended face-to-face (n = 174, 85%)
and were not enrolled for credit (n = 138, 67%). Additionally, the majority of participants were
more likely to work in only one school (n = 114, 55%), hold a master’s degree (n = 159, 77%),
be female (n = 194, 94%), be White or Asian (n = 182, 88%), be a teacher (n = 171, 83%), and
work in a preschool and/or elementary school (n = 125, 61%). Most participants were 40-49
years of age (n =67, 33%), followed by 30-39 (n = 57, 28%), 50-59 (n = 37, 18%), or under 30 (n
= 33, 16%). The average number of years working in the field was 12 (SD = 8.7) and ranged
from 1 to 41. The average number of children with ASD with whom the participant directly
worked was 7 (SD = 8.1) and ranged from 0 to 70.
Research Question 1
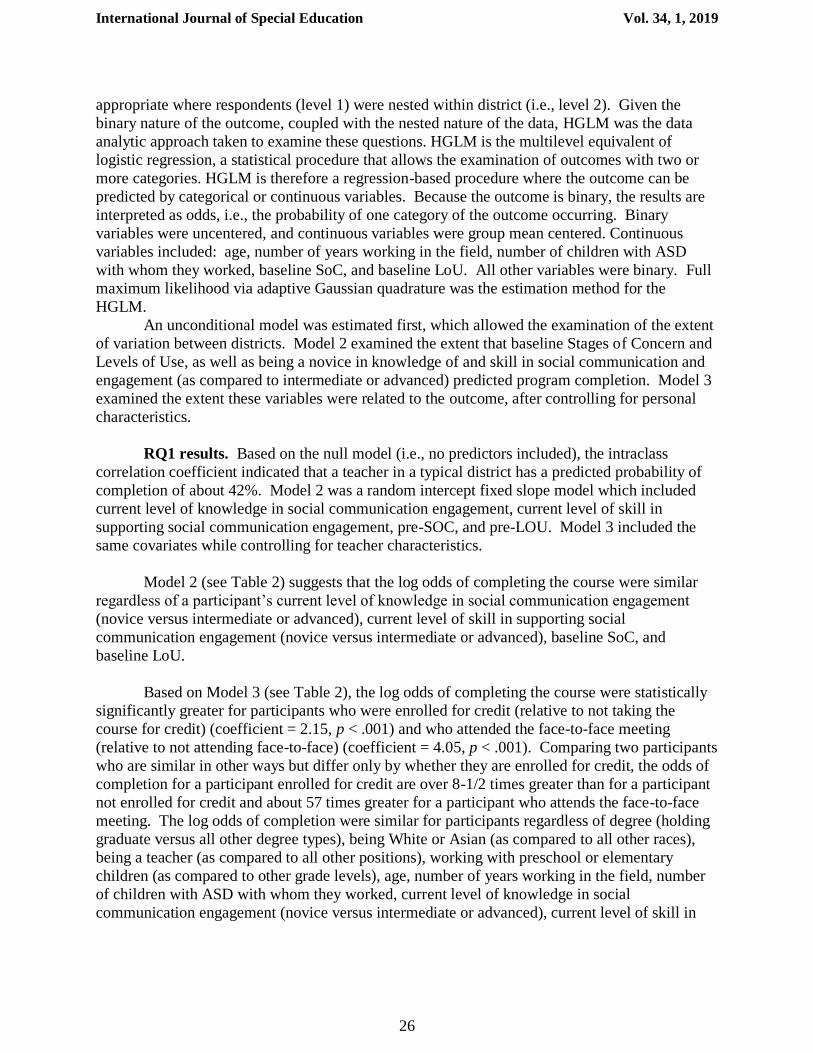
RQ1 data analytic approach. The first research question asked: To what extent do
baseline Stages of Concern (SoC) and Levels of Use (LoU), as well as participant characteristics,
predict program completion? Hierarchical generalized linear modelling (HGLM) was used to
examine this question. The outcome was binary. It was anticipated that there may be variation
in responses based on the district of employment (n = 39). Thus, multilevel analyses was
International Journal of Special Education Vol. 34, 1, 2019
26
appropriate where respondents (level 1) were nested within district (i.e., level 2). Given the
binary nature of the outcome, coupled with the nested nature of the data, HGLM was the data
analytic approach taken to examine these questions. HGLM is the multilevel equivalent of
logistic regression, a statistical procedure that allows the examination of outcomes with two or
more categories. HGLM is therefore a regression-based procedure where the outcome can be
predicted by categorical or continuous variables. Because the outcome is binary, the results are
interpreted as odds, i.e., the probability of one category of the outcome occurring. Binary
variables were uncentered, and continuous variables were group mean centered. Continuous
variables included: age, number of years working in the field, number of children with ASD
with whom they worked, baseline SoC, and baseline LoU. All other variables were binary. Full
maximum likelihood via adaptive Gaussian quadrature was the estimation method for the
HGLM.
An unconditional model was estimated first, which allowed the examination of the extent
of variation between districts. Model 2 examined the extent that baseline Stages of Concern and
Levels of Use, as well as being a novice in knowledge of and skill in social communication and
engagement (as compared to intermediate or advanced) predicted program completion. Model 3
examined the extent these variables were related to the outcome, after controlling for personal
characteristics.
RQ1 results. Based on the null model (i.e., no predictors included), the intraclass
correlation coefficient indicated that a teacher in a typical district has a predicted probability of
completion of about 42%. Model 2 was a random intercept fixed slope model which included
current level of knowledge in social communication engagement, current level of skill in
supporting social communication engagement, pre-SOC, and pre-LOU. Model 3 included the
same covariates while controlling for teacher characteristics.
Model 2 (see Table 2) suggests that the log odds of completing the course were similar
regardless of a participant’s current level of knowledge in social communication engagement
(novice versus intermediate or advanced), current level of skill in supporting social
communication engagement (novice versus intermediate or advanced), baseline SoC, and
baseline LoU.
Based on Model 3 (see Table 2), the log odds of completing the course were statistically
significantly greater for participants who were enrolled for credit (relative to not taking the
course for credit) (coefficient = 2.15, p < .001) and who attended the face-to-face meeting
(relative to not attending face-to-face) (coefficient = 4.05, p < .001). Comparing two participants
who are similar in other ways but differ only by whether they are enrolled for credit, the odds of
completion for a participant enrolled for credit are over 8-1/2 times greater than for a participant
not enrolled for credit and about 57 times greater for a participant who attends the face-to-face
meeting. The log odds of completion were similar for participants regardless of degree (holding
graduate versus all other degree types), being White or Asian (as compared to all other races),
being a teacher (as compared to all other positions), working with preschool or elementary
children (as compared to other grade levels), age, number of years working in the field, number
of children with ASD with whom they worked, current level of knowledge in social
communication engagement (novice versus intermediate or advanced), current level of skill in

International Journal of Special Education Vol. 34, 1, 2019
27
supporting social communication engagement (novice versus intermediate or advanced), baseline
SOC, and baseline LOU.
Table 2. Fixed Effects (Top) and Variance-Covariance Estimates (Bottom) for Models of the Predictors of
Program Completion Model 1 Model 2 Model 3
Fixed Effect Parameters Coefficient (SE, p) (OR; CI OR)
Coefficient (SE, p) (OR; CI OR)
Coefficient (SE, p) (OR; CI OR)
Program completion
Intercept 00
-.31 (.24, .21) (.73;
.45, 1.20)
-.27 (.29, .36) -5.76 (1.44, <.001)
(.003; .000, .058)
Model for baseline Stages of Concern slope (𝛽1)
Intercept (𝛾10)
.26 (.21, .22) (1.30;
.86, 1.96)
.28 (.26, .29) (1.32;
.79, 2.22)
Model for baseline Level of Use slope (𝛽2)
Intercept (𝛾20)
-.30 (.41, .47) (.74;
.33, 1.68)
-.61 (.54, .25) (.54;
.19, 1.56)
aModel for knowledge of social communication
engagement is novice slope (𝛽3)
Intercept (𝛾30)
-.07 (.63) (.93; .27,
3.23)
.34 (.69, .62) (1.41;
.36, 5.55)
bModel for skill in social communication
engagement is novice slope (𝛽4)
Intercept (𝛾40)
-.02 (.63, .97) (.98;
.28, 3.41)
-.24 (.68, .73) (.79;
.21, 3.02)
cModel for taking course for credit slope (𝛽5)
Intercept (𝛾50)
2.11 (.48, <.001)
(8.27; 3.18, 21.51)
dModel for graduate degree slope (𝛽6)
Intercept (𝛾60)
-.26 (.55, .63) (.77;
.26, 2.28)
eModel for White or Asian slope (𝛽7)
Intercept (𝛾70)
1.08 (.63, .09) (2.95;
.85, 10.32)
fModel for teacher (𝛽8)
Intercept (𝛾80)
-.19 (.63, .77) (.83;
.24, 2.88)
gModel for preschool or elementary (𝛽9)
Intercept (𝛾90)
.71 (.46, .13) (2.03;
.81, 5.09)
Model for age slope (𝛽10)
Intercept (𝛾100)
.17 (.25, .49) (1.19;
.72, 1.96)
Model for number of years working in field slope
(𝛽11)
Intercept (𝛾110)
-.03 (.04, .36) (.97;
.90, 1.04)
Model for number of children with ASD slope
(𝛽12)
Intercept (𝛾120)
.02 (.03, .43) (1.02;
.97, 1.08)
0
International Journal of Special Education Vol. 34, 1, 2019
28
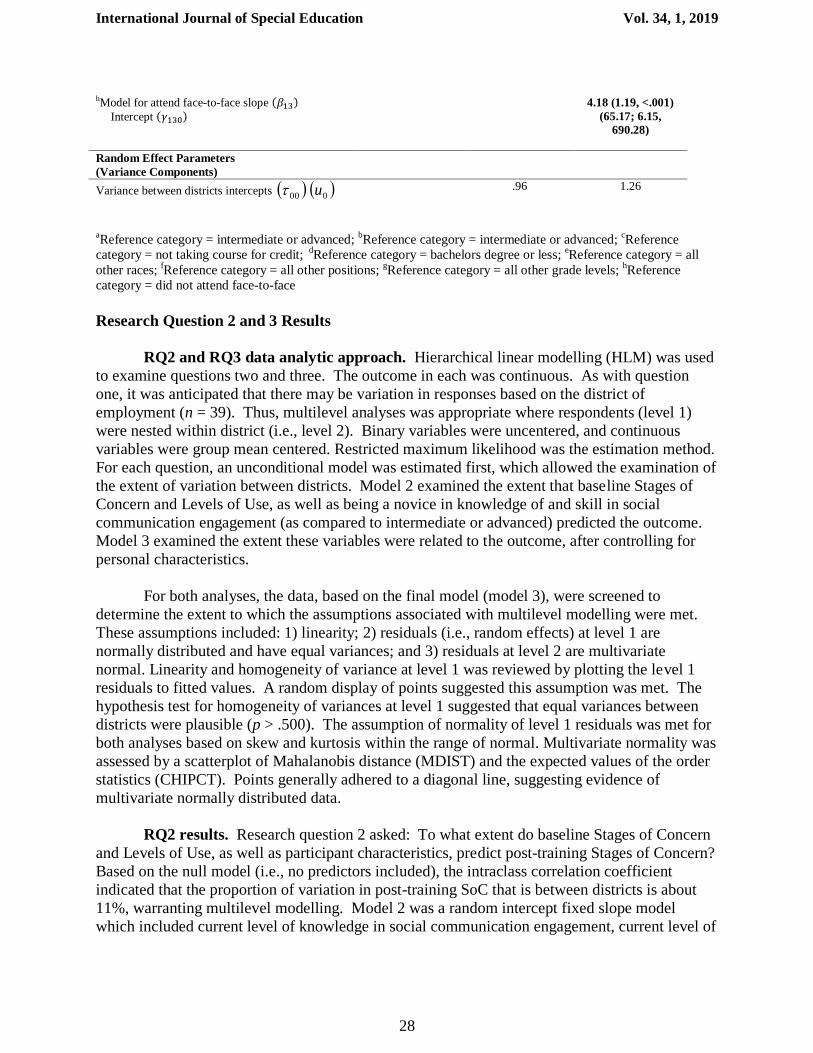
hModel for attend face-to-face slope (𝛽13)
Intercept (𝛾130)
4.18 (1.19, <.001)
(65.17; 6.15,
690.28)
Random Effect Parameters
(Variance Components)
Variance between districts intercepts 00 0u
.96 1.26
aReference category = intermediate or advanced;
bReference category = intermediate or advanced;
cReference
category = not taking course for credit; dReference category = bachelors degree or less;
eReference category = all
other races; fReference category = all other positions;
gReference category = all other grade levels;
hReference
category = did not attend face-to-face
Research Question 2 and 3 Results
RQ2 and RQ3 data analytic approach. Hierarchical linear modelling (HLM) was used
to examine questions two and three. The outcome in each was continuous. As with question
one, it was anticipated that there may be variation in responses based on the district of
employment (n = 39). Thus, multilevel analyses was appropriate where respondents (level 1)
were nested within district (i.e., level 2). Binary variables were uncentered, and continuous
variables were group mean centered. Restricted maximum likelihood was the estimation method.
For each question, an unconditional model was estimated first, which allowed the examination of
the extent of variation between districts. Model 2 examined the extent that baseline Stages of
Concern and Levels of Use, as well as being a novice in knowledge of and skill in social
communication engagement (as compared to intermediate or advanced) predicted the outcome.
Model 3 examined the extent these variables were related to the outcome, after controlling for
personal characteristics.
For both analyses, the data, based on the final model (model 3), were screened to
determine the extent to which the assumptions associated with multilevel modelling were met.
These assumptions included: 1) linearity; 2) residuals (i.e., random effects) at level 1 are
normally distributed and have equal variances; and 3) residuals at level 2 are multivariate
normal. Linearity and homogeneity of variance at level 1 was reviewed by plotting the level 1
residuals to fitted values. A random display of points suggested this assumption was met. The
hypothesis test for homogeneity of variances at level 1 suggested that equal variances between
districts were plausible (p > .500). The assumption of normality of level 1 residuals was met for
both analyses based on skew and kurtosis within the range of normal. Multivariate normality was
assessed by a scatterplot of Mahalanobis distance (MDIST) and the expected values of the order
statistics (CHIPCT). Points generally adhered to a diagonal line, suggesting evidence of
multivariate normally distributed data.
RQ2 results. Research question 2 asked: To what extent do baseline Stages of Concern
and Levels of Use, as well as participant characteristics, predict post-training Stages of Concern?
Based on the null model (i.e., no predictors included), the intraclass correlation coefficient
indicated that the proportion of variation in post-training SoC that is between districts is about
11%, warranting multilevel modelling. Model 2 was a random intercept fixed slope model
which included current level of knowledge in social communication engagement, current level of

International Journal of Special Education Vol. 34, 1, 2019
29
skill in supporting social communication engagement, pre-SoC, and pre-LoU. Model 3 included
the same covariates while controlling for teacher characteristics.
Model 2 (see Table 3) suggests that post-training Stages of Concern were similar
regardless of a participant’s current level of knowledge in social communication and engagement
(novice versus intermediate or advanced), current level of skill in supporting social
communication and engagement (novice versus intermediate or advanced), and baseline SOC.
However, baseline LoU was positive and statistically significantly related to post-training SoC.
More specifically, the average effect across districts for baseline LoU is represented as an
increase of 1.25 points in post-training SoC.
Based on Model 3 (see Table 2), on average and across districts, being a teacher (relative
to all other positions), baseline SoC, and baseline LoU were positive and statistically
significantly related to post-training Stages of Concern. The average effect (i.e., slope) across
districts for being a teacher (relative to all other positions) is represented as an increase of .75 (p
< .04). The average effect across districts for baseline SoC is represented as an increase of .12
points in post-training SoC, and baseline LoU is represented as an increase of 1.27 points in post-
training SoC. Post-training SoC were similar for participants regardless of degree (holding
graduate versus all other degree types), being White or Asian (as compared to all other races),
working with preschool or elementary children (as compared to other grade levels), age, number
of years working in the field, number of children with ASD with whom they worked, current
level of knowledge in social communication engagement (novice versus intermediate or
advanced), current level of skill in supporting social communication engagement (novice versus
intermediate or advanced), completing at least 70% of modules 1-4 (relative to completing less
than 70%), and completing at least 70% of modules 5-8 (relative to completing less than 70%).
Statistically significant variation in the district means still exists (u0 = .49, p < .001). This
suggests that differences between the districts in post-training SoC still exist. The proportion
reduction of within-district variation, relative to model 2, was less than 1%. The variation
between districts, relative to model 2, has decreased about 17%. In terms of model fit, all model
fit indices suggest better model fit when reviewing Model 2 to Model 1. However, the model fit
indices suggest Model 3 is not a better fitting model, relative to Model 2, as AIC, BIC, and SBIC
have slightly increased in Model 3 and the deviance test is not statistically significant. For
purposes of examination of the contextual model, however, interpretations of Model 3 have been
made.
Table 3. Fixed Effects (Top) and Variance-Covariance Estimates (Bottom) for Models of the Predictors of
Stages of Concern
Model 1 Model 2 Model 3
Fixed Effect Parameters Coefficient (SE,
p)
Coefficient (SE,
p)
Coefficient (SE,
p)
Mean post-Stages of Concern 0
Intercept 00
1.15 (.08, <.001) 1.55 (.22, <.001) -.01 (.60, .99)
Model for baseline Stages of Concern slope
(𝛽1)
Intercept (𝛾10)
.13 (.15, .40) .12 (.31, <.001)

International Journal of Special Education Vol. 34, 1, 2019
30
Model for baseline Level of Use slope (𝛽2)
Intercept (𝛾20)
1.25 (.30, <.001) 1.27 (.31, <.001)
aModel for knowledge of social
communication engagement is novice slope
(𝛽3)
Intercept (𝛾30)
.28 (.43, .51) .41 (.44, .36)
bModel for skill in social communication
engagement is novice slope (𝛽4)
Intercept (𝛾40)
.18 (.43, .68) .13 (.44, .76)
cModel for taking course for credit slope (𝛽5)
Intercept (𝛾50)
.19 (.29, .52)
dModel for graduate degree slope (𝛽6)
Intercept (𝛾60)
-.14 (.31, .66)
eModel for White or Asian slope (𝛽7)
Intercept (𝛾70)
.67 (.36, .07)
fModel for teacher (𝛽8)
Intercept (𝛾80)
.75 (.36, .04)
gModel for preschool or elementary (𝛽9)
Intercept (𝛾90)
-.24 (.28, .39)
Model for age slope (𝛽10)
Intercept (𝛾100)
-.07 (.15, .64)
Model for number of years working in field
slope (𝛽11)
Intercept (𝛾110)
-.01 (.02, .48)
Model for number of ASD children slope (𝛽12)
Intercept (𝛾120)
.02 (.02, .22)
hModel for attend face-to-face slope (𝛽13)
Intercept (𝛾130)
.64 (.40, .12)
iModel for completed 70% or more modules
1-4 slope (𝛽14)
Intercept (𝛾140)
-.36 (.31, .25)
jModel for completed 70% or more modules
5-8 slope (𝛽14)
Intercept (𝛾150)
.41 (.30, .17)

International Journal of Special Education Vol. 34, 1, 2019
31
Random Effect Parameters
(Variance Components)
Variance between districts intercepts 00
0u
.14 (p = .01) .62 (p < .001) .49
(p < .001)
Variance within districts
2 ijr
1.08 249 2.44
Model Fit
-2LL (Deviance Test) -- 795.77, 𝜒2=
31.59, p < .001
776.20, 𝜒2=
19.57, p = .05
AIC 833.36 809.77 812.20
BIC 836.90 818.04 833.48
SBIC 828.75 799.02 784.57
aReference category = intermediate or advanced;
bReference category = intermediate or advanced;
cReference
category = not taking course for credit; dReference category = bachelors degree or less;
eReference category = all
other races; fReference category = all other positions;
gReference category = all other grade levels;
hReference
category = did not attend face-to-face; iReference category = completed less than 70%;
jReference category =
completed less than 70%
RQ3 results. Research question 3 asked: To what extent do baseline Stages of Concern
and Levels of Use, as well as participant characteristics, predict post-training Levels of Use?
Based on the null model (i.e., no predictors included), the intraclass correlation coefficient
indicated that the proportion of variation in post-training LoU that is between districts is about
23%, warranting multilevel modelling. Model 2 was a random intercept fixed slope model
which included current level of knowledge in social communication and engagement, current
level of skill in supporting social communication and engagement, pre-SoC, and pre-LoU.
Model 3 included the same covariates while controlling for teacher characteristics.
Model 2 (see Table 4) suggests that post-training Levels of Use were similar regardless of
a participant’s current level of knowledge in social communication and engagement (novice
versus intermediate or advanced), current level of skill in supporting social communication and
engagement (novice versus intermediate or advanced), baseline SoC, and baseline LoU.
Based on Model 3 (see Table 4), on average and across districts, holding a graduate
degree (as compared to less than a graduate degree), being White or Asian (relative to all other
races), being a teacher (relative to all other positions), and having more students with ASD were
positive and statistically significantly related to post-training Levels of Use. Attending face-to-
face (relative to not attending face-to-face) and completing at least 70% of modules 1-4 (relative
to completing less than 70%) were negatively related to post-training Levels of Use.
The average effect (i.e., slope) across districts for holding a graduate degree (as compared
to less than a graduate degree) is represented as an increase of .53 points (p = .01), being White
or Asian (relative to all other races) is an increase of .81 points (p = .001), and being a teacher

International Journal of Special Education Vol. 34, 1, 2019
32
(relative to all other positions) is an increase of .65 (p = .01). Additionally, for each additional
child with ASD served, there is a .03-point increase in LoU. The average effects across districts
for attending the face-to-face meeting (relative to not attending the face-to-face meeting) and
completing at least 70% of modules 1-4 is represented as decreases of .55 and .79 points,
respectively, in post-training LoU.
Post-training LoU were similar for participants regardless of taking the course for credit
(relative to not taking the course for credit), working with preschool or elementary children (as
compared to other grade levels), age, number of years working in the field, current level of
knowledge in social communication and engagement (novice versus intermediate or advanced),
current level of skill in supporting social communication and engagement (novice versus
intermediate or advanced), completing at least 70% of modules 5-8 (relative to completing less
than 70%), baseline SoC, and baseline LoU.
Statistically significant variation in the district means still exists (u0 = .32, p < .001).
This suggests that differences between the districts in post-training LoU still exist. The
proportion reduction of within-district variation, relative to model 2, was about 24%. The
variation between districts, relative to model 2, has decreased about 22%. In terms of model fit,
all model fit indices suggest better model fit when reviewing Model 2 to Model 1 and when
reviewing Model 3 to Model 2, suggesting Model 3 is the best fitting model.
Table 4. Fixed Effects (Top) and Variance-Covariance Estimates (Bottom) for Models of the Predictors of
Levels of Use
Model 1 Model 2 Model 3
Fixed Effect Parameters Coefficient (SE,
p)
Coefficient (SE,
p)
Coefficient (SE,
p)
Mean post-Levels of Use 0
Intercept 00
3.35 (.15, <.001) 3.38 (.17, <.001) 2.69 (.42, <.001)
Model for baseline Stages of Concern slope (𝛽1)
Intercept (𝛾10)
.08 (.12, .51) .06 (.11, .59)
Model for baseline Level of Use slope (𝛽2)
Intercept (𝛾20)
.15 (.23, .52) .25 (.21, .24)
aModel for knowledge of social
communication engagement is novice slope
(𝛽3)
Intercept (𝛾30)
-.29 (.33, .39) .04 (.30, .90)
bModel for skill in social communication
engagement is novice slope (𝛽4)
Intercept (𝛾40)
.17 (.33, .61) -.11 (.30, .72)
cModel for taking course for credit slope (𝛽5)
Intercept (𝛾50)
.31 (.20, .13)

International Journal of Special Education Vol. 34, 1, 2019
33
dModel for graduate degree slope (𝛽6)
Intercept (𝛾60)
.53 (.21, .01)
eModel for White or Asian slope (𝛽7)
Intercept (𝛾70)
.81 (.25, .001)
fModel for teacher (𝛽8)
Intercept (𝛾80)
.65 (.25, .009)
gModel for preschool or elementary (𝛽9)
Intercept (𝛾90)
-.03 (.19, .88)
Model for age slope (𝛽10)
Intercept (𝛾100)
-.10 (.10, .31)
Model for number of years working in field
slope (𝛽11)
Intercept (𝛾110)
.0003 (.01, .98)
Model for number of ASD children slope
(𝛽12)
Intercept (𝛾120)
.03 (.01, .03)
hModel for attend face-to-face slope (𝛽13)
Intercept (𝛾130)
-.66 (.28, .02)
iModel for completed 70% or more modules
1-4 slope (𝛽14)
Intercept (𝛾140)
-.80 (.21, <.001)
jModel for completed 70% or more modules
5-8 slope (𝛽14)
Intercept (𝛾150)
-.08 (.20, .69)
Random Effect Parameters
(Variance Components)
Variance between districts intercepts 00
0u
.44 (p < .001) .41 (p < .001) .32
(p < .001)
Variance within districts
2 ijr
1.46 1.48 1.12
Model Fit
-2LL (Deviance Test) -- 690.22, 𝜒2=
2.83, p > .500
622.39, 𝜒2=
67.83, p < .001
AIC 704.22 658.39
BIC 712.49 679.67
International Journal of Special Education Vol. 34, 1, 2019
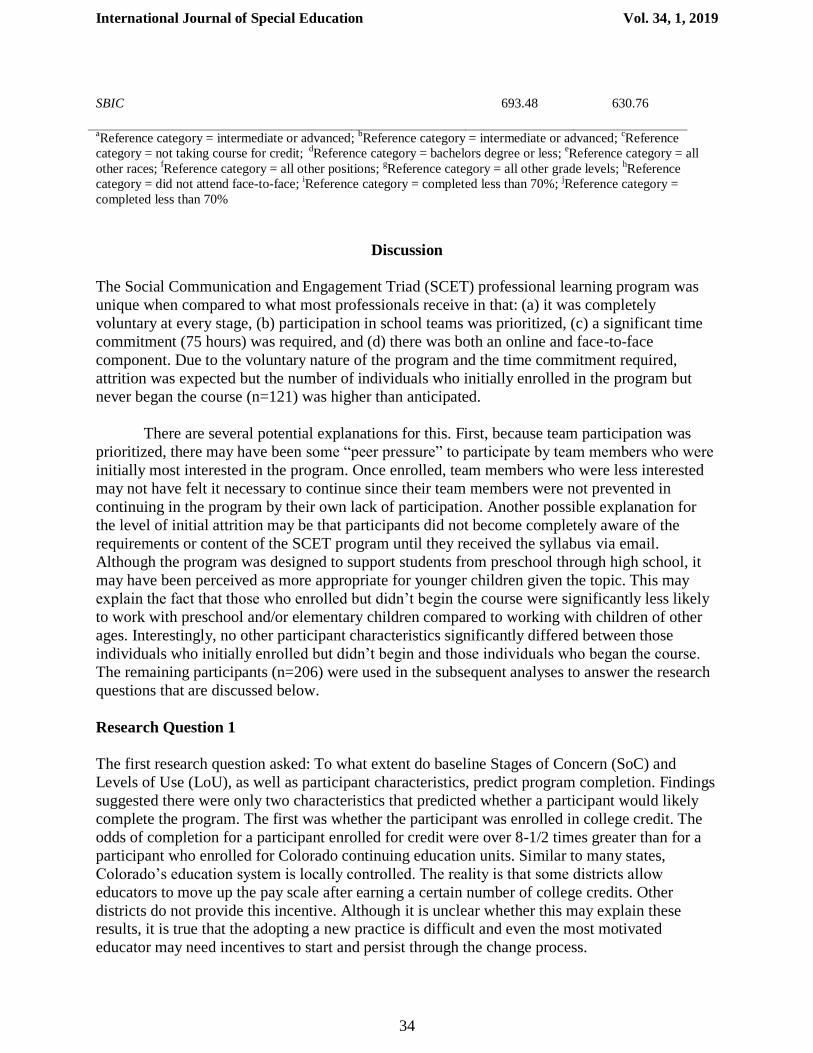
34
SBIC 693.48 630.76
aReference category = intermediate or advanced;
bReference category = intermediate or advanced;
cReference
category = not taking course for credit; dReference category = bachelors degree or less;
eReference category = all
other races; fReference category = all other positions;
gReference category = all other grade levels;
hReference
category = did not attend face-to-face; iReference category = completed less than 70%;
jReference category =
completed less than 70%
Discussion
The Social Communication and Engagement Triad (SCET) professional learning program was
unique when compared to what most professionals receive in that: (a) it was completely
voluntary at every stage, (b) participation in school teams was prioritized, (c) a significant time
commitment (75 hours) was required, and (d) there was both an online and face-to-face
component. Due to the voluntary nature of the program and the time commitment required,
attrition was expected but the number of individuals who initially enrolled in the program but
never began the course (n=121) was higher than anticipated.
There are several potential explanations for this. First, because team participation was
prioritized, there may have been some “peer pressure” to participate by team members who were
initially most interested in the program. Once enrolled, team members who were less interested
may not have felt it necessary to continue since their team members were not prevented in
continuing in the program by their own lack of participation. Another possible explanation for
the level of initial attrition may be that participants did not become completely aware of the
requirements or content of the SCET program until they received the syllabus via email.
Although the program was designed to support students from preschool through high school, it
may have been perceived as more appropriate for younger children given the topic. This may
explain the fact that those who enrolled but didn’t begin the course were significantly less likely
to work with preschool and/or elementary children compared to working with children of other
ages. Interestingly, no other participant characteristics significantly differed between those
individuals who initially enrolled but didn’t begin and those individuals who began the course.
The remaining participants (n=206) were used in the subsequent analyses to answer the research
questions that are discussed below.
Research Question 1
The first research question asked: To what extent do baseline Stages of Concern (SoC) and
Levels of Use (LoU), as well as participant characteristics, predict program completion. Findings
suggested there were only two characteristics that predicted whether a participant would likely
complete the program. The first was whether the participant was enrolled in college credit. The
odds of completion for a participant enrolled for credit were over 8-1/2 times greater than for a
participant who enrolled for Colorado continuing education units. Similar to many states,
Colorado’s education system is locally controlled. The reality is that some districts allow
educators to move up the pay scale after earning a certain number of college credits. Other
districts do not provide this incentive. Although it is unclear whether this may explain these results, it is true that the adopting a new practice is difficult and even the most motivated
educator may need incentives to start and persist through the change process.
International Journal of Special Education Vol. 34, 1, 2019
35
The other characteristic that proved to be significant was whether a participant attended
the face-to-face meeting. As previously mentioned, a single full-day face-to-face meeting was
held in locations across the state. Participants who attended this single face-to-face meeting were
about 57 times more likely to complete the program than those participants who did not attend
the face-to-face meeting. There could be several explanations for this finding. First, individuals
who were motivated to attend the face-to-face may have been more motivated to actively
participate in the SCET program than those who decided not to participate. It is also possible that
attending the face-to-face allowed educators the time they did not otherwise have to work within
their school team and/or the opportunity to build trust and collegiality.
Perhaps more interesting was the fact that no other participant characteristic or baseline
score on SoC or LoU predicted course completion. This is encouraging for those that work in the
professional learning arena because it suggests that there is not a certain “type” of educator that
should be targeted for participation. Participants who completed the program were not
significantly different from those who did not on any participant characteristic. Results suggest
that degree of participation was not related to experience level, role, education level, attitude or
initial level of use.
Research Question 2
Research question 2 asked: To what extent do baseline Stages of Concern and Levels of Use, as
well as participant characteristics, predict post-training Stages of Concern? Model 3 suggests that
baseline SoC and baseline LoU were positive and statistically significantly related to post-
training SoC. Participants with higher initial SoC and LoU scores also had higher post-training
SoC and LoU scores. Considering the fact that adopters typically move up the SoC levels of
concern from unrelated and self-types of concern to task and ultimately impact levels of concern
supports these findings. For instance, a participant who was initially unconcerned about their
involvement with the SCET program may have been less motivated to participate and thus their
attitude may be harder to change than individuals who were interested in learning more about
how adopting the SCET program would directly impact their work or the logistics of adoption.
Similarly, participants who identified at higher levels of use could focus their efforts on skill
building rather than only on information gathering and preparation for use. Because the SCET
program moved quickly from foundational knowledge to activities that promoted using the
principles of the SCET program in practice, it may have been easier for individuals at higher
initial levels of use to try than those participants who were still focused on gathering information
about the program which could explain the more positive attitudes of those participants who
came in with some knowledge and skill.
Additionally, participants who were teachers had a higher post-training SoC than those
participants who held other roles (e.g., speech-language pathologists, para-educators, speech-
language pathology assistants, and administrators). Since those participating teachers were
special educators, these results could be explained by the simple fact that they are with children
with social communication and engagement deficits all school day whereas related service
providers work with these children among many other children with other disabilities. This does
not explain the results when considering para-educators, however. Instead, it could be that para-

International Journal of Special Education Vol. 34, 1, 2019
36
educators had a greater learning curve when it came to the content than educators and may not
have grasped the importance of the content as the special educators did.
Research Question 3
Similar to question 2, research question 3 focused on whether participant characteristics and
baseline SoC and LoU scores predicted post-training LoU. Using the best fit model, Model 3, to
discuss the findings suggests that there were several characteristics that adequately predicted
post-training LoU. Interestingly, a higher degree of education was positively and significantly
related to post-training LoU along with being a teacher, being White or Asian, and having more
students with ASD. A possible explanation for these findings might be that those individuals
with higher levels of education and more experience working with students with ASD were able
to better grasp some of the foundational concepts of the SCET program and more easily change
their practice behaviors. Similarly, those with higher levels of education including teachers, may
have been introduced to concepts of SCET (e.g., joint attention, emotional regulation,
communicative functions) in their previous education. Perhaps because it was already in their
wheelhouse, they simply needed a refresher course to actually implement previous learning in
their classrooms whereas participants who did not have the background had a much steeper
learning curve.
However, attending the face-to-face training and completing at least 70% of the modules
1-4 were negatively related to post-training LoU. Although participants who were interviewed at
baseline LoU were asked to confirm that they watched the innovation configuration map video,
their understanding of the program based on only that video was not assessed. It is possible that
some participants initially thought they were using the SCET program but after learning more
about it through the modules and face-to-face meeting, realized they were not actually using it
but were doing something else which is similar to previous research findings (e.g., author, 2015).
In other words, participants who completed at least 70% of the modules were more
knowledgeable of SCET and, therefore, LoU and thus were more practical in their assessment of
LoU at post-test as compared to participants who completed less of the training. And this
realization may have been heightened for participants who attended the face-to-face training.
Conclusion
What makes a professional learning experience “high-quality” is not a new idea (e.g., Bergquist
2006; Slabine 2011; Wei et al. 2010). However, single-session professional learning experiences
are what most educators experience (Graner et al., 2012). Although, we as professional learning
facilitators, understand what is required, it remains difficult to support educators over the long-
term with the goal of changing student outcomes. The results of this investigation support this
notion. Specifically, findings suggest that face-to-face connection with colleagues and facilitators
is important as well as an incentive for participating system. Perhaps most interesting is the
finding that there is not a “type” of educator who is more inclined to commit to a year-long
professional learning endeavour. Educators, speech-language pathologists, para-educators, and
administrators all successfully completed the SCET program and all dropped out. The fact
remains there are many unanswered questions in regard to what keeps individual school
professionals inspired and motivated to change their practice. Future research should consider

International Journal of Special Education Vol. 34, 1, 2019
37
whether voluntary or required professional learning experiences yield greater outcomes and
whether delivery mode also impacts outcomes. Future research should also expand our efforts to
determine whether participant characteristics determine whether individual adopters are
encouraged through certain supports.
References
American Psychiatric Association (2013). Diagnostic and statistical manual of mental
disorders: DSM-5. Washington, D.C: American Psychiatric Association.
Atladottir, H. O., Parner, E. T., Schendel, D., Dalsgaard, S., Thomsen, P. H., & Thorsen, P.
(2007). Time trends in reported diagnoses of childhood neuropsychiatric disorders.
Archives of Pediatrics & Adolescent Medicine, 161(2), 193-8. doi:
10.1001/archpedi.161.2.193
Bailey, D.B. & Palsha, S.A. (1992). Qualities of the stages of concern questionnaire and
implications for educational innovations. Journal of Educational Research, 85, 226-232.
doi: 10.1080/00220671.1992.9941120
Bergquist, C. C. (2006). Encouraging systemic changes in professional development: A short
summary of Florida’s evaluation protocol system. Retrieved from
www.fldoe.org/profdev/pdf/firstcycle-short.pdf
Brown-Easton, L. (2013). A global perspective: What professional learning looks like around the
world. Journal of staff development, 34 (3), 11- 20.
Centers for Disease Control and Prevention (2012, March). Prevalence of autism spectrum
disorders: Autism and Developmental Disabilities Monitoring Network, 14 sites, United
States, 2008. Surveillance Summaries, 61(3), 1-24.
Centers for Disease Control and Prevention (2014, March). Prevalence of autism spectrum
disorder among children aged 8 years: Autism and Developmental Disabilities
Monitoring Network, 11 sites, United States, 2010. Surveillance Summaries, 63(2), 1-22.
Desimone, L. M. (2009). Improving impact studies of teachers’ professional development:
Toward better conceptualizations and measures. Educational Researcher, 38(3), 181-199.
doi: 10.3102/0013189X08331140
Dunst, C. J., Trivette, C. M., & Hamby, D. W. (2010) Meta-analysis of the effectiveness of four
adult learning methods and strategies. International Journal of Continuing Education and
Lifelong Learning, 3(1), 92-121. doi: 10.1002/mrdd.20176
Fishman, B., Konstantopoulos, S., Kubitskey, B. W., Vath, R., Park, G., Johnson, H., & Edelson,
D. C. (2013). Comparing the impact of online and face-to-face professional development
in the context of curriculum implementation. Journal of Teacher Education, 64(5), 426-
438. doi:10.1177/0022487113494413
Garet, M. S., Porter, A. C., Desimone, L., Birman, B. F., & Yoon, K. S. (2001). What makes
professional development effective? Results from a national sample of teachers.
American Educational Research Journal, 38(4), 915-945. doi:
10.3102/00028312038004915
Graham, J.W. (2009). Missing data analysis: Making it work in the real world. Annual Review of
Psychology, 60, 549-576. doi: 10.1146/annurev.psych.58.110405.085530
International Journal of Special Education Vol. 34, 1, 2019
38
Graner, P. S., Ault, M. M., Mellard, D. F., & Gingerich, R. A. (2012). Effective professional
development for adult learners. Lawrence, KS: University of Kansas Center for Research
on Learning.
Guskey, T. R. (2005). Taking a second look: Strong evidence reflecting the benefits of
professional development is more important than ever before. Journal of Staff
Development, 26, 10–18.
Hall, G. E., & Hord, S. M. (1987). Change in schools: Facilitating the process. Albany: State
University of New York Press.
Hall, G. E., & Loucks, S. F. (1979). Implementing innovations in schools: A concerns-based
approach. Austin: Research and Development Center for Teacher Education, The
University of Texas.
Individuals with Disabilities Education Improvement Act of 2004. Pub L No. 108–446, §§ 1400
et seq
Kirkpatrick, D. L. (1959). Techniques for evaluating training programs. Journal for the
American Society of Training Directors, 13(11), 3–9.
Learning Forward. (2011). Standards for professional learning. Oxford, OH: Author.
Loucks, S. F., Newlove, B. W., & Hall, G. E. (1975). Measuring Levels of Use of the Innovation:
A manual for trainers, interviewers, and raters. Austin: Research and Development
Center for Teacher Education, The University of Texas.
Masters, J., Magidin deKramer, R., O’Dwyer, L. M., Dash, S., & Russell, M. (2010). The effects
of online professional development on fourth grade English language arts teachers’
knowledge and instructional practices. Journal of Educational Computing Research,
43(3), 355-375. doi: 10.2190/EC.43.3.e
Muijs, D., & Lindsay, G. (2008). Where are we at? An empirical study of levels and methods of
evaluating continuing professional development. British Educational Research Journal,
34, 195–211. doi: 10.1080/01411920701532194
Myles, B. S., Simpson, R. L., & deBoer, S. R. (2008). Inclusion of students with autism spectrum
disorders in general education settings. In R. L. Simpson & B. S. Myles (Eds.), Educating
children and youth with autism: Strategies for effective practice (2nd ed., pp. 357–382).
Austin, TX: Pro-Ed
Nassar, N., Dixon, G. Bourke, J., Bower, C., Glasson, E., de Klerk, N., & Leonard, H. (2009).
Autism spectrum disorders in young children: Effect of changes in diagnostic practices.
International Journal of Epidemiology, 38(5), 1245-54. doi: 10.1093/ije/dyp260
National Research Council (2001) Educating Children with Autism. Committee on Educational
Interventions for Children with Autism. Catherine Lord and James P. McGee, eds.
Division of Behavioral and Social Sciences and Education. Washington, DC: National
Academy Press. O’Dwyer, L. M., Carey, R., & Kleiman, G. M. (2007). A study of the effectiveness of the
Louisiana Algebra I online course. Journal of Research on Technology in Education,
39(3), 289-306. doi: 10.1080/15391523.2007.10782484
Puma, M. J., Olsen, R. B., Bell, S. H., & Price, C. (2009). What to do when data are missing in
group randomized controlled trials (NCES 2009-0049). Washington, DC: National
Center for Education Evaluation and Regional Assistance, Institute of Education
Sciences, U.S. Department of Education.
Schreibman, L., Dawson, G., Stahmer, A. C., Landa, R., Rogers, S. J., McGee, G. G.,
…Halladay, A. (2015). Naturalistic developmental behavioral interventions: Empirically

International Journal of Special Education Vol. 34, 1, 2019
39
validated treatments for autism spectrum disorder. Journal of Autism and Developmental
Disorders, 45, 2411-2428. doi:10.1007/s10803-015-2407-8
Shaha, S. H., Glassett, K., & Copas, A. (2015). Sustaining student gains from online on-demand
professional development. Journal of International Education Research (JIER), 11(3),
163. doi:10.19030/jier.v11i3.9367
Slabine, N. A. (2011). Evidence of effectiveness. Oxford, OH: Learning Forward. Available at
http://learningforward.org/docs/pdf/evidenceofeffectiveness.pdf
Wei, R. C., Darling-Hammond, L., & Adamson, F. (2010). Professional development in the
United States: Trends and challenges. Oxford, OH: National Staff Development Council.
Retrieved from www.learningforward.org/news/NSDCstudytechnicalreport2010.pd


