

For reasons of economy, this document is printed in a limited number. Delegates are kindly asked to bring their copies to meetings and not to request additional copies.
I:\DSC\14\4.doc
INTERNATIONAL MARITIME ORGANIZATION
IMO
E
SUB-COMMITTEE ON DANGEROUS GOODS, SOLID CARGOES AND CONTAINERS 14th session Agenda item 4
DSC 14/4 19 June 2009 Original: ENGLISH
AMENDMENTS TO THE IMSBC CODE, INCLUDING EVALUATION OF
PROPERTIES OF SOLID BULK CARGOES
Report on data, information and experiences on high moisture (up to 12%) content DRI(C) (by-product fines)
Submitted by the Bolivarian Republic of Venezuela and Trinidad and Tobago
SUMMARY
Executive summary: This docement contains a report on the data, information and experiences discussed and analysed by the Bolivarian Republic of Venezuela and Trinidad and Tobago for further exploring the effects of high-mositure content DRI under inert conditions.
Strategic direction: 5.2
High-level action: 5.2.3
Planned output: -
Action to be taken: Paragraph 6
Related documents: DSC 12/4/1; DSC 12/4/2; DSC 13/4/8; DSC 13/INF.11; DSC 13/WP.1; MSC 85/26, paragraph 13.6 and DSC 14/INF.3
Background 1 It is recalled that at the discussions held during DSC 13, the delegation of Venezuela (Bolivarian Republic of) drew the attention of the Sub-Committee to paragraphs 13, 14 and 15 of the report of the working group (document DSC 13/WP.1) which stated that the main difficulty identified in drafting the schedule for inerting DRI Fines, which normally have a moisture content of up to 12%, was that no information was available on the form on how this wet cargo would behave under inert conditions. 2 In this sense, the working group accepted the proposal made by the delegations of Venezuela (Bolivarian Republic of) and Trinidad and Tobago to coordinate data, information and experiences through a voluntary correspondence group, in order to submit, to DSC 14, a document with a draft proposal for a DSC circular based on document DSC 12/4/1 submitted by Venezuela and in accordance with section 1.5 of the IMSBC Code. Venezuela (Bolivarian Republic of) will coordinate this joint effort under the chairmanship of Dr. Oscar Dam ([email protected]).
DSC 14/4 - 2 -
I:\DSC\14\4.doc
3 The main issues raised during the DSC 13 were the definition of DRI(C) (by-product fines) as a new cargo, besides its physical and chemical characteristics and moisture content of less than 0.3%, and whether or not DRI(C) high moisture cargo shall be carried under either mechanical ventilation or inert conditions. 4 During the meetings of DSC 11, DSC 12 and DSC 13, the following issues were discussed on the mechanical ventilation issue, which are the most relevant ones regarding the cargo:
.1 the “porous” character of the DRI(C) (by-product fines) cargo; .2 if mechanical ventilation was used, fresh wet and “salty” air will come into the
holds and the possibility of the fresh air to circulate through the “porous” cargo; .3 the possibility of triggering the iron re-oxidation and in consequence of the self
heating of the cargo and the Hydrogen release; and .4 the assessment of whether the hydrogen release rate of the cargo or the hydrogen
gas accumulation in the holds are the real hazard for the safe transport of the cargo.
5 The joint report produced by Venezuela (Bolivarian Republic of) and Trinidad and Tobago is set out in the annex to this document. Action requested of the Sub-Committee 6 The Sub-Committee is invited to note the information provided and take action as appropriate.
***

DSC 14/4
I:\DSC\14\4.doc
ANNEX
REPORT ON DATA, INFORMATION AND EXPERIENCES OF HIGH-MOISTURE CONTENT IN DRI FINES
Background 1 This report contains new technical information for:
.1 DRI(C) shipments conducted by Trinidad and Tobago, and Venezuela (Bolivarian Republic of) with mechanical ventilation (May 2005 up to March 2009); total tonnage, number of shipments, moisture content (greater than 0.3%), temperature, grain size (below 12 mm), bulk density, etc.;
.2 DRI Fines shipments destination: geographical area, %, voyage-day; .3 Safety index: 104 shipments carried safely under mechanical ventilation; and .4 Results of high moisture (up to 12% moisture) DRI(C) (by-product fines)
laboratory, pilot and shipments monitoring. 2 In order to solve the main issues presented during DSC 11, DSC 12 and DSC 13, several new tonne-scale tests were carried out by means of “Test Drums” and “Test Tanks” aiming to assess the following:
.1 the “porous” character of the DRI(C) (by-product fines) with moisture content over 0.3% and up to 12%; and
.2 the effect of inerting on this cargo.
3 One of the Drum Tests consisted in the measurement of the pressure drop measurement when allowing the flow of nitrogen gas through the DRI(C) (by-product fines) bed inside a 55-gallon capacity drum. 4 The other tests in drums (55-gall-cap.), one, and in a tank (4.3 m3), another, the following parameters were monitored: temperature of the DRI(C) (by-product fines) bed, the composition of the gases including Hydrogen, Oxygen and Nitrogen in percent volume. 5 All test details were presented in documents DSC 14/INF.3.

DSC 14/4 ANNEX Page 2
I:\DSC\14\4.doc
DRI(C) fines (by-product fines) characterization 6 The materials tested were DRI(C) fines (by-product fines) obtained from the processing and handling of DRI(A) and DRI (B). The characteristics of both materials are shown in Table I.
Tested DRI(C) DRI(C) (by-product fines) Characteristics from DRI(A) from DRI(B) Metallic iron 1-75% 1-75% Grain size up to 12 mm up to 12 mm Moisture content >0.3 - 12% >0.3 - 12% Aging minimum 30 days minimum 30 days Bulk density (Kg/m3) 1850-3300 1850-3300 Stowage Factor 0.3-0.54 0.3-0.54 Total Iron 64-90 62-90 Carbon 0.2-2.0 0.2-2.5 Phosphorus 0.07-0.1 0.03-0.1 Sulphur 0.01-0.03 0.01-0.03 Total Gangue 4.5-6.0 4.5-6.5 Typical grain size: >12 mm 6% max 6% max >6.35 mm 10-20% 10-20% <6.35 mm 90-80% 90-80%
Table I – Characteristics of DRI(A) and DRI(B) 7 Both materials showed to be very similar in chemical and physical characteristics. Therefore, the present approved schedule does apply for a single cargo. Laboratory and industry tests 8 Two sets of test were carried out in the Laboratory (Kilos Scale) and in Industry (Tonne-Scale) are referred below as “DRUM TEST, in order to generate the necessary information of the high moisture material. 8.1 Drum test procedures for assessing High Moisture DRI(C) (by- product fines) properties carried out by Trinidad and Tobago were as follows:
.1 The tests, as listed below were carried out by two 200 kg of DRI(C) with a high moisture content samples. The samples were put into a 0.21 cubic metre drum, fitted with suitable monitoring devices and instruments to the drum, in order to measure and record temperature (ºC), percentage of Hydrogen, Oxygen in the open space of the drum.
.1 fines reaction with Oxygen to result in an inert atmosphere;
.2 Hydrogen release rate in a sealed environment;
.3 effects of natural ventilation on Hydrogen development;
.4 Hydrogen release rate after inerting;
DSC 14/4 ANNEX
Page 3
I:\DSC\14\4.doc
.5 temperature condition monitoring; and
.6 Hydrogen release rate in closed drum with some level of natural ventilation. 8.2 The results of the Drum Tests were as follows: 8.2.1 Test I
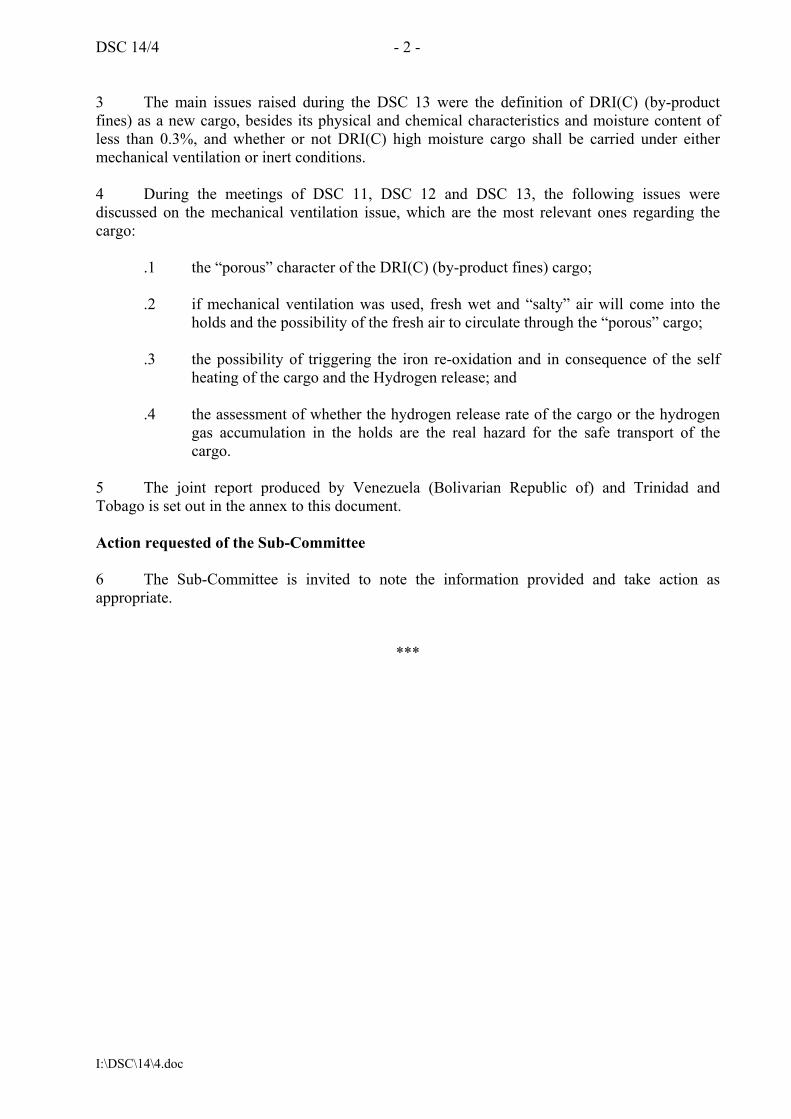
.1 The DRI(C) sample (Mexico Blend) had the following physical characteristics:
Moisture content: 7 % Bulk density: 2,550 kg/m3 Open porosity: 30% max.
.2 Sealed environment
.1 The sample was placed in an open drum and then sealed. After about 15 minutes the gas contained in the drum was analysed. It showed oxygen level below 2% without introduction of any external gases. The LEL at this point was 0.
.2 This low Oxygen content showed that the DRI(C) has the capability to
rapidly consume the oxygen from the environment to produce an inert atmosphere once system is sealed properly. The reactions taking place here is re-oxidation of metallic iron. This is confirmed through temperature profile of tests.
.3 The highest hydrogen evolution rate was 0.00052 lt/Kg.Hr at first,
averaged out to 0.00012 lt/Kg.Hr over 45-hour period and then went practically to zero. The reduction in hydrogen evolution after rate went to zero was most likely due to sampling which would remove hydrogen from the environment and also allow some but very little circulation of gases (mechanical ventilation effect).
.4 The results can be seen on Figure 1.
MV AHMSA DRI(C) Barrel Test Gas Trends 2009
NuIron - Trinidad
0
2
4
6
8
10
12
14
16
18
20
22
24
26
28
30
5-Apr 7-Apr 9-Apr 11-Apr 13-Apr 15-Apr 17-Apr 19-Apr 21-Apr 23-Apr 25-Apr 27-Apr
Perc
enta
ge %
LEL (%) O2 (vol %)
TOTAL Fe (%)
MET-Fe (%)
CARBON (%)
MOISTURE (%)
Start 80.48 36.62 2.73 6.91 Natural WaterEnd 81.03 39.32 2.77 3.25
Natural Venting
Sealed Environment
Inerting with N2
FIGURE 1

DSC 14/4 ANNEX Page 4
I:\DSC\14\4.doc
.3 Natural venting
.1 The top valve on drum test was opened for a period of approximately one hour with no driving force. The Oxygen came up to 4% and Hydrogen LEL went to zero. The valve was then left open and we moved to the inerting stage.
.4 Inerting
.1 Even though labelled inerting in graph 1 above, the inerting only
occurred for a period of about 15 minutes maximum. The Oxygen was brought back down to less than 1% Oxygen in the drum and then the top valve was closed making the system sealed again. Inerting had an effect of allowing the forward reaction to proceed. However it was at a much slower rate.
.2 The rate of H2 at this point after inerting was calculated
at 0.000093 lt/Kg.Hr. The cycling of results is most likely due to sampling. However the LEL was always showing an upward trend indicating if left for an extended period without testing the LEL would have accumulated.
.3 The material quality specs did not show much change. However
the moisture content before and after test showed a decrease of about 50%. This is not due to inerting since only 15 minutes of nitrogen was introduced. The fact that the drum was sealed resulted in a very humid environment and sampling and natural ventilation together with inerting provided the drive to remove the moisture from the containment. Other drum tests with longer inerting periods exceeding 1 hour each day did not show similar drop in moisture %.
8.2.2 Test II
.1 The DRI(C) sample (China Blend) had the following physical characteristics:
Moisture content: 9 % Bulk Density: 2,600 kg/m3 Open Porosity: 30% max.
.2 Closed drum
.1 The same effect as with Test I was observed with this material. The
oxygen in environment reduced to a low level but not to low levels as in the test I. The lowest value recorded was approximately 8.5% Oxygen. One possible explanation is due to non-perfect seal of drum which will allow some form of natural ventilation.

DSC 14/4 ANNEX
Page 5
I:\DSC\14\4.doc
.2 Some hydrogen LEL was measured but not consistently. The natural ventilation of the drum could possibly explain this inconsistency in hydrogen LEL readings. The few data points showing Hydrogen LEL gives us a rate of 0.00009 lt/Kg.Hr of Hydrogen which was similar to that of after inerting in the test I.
.3 Inerting
.1 Data was recorded with the instruction of once O2 exceeded 5-6 % perform
the inerting procedure which involved introduction of Nitrogen at a controlled rate to the drum. Allow the Oxygen to drop below 2% and then stop addition of Nitrogen. In this test we were unable to maintain a consistent inert atmosphere (less than 5% Oxygen). During the testing period inerting had to be done approximately 4 times.
.2 During this period no Hydrogen was detected.
.3 Results can be seen in Figure 2.
MV CHINA DRI(C) Barrel Test Gas Trends 2009
NuIron - Trinidad
0
5
10
15
20
25
5-Apr 7-Apr 9-Apr 11-Apr 13-Apr 15-Apr 17-Apr 19-Apr 21-Apr 23-Apr 25-Apr 27-Apr 29-Apr
(ppm
)
LEL (%) O2 (vol %)
TOTAL Fe (%)
MET-Fe (%)
CARBON (%)
MOISTURE (%)
Start 84.89 59.82 3.45 8.95 Distilled Water
End 84.93 59.92 3.43 7.82
Closed drum Inerting Stage
FIGURE 2
DRI(C) (by-product fines) temperature monitoring – Holds Simulation Rig Results obtained by Trinidad and Tobago 9 Temperature monitoring experiments were carried out with high and low metallic iron content samples. The test method used was presented at the meeting of DSC 12 (refer to document DSC 12/4/2). No abnormal measurement were recorded from both samples, the results are show in figures 3 and 4.

DSC 14/4 ANNEX Page 6
I:\DSC\14\4.doc
FIGURE 3
FIGURE 4 DRI(C) (by-product fines) temperature monitoring – Holds Simulation Rig Results obtained by Venezuela 10 Drum Test (Pressure Drum Test): The Pressure drop test aimed to measure the required pressure for the gas to fill all the open spaces inside the testing drum, including the open spaces of the cargo.
.1 Drum Test (Pressure Drum Test) Results
.1 The Drum Pressure test consisted in the measurement of the pressure drop measurement when allowing the flow of Nitrogen gas through the DRI(C) (by-product fines) bed inside the 55-gall capacity drum.
.2 The test demonstrated the requirement of a pressure of 1.5 bar to get the
flow of nitrogen through the DRI(C) (by-product fines) bed. This means that the density of the bed is such that the gas must be pumped to get
DSC 14/4 ANNEX
Page 7
I:\DSC\14\4.doc
through, therefore it is unlikely that the fanned marine air allowed into the holds can get into the cargo.
.3 Having said that the marine air circulation in the holds will be unlikely to
circulate into the cargo, its effect will be more likely to overflow the cargo and any re-oxidation would be most likely a rusty effect on the DRI(C) (by-product fines) surface. This would have a little effect on the re-oxidation and self-heating of the DRI(C).
.2 Tank test for assessing of the Venezuelan High Moisture DRI(C) (by-product
fines) properties
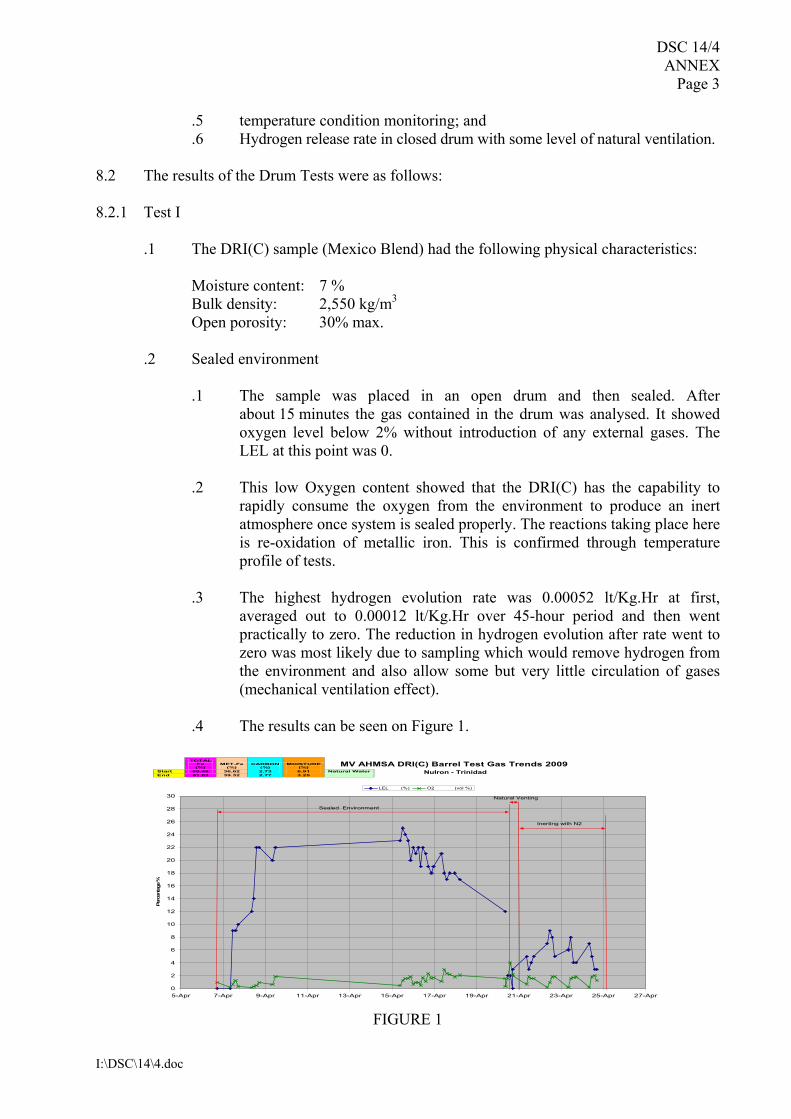
.1 A 4.3-m3 test tank with a 4.28-mt-sample of DRI(C) (by-product fines) with a moisture content of 7-8 % sample test was run by Venezuelan producers. The sample was put into a 4.3 cubic metre tank and several parameters were monitored; the DRI(C) (by-product fines) sample had the following physical characteristics:
Bulk Density: 2.5 cubic metres/tonne Open Porosity: 30% max. Materials volume: 1.792 cubic metres Empty volume: 3.06 cubic metres
.2 Suitable monitoring devices and instruments were fitted to the drum in
order to measure and record temperature (ºC), percent of hydrogen, oxygen and nitrogen in the open space of the tank.
.3 The material tested had the following physical and chemical characteristics, see
Table II:
% Feº % FeT %C % S % P % SiO2 % Al2O3 % CaO % MgO 44.21 79.90 0.71 0.016 0.114 1.73 1.18 0.49 0.17
% 1/2" % 3/8" % 1/4" % 4 mm % 2.8 mm % 1 mm % Pan % H2O
0.20 0.51 2.28 6.36 12.74 41.78 36.15 7.79
Table II – Venezuelan DRI(C) (by-product fines) characteristics .4 The following tests were carried out:
.1 Hydrogen release – inerting phase. The drum with Nitrogen and measuring
of the DRI(C) (by-product fines) Hydrogen release rate and further accumulation inside the drum;
.2 Hydrogen release – natural ventilation phase. After the Hydrogen level
reaches 1% the gas releasing valve was open to allow natural ventilation; .3 Hydrogen release – mechanical ventilation phase. After reaching a steady
Nitrogen level, mechanical ventilation was started. Ventilation was made in two stages, i.e. Stage I – every four hours and Stage II – every three hours;

DSC 14/4 ANNEX Page 8
I:\DSC\14\4.doc
.4 continuous mechanical ventilation; and .5 temperature monitoring results.
.5 Tank test results: The maximum pressure increase in the tank, 0.047 bar, was
measured during the trials under inert conditions whereas no significant pressure increase was measured after the following stages: purging with nitrogen and natural discontinuous ventilation (NDV) as well as under mechanical discontinuous ventilation (FDV 1/3 and 1/4 hours) and continuous mechanical ventilation (FCV) conditions. This variable can be observed in Figure 5.
Pressure inside the tank
0.0000.0050.0100.0150.0200.0250.0300.0350.0400.0450.050
Nº Hours
Pre
ssur
e ( b
ar )
FCV
Iner
ting
Purg
ed
NCV
N. D. V.F: 1 / 4
F. D. V.F: 1 / 4
F. D. V.F: 1 / 3
M aximum Value: 0.047 bar 0,682 psi0.048 Kg/cm2 0.046 atm 4.7 KPa
FIGURE 5
Sample monitoring 11 Hydrogen release rate. The monitoring of the gas atmosphere inside the drum was monitored for the following variables:
• % Hydrogen • % Oxygen • % Nitrogen • Temperature (ºC).
.1 Hydrogen release during the test: figure 6 below, shows the Hydrogen release
measurements under different conditions.
Hydrogen Generation Rate [L/Kg*h]
0,0000
0,0005
0,0010
0,0015
0,0020
0,0025
Nº Hours
L / K
g . h
Iner
ting
Purg
ed NCV
N. D. V.F: 1 / 4 F. D. V.F: 1 / 4
F. D. V.F: 1 / 3
FCV
UN Dangerous Cargo Rate: 1 L/Kg.H
FIGURE 6
DSC 14/4 ANNEX
Page 9
I:\DSC\14\4.doc
.2 from the above figure it is possible to notice the drop of the Hydrogen gas release when using mechanical ventilation. The result of the discussion is presented below.
.3 Hydrogen release – inerting phase: two tests were carried out for this inert
condition, aiming to set a difference between the Hydrogen gas generation rate and the rate of accumulation of this gas.
.1 Test I
.1 Soon after the drum was filled with nitrogen gas and the Oxygen
level reached 0.27%, the Hydrogen release was measured. The measured Hydrogen release, in the UN Test units, showed a maximum value of 0.00191 lt.H2/Kg.Hr. This value is well below the maximum value of 1Lt.H2/Kg.Hr, required as per the UN Test Manual to characterize the DRI(C) (by-product fines) as either Class 4.2 or Class 4.3.
.2 During this phase, neither self ignition of the released gas nor self
heating of the DRI(C) (by-product fines) was observed. The carried out test has demonstrated that the DRI(C) (by-product fines) hazard is not the Hydrogen release but it rather be the Hydrogen built up concentration inside any container. The Hydrogen concentration inside the drum reached 1.1% in five (5) hours.
.2 Test II
The second set of the Hydrogen gas release under inert conditions was carried out with the following sample, as shown in Table III:
% Feº % FeT %C % S % P % SiO2 % Al2O3 % CaO % MgO 39.28 78.73 0.68 0.017 0.12 1.89 1.07 0.31 0.13
% 1/2" % 3/8" % 1/4" % 4 mm % 2.8 mm % 1 mm % Pan % H2O
0.17 0.76 2.15 5.99 18.48 29.69 42.77 10.54
Table III – Venezuelan DRI(C) (by-product fines) characteristics
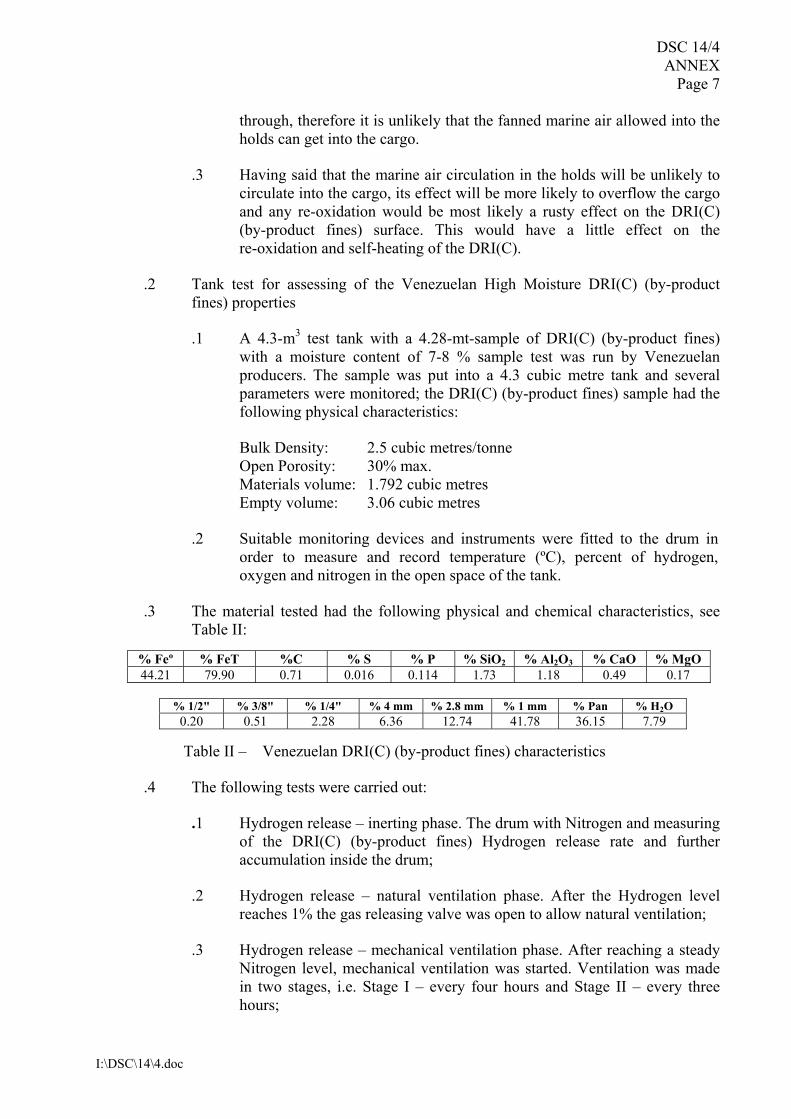
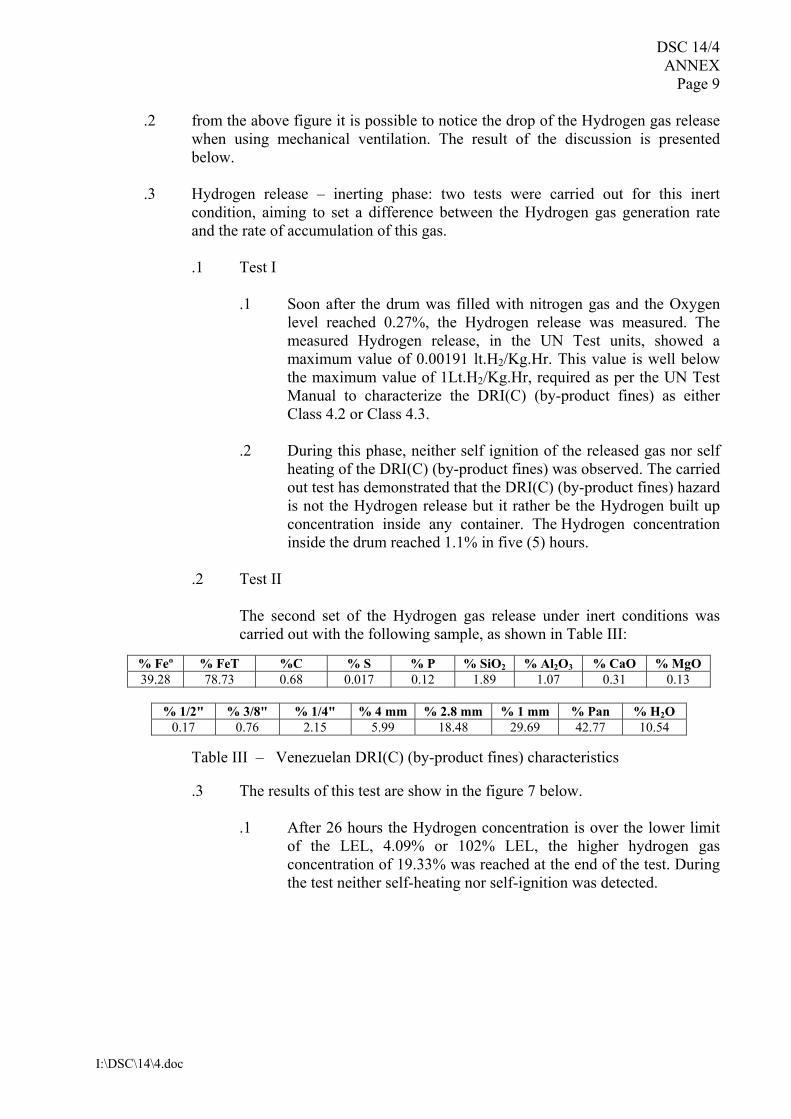
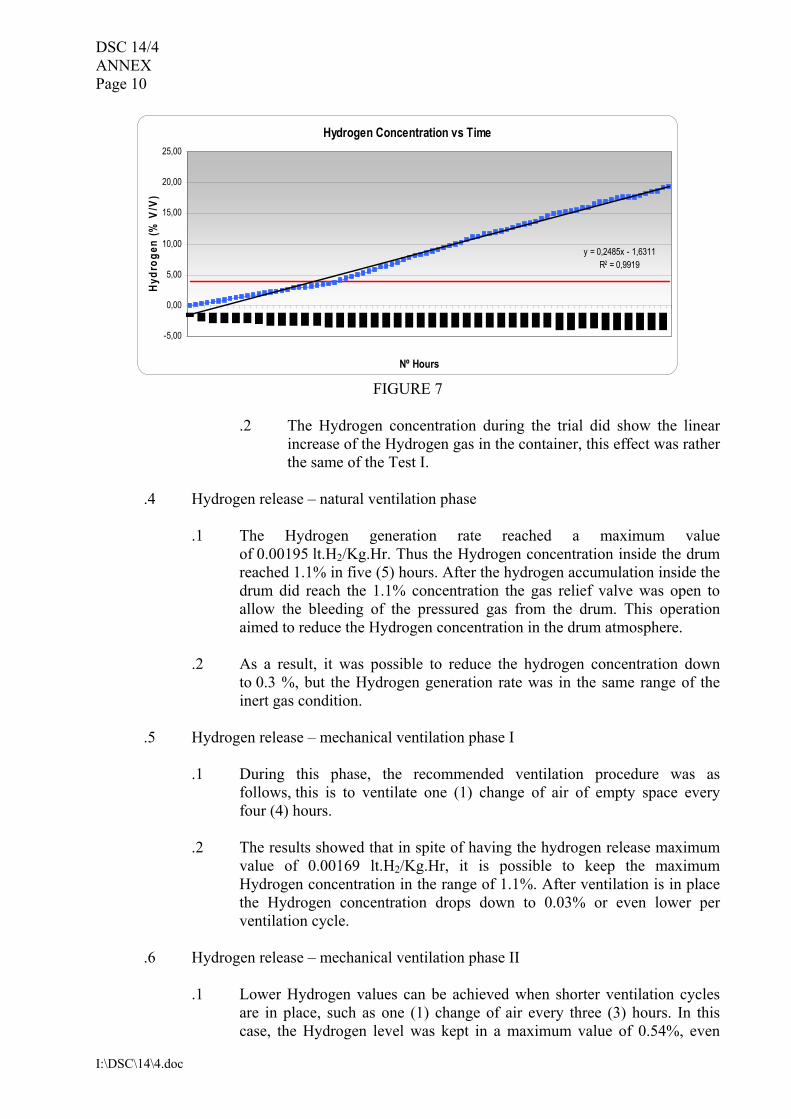
.3 The results of this test are show in the figure 7 below.
.1 After 26 hours the Hydrogen concentration is over the lower limit of the LEL, 4.09% or 102% LEL, the higher hydrogen gas concentration of 19.33% was reached at the end of the test. During the test neither self-heating nor self-ignition was detected.
DSC 14/4 ANNEX Page 10
I:\DSC\14\4.doc
Hydrogen Concentration vs Time
y = 0,2485x - 1,6311R2 = 0,9919
-5,00
0,00
5,00
10,00
15,00
20,00
25,00
Nº Hours
Hydr
ogen
(% V
/V)
FIGURE 7
.2 The Hydrogen concentration during the trial did show the linear
increase of the Hydrogen gas in the container, this effect was rather the same of the Test I.
.4 Hydrogen release – natural ventilation phase
.1 The Hydrogen generation rate reached a maximum value of 0.00195 lt.H2/Kg.Hr. Thus the Hydrogen concentration inside the drum reached 1.1% in five (5) hours. After the hydrogen accumulation inside the drum did reach the 1.1% concentration the gas relief valve was open to allow the bleeding of the pressured gas from the drum. This operation aimed to reduce the Hydrogen concentration in the drum atmosphere.
.2 As a result, it was possible to reduce the hydrogen concentration down
to 0.3 %, but the Hydrogen generation rate was in the same range of the inert gas condition.
.5 Hydrogen release – mechanical ventilation phase I
.1 During this phase, the recommended ventilation procedure was as
follows, this is to ventilate one (1) change of air of empty space every four (4) hours.
.2 The results showed that in spite of having the hydrogen release maximum
value of 0.00169 lt.H2/Kg.Hr, it is possible to keep the maximum Hydrogen concentration in the range of 1.1%. After ventilation is in place the Hydrogen concentration drops down to 0.03% or even lower per ventilation cycle.
.6 Hydrogen release – mechanical ventilation phase II
.1 Lower Hydrogen values can be achieved when shorter ventilation cycles
are in place, such as one (1) change of air every three (3) hours. In this case, the Hydrogen level was kept in a maximum value of 0.54%, even

DSC 14/4 ANNEX Page 11
I:\DSC\14\4.doc
though the maximum Hydrogen generation rate was 0.00123 lt.H2/Kg.Hr. This can be used in more severe conditions of Hydrogen release values or when having abnormal conditions.
.2 It is to point out that because the DRUM TEST was carried out with the
same sample, the Hydrogen release steadily decreased during the test period, as show in the following Table IV.
Test Phase Max. Hydrogen Release
Rate lt/Kg.Hr/(m3/day) Inert gas 0.00191/ (183) Natural surface ventilation 0.00195/ (187) Mechanical ventilation (4 hours cycle) 0.00169/ (162) Mechanical ventilation (3 hours cycle) 0.00123/ (118)
Table IV – Hydrogen gas release rate during the different phases of tests
.3 This effect coincides with the drop of the moisture in the sample that ended up in the range of 3.75%. This can be related with the exhausting of the water as a source of hydrogen release in the cargo. The final physical and chemical characteristics of the material are shown in Table V.
% Feº % FeT %C % S % P % SiO2 % Al2O3 % CaO % MgO 39.28 78.73 0.68 0.017 0.12 1.89 1.07 0.31 0.13
% 1/2" % 3/8" % 1/4" % 4 mm % 2.8 mm % 1 mm % Pan % H2O
0.17 0.76 2.15 5.99 18.48 29.69 42.77 3.72
Table V – Venezuelan DRI(C) (by-product fines) characteristics Continuous mechanical ventilation phase 12 Continuous mechanical ventilation test was also carried out. This was because this operation has been considered as an action to be carried out in emergency cases, when the ships approaching the port are either in distress or just cross a rough sea situation, and presents one or several holds with a high Hydrogen concentration. The test was performed after the DRI(C) (by-product fines) sample Hydrogen release rate of 0.00123 lt/Kg.Hr. The result of this test was that this operation will deplete the hydrogen in the hold.
.1 Oxygen monitoring
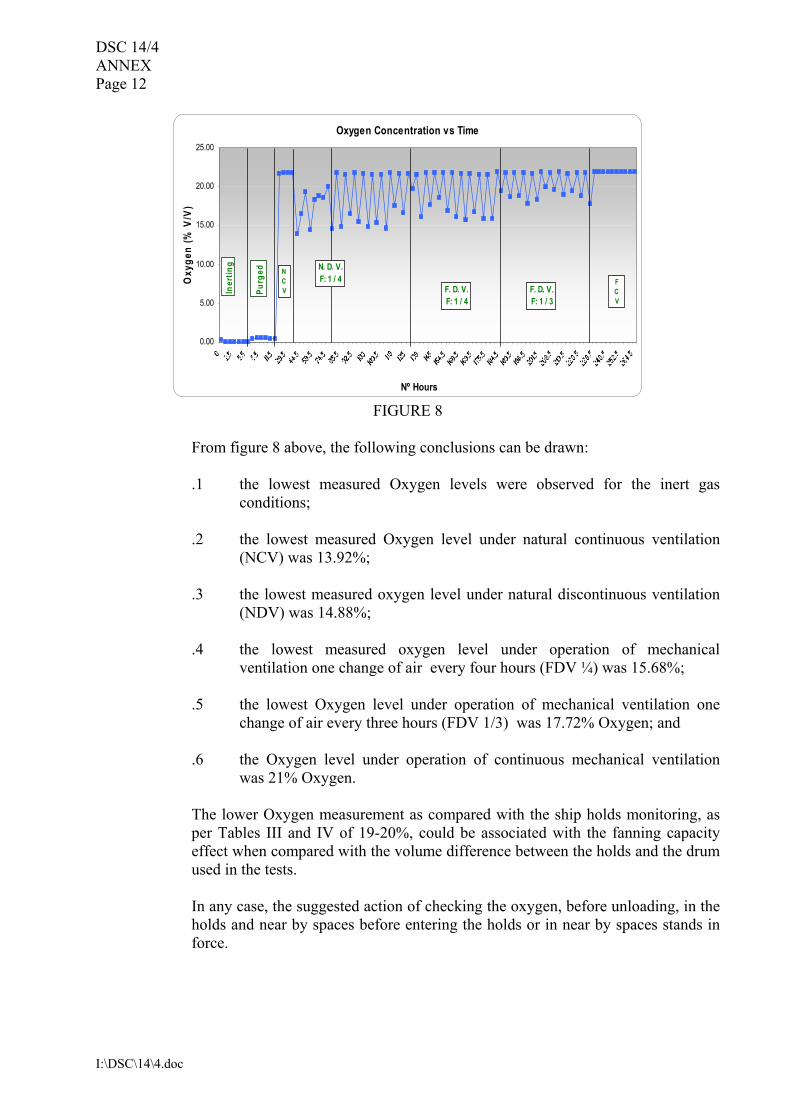
The Oxygen gas monitoring during mechanical ventilation phases showed the following results as presented in Figure 8.
DSC 14/4 ANNEX Page 12
I:\DSC\14\4.doc
Oxygen Concentration vs Time
0.00
5.00
10.00
15.00
20.00
25.00
Nº Hours
Oxy
gen
(% V
/V)
F. D. V.F: 1 / 3
Iner
ting
F. D. V.F: 1 / 4
NCV
N. D. V.F: 1 / 4 F
CV
Purg
ed
FIGURE 8
From figure 8 above, the following conclusions can be drawn:
.1 the lowest measured Oxygen levels were observed for the inert gas
conditions; .2 the lowest measured Oxygen level under natural continuous ventilation
(NCV) was 13.92%; .3 the lowest measured oxygen level under natural discontinuous ventilation
(NDV) was 14.88%; .4 the lowest measured oxygen level under operation of mechanical
ventilation one change of air every four hours (FDV ¼) was 15.68%; .5 the lowest Oxygen level under operation of mechanical ventilation one
change of air every three hours (FDV 1/3) was 17.72% Oxygen; and .6 the Oxygen level under operation of continuous mechanical ventilation
was 21% Oxygen.
The lower Oxygen measurement as compared with the ship holds monitoring, as per Tables III and IV of 19-20%, could be associated with the fanning capacity effect when compared with the volume difference between the holds and the drum used in the tests.
In any case, the suggested action of checking the oxygen, before unloading, in the
holds and near by spaces before entering the holds or in near by spaces stands in force.

DSC 14/4 ANNEX Page 13
I:\DSC\14\4.doc
.2 Nitrogen monitoring
The Nitrogen gas monitoring during mechanical ventilation phases showed to follow the air balance as per the corresponding oxygen level, see Figure 9. It should be pointed out the reduction of Nitrogen content in the atmosphere, taking into account that the drum test was a gastight container contrary to a ship’s hold, which is not gas tight. We should calculate how much nitrogen should be topped up for a voyage of 45 days.
Nitrogen Concentration vs Time
70.00
75.00
80.00
85.00
90.00
95.00
100.00
105.00
Nº Hours
Nitr
ogen
(% V
/V)
F. D. V.F: 1 / 3
Iner
ting
F. D. V.F: 1 / 4
NCV
N. D. V.F: 1 / 4
FCV
Purg
ed
FIGURE 9
.3 Temperature monitoring
During the Drum Test period, the temperature monitoring did not show an abnormal behaviour, see figure 10.
Temperature of the DRI (C)
2022
24262830
323436
3840
Nº Hours
Tem
pera
ture
( ºC
)
Thermocouple 1 Thermocouple 2 Thermocouple 3 T average
F. D. V.F: 1 / 3
Iner
ting F. D. V.
F: 1 / 4N. D. V.F: 1 / 4 F
CVPu
rged N
CV
FIGURE 10
No correlation was found between the temperature readings from the container atmosphere inside the tank and outside temperature. This could be an indication that the material does not react with the atmosphere inside the drum but with the moisture content of the material. This also can be an argument to support the hypothesis that the marine air that would ingress in the cargo hold would not react significantly with the material and thus would not promote the self-heating of the cargo.

DSC 14/4 ANNEX Page 14
I:\DSC\14\4.doc
.4 Test results
The carried out test have demonstrated the following: .1 DRI(C) (by-product fines) as a “Porous Cargo” issue; .2 The measured bulk density of the DRI(C) (by-product fines) is 2.5 ton/m3
and the measured open porosity is about 30% by volume; .3 The requirement of a pressure of 1.5 bars to get the flow of nitrogen to fill
the drum empty space, including the open porosity of the DRI(C) (by-product fines) bed. This means that the density of the bed is such that the gas must be virtually “pumped” to get through the solid cargo; therefore it is unlikely that the fanned marine air allowed into the holds can get into the cargo; and
.4 Having said that the marine air circulation in the holds it will be unlikely
to circulate into the cargo.
.5 Self-heating of the DRI(C) (by-product fines) cargo
.1 During the continuous monitoring of hydrogen gas release of the recent test program, no self-heating was detected that can trigger the self-heating of the cargo, see Figure 10.
.2 The relative humidity in the air outside the tank was also monitored aiming
to detect if “wet” air has some effect on the self-heating of the DRI(C). The following Figure shows the relative humidity of the air outside the tank. No effect on the temperature of the DRI was noticed.
Relative Humidity
20
30
40
50
60
70
80
90
100
110
Nº Hours
Rel
ativ
e hu
mid
ity (
% )
FIGURE 11
Therefore is to assume that although the salty wet marine air effect will be more severe it is likely to overflow the cargo and any re-oxidation would be mostly a rusty effect on the DRI(C) (by-product fines) surface. This would have either little or no effect on the re-oxidation and self-heating of the DRI(C) (by-product fines).

DSC 14/4 ANNEX Page 15
I:\DSC\14\4.doc
.3 Hydrogen release
.1 Hydrogen release during the sea transportation of DRI has always been an issue. Laboratory tests were carried out using a holds simulation rig with both Venezuelan and Trinidad and Tobago DRI(C) (by-product fines) samples. The test rig used was presented at the meeting of DSC 12.
.2 As per the information provided by one of the delegates at the Working
Group of the Sub-Committee at DSC 13, as a result of the test carried out with Trinidad and Tobago on a 10,000 mt lot of DRI(C) (by-product fines) containing 6% moisture, the hydrogen gas release was about 100 cubic metres a day (equivalent to 0.00041667 ltr/Kg.Hr). Comparing such Hydrogen generation with the ones obtained from the tank test, it is possible to conclude that both tests – real life and pilot tests – with both materials, from Venezuelan and Trinidad and Tobago, did show Hydrogen generation rates with similar trends, although well below the UN threshold value (1Ltr/Kg.Hr), but hazardous if let to accumulate in ships’ holds.
.3 The Figure 9 shows that the proportion of Nitrogen (N2) in the tank
decreases along the tank test and within a week almost 20% is lost. Shifting the scenario of the test to a ship’s hold on a 45 days voyage, it would be necessary to refill that 20% of Nitrogen a minimum of six (6) times during the trip; and considering that a hold can hold up to 15,000 Nm3 of Nitrogen (N2), it would require approximately 18,000 Nm3 to replace only one hold. Making the same calculation for a shipment with three or four holds, it can be inferred that it is impracticable to replace or refill the nitrogen of an inertized cargo because it would take more than 60,000 Nm3 of nitrogen to do so. This is impossible to implement as it would be necessary, for example, at least one other vessel or stations along the route to supply nitrogen.
.4 Hydrogen concentration
.1 Having presented the issue of the Hydrogen release rate of the cargo, the
other issue to be discussed is the Hydrogen accumulation.
.2 In this regard the highest value measured corresponds to the one of the inert gas condition as is shown in figure 12.
Hydrogen Volumen Accumulation [L]
0,00
10,00
20,00
30,00
40,00
50,00
60,00
70,00
Nº Hours
Vol
umen
( L
)
FCV
Iner
ting
Purg
ed
NCV
N. D. V.F: 1 / 4
F. D. V.F: 1 / 4
F. D. V.F: 1 / 3
FIGURE 12

DSC 14/4 ANNEX Page 16
I:\DSC\14\4.doc
.3 The data collected by Trinidad and Tobago basically shows that there is a nil probability of Hydrogen LEL exceeding 50. The probability exceeding 20 LEL is around 3.3%. These projections are solid so long as transport conditions including actual hold ventilation measures, moisture levels, metallic iron content and salt content (seawater infiltration) do not deviate significantly from those conditions experienced during the referenced shipments.
.4 The high levels of LEL recorded on the vessels were as a result of one or a
combination of the following:
• Accumulation during night period when no ventilation occurs • Weather did not permit ventilation • Rough sea conditions.
Summary of Trinidad and Tobago DRI(C) (by-product fines) shipments using natural and mechanical ventilation 13 Historical DRI(B) shipping practice from Trinidad and Tobago. The practice for DRI transportation from Trinidad and Tobago, is described in the paper “Shipping and Handling of DRI”, by V.C. Vora Director (Shipping), ISPAT Shipping Ltd. Skillings Mining Review, Feb.28, 1998. Pp 4-8. This report is referred for DRI (B). 14 In that paper, the production, handling and very detailed shipping practices, of 7 millions metric tonnes until 1998, across the ocean from Trinidad not only to the United States but also to the Far East and Southeast Asia are described. 15 The vessels described in the above mentioned paper were fitted with ventilation systems fully operational and suitable for ventilation of DRI (B) during the voyage. Even though the hatch covers and ventilators should remain sealed throughout the voyage, except when the hydrogen level in any hold exceed 1%, that hold is to be ventilated, until the level is reduced to below 1%. This is today a standard practice for all DRI cargoes sailing out of Trinidad DR plants. On Table I, the average figures for different parameters of the 2.2 million tonnes of DRI(C) (by-product fines), in fines form, transported by sea from May 2005 until March 2009 are shown.
Summary of Venezuela and Trinidad and Tobago DRI(C) (by-product fines) shipments using surface ventilation 16 From Table VI it is noted that the average figures of 2.2 million tonnes of DRI(C) (by-product fines), transported by sea from May 2005 until March 2008.
Grain Size Cargo
Temperature at Loading (ºC)
Moisture Content (%) -12 mm
Total tonnage shipped
(t)
# Shipments
# Accidents
Avg. Max Avg. Max Avg. Max
Bulk Density (Kg/m³)
Ave.
1,801,831 87 0 43.2 62.0 4.3 10.5 99.0 100.0 2,472
Table VIb Relevant Statistical Information of Trinidad and Tobago shipments from May 2005 until March 2009 (natural and mechanical ventilation)

DSC 14/4 ANNEX Page 17
I:\DSC\14\4.doc
Grain Size Cargo
Temperature at Loading (ºC)
Moisture Content (%) -12 mm
Total tonnage shipped
(t)
# Shipments
# Accidents
Avg. Max Avg. Max Avg. Max
Bulk Density (Kg/m³)
Ave.
410,269 17 0 29 47 5 12 99.0 100.0 2,410
Table VI Relevant statistical information of Venezuelan shipments from May 2005 until March 2009 (only mechanical ventilation).
Loading Temperature Issue 17 From above, it can be seen that the average temperature at loading, of Venezuelan DRI(C), has been 43.2 degrees Celsius and the maximum has been 62 degrees Celsius. In case of the Trinidad and Tobago material it has been 47 degrees Celsius. In any case, there is a standard practice not to load any DRI with the temperature higher than 65 degrees Celsius. Shipment monitoring 18 Some concerns were raised during the DSC 12 and DSC 13 regarding the Hydrogen release and temperatures rising from the DRI(C) (by-product fines) cargo. It was pointed out in the previous reports presented by the Venezuelan and Trinidad and Tobago delegations that DRI(C) (by-product fines) is safe for sea transportation with surface ventilation, even when 10.5% moisture could be in the cargo. 19 For verification purposes, new shipments monitoring were performed to measure the hydrogen, oxygen evolution and temperature profile during the voyage. Results are shown in the following Table VII.
Max. Average
Vessel Voyage days
Temp.(ºC) % O2 % H2 Temp.(ºC) % O2 % H2
Spar Eight 7 56.0 21.3 0.20 42.50 20.70 0.18
Scanda 8 36.0 20.0 Nil 32.40 19.40 Nil
Scanda 8 38.0 21.8 Nil 36.10 20.10 Nil
Scanda 8 54.6 20.5 0.30 44.50 20.40 0.10
Aviona 12 58.7 21.0 1.80 44.00 20.70 0.10
Scanda 40 45.0 20.9 2.88 28.80 20.30 0.60
Yung Cheng 40 61.0 21.0 0.50 39.90 20.70 0.30
Engin Kaptanoglu 41 52.4 20.9 Nil 38.80 20.80 Nil
Bulk Crusader 43 56.0 20.9 Nil 44.00 20.70 Nil
Artic Voyager 43 51.0 20.5 1.75 34.00 20.09 0.20
Rong Cheng 45 59.9 21.0 2.00 53.32 19.38 0.22
Bulk Crusader 45 54.8 21.0 0.16 45.10 20.20 0.10
Table VII Venezuelan shipping DRI(C) (by-product fines) cargoes monitoring of temperature,
Hydrogen evolution and Oxygen depletion in cargo holds, by vessel and voyage duration (May 2005-March 2009)

DSC 14/4 ANNEX Page 18
I:\DSC\14\4.doc
20 It is to be mentioned that one single abnormal situation of Hydrogen level, of 7% was reported for a trip to China of the MV Bulk Crusader in the DSC 13/4/8. 21 The ventilation frequency of these shipments was minimum 1 hour every four hours up to continuous. Capacity of fans: four changes of air per hour based on empty space. 22 From Table VII, it is possible to deduct that when mechanical ventilation was used during the voyage:
.1 the temperature of the cargo never was over 61 degrees Celsius;
.2 Hydrogen never was above 3%; and
.3 Oxygen in the hold was never below 20%. 23 When the data gathered in Tables VIa and b are expressed in terms of voyage duration in days as presented in Tables VIIIa and b, it is possible to conclude that under mechanical ventilation DRI(C) (by-product fines) is safe when properly handled.
Voyage Days
7-9 10-15 40-45
Temp.
(ºC)
% O2
Vol
% H2
Vol.
Temp.
(ºC)
% O2
Vol.
% H2
Vol
Temp.
(ºC)
% O2
Vol.
% H2
Vol.
Maximum 56.00 21.80 0.30 58.70 21.00 1.80 61.00 21.00 2.88 Average 38.90 20.15 0.14 44.00 20.70 0.10 40.03 20.28 0.68 Readings 729 729 125 335 335 335 1785 1753 1394
Table VIII Venezuelan DRI(C) (by-product fines) average and maximum values of temperature, Hydrogen evolution and Oxygen depletion in holds under mechanical ventilation operation. (May 2005-March 2009)
24 From Table VIIIa, it is possible to draw the following conclusions:
.1 the maximum Temperature value, although it may seem that are function of the voyage time, do not depend on the fines (% below 4 mm) (refer to document DSC 12/4/2);
.2 the Hydrogen concentration will depend on the ventilation duration; and .3 the oxygen is also a function of the ventilation duration, and it was never
below 20%.

DSC 14/4 ANNEX Page 19
I:\DSC\14\4.doc
Voyage Days
7-9 10-15 40-45
Temp.
(ºC)
% O2
Vol.
% H2
Vol.
Temp.
(ºC)
% O2
Vol.
% H2
Vol.
Temp.
(ºC) % O2 % H2
Maximum 43 21.90 0.40 47 21.90 0.76 NA NA NA Average 36 20.00 0.40 44 20.70 0.64 NA NA NA Readings 60 60 60 210 210 10 NA NA NA
Table VIIIb Trinidad and Tobago DRI(C) (by-product fines) Average and Maximum values of temperature, Hydrogen evolution and Oxygen depletion in holds under mechanical ventilation operation
25 From Table VIIIb it is possible to draw the following conclusions:
.1 the maximum temperature values, although it may seem that are function of the
voyage time, still are in the safe range; .2 the Hydrogen concentration will depend on the ventilation duration (related to
conclusions from testing); and .3 the Oxygen is also a function of the ventilation duration, and it was never
below 20%. Safety Index Venezuelan and Trinidadian DRI Fines (by-product fines) carried by sea using mechanical ventilation (May 2005-March 2009) 26 In relation to safety, it is important to mention and stress the actions that the DRI industry from Trinidad and Tobago and Venezuela have taken since 2005 (after the accident with M/V Ythan) in order to control the hazards and risks associated with the sea carriage of DRI(C) and at the same time minimize or even eliminate any potential possibility of incidents and accidents from happening, as follows:
.1 carriage of this cargo under mechanically ventilated holds to avoid any
accumulation of flammable gases as per sections 3 and 9 of the BC Code (and new IMSBC Code);
.2 exhaustive research, testing, analyses in independent certified labs and producers’
plants as to the UN classification and what the main hazard was when carrying DRI(C);
.3 recognizing that Hydrogen generation was the main hazard when carrying DRI(C)
and that the real problem was accumulation of Hydrogen in the holds rather than generation;
.4 chartering of vessels fitted with a mechanical ventilation system in the cargo holds
to carry DRI(C) fines, with capacity to remove a minimum of four (4) changes of air per hour based on empty space, with a ventilation frequency of at least one hour every four hours (as per guidelines of document DSC 12/4/1);

DSC 14/4 ANNEX Page 20
I:\DSC\14\4.doc
.5 strict monitoring of cargo before and during loading, throughout the voyage and at discharge. Monitoring has consisted on measuring temperature of cargo by means of thermocouples; gas analysing of Hydrogen accumulation and Oxygen concentration in cargo holds, mainly during the sea passage;
.6 setting up procedures of what to do during the voyage and the emergency actions
to take in case the LEL reached 25%; and .7 submitting to Masters of vessels comprehensive information on the hazards of the
cargo and the safe handling and carrying procedures (as per document DSC 12/4/1).
27 The results of such safety index for the 2.2 million tonnes (104 shipments) of DRI fines carried under mechanical ventilation conditions has been 100% safe since this practice was adopted by the Venezuelan and Trinidadian industry in 2005, see Figure 13.
FIGURE 13
Conclusions 28 From the data gathered from field measurements and laboratory experiments, comparing different practices, such as inerting, blanketing, natural continuous ventilation, mechanical ventilation one change of air every four hours, mechanical ventilation every three hours and continuous mechanical ventilation, it is possible to conclude the following:
.1 both materials showed to be very similar in chemical and physical characteristics,
therefore the present approved schedule does apply for a single cargo; .2 the main source for the hydrogen generation in the DRI(C) cargo is the moisture
content inside the material. The moisture of any air intake during the trip will have effect on the cargo rusting;
Total DRI Fines Carriage by SeaMechanical Ventilation Safety Index
May 2005 - March 2009(104 Shipments - 0 Accidents) Total w/mech
vent.Safe 104 shipments
100%
Accidents / Incidents: 0 ShipmentsSelf-heating / Auto-ignition: 0 embarquesTotal Tonnage Shipped: 2,212,000 mt

DSC 14/4 ANNEX Page 21
I:\DSC\14\4.doc
.3 the DRI(C) (by-product fines) is neither 4.2 nor 4.3 Class Cargo as per the UN Test as a valid test for the assessment of cargoes;
.4 the major hazard of this cargo is not the hydrogen generation rate but the
accumulation of same in the ship holds; .5 the rate of hydrogen generation makes very difficult to keep the hydrogen and
oxygen concentrations less than 1% and below 5% respectively. Simply, it is neither practical nor feasible;
.6 based on information gathered from the limited number of tests performed, it
shows that inerting may have the ability of reducing the rate at which Hydrogen develops. However since it does not stop the generation of hydrogen, it cannot be used as a sole measure to protect vessel and seamen to reach the “SAFETY FIRST” aim;
.7 it have been fully demonstrated that the mechanical ventilation is the most suitable
and best available technology (BAP) to keep the safe conditions on ships for the sea transport of the DRI(C) (by-product fines) of any moisture content;
.8 vessel needs the ability to ventilate. Further suggestion is to be able to ventilate in
all sea/weather conditions to further minimize the possibility of accumulation of Hydrogen;
.9 the DRI(C) (by-product fines), according to the recent tests results, can be
considered a safe cargo when appropriately handled following the advised settings of the IMO DSC 12/4/1 document.
_____________


