
Understanding the impacts of technology on farming system design using a linear programming
approach to resource optimisation – a case study of increasing pasture production in New Zealand
hill country environments
D.R. Stevens1, B.R. Thompson1, D.R. Scobie2 and D. O’Connell2
1AgResearch Invermay
2AgResearch, Lincoln
Introduction
New Zealand is dominated by mountainous and hilly landscapes. Mountain land above 1000 m
occupies about 20% of the land surface, while steep, non-arable hill country below 1000 m comprises
a further 40% (Blaschke et al., 1992). These lower steeplands are known popularly in New Zealand as
“hill country” and comprise two main areas that support livestock grazing enterprises. These are
North Island hill country, which covers 3.5 million ha (28% of farmland in New Zealand) (Mackay et
al., 1993), and South Island pastoral high country (also known as tussock grasslands, run country,
rangelands) which comprises about 3.4 million ha (Anon, 1994).
The development of New Zealand’s hill country for pastoral farming has had a long and interesting
past (Suckling, 1966; Levy, 1970; White, 1973; Blaschke et al., 1992; White, 1999). Significant
events include clearance of large tracts of evergreen conifer/broadleaf forests in the 19th and 20th
centuries, destruction of areas of tall tussock grasslands, enhancement of soil fertility through
application of lime and fertiliser, particularly superphosphate, subdivision to enable improved stock
management and control of grazing pressure, and introduction of new species or improved cultivars
and selections of existing species. The aerial application of fertiliser and seed using fixed-wing
aircraft, commencing in the 1950s, and later the helicopter revolutionised development and
management of hill country pastures.
If subdivision, topdressing and utilisation are advanced to the stage where further gains are sought,
introducing new germplasm may have potential. Lambert et al (1985) described some benefits of
introducing improved plants to existing hill pastures as enhanced annual or seasonal production of
forage, higher nutritive value of forage, and more tolerance to factors such as drought, grazing,
trampling, pests, or low fertility. They also highlighted the potential value of introducing new
germplasm to exploit the many different micro-sites present in hill pastures, and to allow for
situations where the material was not introduced earlier, or was introduced but did not persist perhaps
because of inappropriate management.
Pasture production in New Zealand hill country can range widely (McNamara, 1992) and produces an
average of 5-9 t DM/ha depending on the rainfall (Daly, 1990). However, much higher yields of
between 15 and 20 t DM/ha can be achieved when intensive grazing management is applied in
conjunction with nitrogen fertiliser, regardless of low rainfall (Lambert et al., 2003; Mills et al.,
2006).
When farmers aim to increase productivity and profitability, changes are often required to the farming
system. In the first instance current data from operating farms can be used to test whether
improvements to the feed supply add value to the farm enterprise. Secondly, changes in enterprise
must be assessed to determine the suitability of the changes to the achievable practices.
Farm systems analysis was used to investigate the potential impacts of increasing pasture production
through the perpetual use of Italian ryegrass on part of hill country farms on whole farm systems
configuration, using real farm data from 3 sheep and beef breeding farms (2 North Island and 1 South
Island). The data were supplied by Landcorp Farming Ltd, a state-owned farming company in New

Zealand. Whole farm scenarios and variability were investigated using a response surface approach to
maximise profit by optimising the chosen system and then providing investment analyses.
Briefly, the process used existing real farm data to investigate potential maximum profit by optimising
the use of current resources to provide a base comparison for potential changes. An increase in
resource was investigated by adding a specialist ryegrass area to the farm (producing 15t DM/ha/yr).
Methods
Farm system analyses were performed using INFORM (Integrated Farm Optimisation and Resource
allocation Model) (Rendel et al. 2013,2015), a linear programming model that maximises EBITDA
(Earnings before interest, tax, depreciation and amortization), by optimising resources over a one year
timeframe. INFORM is a single year steady state model. Initially base scenarios were developed that
replicated, as near as possible, the physical properties and the animal performance parameters that
were achieved in the previous year on three Landcorp Farming Ltd properties in three distinct New
Zealand geo-climatic regions (cool moist temperate (Otago, 1280 ha), warm dry temperate (Gisborne,
3136 ha) and warm wet temperate (Northland, 1159 ha) (Figure 1).
Figure 1. Approximate position of the farms in three geo-climatic zones in New Zealand.
The three properties were modelled to assess the impact of increased pasture production from an
intensive pasture renewal programme on profitability and farm enterprise choice. The three properties
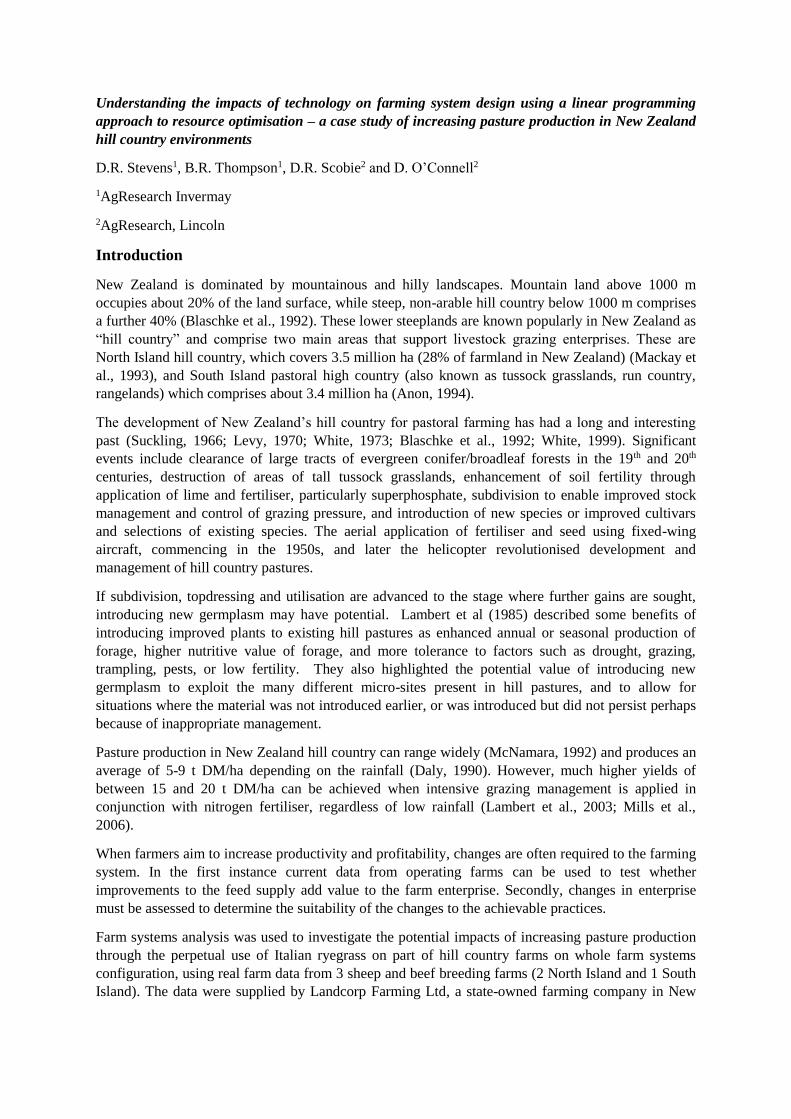
represent a range of climatic conditions (Figure 2) that are experienced around New Zealand.
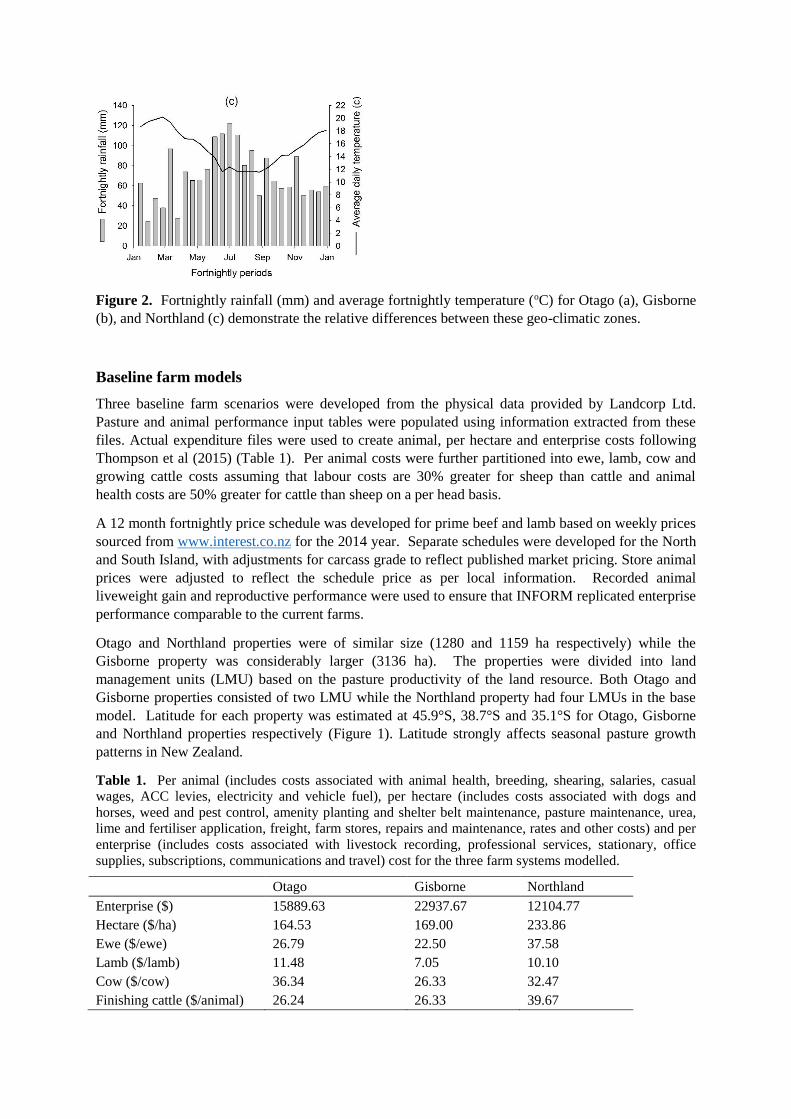
Figure 2. Fortnightly rainfall (mm) and average fortnightly temperature (oC) for Otago (a), Gisborne
(b), and Northland (c) demonstrate the relative differences between these geo-climatic zones.
Baseline farm models
Three baseline farm scenarios were developed from the physical data provided by Landcorp Ltd.
Pasture and animal performance input tables were populated using information extracted from these
files. Actual expenditure files were used to create animal, per hectare and enterprise costs following
Thompson et al (2015) (Table 1). Per animal costs were further partitioned into ewe, lamb, cow and
growing cattle costs assuming that labour costs are 30% greater for sheep than cattle and animal
health costs are 50% greater for cattle than sheep on a per head basis.
A 12 month fortnightly price schedule was developed for prime beef and lamb based on weekly prices
sourced from www.interest.co.nz for the 2014 year. Separate schedules were developed for the North
and South Island, with adjustments for carcass grade to reflect published market pricing. Store animal
prices were adjusted to reflect the schedule price as per local information. Recorded animal
liveweight gain and reproductive performance were used to ensure that INFORM replicated enterprise
performance comparable to the current farms.
Otago and Northland properties were of similar size (1280 and 1159 ha respectively) while the
Gisborne property was considerably larger (3136 ha). The properties were divided into land
management units (LMU) based on the pasture productivity of the land resource. Both Otago and
Gisborne properties consisted of two LMU while the Northland property had four LMUs in the base
model. Latitude for each property was estimated at 45.9°S, 38.7°S and 35.1°S for Otago, Gisborne
and Northland properties respectively (Figure 1). Latitude strongly affects seasonal pasture growth
patterns in New Zealand.
Table 1. Per animal (includes costs associated with animal health, breeding, shearing, salaries, casual
wages, ACC levies, electricity and vehicle fuel), per hectare (includes costs associated with dogs and
horses, weed and pest control, amenity planting and shelter belt maintenance, pasture maintenance, urea,
lime and fertiliser application, freight, farm stores, repairs and maintenance, rates and other costs) and per
enterprise (includes costs associated with livestock recording, professional services, stationary, office
supplies, subscriptions, communications and travel) cost for the three farm systems modelled.
Otago Gisborne Northland
Enterprise ($) 15889.63 22937.67 12104.77
Hectare ($/ha) 164.53 169.00 233.86
Ewe ($/ewe) 26.79 22.50 37.58
Lamb ($/lamb) 11.48 7.05 10.10
Cow ($/cow) 36.34 26.33 32.47
Finishing cattle ($/animal) 26.24 26.33 39.67

Increased pasture production scenarios
Four scenarios for each baseline farm were created to investigate the effect of increased pasture
production on a restricted area of the farm, on farm enterprise structure and overall EBITDA. This
was achieved by creating a new land management unit (LMU) that consisted of 100, 200, 300, or 400
ha with a pasture production of ~15000kg DM/ha. This LMU was named “Improved ryegrass” to
reflect the use of Italian ryegrass as the base forage (Figure 3). It was assumed that Italian ryegrass is
a two year crop with an annual cost per hectare of $185.40 (Table 2) above the standard LMU cost.
Nitrogen fertiliser (N) was also used to boost pasture production. The first 40kg of N used had a
response rate of 30:1 with the remaining 30kg of N having a response of 24:1. It was also assumed
that best management practice for ryegrass grazing would be implemented to maximise growth. The
LMU in Italian ryegrass would be used on a two year cycle of renewal in perpetuity. Pasture energy
content and animal performance traits remained the same as in the baseline models. The Gisborne
farm was significantly larger than the Otago or Northland farms and so further scenarios of 250, 500,
750 and 1000 ha were also investigated to test the importance of scale.
Table 2: Assumed Italian ryegrass establishment costs excluding fertiliser for a two year life. This value
is then halved to represent an annual cost and assigned directly to the LMU as an operational cost for
EBITDA calculations. A further analysis of these costs was done using an investment analysis to compare
the two approaches.
Cost ($/ha)
Grass seed $170.40
Glyphosate $16.89
Clopyralid $43.52
Chemical application $20.00
Direct drilling $120.00
Total $370.81
Pasture growth curves were supplied for each LMU (Figure 3) from current information and were
converted to a fortnightly profile for each property.
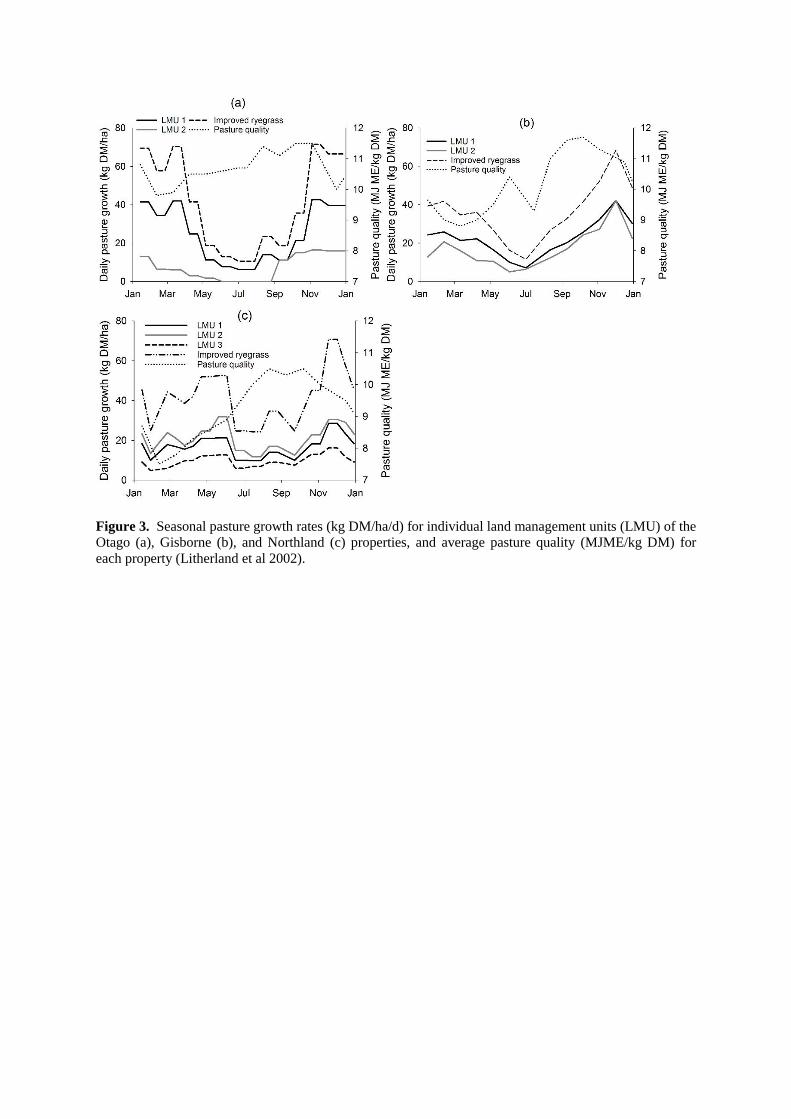
Figure 3. Seasonal pasture growth rates (kg DM/ha/d) for individual land management units (LMU) of the
Otago (a), Gisborne (b), and Northland (c) properties, and average pasture quality (MJME/kg DM) for
each property (Litherland et al 2002).
Table 3. Beef animal performance data for the baseline model of each property that was used as inputs
into the INFORM model.
Variable Otago Gisborne Northland
Pregnancy scan date 5th April 5th April 26th March
Dry at scanning (%) 8 10 7
Scanning %1 100 100 93
Start calving date 07th October 16th October
12th
September
Heifer birth weight (kg) 36 36 27
Bull birth weight (kg) 40 40 27
Weaning date 25th April 30th March 21st March
Weaning %2 84 81 90
Heifer wean weight (kg) 220 215 216
Steer wean weight (kg) 250 230 216
Bull wean weight (kg) 250 230 216
Cow replacement % 40 35 22
Cow death rate (%) 2 4 5
Cow cull date 16th May 16th May 31st March
Rising 1 yr old death rate (%) 1 1 3
Rising 2yr old death rate (%) 1 1 2.8
Heifer carcase yield % 47 47 47
Steer carcase yield % 44 44 44
Bull carcase yield % 44 44 44
Cow carcase yield % 50 50 50
Maternal breed A A A
Terminal breed A A A 1Scanning % of animals pregnant at scanning 2Based on cows pregnant and present at the start of calving

Table 4. Sheep animal performance data for the baseline model of each property that was used as inputs
into the INFORM model.
Variable Otago Gisborne Northland
Ewe carcase yield % 50 50 50
Milk fed lambs carcase yield % 47 47 47
Prime lamb carcase yield % 44 44 44
Ewe cull date 2nd February
22nd
February 15th December
Ewe death rate (%) 9 6 9.6
Lamb wean weight 27.3 26 24.6
Prime lamb death rate (%) 2 2 5
Replacement rate (%) 28 28 22
Pregnancy diagnosis date 2nd August 30th June 23rd June
Non-pregnant rate % 2 2 5
Pregnancy status (%1) 179 177 171
Start lambing date 8th October
12th
September 17th August
Weaning date 6th January
11th
December 14th November
Lambs weaned (%2) 142 142 135 1Lambs observed using ultrasound pregnancy diagnosis as a % of pregnant ewes 2Lambs present at weaning (approximately 100 days of age) as a % of ewes pregnant and present at
the start of lambing
Animal growth rates were taken from data supplied and converted into fortnightly periods post
weaning. Lamb growth rates were constrained to zero in winter. Growth rates of replacement females
were also taken from the data supplied.
An investment analysis was carried out to investigate the impacts of changing stock numbers on the
value of the returns using the approach outlined by Rendel et al (2015). A 20 year time frame was
used. The capital value of livestock was calculated from the stock reconciliation using standard tax
values at the time. The net present value of each scenario was calculated. The annual cost of the
Italian ryegrass improvements were added to the cost of re-establishing a permanent pasture
($1,000/ha) at the end of the 20 year cycle and this was compared to net increase in present value to
calculate the return on investment in the new technology. An annuity value was calculated from the
net present value and the net increase in annuity calculated.
Results and Discussion
INFORM is an optimisation model which is important when interpreting the results. As feed
resources are an input, the model already knows when and how much feed is available for each period
of the year. It therefore can both alter the type of stock class and optimise the number of animals
including sale dates (prime and store) that it uses to ensure feed is utilised if it leads to a greater
economic surplus.
The model also runs within a defined set of parameters pertaining to pasture cover. The pasture
growth was based on perennial grass/white clover and average pasture covers on any LMU were
constrained between 1200-2500 kg DM/ha to ensure pasture quality, pasture growth rate and animal
intake assumptions were valid (Bircham & Hodgson 1983; Lambert et al 2004). As such, the model
must keep the pasture cover within this range and thus makes decisions to achieve this outcome while
maximising profit within those constraints.
The enterprise chosen in any case was the result of optimising the resource use in the most profitable
way. So we see an interaction between inputs and outputs. Generally we see the most profitable
outcome was a trade-off between maximising resource use at minimal cost, as the influence of pricing
options was usually relatively limited in sheep and beef schedules. Increasing the availability of
pasture maintained the current enterprise structure. Variations in pasture quality or seasonal feed
supply may alter the enterprise mix.
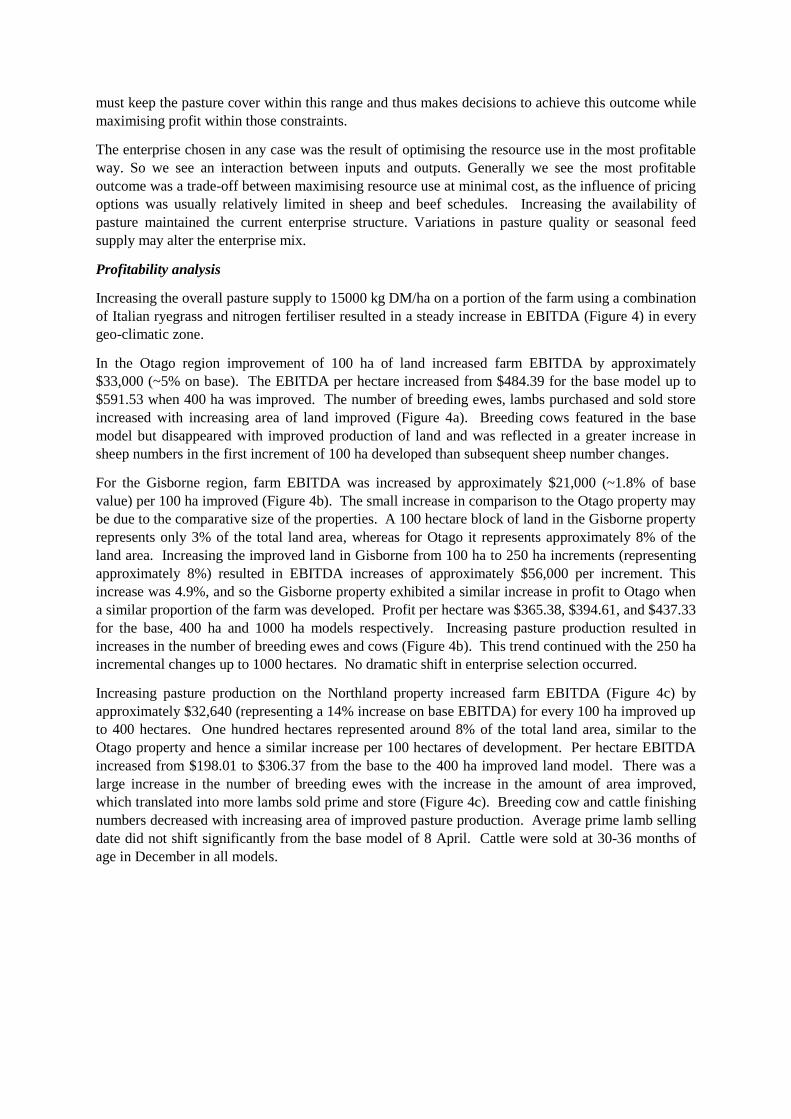
Profitability analysis
Increasing the overall pasture supply to 15000 kg DM/ha on a portion of the farm using a combination
of Italian ryegrass and nitrogen fertiliser resulted in a steady increase in EBITDA (Figure 4) in every
geo-climatic zone.
In the Otago region improvement of 100 ha of land increased farm EBITDA by approximately
$33,000 (~5% on base). The EBITDA per hectare increased from $484.39 for the base model up to
$591.53 when 400 ha was improved. The number of breeding ewes, lambs purchased and sold store
increased with increasing area of land improved (Figure 4a). Breeding cows featured in the base
model but disappeared with improved production of land and was reflected in a greater increase in
sheep numbers in the first increment of 100 ha developed than subsequent sheep number changes.
For the Gisborne region, farm EBITDA was increased by approximately $21,000 (~1.8% of base
value) per 100 ha improved (Figure 4b). The small increase in comparison to the Otago property may
be due to the comparative size of the properties. A 100 hectare block of land in the Gisborne property
represents only 3% of the total land area, whereas for Otago it represents approximately 8% of the
land area. Increasing the improved land in Gisborne from 100 ha to 250 ha increments (representing
approximately 8%) resulted in EBITDA increases of approximately $56,000 per increment. This
increase was 4.9%, and so the Gisborne property exhibited a similar increase in profit to Otago when
a similar proportion of the farm was developed. Profit per hectare was $365.38, $394.61, and $437.33
for the base, 400 ha and 1000 ha models respectively. Increasing pasture production resulted in
increases in the number of breeding ewes and cows (Figure 4b). This trend continued with the 250 ha
incremental changes up to 1000 hectares. No dramatic shift in enterprise selection occurred.
Increasing pasture production on the Northland property increased farm EBITDA (Figure 4c) by
approximately $32,640 (representing a 14% increase on base EBITDA) for every 100 ha improved up
to 400 hectares. One hundred hectares represented around 8% of the total land area, similar to the
Otago property and hence a similar increase per 100 hectares of development. Per hectare EBITDA
increased from $198.01 to $306.37 from the base to the 400 ha improved land model. There was a
large increase in the number of breeding ewes with the increase in the amount of area improved,
which translated into more lambs sold prime and store (Figure 4c). Breeding cow and cattle finishing
numbers decreased with increasing area of improved pasture production. Average prime lamb selling
date did not shift significantly from the base model of 8 April. Cattle were sold at 30-36 months of
age in December in all models.
Figure 4. Profitability (EBITDA) and productivity parameters when improving pasture production on 100,
200, 300 and 400 ha of typical hill country farms in the Otago, Gisborne, and Northland regions.
Investment analysis
An investment analysis was carried out on the development of the extra land area into a high
producing Italian ryegrass (Table 5). The greatest return on investment of 75% was in the Otago
region, while the Gisborne region showed a negative return. The return in Northland was relatively
small.

Table 5. Investment analysis when improving pasture production on 100, 200, 300 and 400 ha of
typical hill country farms in three geo-climatic regions of New Zealand using a 20 year investment
time frame.
Area of improved pasture
Base 100 ha 200 ha 300 ha 400 ha
Otago Stock Capital Value ($) $ 792,946 $ 835,082 $ 884,020 $ 932,958 $ 982,590
NPV ($) $ 7,045,244 $ 7,869,273 $ 8,668,121 $ 9,466,969 $ 10,270,568
Return on Investment %
75% 72% 71% 71%
Annuity per ha planted ($) $ 661 $ 651 $ 648 $ 647
Gisborne Stock Capital Value ($) $ 3,258,760 $ 3,350,967 $ 3,441,652 $ 3,562,910 $ 3,655,117
NPV ($) $12,249,007 $12,649,157 $13,050,256 $13,520,183 $ 3,920,333
Return on Investment %
-15% -15% -10% -11%
Annuity per ha planted ($) $ 321 $ 321 $ 340 $ 335
Northland Stock Capital Value ($) $ 1,093,052 $ 1,203,409 $ 1,306,854 $ 1,415,138 $ 1,519,853
NPV ($) $ 2,292,471 $ 2,826,281 $ 3,363,663 $ 3,895,920 $ 4,429,557
Return on Investment %
13% 14% 14% 13%
Annuity per ha planted ($) $ 428 $ 430 $ 429 $ 429
While the implementation of technologies and strategies to increase pasture production appear to be
profitable, an understanding of the environment into which those changes are proposed is required.
The modelling highlights a significant shift towards lamb finishing in the Otago example. While this may
be profitable, consideration must be made of the availability of lambs for purchase before this change in
system might be undertaken. The variability of pasture growth due to climatic variations in temperature
and rainfall must also be accounted for, though a lamb trading and finishing operation may be more
flexible in the face of these changes if purchasing and selling decisions were well managed.
The buying and selling of store stock is one area that may create slightly aberrant behaviour. The on-
going cost of finishing cattle seems to drive a majority of calves to be sold at weaning. This indicates
that there may be significant gains to be made to keep costs of finishing cattle to a minimum to ensure
profitability. Buying and selling store lambs at weaning in the model appears to be driven by the price
differential in the model, though in some environments the pasture growth profile, associated with a
relatively low cost of finishing lambs, drives the model to purchase large numbers of lambs.
The relatively low returns for the investment in increasing pasture production in the Gisborne example is
indicative of current farmer practices in this region. Very little pasture renewal is undertaken. One critical
influence on this approach is the uncertainty of climatic variations during the establishment of a new
pasture during autumn, leading to variable pasture production responses and a propensity for weed ingress
as a result.
In the Northland example the enterprises chosen were dominated by sheep. While the base system
achieved the performance levels documented, this may not be the case if sheep numbers were increase.
Animal health problems of facial eczema (a fungal toxin that causes liver damage) and internal parasites
(Haemonchus contortus) in a relatively warm humid environment mean that sheep production can be
quickly compromised.
Increasing the availability of pasture, at a cost of $ 184/ha/annum increased cash flow profit in every
environment, and was proportional to the amount of pasture improved. The average cost of this

improvement is approximately 3 c/kg DM, while the total return ranged from 5.8 to 7.1 c/kg DM. This
suggests that the break-even price to gain these benefits would be between $356 and $435/ha. Often
pasture renewal programmes can cost between $800 and $1000/ha, requiring the benefits of pasture
renewal to last for 3 or more years. The implementation of a programme as outlined in this research
would require an area of land available to meet the requirements of a low cost pasture improvement
programme. Investment analysis demonstrated that increasing pasture production provided a positive
annuity, though only provided a positive return on investment in 2 of the 3 environments. However,
the return on investment per annum varied between environments from -15% to +75% when a 20 year
time frame was chosen and the changes in capital stock were accounted for.
The influence of variability in the farming environment leads to farming enterprise configurations that
may not be the optimal fit for the average conditions. These case studies provide a useful example of
the principles of sub-optimal configuration of complex adaptive systems. While profit may be a major
driver of farm systems configuration, the final configuration of the system becomes sub-optimal to
allow for resilience in the face of environmental variability.
Acknowledgements
The authors would like to thanks AgResearch Ltd, Grasslanz Technologies and Agriseeds Ltd for
funding and Landcorp Farming Ltd for funding and access to their farm records.
References
Allan, B. E.; Lowther, W. L.; Walton, P. J. 1985: Chapter 2. Planning, establishment and management
of pastures in the high country. Pp. 17-20 in: Using herbage cultivars. Grasslands Research and
Practice Series No 3, New Zealand Grasslands Association, Palmerston North. Burgess, R. E.; Brock,
J. L. eds.
Blaschke, P. M.; Trustrum, N. A.; DeRose, R. C. 1992: Ecosystem processes and sustainable land use
in New Zealand steeplands. Agriculture, ecosystems and environment 41: 153-178.
Daly, G.T. 1990: The grasslands of New Zealand. Pp. 1-38 In: Pastures – their ecology and
management. Langer, R.H.M. ed. Oxford University Press, Oxford.
Lambert, M. G.; Rhodes, A. P.; Barker, D. J.; Bircham, J. S. 1985: Establishing and managing
improved plants in hill country. Chapter 4. Pp. 31-35 in: Using herbage cultivars. Grassland Research
and Practice Series No. 3. Burgess, R. E.; Brock, J. L. eds. New Zealand Grassland Association,
Palmerston North.
Lambert, M.G.; Mackay, A.D.; Devantier, B.P.; McDougall, D.B.; Barker, D.J.; Park-Ng, Z.A. 2003:
Redefining the production potential of hill pastures using fertiliser nitrogen. Proceedings of the New
Zealand Grassland Association 65: 35-40.
Levy, E. B. 1970: Grasslands of New Zealand. Government printer, Wellington, New Zealand.
Litherland, A.J.; Woodward, S.J.R.; Stevens, D.R.; McDougal, D.B.; Boom, C.J.; Knight, T.L.;
Lambert, M.G. 2002. Seasonal variations in pasture quality on New Zealand sheep and beef farms.
Proceedings of the New Zealand Society of Animal Production 62: 138-142.
Mackay, A. D.; Wedderburn, M. E.; Lambert, M. G. 1993: Sustainable management of hill land.
Proceedings of the New Zealand Grassland Association 55: 170-176.
McNamara, R.M. 1992: Seasonal distribution of pasture production in New Zealand XX. North and
East Otago downlands. New Zealand Journal of Agricultural Research 35: 163-169.
Mills, A.; Moot, D.J.; MacKenzie, B.A. 2006: Cocksfoot pasture production in relation to
environmental variables. Proceedings of the New Zealand Grassland Association 68: 89-94.

Rendel, J.M.; Mackay, A.D.; Manderson, A.; O'Neill, K.T. 2013. Optimising farm resource allocation
to maximise profit using a new generation integrated whole farm planning model. Proceedings of the
New Zealand Grassland Association 75: 85-90.
Rendel, J.M.; Mackay, A.D.; Smale, P. 2015. Valuing on-farm investments. Journal of New Zealand
Grasslands 77: 83-88.
Scott, D.; Keoghan, J. M.; Cossens, G. G.; Maunsell, L. A.; Floate, M. J. S.; Wills, B. J.; Douglas, G.
B. 1985: Limitations to pasture production and choice of species. Chapter 1. Pp. 9-15 in: Using
Herbage Cultivars. Grassland Research and Practice Series No. 3. Burgess, R. E.; Brock, J. L. eds.
New Zealand Grassland Association, Palmerston North.
Suckling, F. E. T. 1966: Hill pasture improvement: a guide to better use of the hills. Newton King
Group of Companies, DSIR, Wanganui, New Zealand.
Thompson, B.R.; Stevens, D.R.; Bywater, A.C.; Rendel, J.M.; Cox, N.R. 2015. Impacts of animal
genetic gain on the profitability of three different grassland farming systems producing red meat.
Agricultural Systems 141: 36-47.
White, J. 1999: The Farmlands of New Zealand. Chapter 1. Pp. 1-10 in: New Zealand Pasture and
Crop Science. White, J. H., J. ed. Oxford University Press.
White, J. G. H. 1973: Improvement of hill country pastures. Pp. 259-290 in: Pasture and Pasture
Plants. Langer, R. H. M. ed. AH & AW Reed, Wellington.


