
02/01/2018
1
INTRODUCTION TO THE SEEA
Ms. Alessandra AlfieriChief, Environmental Economic Accounts Section
United Nations Statistics Division
9 November 2017

02/01/2018
2
CONTENTS
1. What is SEEA
2. Policy applications
3. Implementation of the SEEA
4. Challenges and limitations
Legal and political commitments
1992: CBD Aichi Targets (Target 2)
1992: Agenda 21 (Rio)
2012: The Future we Want (Rio+20)
2015: 2030 Agenda for Sustainable Development and
Sustainable Development Goals
European Legislation
Natural Capital Accounting

02/01/2018
3
Integration for Sustainable Development
• Environmental policy must consider interconnected natural systems E.g. Food, energy, water and climate change nexus
• Policies should recognize the links; Between different natural systems Integrated environmental information
Between the economy and environment Integrated environmental‐economic information
Economy Environment
The System of Environmental Economic Accounting (SEEA)
• The SEEA Central Framework was adopted as an international statistical standard by the UN Statistical Commission in 2012 to measure the environment and its relation with the economy
• The SEEA Experimental Ecosystem Accounting complements the Central Framework and represents international efforts toward coherent ecosystem accounting

02/01/2018
4
Timber
Water
Soil
Fish
Land cover/Ecosystem
types
Ecosystem Assets are environmental assets viewed from a systems perspective
7
Two Different Perspectives
SEEA Central Framework:
Individual environmental assets/ resources
SEEA Experimental Ecosystem Accounts:
Ecosystem assets (spatially based)
SEEA Central Framework Accounts
• Flow accounts: supply and use tables for natural inputs, products, and
residuals (e.g. waste, wastewater)
> Physical and/or monetary values
• Stock accounts: for environmental assets over an accounting period
> Physical and/or monetary values
• Activity / purpose accounts: explicitly identify environmental transactions
already existing in the SNA.
> e.g. Environmental Protection Expenditure (EPE) accounts,
environmental taxes and subsidies
• Combined physical and monetary accounts: bring together physical and
monetary information for derivation indicators, including depletion adjusted
aggregates

02/01/2018
5
SEEA Experimental Ecosystem Approach• An integrated measurement framework for ecosystem stocks (assets) and
flows (services) to measure the contributions of ecosystems to economic
activity:
> Ecosystem Assets and Condition
> “Final” Ecosystem Services (Production):
> Provisioning services: products that can be harvested or extracted from
ecosystems
> Regulating services: regulation of biological, hydrological and climate
processes
> Cultural services: non‐material benefits of ecosystems e.g., tourism or
cultural experiences
• A synthesis of current knowledge on ecosystem services, ecosystem condition
and related concepts
Systems of integrated information

02/01/2018
6
Silo approach Integrated statistics
Accounts to integrate statistics:
• Address institutional arrangements
• Integrate statistical production process and services
• Ensure consistency between basic data, accounts and indicators
Agency A
Policy A
Info A
Data A
Agency C
Policy C
Info C
Data C
Agency B
Policy B
Info B
Data B
Indicators
Accounts
SNA | SEEA
Basic data
Economy | Environment | Social
SEEA: A Statistical Standard
• Countries are “encouraged to implement the standard”
• International organizations have obligations to assist countries in
implementation
• Implementation strategy adopted ver. 2 by Statistical Commission in 2016.
• Data reporting mechanism will be established
> Starting from existing data sources
> Integration into core tables and accounts
> Priority areas:
⁻ Energy accounts ‐Material Flow Accounts
⁻ Air emission accounts ‐Water accounts
⁻ Land Accounts

02/01/2018
7
POLICY APPLICATIONS OF THE SEEA
SEEA and the SDG indicators
The SNA and SEEA are statistical standards that can be used to monitor a number of environmental‐economic SDG Indicators in an integrated way.

02/01/2018
8
Indicators based on standards Frameworks to coherently integrate information:
Indicators based on Standards
Higher quality
International comparability
Comprehensive basis for (dis)aggregation
Standards for Statistics
Aligned Definitions and Classifications
Improved capacity to compare and/or combine statistics from
different sectors
Basis for coherent and comprehensive data sets
A common conceptual approach across goals
Material Flows & Solid Waste
Energy & Carbon Emissions
Water & Wastewater
Agriculture, Forestry & Fishery
Ecosystems Land Use & Management
Efficiency/ Productivity in the use of NaturalResources
1. How do we define efficiency? How do we define productivity? 2. How do we measure efficiency/productivity in the use of natural resources? 3. How do we disaggregate and compare across sectors? 4. How do we juxtapose environmental and economic information to derive these indicators?
Waste Minimizationand Treatment
5. When is something considered waste? How is this defined? 6. How do we define reuse and recycling? How do we define ‘regular collection’, ‘safe
treatment’ and ‘good waste management’?7. How do we disaggregate and compare this across sectors?
Sustainability and Management of Resources
8. How do we define and compare economic uses of natural resources to their availability? 9. How do we classify and monitor management of those resources? 10. How do we use tools such as GIS and land accounting to inform this?
Monetary Indicators
11. How do we measure and classify expenditure, taxes and subsidies on the management for different environmental issues?
The answers to these questions should be consistent across indicators. Aligning indicators to the SEEA and SNA helps build this consistency

02/01/2018
9
17
Methodological Consistency resulting from implementation of the SEEA reduces reporting burden of national ministries/agencies:
MINISTRY 1 I MINISTRY 2 I MINISTRY 3
INTERNATIONAL AGENCIES’ REPORTING INITIATIVES
• Single Data System to Inform Indicators
• Data Compiled Once for Many Purposes
• Reduced need for countries to make arduous data adjustments for international reporting
Facilitates streamlined reporting process for global SDG Indicators
• Consistent definitions, classifications and spatial units at national and international level allows for direct transmission of information
Common Interface
National Statistical System/Office
based on SEEA and SNA
Streamlined reporting
SEEA: Underlying statistical framework for international initiatives

02/01/2018
10
IMPLEMENTATION OF THE SEEA
Countries working on the SEEA
20
Africa
BotswanaKenyaMali
MadagascarMauritiusMorocco
MozambiqueNigeriaRwanda
SeychellesTunisia
South AfricaUgandaZambia
South America
BrazilChile
ColombiaCuracaoEcuadorParaguay
PeruUruguay
North America
CanadaMexico
Central America
Costa RicaDominican Republic
GuatemalaJamaica
Europe
EU COUNTRIESAlbania
Bosnia and Herzegovina
GeorgiaMacedonia
MontenegroNorwayRussiaSerbia
SwitzerlandTurkey
Asia
BangladeshBhutanChinaIndia
IndonesiaJapan
KazakhstanKyrgyzstan
MaldivesMalaysiaMongoliaMyanmar
NepalPhilippinesRepublic of
KoreaVietnam
Oceania
AustraliaF.S. of Micronesia
FijiNew Zealand
PalauSamoa
Vanuatu
Middle East
IsraelQatar
*Country list based on Global Assessment on Environmental Accounting (2014) (http://unstats.un.org/unsd/statcom/doc15/BG-UNCEEA.pdf), UNCEEA survey of where assistance is being provided (UNCEEA/BK/5(2) at http://unstats.un.org/unsd/envaccounting/ceea/meetings/eleventh_meeting/lod11.htm), and other current knowledge of technical assistance programmes. Some countries may be only just embarking on a project related to SEEA.

02/01/2018
11
Status of SEEA Implementation
• Global Assessment on Environmental
Economic Accounting 2014
• 84 countries responded
• 54 currently have an SEEA programme
• Accounts most commonly compiled;
Air Emissions, Material Flows, Energy
• Priorities accounts going forward;
Developed Countries: Energy, EPEA and EGSS
Developing Countries: Energy, Water and Environmental Taxes and Subsidies
31
3
23
12
0
5
10
15
20
25
30
35
Countries with an SEEA
programme
Countries planning an
SEEA programme
Status of SEEA Implementation
(2014)
Developed Developing
SEEA Implementation Strategy
• Joint strategy for SEEA Central Framework and Experimental
Ecosystem Accounts
OBJECTIVES:
• Adoption of the SEEA as the measurement framework for sustainable
development
• Mainstreaming of SEEA implementation in countries as part of the
modernization statistical production process
• Establishment of technical capacity for regular reporting on a
minimum set of SEEA accounts
TARGETS FOR 2020
• 100 countries with ongoing programmes on SEEA Central Framework
• 50 countries initiating work on SEEA Experimental Ecosystem
Accounting
02/01/2018
12
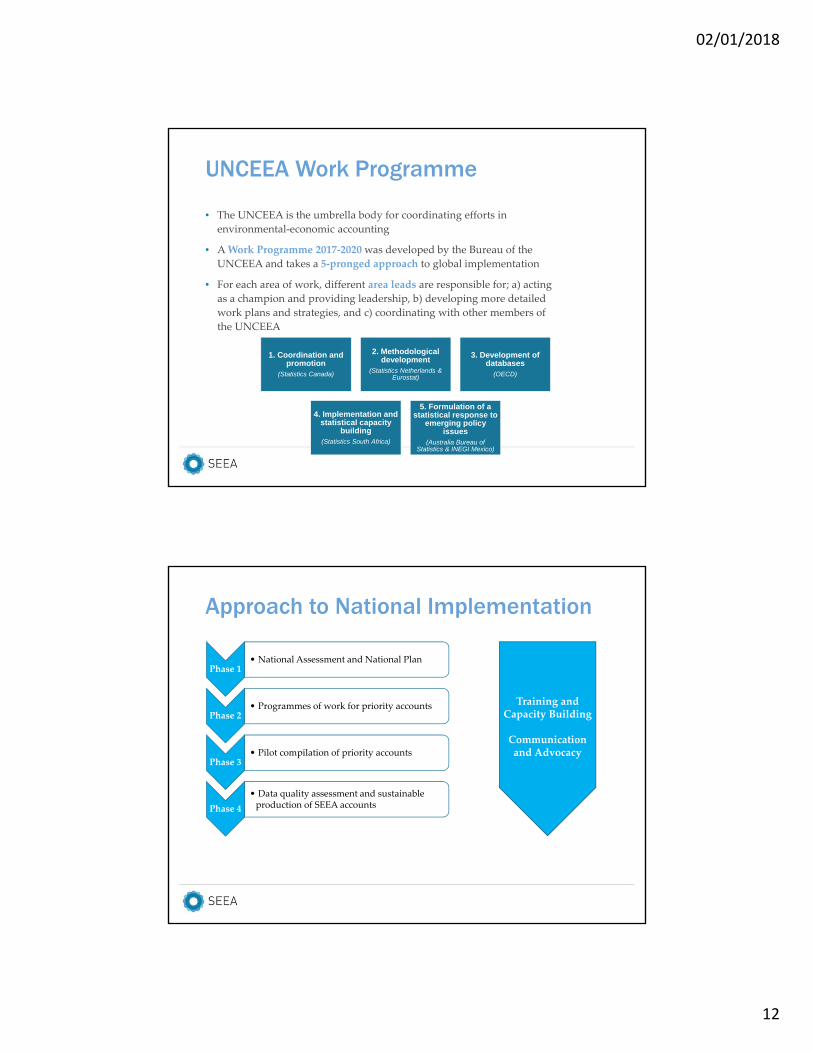
UNCEEA Work Programme
1. Coordination and promotion
(Statistics Canada)
2. Methodological development
(Statistics Netherlands & Eurostat)
3. Development of databases
(OECD)
4. Implementation and statistical capacity
building(Statistics South Africa)
5. Formulation of a statistical response to
emerging policy issues
(Australia Bureau of Statistics & INEGI Mexico)
• The UNCEEA is the umbrella body for coordinating efforts in
environmental‐economic accounting
• A Work Programme 2017‐2020 was developed by the Bureau of the
UNCEEA and takes a 5‐pronged approach to global implementation
• For each area of work, different area leads are responsible for; a) acting
as a champion and providing leadership, b) developing more detailed
work plans and strategies, and c) coordinating with other members of
the UNCEEA
Approach to National Implementation
Phase 1• National Assessment and National Plan
Phase 2• Programmes of work for priority accounts
Phase 3• Pilot compilation of priority accounts
Phase 4
• Data quality assessment and sustainable production of SEEA accounts
Training and Capacity Building
Communication and Advocacy

02/01/2018
13
Considerations for SEEA implementation
Strategic approach to implementation
Linking implementation to policy demands
National ownership
Regional and sub-regional approach Capacity building Communication
strategy
CHALLENGES, LIMITATIONS, DISCUSSION ITEMS

02/01/2018
14
Challenges and limitations
Securing political buy-in
Technical and Institutional
challenges in compilation
Communication of results
Translation of results into policy uses
• Statisticians making case to policy makers - communication
• Showing concrete applications required to gain buy-in
• Funding issues• Institutional barriers
• Setting up inter-institutional structures• Developing capacity----• Data availability and issues with
reconciling data from different sources• Setting up structures • Communicating results of SEEA
compilation in a way which can be used by policy makers
• Addressing inconsistencies
Un-coordinated international
approaches to environmental-
economic statistics
Issues for discussion
• What are your first impressions of the module? What appears new
and/or challenging?
• Can a presentation along the lines of Module 1 help in bringing
different stakeholders on board to undertake the SEEA
implementation?
• Implementation strategy – how does it apply to your country situation?
• What are the main policy priorities in your country? Can the SEEA
help inform them?
• The SEEA uses the same accounting structure of the SNA, but there are
some difference. Please elaborate. Are national accountants involved in
the SEEA implementation in your country?

02/01/2018
15
Issues for discussion
• Additional issues
> Prioritizing accounts based on policy demands
> Managing the implementation process – what are the main
issues/impediments in your country?
> Communication – how to best communicate the benefits of
the SEEA to different stakeholders?
THANK [email protected]


