

Inuit Health Survey: Inuit Health in Transition
and ResiliencyInuvialuit Settlement
Region 2008
Helga Saudny, Crystal Lennie, Kue Young, Grace Egeland
McGill University / CINEUniversity of Toronto
Why?Inuit want to have Inuit specific health informationWith results informed decisions can be made Overview of health status and living conditions of Inuvialuit

Where?Aklavik, Inuvik, Tuktoyaktuk, Sachs Harbour, Paulatuk and UlukhaktokWhen?August and September 2008

Inuvialuit Settlement Region Steering Committee – Qanuqitpit?
Aklavik: Glen GordonInuvik: Ethel Gruben, Gayle GrubenPaulatuk: Fred BennettSachs Harbour: Donna KeogakTuktoyaktuk: John Stuart JR.Ulukhaktok: Joshua OliktoakInuvialuit Regional Corporation: Crystal Lennie
BDHSSA: Jane Smith GNWT – Health: Dr. Kami KondolaICHR: Susan Chatwood
Advisor to the Committee:ARI: Alana Mero
Principle Investigator: Dr. Grace EgelandCo-Principal Investigator: Dr. Kue YoungCINE: Helga Saudny
How?

Participatory Processes:Memorandum of agreementsCommunity – University Research AgreementResearch licenses and ethics approvalDevelopment/refinement of questionnaires
Logistical support
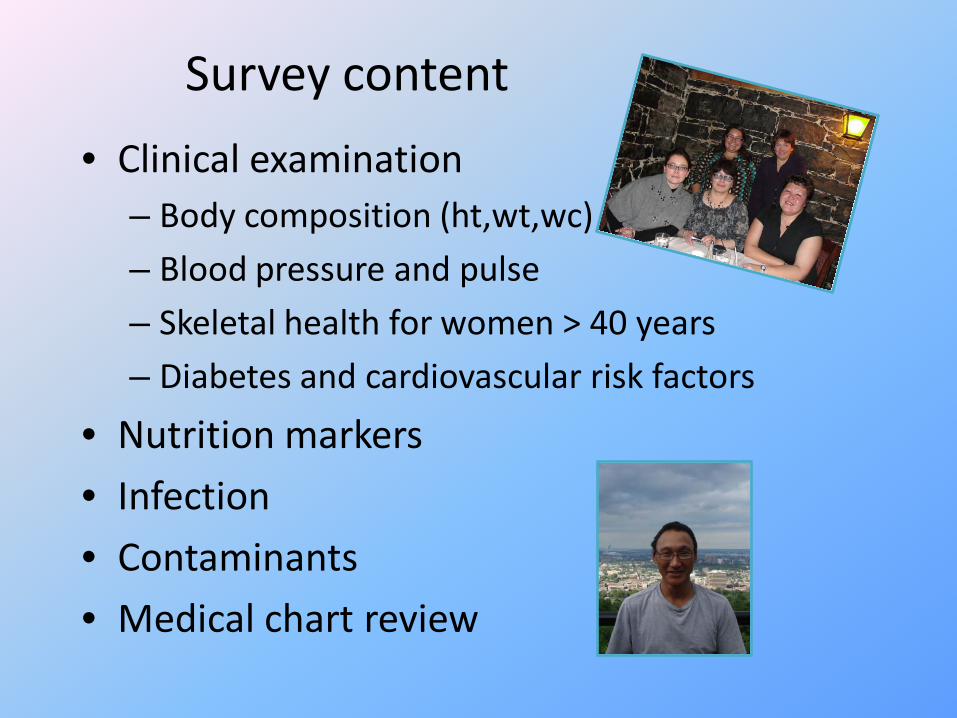
Survey content
• Clinical examination– Body composition (ht,wt,wc)
– Blood pressure and pulse
– Skeletal health for women > 40 years
– Diabetes and cardiovascular risk factors
• Nutrition markers
• Infection
• Contaminants
• Medical chart review

Survey content
• Questionnaires
– Dietary assessments• 24-hour recall and FFQ for country and market
food
– Dimensions of health• Self-reported health/Reproductive health
• Medical history
• Mental well-being
• Social support
• Physical activity
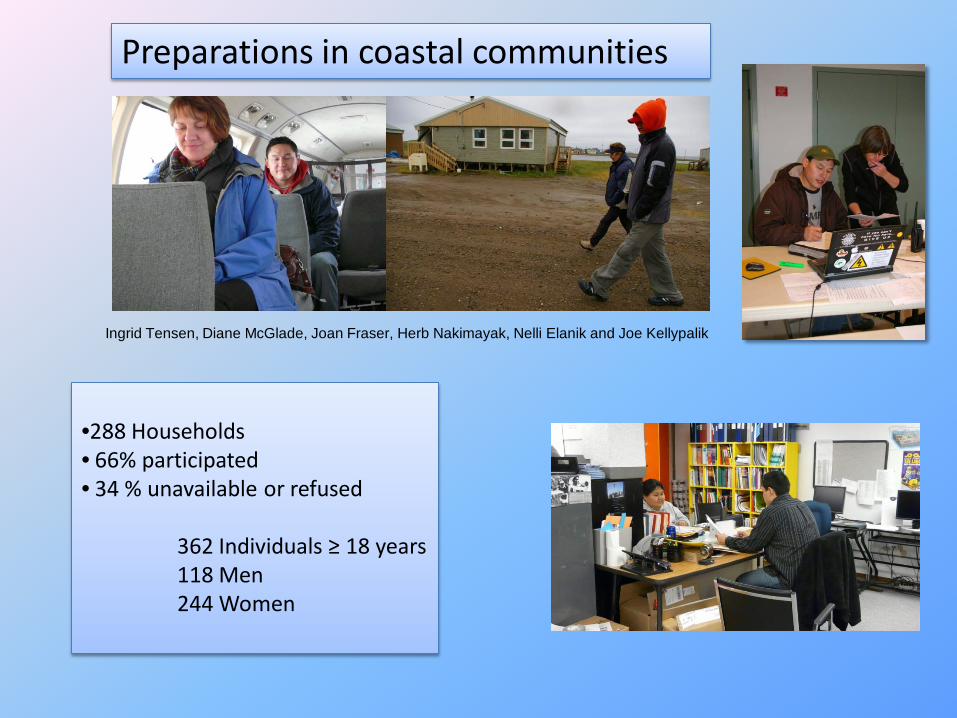
Ingrid Tensen, Diane McGlade, Joan Fraser, Herb Nakimayak, Nelli Elanik and Joe Kellypalik
Preparations in coastal communities
•288 Households• 66% participated• 34 % unavailable or refused
362 Individuals ≥ 18 years118 Men244 Women

Inuit Health Survey Team in Inuvik
L-R: Beverly Lennie, Laura Kaufer , Ingrid Tensen, Amy Harty, Mariah Arey-Storr, Rose Day, Nellie Elanik, Jen Jamieson, Dana Francey, Mearle, Evelyn Wilson, and Troy Amos

Transportation to the Canadian Coast Guard Ship Amundsen
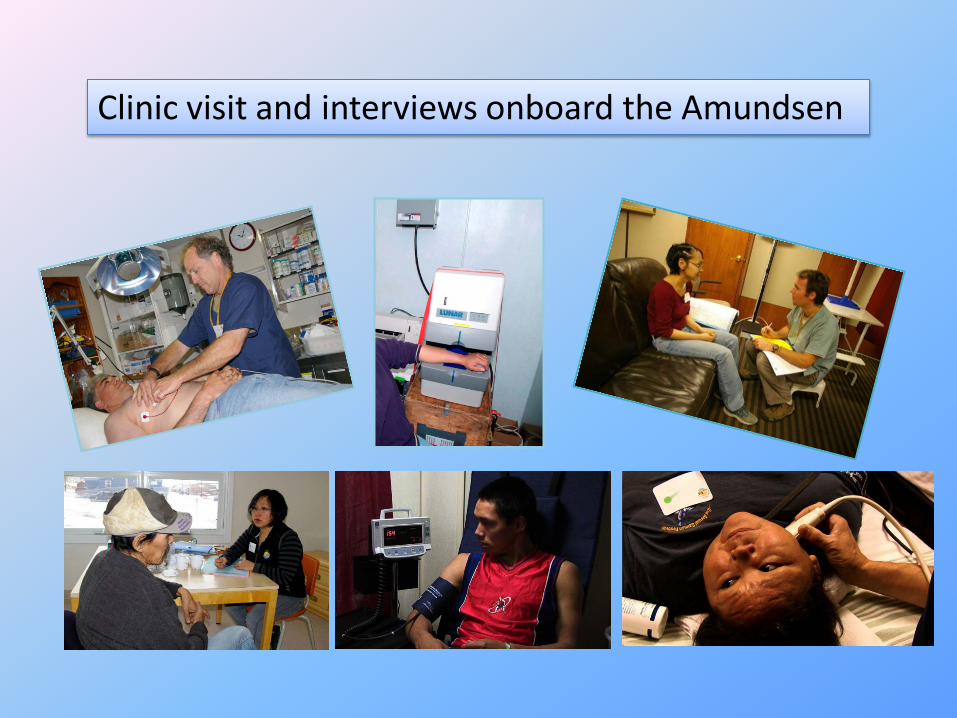
Clinic visit and interviews onboard the Amundsen
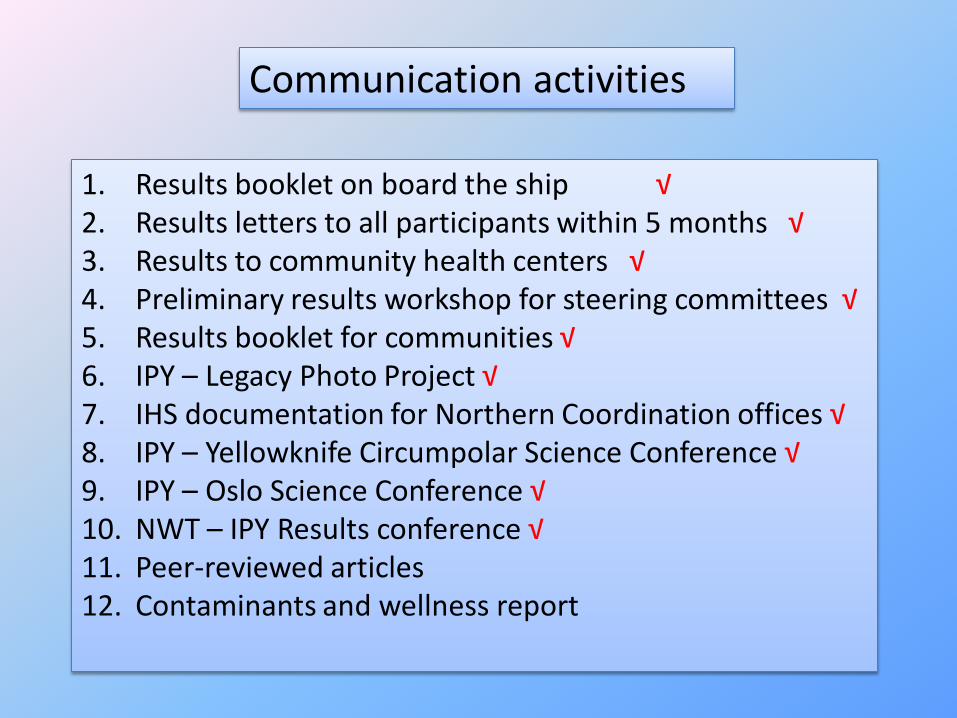
Communication activities
1. Results booklet on board the ship √2. Results letters to all participants within 5 months √3. Results to community health centers √4. Preliminary results workshop for steering committees √5. Results booklet for communities √6. IPY – Legacy Photo Project √7. IHS documentation for Northern Coordination offices √8. IPY – Yellowknife Circumpolar Science Conference √9. IPY – Oslo Science Conference √10. NWT – IPY Results conference √11. Peer-reviewed articles12. Contaminants and wellness report
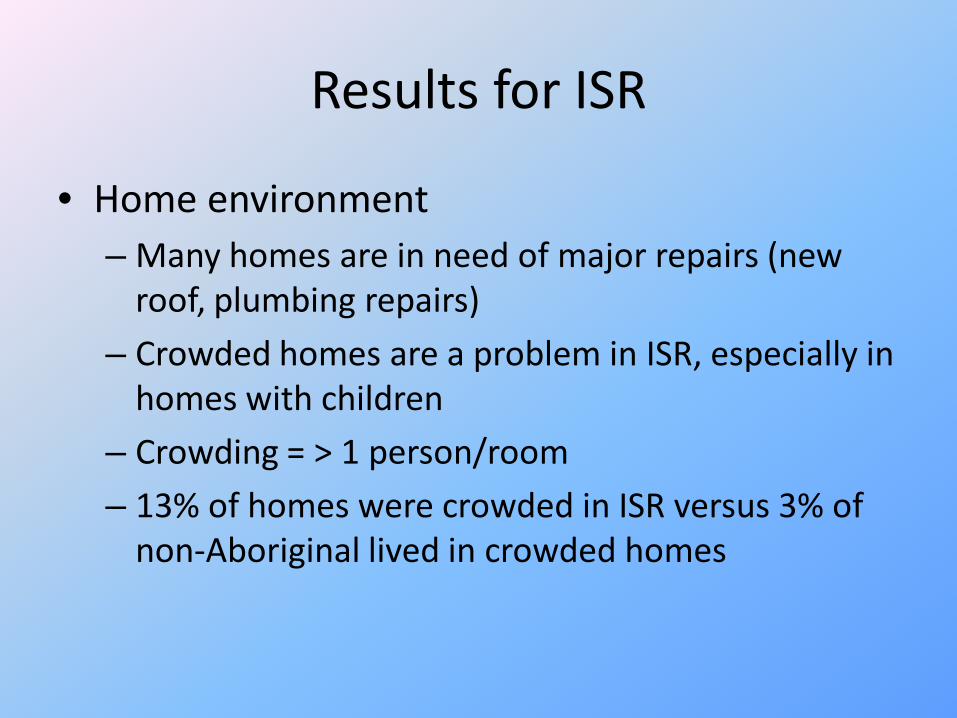
Results for ISR
• Home environment– Many homes are in need of major repairs (new
roof, plumbing repairs)
– Crowded homes are a problem in ISR, especially in homes with children
– Crowding = > 1 person/room
– 13% of homes were crowded in ISR versus 3% of non-Aboriginal lived in crowded homes

Results for ISR
• Smoking– 82% of homes had smokers (2 per home)
• Smoking was forbidden in 70% of homes
• Individual smoking rates are also high– 65% of participants were smoking at the time of
the survey
– 22% of other Canadians smoked in 2007

Cost of living in ISR
ISR households Other Canadianhouseholds
$ spent on food/month
$ 1,317.00 $ 609.00
$ spent on shelter/month*
$ 1,471.00 $ 1,137.00
* Includes rent or mortgage, electricity, heating, water, sewage, garbage

Food security in ISR• Food security
– Food security exists when “all people, at all times, have access to sufficient, safe and nutritious food to meet their dietary needs and food preference for an active and healthy life”.
• Food insecurity– Questions related to food security (food shortage, meal skipping)
• Worried food would run out before you got money to buy more?
• Cut the size of meals, skipped meals, were hungry but did not eat?
• Did not eat for a whole day because there wasn’t enough money for food?
• Could not afford to eat healthy food

Food insecurity in ISR
• Moderate food insecurity– Quality and/or quantity of food consumed is
affected• 2 to 5 positive answers
• Severe food insecurity– Less food eaten and eating patterns are disrupted
• ≥ 6 positive answers

Food insecurity in ISR
Household food insecurity (%)
Food secure
Moderate food insecurity
Severe food insecurity
54 %33 %
13 %

Country food in ISR
• Country food– Inuvialuit prefer to eat country food
• Not having an active hunter
• Not having a boat or skidoo
• Supplies and gas are too expensive
• No time
• ~ one-half worry about contaminants in country food
• Sharing country food is important to Inuvialuit

Most commonly eaten country food in ISR

Most commonly eaten market food in ISR
• Regular soft drinks
– 2 to 4 cans/day
– sugar
– High intakes of sugar = increased risk of obesity, heart disease and diabetes

• Average Caloric intake is higher among Inuvialuit compared with other Canadians
• 1/4 to 1/3 of Calories came from food high in sugar
• Inuvialuit eat enough protein, fat and carbohydrates
• Younger women need to eat more iron-rich food
• Majority of Inuvialuit need more vitamin D
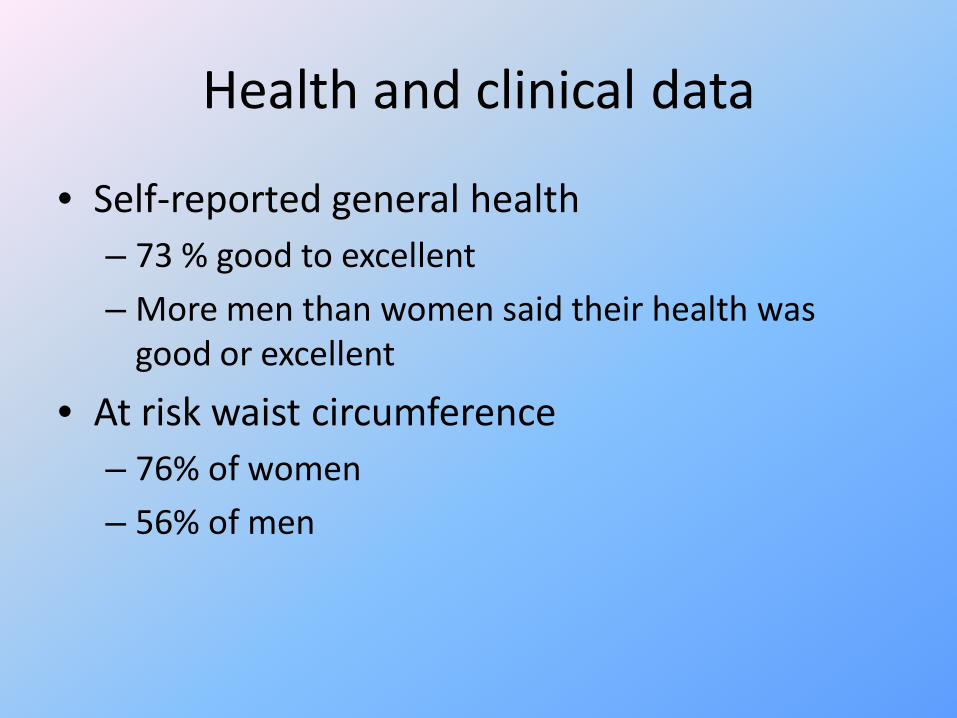
Health and clinical data
• Self-reported general health– 73 % good to excellent
– More men than women said their health was good or excellent
• At risk waist circumference– 76% of women
– 56% of men

Health and clinical data
• Blood lipids– Type and amount risk for heart disease
• Total cholesterol – 59% high levels
• LDL- cholesterol – 76% good levels
• HDL- cholesterol – 68% good levels
• Triglycerides – 72% good levels
• High triglyceride levels and high waist circumference– 7.5 times higher risk of diabetes
– Over 1/3 of Inuvialuit have both
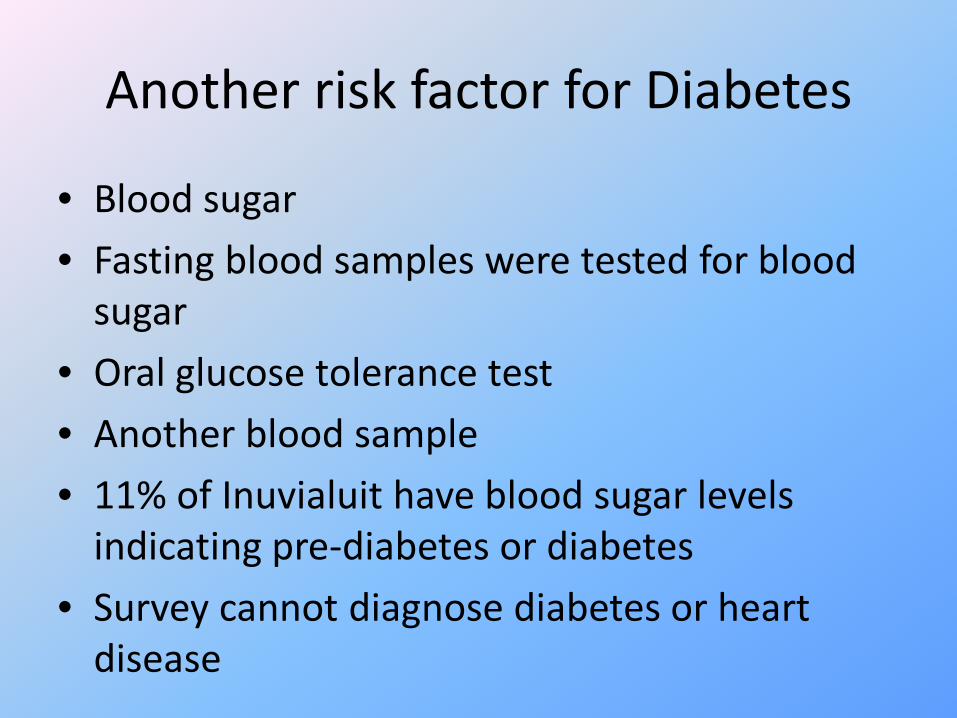
Another risk factor for Diabetes
• Blood sugar
• Fasting blood samples were tested for blood sugar
• Oral glucose tolerance test
• Another blood sample
• 11% of Inuvialuit have blood sugar levels indicating pre-diabetes or diabetes
• Survey cannot diagnose diabetes or heart disease

Implications of Research Results
Can lead to policy change*
Can lead to development of new policy*
Can lead to improvement of existing policy*
* Federal, Provincial, Regional levels within Inuit Regions

Thank you To all Inuvialuit who participated in the surveycommunity corporations, community health centers, community research assistants, nurses and staffISR steering committeePhotos by Inuit Health survey staff
Funded and supported by


