

Graduate Theses, Dissertations, and Problem Reports
2005
Investigation of moisture sensitivity of hot mix asphalt concrete Investigation of moisture sensitivity of hot mix asphalt concrete
Anu Ganesan Viswanathan West Virginia University
Follow this and additional works at: https://researchrepository.wvu.edu/etd
Recommended Citation Recommended Citation Viswanathan, Anu Ganesan, "Investigation of moisture sensitivity of hot mix asphalt concrete" (2005). Graduate Theses, Dissertations, and Problem Reports. 1664. https://researchrepository.wvu.edu/etd/1664
This Thesis is protected by copyright and/or related rights. It has been brought to you by the The Research Repository @ WVU with permission from the rights-holder(s). You are free to use this Thesis in any way that is permitted by the copyright and related rights legislation that applies to your use. For other uses you must obtain permission from the rights-holder(s) directly, unless additional rights are indicated by a Creative Commons license in the record and/ or on the work itself. This Thesis has been accepted for inclusion in WVU Graduate Theses, Dissertations, and Problem Reports collection by an authorized administrator of The Research Repository @ WVU. For more information, please contact [email protected].

Investigation of Moisture Sensitivity of Hot Mix Asphalt
Concrete
By
Anu Ganesan Viswanathan
Thesis submitted to the College of Engineering and Mineral Resources
at West Virginia University
in partial fulfillment of the requirements for the degree of
Master of Science
in
Civil Engineering
John P. Zaniewski, Ph.D., Chair
Ronald W. Eck, Ph.D.
Udaya B. Halabe, Ph.D.
Department of Civil and Environmental Engineering
Morgantown, West Virginia 26506
D
Key Words
Asphalt mix design, stripping potential, Marshall Stabilometer, laboratory conditioning,
indirect tensile strength, tensile strength ratio and antistrip additives

The Superpave mix design procedure was implemented at the end of Strategic
Highway Research Program (SHRP). Prior to implementing Superpave mix design
method, WVDOH used Marshall mix design method. National standards for Marshall
method do not require testing for potential moisture damage problems. However,
Superpave method requires that mix designers evaluate potential moisture sensitivity
problem using AASHTO T 283, “Resistance of Compacted Bituminous Mixture to
Moisture Induced Damage”. West Virginia, in compliance with national standards,
requires the use of this test for development of Superpave mix designs.
The objective of this research project is to evaluate impact of change in AASHTO
T 283 test method on Superpave mix designs in West Virginia. The Lottman test method
and Tunnicliff and Root test method were combined into Modified Lottman test
procedure and published as AASHTO T 283 in 1985 and revised in 1989. Research was
done to establish how the Superpave compaction and conditioning method affect the test
results. As a result of this research, AASHTO T 283 test method was revised in 2003. In
the 2003 version, use of gyratory compactor was allowed and changes were made to
sample preparation, air void tolerance level, sample conditioning method, and method of
testing samples. The major change was a mandatory freeze-thaw cycle to condition
samples.
This research examined the application of the current AASHTO T 283 applied to
West Virginia mixes. It was concluded that this is not a reliable test method for moisture
sensitivity. The 2003 version of the test does not improve the ability of the test to
identify moisture sensitive mixes.

iii
DEDICATION
THIS THESIS IS DEDICATED TO MY FAMILY
WHO HAVE MADE IT POSSIBLE FOR ME TO COMPLETE MY
MASTERS DEGREE IN WVU

iv
ACKNOWLEDGEMENTS
I would like to express my gratitude to my advisor, Dr. John Zaniewski, who
provided a motivating and enthusiastic atmosphere. It was a great pleasure for me to
work under his supervision. I am sincerely thankful for his patience and time when
guiding me throughout this research endeavor.
I am thankful to Dr. Ronald Eck and Dr. Udaya Halabe, members of my thesis
committee, for their precious time and guidance.
Special thanks to my Lab mates at WVU Asphalt Technology Laboratory, for
their support and assistance.
The research sponsorship of the West Virginia Division of Highways is
appreciated. The support of the asphalt paving industry in West Virginia also
contributed to the success of this research, in particular, the materials supplied by J.F.
Allen Company, New Enterprise Stone and Lime, Carl Kelly Paving Inc., and Marathon
Ashland Petroleum, LLC.
I am thankful to my Parents, Sister and Aunt, who made me realize the
importance of advanced studies. I would like to extend my thanks to my friend Vijay
who always helped me with testing. Their love and support have been a source of
strength and motivation.

v
TABLE OF CONTENTS
Abstract ....................................................................................................................... ii
Acknowledgements .................................................................................................... iv
TABLE OF CONTENTS .............................................................................................v
LIST OF FIGURES................................................................................................... vii
LIST OF TABLES ................................................................................................... viii
CHAPTER 1: INTRODUCTION ................................................................................1
1.1 Background ............................................................................................................1
1.2 Problem Statement .................................................................................................3
1.3 Objective ................................................................................................................5
1.4 Scope and Limitations ............................................................................................5
1.5 Thesis Organization................................................................................................5
CHAPTER 2: LITERATURE REVIEW .....................................................................7
2.1 Introduction ............................................................................................................7
2.2 Stripping Mechanisms............................................................................................7
2.2.1 Molecular-level ...................................................................................................8
2.2.2 Macro-level .........................................................................................................8
2.2.3 Additional factors ..............................................................................................10
2.3 Influence of Aggregate on Stripping ....................................................................12
2.4 Engineering and Construction Considerations .....................................................12
2.4.1 Inadequate pavement drainage ..........................................................................13
2.4.2 Inadequate compaction......................................................................................13
2.4.3 Excessive dust coating on aggregate .................................................................14
2.4.4 Inadequate drying of aggregate .........................................................................14
vi
2.4.5 Weak and friable aggregate ...............................................................................14
2.4.6 Waterproofing membranes and seal coats.........................................................14
2.5 Tests Methods for Moisture Susceptibility ..........................................................15
2.6 Evaluation of Moisture Susceptibility Tests ........................................................18
2.6.1 Comparative studies ..........................................................................................19
2.6.2 NCHRP Project 9-13 .........................................................................................22
2.7 Techniques for Limiting Stripping .......................................................................32
2.7.1 Anti-stripping agents .........................................................................................32
2.7.2 Aggregate pre-treatment....................................................................................38
2.8 Identification of Moisture Damage in the Field ...................................................38
2.8.1 Maupin’s procedure...........................................................................................38
2.8.2 Kandhal’s procedure..........................................................................................39
2.8.3 Tunnicliff and Root’s procedure .......................................................................41
2.9 Chapter Summary.................................................................................................41
CHAPTER 3: EXPERIMENTAL DESIGN AND TESTING PROCEDURES........43
3.1 Introduction ..........................................................................................................43
3.2 Experimental Design and test materials ...............................................................43
3.2.1 Verification of mix design.................................................................................46
3.2.2 Moisture sensitivity testing ...............................................................................47
3.2.1 Loose mix aging and compacted mix aging......................................................50
3.2.2 Sample selection................................................................................................50
CHAPTER 4 DATA COLLECTION AND ANALYSIS ..........................................58
4.1 INTRODUCTION................................................................................................58
4.2 VOLUMETRIC PROPERTIES ...........................................................................58

vii
4.3 TEST RESULTS ..................................................................................................58
4.3.1 Samples with anti-strip admixture.....................................................................63
4.3.2 Effect of conditioning method...........................................................................64
4.3.3 Level of saturation.............................................................................................65
CHAPTER 5: CONCLUSIONS AND RECOMMENDATIONS .............................66
5.1 Conclusions ..........................................................................................................66
5.2 Recommendations ................................................................................................68
References ..................................................................................................................69
Appendix A - Mositure sensitivity data set ................................................................72
LIST OF FIGURES
Figure 1.1 Failed pavement on I-68 in West Virginia..................................................1
Figure 1.2 Generalized flow chart for identifying moisture-related
distress (TRB, 2003).....................................................................................................4
Figure 2.1 Typical appearance of stripping in compacted mix (TRB, 2003).............11
Figure 2.2 Effect of anti-strip agent on surface bonding of aggregate and asphalt
(a) untreated (b) treated (Ksaibati and Conner 2004).................................................34
Figure 2.3 Deterioration curve for an asphalt pavement (Maupin, 1999;
Bahia, et al., 1999)......................................................................................................39
Figure 3.1 Gradation for 9.5mm limestone aggregates from J.F. Allen source .........44
Figure 3.2 Gradation for 9.5mm limestone aggregates from New Enterprise
source..........................................................................................................................45
Figure 3.3 Gradation for 19mm limestone aggregates from Carl Kelly source .........45
Figure 3.4 Flow chart for the AASHTO T 283 test method.......................................48
Figure 3.5 Sample subjected to dry conditioning.......................................................51
Figure 3.6 Vacuum apparatus.....................................................................................52

viii
Figure 3.7 Sample subjected to wet conditioning ......................................................54
Figure 3.8 IDT Strength test setup and failure plane .................................................55
Figure 3.9 Measuring tensile strength for the dry subset using Marshall Stability
and Flow Machine ......................................................................................................56
Figure 3.10 Measuring tensile strength for the saturated no freeze-thaw subset
using Marshall Stability and Flow Machine...............................................................56
Figure 3.11 Measuring tensile strength for the saturated freeze-thaw subset using
Marshall Stability and Flow Machine ........................................................................57
Figure 4.1 Comparison of tensile strength for different sample conditioning
(without anti-strip)......................................................................................................61
Figure 4.2 Comparison of tensile strength ratio for subsets with and without
anti-strip......................................................................................................................62
Figure 4.3 Comparison of tensile strength for different sample conditioning
(with anti-strip)...........................................................................................................63
Figure 4.4 Comparison of tensile strength for subsets with and without anti-strip....64
LIST OF TABLES
Table 2.1 Factors contributing to moisture-related distress (TRB, 2003)..................13
Table 2.2 Summary of AASHTO T 283 test parameters ...........................................17
Table 2.3 NCHRP Project 9-13 experimental plan for tasks 3 and 4 (Epps, et al.,
2000)...........................................................................................................................24
Table 2.4 ANOVA for complete factorial NCHRP Project 9-13 (Epps, et al.,
2000)...........................................................................................................................25
Table 3.1 Time schedule for test procedure of AASHTO T 283 ...............................49
Table 4.1 Comparison of volumetric properties.........................................................59
Table 4.2 Indirect tensile strength and TSR for all three sources ..............................60
Table 4.3 Comparison of saturation level ..................................................................65

1
CHAPTER 1: INTRODUCTION
1.1 BACKGROUND
The West Virginia Division of Highways (WVDOH) uses the Superpave as the
primary mix design method for pavements on high volume roads in the state. In general,
the performance of these pavements has met expectations. However, overlay projects on
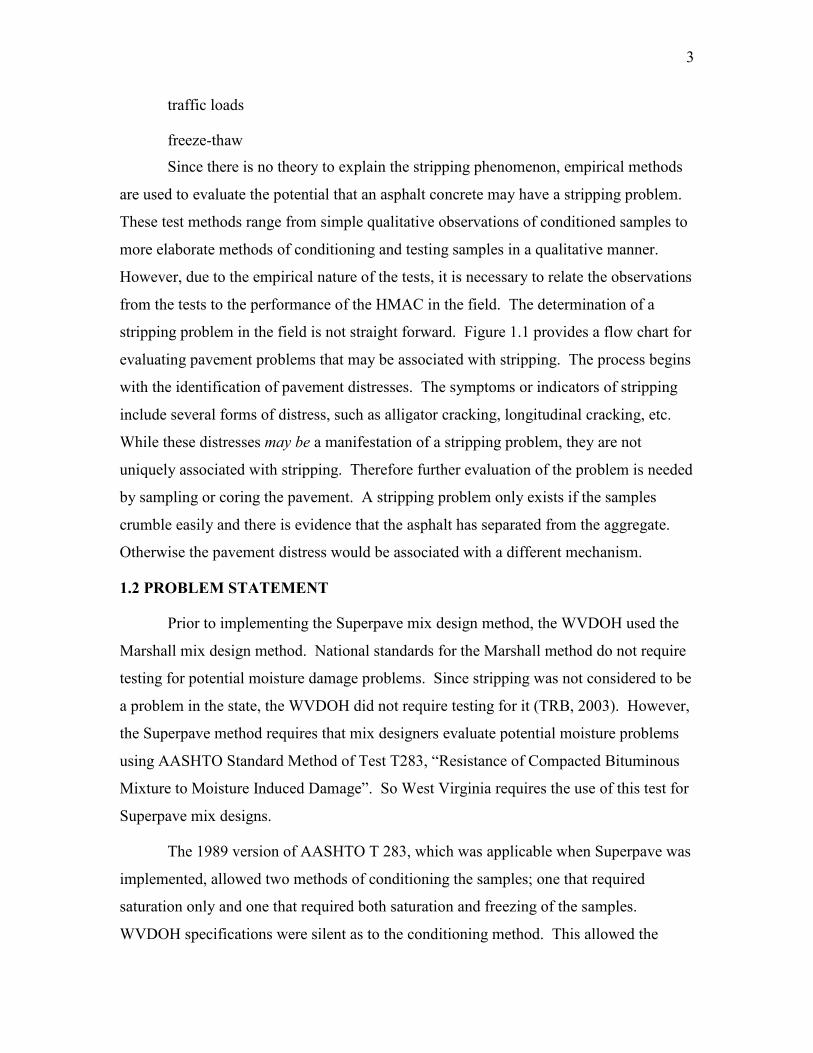
I-68 in 1999 and 2000 developed major distress, such as shown in Figure 1.1, during the
2003-2004 winter. Preliminary investigation examined lack of compaction of
longitudinal joints, stripping of the asphalt and deterioration of the aggregate as potential
causes of the premature failure. The observation of stripping on this project was unique
to the WVDOH as prior to this failure, it was believed that stripping was not a problem in
the state. The state did not require the use of a stripping test with the Marshall mix
design method. However, in compliance with national standards, the state requires it for
mixes designed with the Superpave method. Experience gained with the problems
associated with these failed pavements on I 68 lead to this research on issues associated
with stripping of pavements in West Virginia.
Figure 1.1 Failed pavement on I-68 in West Virginia
Lottman, et al. (1988) found that moisture damage of asphalt concrete pavements
was a problem experienced by more than one-half of the State Highway Agencies (SHA)

2
in the United States. In a seminar on Moisture Sensitivity of Asphalt Pavements, it was
reported (TRB, 2003) that 82 percent of highway agencies require the use of an antistrip
additive in hot mix asphalt concrete, HMAC. The WVDOH response to the survey
conducted for Moisture Sensitivity of Asphalt Pavements seminar was that stripping was
not a problem in the state.
Moisture damage could manifest itself in asphalt pavements either due to
stripping or the softening of asphalt, both of which result in loss of ability to resist traffic-
induced stresses. Asphalt concrete mix derives its strength from the cohesion of the
binder, and the interlocking and frictional resistance of the aggregates. The cohesion of
the binder is fully available if a good bond exists between the aggregates and asphalt
cement. In the presence of a good bond, failure of the mix should occur within the binder
or the aggregates, due to softening or brittle cracking of the binder, and breakdown of the
aggregates. If the bond is poor, failure could occur at the aggregate-asphalt interface,
thereby leading to premature failure of the mix. This premature failure of the bond is
commonly referred to as stripping in asphalt pavements (Kanitpong and Bahia, March
2003). Stripping in general, is defined as the physical separation of the asphalt cement
and aggregates due to the loss of adhesion between the asphalt cement and the aggregate
surface (Hunter and Ksaibati, 2002). Due to the degradation of material, the most
common method for rehabilitating a stripped pavement involves the removal and
replacement of the stripped material (Johnson and Freeman, 2002).
Due to the extent of the stripping problem, extensive research has been
performed. The mechanisms associated with stripping are complex and no cohesive
theory exists that explains the development of stripping. Research has shown that
stripping is associated with several factors (Lottman, et al., 1988, Hunter and Ksaibati,
2002, Epps, et al., 2000, and TRB, 2003):
ability of asphalt to bond with aggregate
dust coating on aggregate
residual moisture in the HMAC during construction
moisture penetration into the pavement structure
3
traffic loads
freeze-thaw
Since there is no theory to explain the stripping phenomenon, empirical methods
are used to evaluate the potential that an asphalt concrete may have a stripping problem.
These test methods range from simple qualitative observations of conditioned samples to
more elaborate methods of conditioning and testing samples in a qualitative manner.
However, due to the empirical nature of the tests, it is necessary to relate the observations
from the tests to the performance of the HMAC in the field. The determination of a
stripping problem in the field is not straight forward. Figure 1.1 provides a flow chart for
evaluating pavement problems that may be associated with stripping. The process begins
with the identification of pavement distresses. The symptoms or indicators of stripping
include several forms of distress, such as alligator cracking, longitudinal cracking, etc.
While these distresses may be a manifestation of a stripping problem, they are not
uniquely associated with stripping. Therefore further evaluation of the problem is needed
by sampling or coring the pavement. A stripping problem only exists if the samples
crumble easily and there is evidence that the asphalt has separated from the aggregate.
Otherwise the pavement distress would be associated with a different mechanism.
1.2 PROBLEM STATEMENT
Prior to implementing the Superpave mix design method, the WVDOH used the
Marshall mix design method. National standards for the Marshall method do not require
testing for potential moisture damage problems. Since stripping was not considered to be
a problem in the state, the WVDOH did not require testing for it (TRB, 2003). However,
the Superpave method requires that mix designers evaluate potential moisture problems
using AASHTO Standard Method of Test T283, “Resistance of Compacted Bituminous
Mixture to Moisture Induced Damage”. So West Virginia requires the use of this test for
Superpave mix designs.
The 1989 version of AASHTO T 283, which was applicable when Superpave was
implemented, allowed two methods of conditioning the samples; one that required
saturation only and one that required both saturation and freezing of the samples.
WVDOH specifications were silent as to the conditioning method. This allowed the

4
materials designers to select between the two conditioning methods and the practice in
the state was to use saturation only method. However, in 2003, the testing protocol of
T283 was altered; the option of conditioning with only saturation was removed. This
forces the material designers to use the saturation plus freezing procedure which adds
significant time, effort and experience to the preparation of mix designs.
Figure 1.2 Generalized flow chart for identifying moisture-related distress (TRB, 2003)
Observe stripping
symptoms/Indicators
Surface staining/pumping
Asphalt flushing
Longitudinal cracking
Alligator cracking
Raveling
Obtain sample of pavement
(core or jackhammer section)
Sample is
SOLID
Sample is
CRUMBLY
Probably
NOT STRIPPING
LITTLE or NO
ASPHALT
COATING on
aggregate
ASPHALT COATING
appears OK
Probably
STRIPPING
Probably
NOT STRIPPING
Could be:
Poor compaction
Low asphalt content
High dust / asphalt ratio
Soft or dirty aggregate
Absorbent aggregate

5
1.3 OBJECTIVE
The objective of this research project is to evaluate the impact of the change in
AASHTO T 283 conditioning procedure on Superpave mix designs in West Virginia.
Since it was believed that the conditioning method with freezing is more severe than the
saturation only method, it was decided to investigate if antistrip agents would allow
mixes which otherwise failed the moisture damage requirement to pass the specification.
1.4 SCOPE AND LIMITATIONS
This research focused on the potential implementation by the West Virginia
Division of Highways, WVDOH. All materials used during the research were typical of
those used in the state. Hence, two Nominal Maximum Aggregate Sizes (NMAS) 9.5
mm and 19 mm commonly used by WVDOH were selected for this experiment.
Similarly, a PG70-22 binder was selected, which is typically used in West Virginia for
Superpave mixes.
The work was limited to the instruments available in the Asphalt Technology
Laboratory of West Virginia University, Morgantown. A Marshall Stabilometer, with a
split tensile loading head, was used to determine the tensile strength of asphalt mixtures.
The loading head has steel strips, with an internal diameter of 150 mm. All samples were
compacted with a Superpave Gyratory Compactor (SGC).
1.5 THESIS ORGANIZATION
Chapter 2 of this report is a literature review of moisture susceptibility, stripping,
existing techniques for limiting moisture effects, anti-stripping additives, test methods for
moisture susceptibility, case studies on AASHTO T 283 test method, and various
mechanisms of stripping.
Chapter 3 discusses the experimental design and explains the test procedures
followed during the process of this research. It describes the materials used for the
production of cores, effect of freeze-thaw cycles on the HMA specimens, and how the
Marshall Stability and Flow Machine were used for testing moisture susceptibility.

6
Chapter 4 includes the data collected throughout this research project and the
analysis of the laboratory test results. In this chapter, the tensile strength ratios (TSR) of
the conditioned specimens with and without the addition of anti-stripping additives were
determined using Marshall Stability machine and the test results can be found in
Appendix A.
Chapter 5 presents conclusions from this research and recommendations for
further research.

7
CHAPTER 2: LITERATURE REVIEW
2.1 INTRODUCTION
Stripping is a major distress occurring in hot mix asphalt (HMA) pavements in the
United States and in various parts of the world. Pavement performance is adversely
affected by stripping and unforeseen increases in maintenance are often incurred
(Lottman, et al., 1988). Environmental factors such as temperature and moisture can
have a profound effect on the durability of hot mix asphalt pavements. When critical
environmental conditions are coupled with traffic and poor materials, premature failure
may occur as a result of stripping of the asphalt binder from the aggregate particles
(West, et al., 2004).
2.2 STRIPPING MECHANISMS
Moisture-related problems are due to or are accelerated by:
• Adhesive failure—stripping of the asphalt film from the aggregate surface, or
• Cohesion failure—loss of mixture stiffness.
Adhesive failure in aggregates and asphalt occurs at an interface, while cohesive
failure occurs directly within asphalt or aggregate surface (Shah, 2003). These
mechanisms can be associated with the aggregate, the binder, or the interaction between
the two ingredients. When a weakening in the bond between the aggregate and asphalt
cement occurs, loss of strength of the HMA can be sudden in some cases where the
asphalt and aggregates are influenced by more than one factor or mechanism. Stripping
usually begins in the bottom of the HMA layer, and travels upward. A typical situation is
a gradual loss of strength over a period of years, which allows rutting and shoving to
develop in the wheel path. Many times, stripping is difficult to identify because surface
indicators may take years to show. Also, many surface indicators are possible and may
include: rutting, shoving, corrugations, raveling, and cracking. It is necessary to look at
the cores of the HMA mix to identify stripping. In some cases of stripping, a HMA mix
has lost so much adhesion between the aggregate and asphalt that a core cannot be
removed in one piece (Hunter and Ksaibati, 2002).

8
2.2.1 Molecular-level
Stripping of asphalt pavements occurs at the molecular level and is not entirely
understood in spite of extensive research. It is thought to be associated with either one or
both of the following two phenomena. First, water can interact with asphalt binder to
cause a reduction in cohesion with subsequent reduction in stiffness and strength of the
mix. Second, and more commonly believed, water can get between the asphalt film and
the aggregate, break the adhesive bond, and strip the asphalt binder from the aggregate
(Johnson and Freeman, 2002).
The nature of the adhesive bond between the asphalt binder and aggregate is a
subject of some debate. Adhesion is defined as that physical property or molecular force
by which one body sticks to another of another nature. Several factors affect the
adhesion of the asphalt binder to the aggregate, including: interfacial tension between the
asphalt binder and the aggregate, chemical composition of the asphalt binder and
aggregate, binder viscosity, surface texture of the aggregate, aggregate porosity,
aggregate cleanliness, aggregate temperature and moisture content at the time of mixing
(Johnson and Freeman, 2002).
Four general theories of adhesion exist to explain the adhesion of asphalt binder
to aggregates. These include the Mechanical Interlocking Theory, the Chemical Reaction
Theory, the Surface Energy Theory, and the Molecular Orientation Theory. The actual
nature of adhesion is not fully explained by any one of these theories, but is partially
explained in each theory (Johnson and Freeman, 2002).
2.2.2 Macro-level
There are several ways that moisture affects bituminous mixtures. Once moisture
accesses the mix, the mix structure is weakened. The mix losses stiffness and it fails
under repeated traffic loading. There are five mechanisms for the asphalt film to be
stripped from an aggregate surface. These mechanisms may act individually or together.
A brief description of each mechanism follows.
2.2.2.1 Detachment
Detachment is the microscopic separation of a binder film from the aggregate
surface by a thin layer of water with no obvious break in the binder film. The binder will

9
then peel cleanly from the aggregate. The thin film of water probably results from either
aggregate that was not completely dried, interstitial pore water which vaporized and
condensed on the surface, or possibly water which permeated through the asphalt film to
the interface (Johnson and Freeman, 2002).
2.2.2.2 Displacement
Displacement occurs when the binder is removed from the aggregate surface by
water. In this type of stripping, as compared to detachment, the free water gets to the
aggregate surface through a break in the binder coating. The break may be from
incomplete coating during mixing or from binder film rupture (Johnson and Freeman,
2002).
2.2.2.3 Spontaneous emulsification
Spontaneous emulsification occurs when an inverted emulsion of water droplets
in asphalt cement forms rather than the converse. Investigators have noted that this
process can be exacerbated under traffic on mixtures laden with free water. Fromm
(1974) conducted experiments to demonstrate the formation of an emulsion in which he
observed that once the emulsion formation penetrated to the substrate, the adhesive bond
was broken. Fromm (1974) and many investigators have observed the formation of a
brownish color on the surface of asphalt films (approximately 1/8 inch) in severely
stripped mixtures as well as on asphalt films submerged in water (Kiggundu and Roberts,
1988).
2.2.2.4 Film rupture
Film rupture is reported to initiate stripping when film fissures occur at sharp
aggregate contact, or points due to dust particles on the aggregate surface. The rupture
may occur due to construction loads, operating traffic during service conditions, or could
be environmentally induced by freeze-thaw cycling. Once a break in the film occurs,
moisture has access to the interface and initiates stripping (Kiggundu and Roberts, 1988).
2.2.2.5 Pore pressure
This mechanism precipitates from the presence of water in the pore structure of
the HMA locations where segregation is prevalent at layer boundaries when heavy traffic
loadings occur and during freeze-thaw cycling. Due to pore pressure, pavement layers

10
are known to strip at the interfaces, pavement layers have been observed to disintegrate
usually from bottom upward, and in a few instances disintegration within a layer in both
directions. In a majority of cases, the binder layers disintegrate first followed by surface
layers. Lottman, as cited by Kiggundu and Roberts, (1988) postulated a pore pressure
mechanism produced the deterioration of the asphalt (Kiggundu and Roberts, 1988).
Kandhal, et al. (1989) found that water and/or water vapor was enters the
pavement overlay from underneath, primarily through the longitudinal and transverse
joints cracks in the PCC pavement. Water vapor accumulated in the pavement layers
during the day condenses during the night resulting in saturation of the asphalt overlay.
With saturation, the pore water pressure developed by differential thermal expansion and
cyclic stresses from the traffic ruptures the asphalt-aggregate bond causing stripping.
2.2.2.6 Hydraulic scouring
Hydraulic scouring is caused by the occurrence of a capillary tension/compression
phenomenon around a moving heavy traffic wheel on a saturated HMA structure. The
asphalt is stripped off the aggregate, producing defects such as surface raveling. In
addition, dust is reported to mix with rainwater and, in the presence of traffic, can
enhance the abrasion of asphalt films from the aggregate (Kiggundu and Roberts, 1988).
2.2.3 Additional factors
Several additional factors have been suggested to also contribute to stripping,
including the use of open-graded friction courses, the use of excess anti-strip additives,
the use of siliceous aggregates, and the use of aggregates that have relatively high surface
potentials, those that impart a high pH value to water in contact with their surfaces
(Johnson and Freeman, 2002).
Weather conditions during construction have been related to stripping behavior.
If the weather is cool and wet during construction, moisture damage is more likely to
occur. During a pavement’s life, environmental factors such as temperature fluctuations,
freeze-thaw cycles, and wet-dry cycles have been suggested to influence stripping. All
other factors being equal, it is suggested that increased repetitions of traffic loading
accelerate stripping (Johnson and Freeman, 2002).

11
There are many possible causes of stripping; however, all involve excess moisture
in the HMA. There are many ways in which moisture can enter the HMA pavement
layers: capillary action from the water table, run off from the road surface, and seepage
from surrounding areas are a few examples. If adequate drainage is not present, air voids
in the HMA may become saturated with moisture, thereby increasing pressure and
weakening the bond (Hunter and Ksaibati, 2002).
Most mix designs specify an air void content of 3 to 5 percent. When the air void
content is below 5 percent, HMA materials have been shown to be almost impervious to
water. During construction, compaction control is not always good and high air void
contents can result. If an air void content is above 8 percent, water can readily seep into
the material. Excessive dust coating on an aggregate can inhibit coating by asphalt and
provide channels for water to penetrate. Other contributing factors to stripping may
include the use of open-graded asphalt friction; coarse, inadequate drying of aggregate;
weak aggregate; overlays on deteriorated concrete pavements; waterproofing membranes;
and seal coats (Hunter and Ksaibati, 2002). Figure 2.1 shows the effect of moisture
damage on the compacted specimens prepared for a moisture susceptibility tests.
Figure 2.1 Typical appearance of stripping in compacted mix (TRB, 2003)

12
2.3 INFLUENCE OF AGGREGATE ON STRIPPING
There are number of factors that influence the asphalt–aggregate bond: surface
texture, penetration of pores and cracks with asphalt, aggregate angularity, aging of the
aggregate surface through environmental effects, adsorbed coatings on the surface of the
aggregate, and the nature of dry aggregates versus wet aggregates (TRB, 2003).
Surface texture of the aggregate affects its ability to be properly coated, and a
good initial coating is necessary to prevent stripping. Cheng, et al. (2002) demonstrated
that the adhesive bond, calculated from basic surface energy measurements of the asphalt
and aggregate, between certain granites and asphalt was higher than between limestone
aggregate and asphalt when the bond was quantified as energy per unit of surface area.
However, when the bond was quantified as energy per unit of aggregate mass, the bond
energy was far greater for the calcareous aggregates than for the siliceous. These results
agreed well with mechanical mixture testing and clearly showed the importance of the
interaction of the physical and the chemical bond. Besides the importance of a good
mechanical bond promoted by the surface texture, stripping has been determined to be
more severe in angular aggregates because the angularity may promote bond rupture of
the binder or mastic, leaving a point of intrusion for the water. Cheng, et al. (2002)
substantiated this as they have shown that, regardless of the strength of the bond between
the asphalt and aggregate, the bond between water and aggregate is considerably stronger
(TRB, 2003).
The coarse and fine aggregate characteristics are important factors related to
moisture damage. There is some evidence that moisture damage can be minimal if
stripping is restricted only to the coarse aggregate. If the fine aggregate strips, severe
damage can occur because the fine aggregate constitutes the basic matrix of the mixture
(Pan and White, 1999).
2.4 ENGINEERING AND CONSTRUCTION CONSIDERATIONS
Moisture-related distresses are also accelerated by mix design or construction
issues, including those given in Table 2.1. The initiation of one or more of the previously
described stripping mechanisms is attributable to engineering and/or construction
problems. These problems include, but are not necessarily limited to, inadequate

13
pavement drainage, inadequate compaction, excessive dust coating on the aggregate,
inadequate drying of aggregates, weak and friable aggregates, and the use of
waterproofing membranes and seal coats. Each factor will be briefly described below
(Johnson and Freeman, 2002).
Table 2.1 Factors contributing to moisture-related distress (TRB, 2003)
Mix Design
• Binder and aggregate chemistry
• Binder content
• Air voids
• Additives
Production
• Percent aggregate coating and quality of passing the No. 200 sieve
• Temperature at plant
• Excess aggregate moisture content
• Presence of clay
Construction
• Compaction—high in-place air voids
• Permeability—high values
• Mix segregation
• Changes from mix design to field production (field variability)
Climate
• High-rainfall areas
• Freeze–thaw cycles
• Desert issues (steam stripping)
Other Factors
• Surface drainage
• Subsurface drainage
• Rehab strategies—chip seals over marginal HMA materials
• High truck traffic
2.4.1 Inadequate pavement drainage
Inadequate surface drainage and/or subsurface drainage allow the water that is
necessary for stripping to occur to remain in the pavement system. Water can enter the
pavement layers in numerous ways. Surface water can percolate down from the surface,
usually through surface cracks. It can also seep in from the sides and bottom from
sources such as ditches or high groundwater. Water can also enter the bottom of the
pavement system by the upward forces of capillarity or as rising vapor condensation due
to water in the subgrade or subbase (Johnson and Freeman, 2002).
2.4.2 Inadequate compaction
High air voids present in the asphalt layers allow the movement of water through
these pore spaces. Studies have shown that at less than 4% to 5% air void content, the
14
voids are generally not interconnected and, therefore, impervious to water. While most
asphalt mixes are designed to have 3% to 5% air voids, many agencies allow a maximum
air void content of 8% at construction assuming that the remaining compaction will occur
under 2 to 3 years of traffic. If the pavement remains pervious for an extended period of
time, stripping is likely to occur due to ingress of water and hydraulic pore pressures
induced by traffic (Johnson and Freeman, 2002).
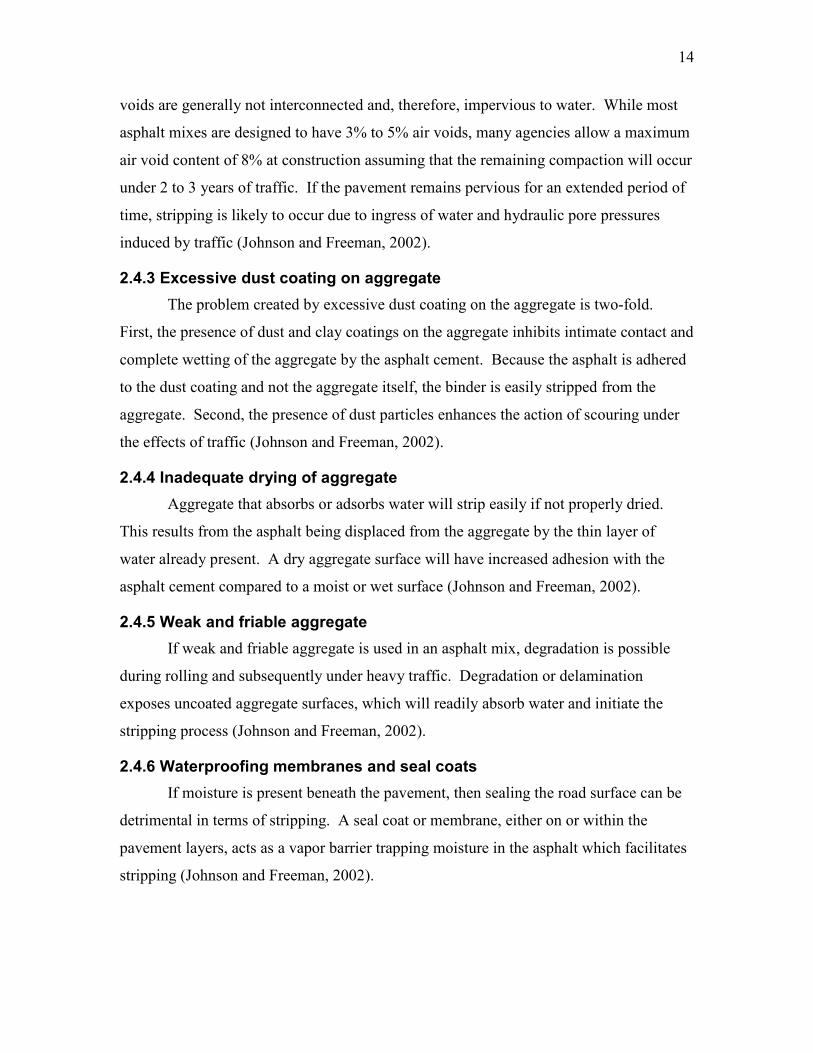
2.4.3 Excessive dust coating on aggregate
The problem created by excessive dust coating on the aggregate is two-fold.
First, the presence of dust and clay coatings on the aggregate inhibits intimate contact and
complete wetting of the aggregate by the asphalt cement. Because the asphalt is adhered
to the dust coating and not the aggregate itself, the binder is easily stripped from the
aggregate. Second, the presence of dust particles enhances the action of scouring under
the effects of traffic (Johnson and Freeman, 2002).
2.4.4 Inadequate drying of aggregate
Aggregate that absorbs or adsorbs water will strip easily if not properly dried.
This results from the asphalt being displaced from the aggregate by the thin layer of
water already present. A dry aggregate surface will have increased adhesion with the
asphalt cement compared to a moist or wet surface (Johnson and Freeman, 2002).
2.4.5 Weak and friable aggregate
If weak and friable aggregate is used in an asphalt mix, degradation is possible
during rolling and subsequently under heavy traffic. Degradation or delamination
exposes uncoated aggregate surfaces, which will readily absorb water and initiate the
stripping process (Johnson and Freeman, 2002).
2.4.6 Waterproofing membranes and seal coats
If moisture is present beneath the pavement, then sealing the road surface can be
detrimental in terms of stripping. A seal coat or membrane, either on or within the
pavement layers, acts as a vapor barrier trapping moisture in the asphalt which facilitates
stripping (Johnson and Freeman, 2002).

15
2.5 TESTS METHODS FOR MOISTURE SUSCEPTIBILITY
As demonstrated above, the stripping mechanism is very complex. Consequently,
research has focused on the development of empirical tests to identify asphalt concrete
mixes that are susceptible to stripping. There are no fundamental engineering tests
available to address the stripping problem.
Test methods to evaluate moisture damage have been under development since
the 1930’s. There are four standard test methods for evaluating the moisture
susceptibility of hot mix asphalt concrete, the Boiling Test ASTM D 3625, the Immersion
Compression test, AASHTO T 165, and the Modified Lottman procedure, AASHTO
T 283 and ASTM D 4867. The primary difference between the AASHTO and ASTM
versions of the modified Lottman test is that the ASTM procedure did not include a
freeze-thaw conditioning of the samples. AASHTO T 182 is used for evaluating the
moisture susceptibility of bituminous mixtures made with emulsions, cut-backs, and
semi-solid bituminous binders; since this method is not properly applied to HMAC it is
not considered further. In addition to the standard test methods, several procedures have
been used on a research basis to evaluate moisture susceptibility; most notably the
Hamburg method (Roberts, et al., 1996) and the Environmental Conditioning System
(Roberts, et al., 1996) developed during the Strategic Highway Research Program
(SHRP). Since the objective of this research is to evaluate methods and procedures used
by the WVDOH, only AASHTO T 283 procedure is considered in the following.
The Lottman test has its origins in NCHRP Project 192 with follow-up studies by
Tunnicliff and Root. The efforts of Lottman, Tunnicliff and Root were combined into the
Modified Lottman procedure published as AASHTO T 283 in 1985 (Hunter and Ksaibati,
2002). There were revisions to T 283 in 1989 and 2003. The SHRP researchers
recommended the use of AASHTO T283 to evaluate the water sensitivity of HMA within
the Superpave volumetric mixture design system (Shah, 2003). At the time of this
recommendation, the 1989 version of the test was in-place. The use of this test method
was made by the SHRP asphalt research team even though there was little testing to
establish how the use of the Superpave compaction equipment and conditioning methods
would affect the results of the test (Epps, et al., 2000). This deficiency in the research

16
was recognized by three groups: the SHRP asphalt research team, an NCHRP research
project that defined needed Superpave-related research, and the FHWA Asphalt Mixture
Technical Working Group. NCHRP Project 9-13, “Evaluation of Water Sensitivity
Tests”, was developed to address the use of AASHTO T 283 with the Superpave
volumetric design method (Epps, et al., 2000). As a result of this research, AASHTO
T 283 test method was modified in 2003. The salient features of the 1989 and 2003
versions of the test method are summarized in Table 2.2. Differences in the test methods,
identified in the table by bold letters, include:
• The use of the Superpave Gyratory Compactor, SGC, is allowed in the updated test specification. The SGC produces larger samples than the
previously used compaction methods.
• The sample preparation process was significantly altered. The temperature used for compaction was changed from a constant 135°C to the compaction temperature of the binder as determined from the binder's temperature-
viscosity characteristics. This is also the temperature used to compact
samples for the Superpave mix design process. The time the compacted
samples are stored prior to conditioning was changed from 72 to 96 hours in
the 1989 method to 24 ± 3 hours. In addition, tolerances of ±1 hour was
added to the 16 hour curing period and ± 10 min. was added to the time to
heat the sample to the compaction temperature.
• The evaluation of the samples requires determining the maximum theoretical specific gravity, Gmm, of the mix. The 2003 method requires that the samples
used to determine Gmm are conditioned in the same manner as the material
used for the compacted samples. The 1989 method was silent on this issue.
• The sample conditioning procedure was also significantly altered. The required minimum degree of saturation was increased from 55 to 70%. The
1989 procedure required distilled water for saturating the samples. This was
changed to potable water in the 2003 method. Freezing of the conditioned
samples was optional in the 1989 method and is mandatory in the 2003
method. In addition, tolerances were added for the temperature of the water
bath for the dry (unconditioned) samples and the for the amount of time the
dry samples are in the water bath. The tolerance for the soak time prior to

17
Table 2.2 Summary of AASHTO T 283 test parameters
Feature AASHTO T 283 (1989) AASHTO T 283 (2003)
Sample type Pavement cores
Marshall, Hveem, or Corp of Engineers Gyratory
Pavement cores
Marshall, Hveem, or Corp of Engineers Gyratory
Superpave Gyratory Compactor
Sample preparation Mixing temperature not specified
Cool to room temperature for 2 ± 0.5 hr.
Cure at 60°C for 16 hrs.
Heat at 135°C for 2 hrs Compact
Store for 72 to 96 hrs at room temperature
Mixing temperature not specified
Cool to room temperature for 2 ± 0.5 hr.
Cure at 60°C for 16 ± 1 hr. Heat compaction temperature for 2 hrs ± 10 min.
Compact
Store for 24 ± 3 hr. at room temperature
Evaluate and group
samples
Measure bulk specific gravity
Determine maximum theoretical specific gravity1
Determine air voids, discard sample if air voids are outside 7±1%
Select samples for testing as dry or conditioned such that the average air voids is approximately equal
Measure bulk specific gravity
Determine maximum theoretical specific gravity2
Determine air voids, discard sample if air voids are outside 7± 0.5%
Select samples for testing as dry or conditioned such that the average air voids is approximately equal
Sample conditioning Dry (control) samples -
Place in plastic bag
Place in water bath 25°C, 2 hrs. Conditioned Samples
Vacuum saturate (distilled water) 13-67 kPa for 5 - 10 min.
Remove vacuum, leave sample in water 5 - 10 min.
Measure bulk gravity of each sample
Compute degree of saturation, allowable range 55 to 80%, if less than 55% reapply vacuum saturation. If greater than 80% discard sample.
Freeze (optional)
Cover samples with plastic film
Place in plastic bag with 10mL water
Place in freezer at -18±3°C for 16 hrs. minimum
Place in 60±1°C water bath for 24±1 hr., remove plastic film
Place in 25±0.5°C water bath for 2 ± 1 hr.
Dry (control) samples -
Place in plastic bag
Place in water bath 25 ± 0.5°°°°C, 2 hrs. ± 10 min. Conditioned Samples
Vacuum saturate (potable water) 13-67 kPa for 5 - 10 min.
Remove vacuum, leave sample in water 5 - 10 min.
Measure bulk gravity of each sample
Compute degree of saturation, allowable range 70 to 80%, if less than 70% reapply vacuum saturation. If greater than 80% discard sample.
Freeze (Mandatory)
Cover samples with plastic film
Place in plastic bag with 10 ± 0.5 mL water
Place in freezer at -18±3°C for 16 hrs. minimum
Place in 60±1°C water bath for 24±1 hr., remove plastic film
Place in 25±0.5°C water bath for 2 hr. ± 10 min.
Test Measure indirect tensile strength, load rate 50 mm/min, loading strips
optional
Compute tensile strength ratio.
Measure indirect tensile strength, load rate 50 mm/min, loading strips
mandatory
Compute tensile strength ratio.
1 Curing procedure for samples used to determine maximum theoretical
specific gravity not specified.
2 Samples used for determining maximum theoretical specific gravity are
cured following procedures for the compacted samples.

18
testing of the conditioned samples was changed from ± 1 hour to ± 10
minutes.
• The test for the tensile strength in the 2003 method requires steel loading strips, which were optional in the 1989 method.
The results of AASHTO T 283 are expressed in terms of the tensile strength ratio,
TSR. This is the ratio of the average tensile strength of the conditioned samples divided
by the average tensile strength of the unconditioned samples. Due to the empirical nature
of the test, an acceptable level of TSR can only be determined by referencing the results
of the test versus field performance of the mixes. Conceptually, the verification of the
test limits should be performed whenever the test procedure is altered. Prior to
Superpave, there was not a national standard for the acceptance limits for determining
moisture damage.
Initially, the ASTM 4863 method, without the freeze-thaw cycle, used a 0.75 TSR
minimum acceptance value; this was later increased to 0.85. Lottman's original
recommendation of a minimum criterion of 0.7 was usually specified (Roberts, et al.,
1996). A minimum TSR criterion of 0.8 was adopted for Superpave mix design
AASHTO T 283 (AASHTO MP-2).
2.6 EVALUATION OF MOISTURE SUSCEPTIBILITY TESTS
There is an extensive quantity of literature concerning the evaluation of moisture
susceptibility of asphalt concrete. However, the empirical nature of the test method
limits the utility of research conducted using one of the variations on the current test
specification. The general consensus among the users of moisture damage tests is that
the test results are highly variable and validation with field performance is problematical
(Roberts, et al., 1996). Despite the recognized problems of AASHTO T 283, it was
considered the best available method for evaluating the moisture sensitivity of asphalt
concrete mixes. Since AASHTO T 283 was the recommended Superpave test, several
researchers have investigated the parameters of this test method and compared it to the
results of other methods. NCHRP funded a research program to specifically investigate
the test parameters of AASHTO T 283 with a goal of improving the reliability of the test
method to identify moisture susceptible mixtures (Epps, et al., 2000).
19
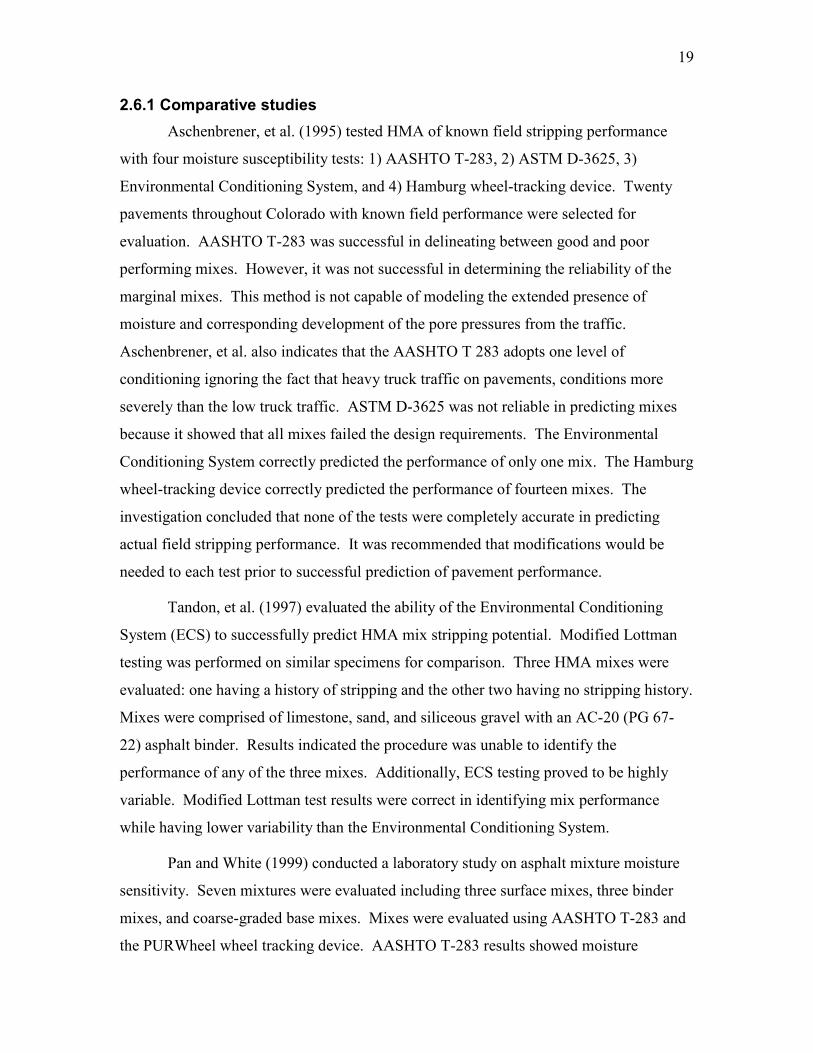
2.6.1 Comparative studies
Aschenbrener, et al. (1995) tested HMA of known field stripping performance
with four moisture susceptibility tests: 1) AASHTO T-283, 2) ASTM D-3625, 3)
Environmental Conditioning System, and 4) Hamburg wheel-tracking device. Twenty
pavements throughout Colorado with known field performance were selected for
evaluation. AASHTO T-283 was successful in delineating between good and poor
performing mixes. However, it was not successful in determining the reliability of the
marginal mixes. This method is not capable of modeling the extended presence of
moisture and corresponding development of the pore pressures from the traffic.
Aschenbrener, et al. also indicates that the AASHTO T 283 adopts one level of
conditioning ignoring the fact that heavy truck traffic on pavements, conditions more
severely than the low truck traffic. ASTM D-3625 was not reliable in predicting mixes
because it showed that all mixes failed the design requirements. The Environmental
Conditioning System correctly predicted the performance of only one mix. The Hamburg
wheel-tracking device correctly predicted the performance of fourteen mixes. The
investigation concluded that none of the tests were completely accurate in predicting
actual field stripping performance. It was recommended that modifications would be
needed to each test prior to successful prediction of pavement performance.
Tandon, et al. (1997) evaluated the ability of the Environmental Conditioning
System (ECS) to successfully predict HMA mix stripping potential. Modified Lottman
testing was performed on similar specimens for comparison. Three HMA mixes were
evaluated: one having a history of stripping and the other two having no stripping history.
Mixes were comprised of limestone, sand, and siliceous gravel with an AC-20 (PG 67-
22) asphalt binder. Results indicated the procedure was unable to identify the
performance of any of the three mixes. Additionally, ECS testing proved to be highly
variable. Modified Lottman test results were correct in identifying mix performance
while having lower variability than the Environmental Conditioning System.
Pan and White (1999) conducted a laboratory study on asphalt mixture moisture
sensitivity. Seven mixtures were evaluated including three surface mixes, three binder
mixes, and coarse-graded base mixes. Mixes were evaluated using AASHTO T-283 and
the PURWheel wheel tracking device. AASHTO T-283 results showed moisture

20
conditioning has a significant effect on the stripping potential of the mixes tested. That is,
the tensile strength of the mixtures was reduced after the environmental procedures in
AASHTO T 283 tests. PURWheel tracking device results indicated temperature and
moisture conditions significantly influence stripping severity. The authors suggested a
field study be performed to correlate laboratory results with field performance. Results
from AASHTO T283 tests for the Limestone, Slag and Dolomite mixtures showed that
the TSR of the three control mixtures were all below 80%. Test results also show that the
moisture susceptibility of the three mixtures can be improved to meet the Superpave mix
design criteria with the addition of anti-stripping agents. However, the results for the
limestone base mixes showed that TSR of the specimens after the addition of anti-
stripping agents were still below the minimum Superpave mix design criteria. In general,
comparison of the AASHTO T 283 TSR and PURWheel results indicate that the TSR
does not reflect a mixture’s stripping potential and the application of the 150mm
specimen for AASHTO T 283 test still needs further evaluation before modification of
the current test standards.
Hunter and Ksaibati (2002) evaluated how tensile strength was affected by freeze-
thaw conditioning and whether the Georgia Loaded Wheel Tester (GLWT) could be used
to predict moisture susceptibility. Eight asphalt mixtures were evaluated, including
granite and limestone aggregates and four asphalt-additive-aging combinations. Results
showed the GLWT was not effective in determining moisture susceptibility. Freeze-thaw
results showed lower tensile strengths for all conditioned mixes. Tensile strength of the
granite mixes decreased more rapidly than limestone mixes. It was recommended that a
testing procedure that includes specimen saturation be designed for the GLWT to be
effective in measuring moisture susceptibility.
Coplantz and Newcomb (1988) evaluated four variations of water sensitivity tests
as follows:
1) Vacuum saturation only
2) High vacuum saturation with single freeze-thaw cycle
3) Low vacuum saturation with single freeze-thaw cycle

21
4) Low vacuum saturation with several freeze-thaw cycles
Results indicated that mixes subjected to only vacuum saturation may not show evidence
of stripping potential. However, when mixes were subjected to freeze-thaw cycles plus a
vacuum saturation, stripping potential was shown. The number of freeze-thaw cycles
was directly related to stripping severity, with more freeze-thaw cycles yielding more
severe stripping. In addition to freeze-thaw cycles, saturation level influenced the
stripping potential, with higher levels of saturation yielding more stripping.
Mahoney and Stephens (1999) compared AASHTO T 283 results with the
Connecticut Department of Transportation Modified Test Method. They found that the
difference in the degree of saturation was probably the largest factor in the variation in
test results. Four of the five materials tested passed the ConnDOT version of T 283 while
failing the official AASHTO test. The largest difference in the two methods was the
computation of amount of water absorbed by the specimen. The official AASHTO
method states the amount of water absorbed into the specimen is calculated by
(VSSD SSD)
Water absorbedVolume of Voids
−= …...……………….................. (2.1)
While the ConnDOT version of AASHTO T 283 calculates the amount of water
absorbed by the specimen as:
(VSSD Dry Weight of Specimen)Water absorbed
Volume of Voids
−= …............................ (2.2)
Where: VSSD is the vacuum saturated surface dry mass
SSD is the saturated surface dry mass
The AASHTO procedure results in a higher degree of saturation as the water
required to achieve 55 to 80% saturation is in addition to the amount of water required to
reach the saturated surface dry condition. The modified ConnDOT method uses all of the
water absorbed by the specimen towards saturation of 55 to 80%. The researchers
suggest the increased volume of water in the AASHTO method may be causing the
specimen to be damaged excessively when it is frozen thus decreasing the TSR values.
Results showed that AASHTO T 283 was more severe than the Connecticut method. The

22
authors concluded that both tests have limitations in accurately predicting HMA stripping
potential (Mahoney and Stephens, 1999).
Choubane, et al. (2001) evaluated a section of Interstate 75 in Florida for stripping
potential by using AASHTO T 283. Six cores from six sites were obtained and tested for
TSR two years after construction. Results showed that TSR decreased more for 12.5 mm
mixes than 19.0 mm mixes. It was concluded that TSR difference between the two mixes
was primarily a function of specimen air void content. Choubane, et al. (2001) also
evaluated the effect of air void content and degree of saturation on TSR. Aggregates and
materials included granite, limestone, and reclaimed asphalt pavement. Asphalt binder
was an AC-30 (PG 67-22). Specimens were saturated to 55 and 80 percent. Results
showed TSR values decreased as the level of saturation increased. The following
recommendations were reported: 1) coarse-graded Superpave mixes should be saturated
to more than 90 percent and to include the freeze-thaw cycle when using AASHTO T
283, 2) a minimum TSR of 80 percent, 3) specimen air void content should be set to 7 ±
0.5 percent, and 4) a minimum requirement for wet indirect tensile strength should be 410
kPa (60 psi).
2.6.2 NCHRP Project 9-13
Given the combination of the concern about the AASHTO T 283 method and the
fact that the Superpave mix design method requires it, NCHRP Project 9-13 was
performed "to evaluate AASHTO T 283 and to recommend changes to make it
compatible with the Superpave system" (Epps, et al., 2000). The parameters studied
during this project include:
• Compaction method - Superpave, Marshall and Hveem
• Sample size - 150x95 mm for Superpave and 100x62 mm for Superpave,
Marshall and Hveem
• Aging method, loose material - none, 16 hrs. at 60°°°°C, 2 hrs. at 135°C, and 4 hrs. at 135°C
• Aging method, compacted samples - room temperature, 0 to 24 and 72 to 96
hrs.
• Degree of saturation - 55, 75, and 90 percent
• Conditioning methods - Dry (no conditioning), Saturation-No -Freeze-thaw ,
and Saturation-Freeze-thaw (one cycle)

23
• Type of test - indirect tensile and resilient modulus
• Type of aggregate - supplied from 5 states, included three limestone and two
alluvial aggregates, selected to represent a range of known moisture
sensitivity in field performance. The moisture sensitivity of the aggregates
were described as:
Texas and Alabama - not moisture sensitive
Colorado and Nevada - moderate to highly sensitive
Maryland - highly sensitive
The bolded levels in the above list identify the test method parameters which were
recommended for inclusion in the revised AASHTO T 283 method. Binder type was not
studied as a factor in the experiment. Binders were specific to each mix and included PG
58-28, 64-22, 64-28, and 70-22.
Comparison of the above list with the test method specifications in Table 2.2
demonstrates that many of the test parameters were evaluated during the research, but
several test parameters, such as test temperature and loading rate were not evaluated
during the experiment. However, the combination of factors and levels shown above is
excessive for a complete factorial experiment. Therefore, the research was divided into
four tasks to examine the different aspects of the test method.
• Task 1 - influence of resilient modulus test on tensile test results.
• Task 2 - effect of four sample compaction methods and sample size on water
sensitivity testing for fixed conditions of aging and conditioning.
• Task 3 - influence of two compaction methods on water sensitivity testing for
variable conditions of aging and conditioning.
• Task 4 - influence of two compaction methods on water sensitivity testing for
variable curing/aging and conditioning
Tasks 1 and 2 used aging and conditioning procedures which are different from
the current AASHTO T 283 procedure. Therefore, they are not germane to the current
research project and will not be discussed further.
The factorial for Tasks 3 and 4 is shown in Table 2.3. The “X” designation in the
Table 2.3 identifies the partial factorial experimental plan designed to accomplish the
objectives of Task 4. In this task the compaction method - sample size issue was limited
to two combinations, Superpave 150 mm samples and Marshall 100 mm samples. The

24
“E” designation in Table 2.3 indicates the additions made to allow for a complete
factorial on a portion of the study, Task 3. This portion of the study included all
combinations of the factors and levels for the test parameters, but was limited to a single
aggregate type, Nevada.
Table 2.3 NCHRP Project 9-13 experimental plan for tasks 3 and 4 (Epps, et al., 2000)
Two techniques were used to evaluate the results of the experiments, analysis of
variance, ANOVA, and pair wise comparisons. ANOVA's were performed for both the
partial factorial, which included five aggregate sources, but not all combinations of the
other factors and levels, and for the full factorial, which was limited to a single aggregate
source, but included all the combinations of factors and levels for the test parameters.
The ANOVA's were performed to evaluate the significance of the test parameters on all
tensile strength results and on the dry, saturated-no-freeze-thaw, and saturated-freeze-
thaw tensile strengths. Table 2.4 shows the ANOVA of the complete factorial, Task 3,

25
for the effect of the test parameters on tensile strength. The factor with the most
significant influence, based on the magnitude of the F statistic, on tensile strength was
sample conditioning. In addition, the main factors of loose mixture aging, compacted
mixture aging, compaction method and saturation level were significant. Several two and
three order interactions were also significant. The data were then segregated so
ANOVA's could be performed on the influence of the test specification parameters on the
tensile strength for each of the conditioning methods. Loose mixture aging and
compacted mixture aging was significant factors for all three types of tensile strength, but
the relative influence varied. Loose mixture aging was the most significant factor for the
dry tensile strength and the saturated-no-freeze-thaw tensile strength. Compacted
mixture aging was the most significant factor for the saturated-freeze-thaw tensile
strength. Compaction method and saturation level were significant main effects, but of
lesser influence than mixture aging.
Table 2.4 ANOVA for complete factorial NCHRP Project 9-13 (Epps, et al., 2000)

26
The partial factorial showed that aggregate source was the most influential factor
for all three tensile strength types. Loose and compacted aging were also significant in
the partial factorial but the relative influence varied depending on the type of
conditioning prior to measuring tensile strength.
All of the ANOVA's performed used tensile strength as the dependent variable.
Even though the results of AASHTO T 283 are expressed in terms of the tensile strength
ratio, average conditioned tensile strength to average unconditioned tensile strength, none
of the statistical analysis considered this variable.
The ANOVA was beneficial for evaluating overall trends in the data. However,
due to the experimental design and the fact that many of the two order and higher
interactions are significant, it was necessary to do pair wise comparisons of the data to
further understand the results of the experimental program. The following considers only
the results with respect to the adopted test method.
2.6.2.1 Loose mix aging
Loose mix aging was a significant factor on no conditioned, dry, tensile strength
for both the full and partial factorial ANOVA (Epps, et al., 2000). The pair-wise
comparison showed dry tensile strength increased in four cases, and was the same in
eight cases. However, when only considering 150 mm Superpave samples that were aged
for 0 to 24 hrs, parameters for the current AASHTO T 283 procedure, all three samples
had the same dry tensile strength.
The ANOVA of the partial and complete factorials also found loose mix aging
was also a significant factor on the tensile strength after saturation. The pair-wise
comparison indicated an increase in tensile strength with aging in 10 of 36 comparisons
and the authors cite this result as support for the conclusion that loose mix aging affects
tensile strength of the saturated samples. Of the 36 comparisons samples, half were
prepared with the Superpave gyratory compactor; seven of these samples showed a
higher strength. Of these samples, nine had the compacted aging procedure currently
recommended; only four showed an increase in tensile strength with aging. There were
only three possible comparisons of samples prepared to the current AASHTO T 283
procedure; in two cases the tensile strength increased and it was the same in one case.
27
The ANOVA of the partial and complete factorials also found loose mix aging
was also a significant factor on the tensile strength after saturation plus freeze-thaw. The
pair-wise comparison indicated an increase in tensile strength with aging in 3 of 36
comparisons and the authors cite this result as support for the conclusion that loose mix
aging affects tensile strength of the saturated plus freeze-thaw samples. Of the 36
comparison samples, half were prepared with the Superpave gyratory compactor; one of
these samples showed a higher strength, one showed a lower tensile strength and 16 had
the same tensile strength. Of these samples, nine had the compacted aging procedure
currently recommended; one showed a decrease in tensile strength and eight had the same
tensile strength. There were only three comparisons of samples prepared to the current
AASHTO T 283 procedure; all of these had the same tensile strength. There were no
pair-wise comparisons of the effect of loose mix aging on tensile strength ratio.
2.6.2.2 Compacted mix aging
Compacted mix aging was a significant factor on no conditioned, dry, tensile
strength for both the full and partial factorial ANOVA (Epps, et al., 2000). The pair-wise
comparison showed dry tensile strength decreased in one case, and was the same in seven
cases. When only considering 150 mm Superpave samples that were aged for 0 to 24 hrs,
parameters for the current AASHTO T 283 procedure, the only available comparison
indicated the dry tensile strength was not affected by compacted mix aging.
The ANOVA of the partial and complete factorials also found compacted mix
aging was also a significant factor on the tensile strength after saturation. The pair-wise
comparison indicated an increase in tensile strength with aging in 4 of 24 comparisons
and the authors cite this result as support for the conclusion that compacted mix aging
affects tensile strength of the saturated samples. Of the 24 comparisons samples, half
were prepared with the Superpave gyratory compactor; two of the 12 samples showed a
higher strength. Of these samples, three had the loose mix aging procedure currently
recommended; all of these samples had the same tensile strength.
The ANOVA of the partial and complete factorials also found compacted mix
aging was also a significant factor on the tensile strength after saturation plus freeze-
thaw. The pair-wise comparison indicated a decrease in tensile strength with aging in

28
three of 24 comparisons and the authors cite this result as support for the conclusion that
compacted mix aging "somewhat" affects tensile strength of the saturated plus freeze-
thaw samples. Of the 24 comparisons samples, half were prepared with the Superpave
gyratory compactor; three showed a lower tensile strength and nine had the same tensile
strength. Of these samples, three had the loose aging procedure currently recommended;
one showed a decrease in tensile strength and two had the same tensile strength. The
single comparison of samples prepared to the current AASHTO T 283 procedure had the
same tensile strength. There were no pair-wise comparisons of the effect of compacted
mix aging on tensile strength ratio.
2.6.2.3 Saturation
The ANOVA of the complete and partial factorial experiments indicated that
saturation level was a significant factor on the tensile strength of the saturated and
saturated with freeze-thaw samples (Epps, et al., 2000). Saturation level was the least
significant main factor in the experiment with the exception of the results for the partial
factorial analysis of freeze-thaw samples. For this condition, the only factor with a
greater significance was aggregate source.
There were 96 combinations of factors and levels that allowed pair-wise
comparisons of the effect of saturation level on tensile strength; the tensile strengths were
statistically the same in 94 of these combinations. The pair-wise comparison indicated an
increase in no freeze-thaw tensile strength with different levels of saturation (75% vs. 55
%) in one of 16 comparisons. When only considering 150 mm Superpave samples that
were aged for 0 to 24 hrs, parameters for the current AASHTO T 283 procedure, all three
samples had the same no freeze-thaw tensile strength. The pair-wise comparison of the
90% and 55% saturated samples indicated a decrease in no freeze-thaw tensile strength in
one of 16 comparisons. When considering only the 150mm Superpave samples, all
samples had the same no freeze-thaw tensile strength. For the samples saturated at 90%
and 75% levels, the no freeze-thaw tensile strength was same for all the 16 comparisons.
The pair-wise comparison indicated that the freeze-thaw tensile strength for the
samples subjected to different levels of saturation, 75% vs. 55%, was same for all 16
comparisons. Similarly, for the other two combinations of saturation levels (i) 90% vs.

29
55%, and (ii) 90% vs. 75% indicated that the freeze-thaw tensile strength was same for
all the 16 comparisons. However, based on partial factorial experiment, it was concluded
that saturation level was among the most important factors influencing the freeze-thaw
tensile strength of the samples.
2.6.2.4 Conditioning
The ANOVA for the complete factorial demonstrated that sampling conditioning,
no conditioning (dry), saturation, and saturation with freeze-thaw was the most
significant factor. Sampling conditioning was not included in the ANOVA's for the
partial factorial experiment.
The pair-wise statistical comparisons indicated that the saturated tensile strength
was lower than the dry tensile strength in 45 of 68 possible comparisons. Examination of
the 150 mm diameter samples compacted with the Superpave Gyratory Compactor
showed that the no freeze-thaw tensile strength is statistically same for 3 of 5 available
comparisons and in the remaining 2 comparisons it was lower than the dry tensile
strength. When the samples were examined based on the two compaction methods,
Gyratory and Marshall compaction, 33 of 48 comparisons showed a decrease in saturated
tensile strength compared to dry tensile strength. Of the 48 comparison samples, half
were prepared with the Superpave gyratory compactor; 17 of the 24 samples showed a
lower saturated tensile strength. Of these samples, six had the loose and compacted mix
aging procedure currently recommended; all of these samples showed a decrease in
saturated tensile strength.
The pair-wise statistical comparisons indicated that the saturated freeze-thaw
tensile strength was lower than the dry tensile strength in 52 of 68 possible comparisons.
Examination of the 150 mm diameter samples compacted with the Superpave Gyratory
Compactor showed that the saturated freeze-thaw tensile strength is statistically same for
3 of 5 available comparisons and in the remaining 2 comparisons it was lower than the
dry tensile strength. When the samples were examined based on the two compaction
methods, Gyratory and Marshall compaction, 39 of 48 comparisons show decrease in
saturated freeze-thaw tensile strength compared to dry tensile strength. Of the 48
comparison samples, half were prepared with the Superpave gyratory compactor; 20 of
30
the 24 samples showed a lower saturated freeze-thaw tensile strength. Of these samples,
six had the loose and compacted mix aging procedure currently recommended; all of
these samples showed a decrease in saturated freeze-thaw tensile strength.
In 56 of 68 possible comparisons, the strengths for the saturated versus saturated
freeze-thaw tensile strengths were the same. This comparison included all four
compaction methods. Examination of the 150 mm diameter samples compacted with the
Superpave Gyratory Compactor showed that all five available comparisons had equal
tensile strength, regardless of freeze-thaw conditioning.
2.6.2.5 Mixture source
Mixture source was not a factor in the complete factorial experiment. The
ANOVA of the partial factorial experiment found mixture source was the most
significant factor in the analysis. Mixture source is included in the experiment in order to
determine if the overall test method provides meaningful information about the moisture
susceptibility of the aggregates and to establish criteria or limits for interpreting the test
results. The positive results of the ANOVA of the partial experiment demonstrate the test
method is sensitive to mixture source. However, the pair-wise comparisons are needed
for the interpretation of the meaning of the ANOVA results. Epps, et al. (2000) report
the results of the evaluation of the test method with respect to mixture source as:
Results obtained in this study indicate that the
water sensitivities of the mixtures as described by
the state DOT's did not satisfactorily match the
observed behavior of the mixtures for a number of
the data groups in the study.
This conclusion was based on the following specific observations:
• The Maryland aggregates passes the tensile strength criteria based on most of the
factors considered in the experiment. However, the Maryland aggregates were
classified as water-sensitive base on field experience. Only the samples prepared
with the Hveem impact kneading compactor failed the 70 percent acceptance
criteria for both no freeze-thaw and freeze-thaw conditioning. In other words, the
single aggregate source used in the experiment to represent a moisture sensitive
aggregate was found to be not moisture sensitive.

31
• The Alabama and Texas aggregates were classified as not water-sensitive based
on field performance. However, the Texas mixture failed to reach 70 percent
tensile strength ratio for all conditions, and the Alabama mixture exceeded the 70
and 80 percent criteria only for the Marshall samples. So the two aggregate
sources included in the experiment to represent materials that are not moisture
sensitive were found to be moisture sensitive.
• The Nevada and Colorado mixtures were both described as moderately to highly
water-sensitive. The Colorado mixture did not exceed 70 percent for any
compaction or conditioning method, so use of an antistrip additive would be
recommended. The Nevada aggregate reached 70 percent tensile strength ratio
when samples were prepared with the gyratory 150 compactor. This aggregate
would need an antistrip admixture under the current limit of 80 percent TSR but
would not need an antistrip admixture under the previous limits.
Based on the results of this research, the authors made the following
recommendations relative to the test method:
• Loose mixture aging of 16 hours at 60°C
• Compacted mixture aging was not addressed in the recommendations section of
the report. A time of 0 to 24 hours at room temperature was included in their
proposed test method
• Saturation level was not addressed in the recommendations section of the report.
A range for the saturation level of 55 to 80 percent was included in their proposed
test method.
• Sample conditioning was recognized as not being important based on the results,
but saturation with freeze-thaw was recommended "to be conservative".
Comparison of these recommendations to the outline of the current test method
shown in Table 2.1 shows the following:
• The loose mixture aging recommendation was modified to include a variance on
of time of ± 1 hr.
• The compacted mixture aging was implemented as 24 ± 3 hrs.
• The saturation level was restricted to 70 to 80 percent.

32
• The saturation with freeze-thaw conditioning was implemented.
It should be noted that although Epps, et al. (2000) conducted an extensive
experiment, it was not possible to cover all of the steps and requirements that are
specified in AASHTO T 283. Examples of factors not considered in the experiment
include mixing and compaction temperature, time between mixing the sample and
starting to cure, and air void level.
The authors recommended that states should perform a structured research
program to evaluate the implementation of AASHTO T 283. Mixtures should be selected
so field performance can be correlated with laboratory test parameters.
2.7 TECHNIQUES FOR LIMITING STRIPPING
When subject to moisture, water-sensitive pavements may suffer accelerated
damage leading to a reduced pavement life. If asphalt pavement does suffer from water
sensitivity, serious distresses may occur. As a result, the asphalt pavement reduces in
performance and increases in maintenance costs. To alleviate or control this problem,
various liquid or solid anti-stripping additives have been developed, which can be used to
promote adhesion between asphalt and aggregate. Anderson and Dukatz, as cited by
Hunter and Ksaibati (2002), reviewed the effects of commercially available anti-stripping
additives on the physical properties of asphalt cement. Anderson and Dukatz’s
experimental studies of the physical and compositional properties of asphalt cement with
anti-stripping additives demonstrated that anti-stripping additives tend to soften asphalt,
reduce temperature susceptibility, and improve the aging characteristics of asphalt
cement. Also, Anderson and Dukatz stated that the effect of an anti-stripping additive is
asphalt specific (Hunter and Ksaibati, 2002).
2.7.1 Anti-stripping agents
The anti-stripping agents may be of two types: liquid and solid anti-stripping
agents. Anti-stripping agents may be necessary if a particular mix design has been shown
to be susceptible to moisture-induced damage. Liquid anti-stripping agents and lime
additives are among the most commonly used types of anti-stripping agents. However, if
an additive is used when it is not needed or if it is used incorrectly, adverse affects may

33
occur, including an increased economic cost and early maintenance and/or rehabilitation
(Hunter and Ksaibati, 2002).
2.7.1.1 Liquid anti-stripping agents
Liquid anti-strip additives have been used effectively and extensively in the
United States to reduce the moisture sensitivity of hot-mix asphalt materials. Liquid anti-
strip agents can affect the engineering properties of the asphalt binder and the
engineering properties of the hot mix asphalt mixture. The effectiveness of the liquid
anti-strip on the water sensitivity of the hot mix asphalt mixture depends on the
physicochemical properties of the asphalt binder and the aggregate, as well as on the
amount of liquid anti-strip agent used (TRB, 2003).
Liquid anti-stripping agents are chemical compounds that contain amines. Most
anti-stripping agents reduce surface tension between the asphalt and aggregate in a
mixture. When surface tension is reduced, increased adhesion of the asphalt to the
aggregate is promoted. Thus, most liquid anti-stripping agents are surface-active agents
(Hunter and Ksaibati, 2002). Aggregates have a natural affinity for water. As can be seen
in Figure 2.2(a), untreated aggregates are much more likely to be damaged by water
breaking the asphalt/aggregate bond. Figure 2.2(b) shows how liquid anti-stripping
additives allow the asphalt cement to create a strong bond between the asphalt and
aggregate which will help reduce the chance of moisture damage. It is important that the
liquid anti-stripping agent be heat stable. The simplest method of applying the liquid anti-
stripping additive is to mix it directly with the asphalt cement immediately before its
application onto the aggregate. This method is only partially effective because only a
small portion of the additive comes into contact with the aggregates (Ksaibati and
Conner, 2004).
Liquid amines and liquid phosphate ester are the two types of anti-strip additives
used in HMA. Unlike the application of the hydrated lime, the liquid additives can be
mixed with large amounts of asphalt and stored for use before mixing. These advantages
save time and money by using less material and not affecting the production process
greatly. A disadvantage of the liquid surfactants is possible heat degradation. If the

34
Figure 2.2 Effect of anti-strip agent on surface bonding of aggregate and asphalt (a)
untreated (b) treated (Ksaibati and Conner 2004)
asphalt mixture is held at high temperature for long periods of time, the effectiveness
may be reduced. Also, the anti-strip additive has to be added uniformly and mixed
consistently throughout the asphalt cement (Tayebali, et al., 2003).
The properties of the combined asphalt binder and liquid anti-strip agent depend
on the chemistry of the asphalt binder, the chemistry of the liquid anti-strip, the
concentration level of the liquid anti-strip, and the types of carrier or dispersant used with
the liquid anti-strip, among other factors. The combined binder and liquid anti-strip
properties can also depend on the time and temperature of storage of the asphalt binder–
liquid anti-strip material (TRB, 2003).
Some of the liquid anti-strip agents use oil-type carriers or dispersants. These
dispersants can change the physical properties of the asphalt binders. So they are said to
low performance liquid anti-strip agents. High-performance liquid anti-strip agents
contain very little dispersants. Testing of liquid anti-strip agents was performed with
additives containing diesel oil. The degree of aging of an asphalt binder may also be
altered by the presence of liquid anti-strip agents. The viscosity at 140° F of the aged
asphalts with liquid anti-strip may be lower than that of the control asphalt binder, but the
ratio of its viscosity increase (treated sample viscosity after aging to viscosity of treated
sample before aging) may be larger. The penetration of the asphalt cement can also be
affected by the presence of a liquid anti-strip agent. The magnitude of the penetration
change depends on the type of additive, additive concentration, and type and source of
(a) (b)
35
the asphalt binder. In addition, when high-performance liquids are used, they may exhibit
little or no change when measured for SHRP asphalt binder properties (TRB, 2003).
2.7.1.2 Lime anti-stripping agents
The anti-stripping mechanism of lime additives is not well understood. However,
lime additives are an accepted method of minimizing moisture susceptibility of a mix. If
an aggregate has more fines present, it may be necessary to use more lime additive due to
the increased surface area of the aggregate (Hunter and Ksaibati, 2002).
Lime is available in several forms, including high-calcium quick lime, dolomitic
quick lime, high-calcium hydrated lime, normal hydrated dolomitic quick lime, and
pressure hydrated dolomitic quick lime. Both hydrated lime Ca(OH)2 and quick lime
(CaO) are effective at preventing stripping in HMA mixes, although the former is most
commonly used. Dolomitic limes have also been used as antistripping additives.
However, as a carbonate CaC03 lime is not as effective (Ksaibati and Conner, 2004).
The common hydrated lime is actually a dry powder, and is added to the
aggregate before mixing with the asphalt cement. The main drawback of the application
method that hydrated lime requires is that it is difficult to retain an adequate surface
coating of lime on the aggregate. Hydrated Lime can also be added to undried aggregate
with water content from 3-5 percent. The addition of lime in this manner does, however,
reduce HMA production capabilities because additional water needs to be added to
prepare the lime and aggregate slurry (Ksaibati and Conner, 2004).
Research has indicated that the amount of hydrated lime needed to improve the
moisture sensitivity of hot-mix asphalt is of the order of 1% to 2% by dry weight of
aggregate. Some mixtures may require lime contents as high as 2.5% to achieve the
desired results (TRB, 2003).
Researchers observed that the addition of hydrated lime to asphalt mixtures
improved the adhesive bond between the aggregate and bitumen, substantially reducing
the occurrence of stripping. Further research identified chemical reactions that occurred
between lime and many bitumens that reduced their affinity for water, in turn reducing
the mixture’s tendencies to strip. In addition, when aggregates are coated with clays,

36
hydrated lime can react pozzolanically to remove the deleterious materials that would
otherwise damage the mixture (TRB, 2003).
Hydrated lime helps to mitigate moisture sensitivity of asphalt mixes in
mechanical ways as well as chemical. As an extremely fine, active filler
(characteristically 50% smaller than 10 µm), the hydrated lime helps to stiffen the
mixture, often increasing the PG rating of the binder by a full grade with the addition of
only 1% lime by weight of the aggregate. By stiffening the mix, the lime increases its
resistance to rutting and fatigue cracking, reducing the ability of water to enter the
system. In other words, when hydrated lime reacts chemically with bitumens, it often
both eliminates components that facilitate the progression of water through the mix and
removes compounds that contribute to oxidative aging (TRB, 2003).
2.7.1.3 Effect of anti-stripping additives
Maupin (1999) evaluated anti-stripping agent effectiveness in preventing HMA
pavement stripping. Twelve pavements with known field stripping performance were
evaluated. Anti-stripping agents included hydrated lime and nine chemical additives.
Pavement cores from in service pavements were evaluated using the Root-Tunnicliff test
method and by visual examination. Visual examination indicated that eight of the nine
projects with chemical additives showed moderate to moderate-severe stripping of coarse
aggregate. Six of the nine projects with chemical additives showed moderate to
moderate-severe stripping of fine aggregate. Three projects with hydrated lime showed
no stripping in the fine or coarse aggregate. Root-Tunnicliff test results indicated only
one of twelve projects showed stripping potential. Results from both test methods
indicated hydrated lime to be more successful than chemical additives in preventing
HMA pavement stripping.
Pan and White (1999) conducted a laboratory study on asphalt mixture moisture
sensitivity. Results from AASHTO T 283 tests indicate that moisture conditioning has a
significant effect on the stripping potential of the seven mixes tested. That is, the tensile
strength of the mixtures was reduced after the environmental procedures in AASHTO
T 283 tests. Comparison of the results for the two anti-stripping agents based on TSR
indicates that hydrated lime is more effective than the liquid chemical anti-stripping

37
agent. Hydrated lime produces a slightly higher tensile strength for the mixtures before
and after moisture conditioning. The liquid chemical anti-stripping agent increased the
tensile strength for the mixtures after moisture conditioning. In some instances it also
reduced the tensile strength for the mixture before moisture conditioning. Currently
mixture stripping potential in the Superpave system is evaluated with AASHTO T283
and adopts a minimum TSR of 80% as design criteria. The reduction of the dry indirect
tensile strength by the anti-stripping agent should be considered as a negative modifier
effect.
Sebaaly, et al. (2003) evaluated the effectiveness of three different anti-stripping
additives: Lime, UP5000 and a liquid additive. In general, the control, the UP5000, and
the liquid anti-strip mixtures had the unconditioned strength properties which are similar
to the lime treated mixtures. However, when these mixtures were moisture conditioned,
their strength fell significantly below the conditioned properties of the lime treated
mixtures. The evaluation of in service sections near Brookings, SD indicated that lime is
more effective than the liquid anti-strip especially under multiple freeze-thaw cycling
which represents the actual field conditions.
Kanitpong and Bahia (2003) evaluated the effect of anti-stripping additives on
asphalt mixtures. Based on the results and analysis of the study, anti-stripping additives
were not found to change the rheological properties of asphalt binders, and to improve
the rutting and fatigue behavior of asphalt binder as measured by the Dynamic Shear
Rheometer (DSR). However, both liquid and lime anti-strip additives were found to
increase the adhesion of asphalt binder to selected mineral surfaces, especially when the
binder bond is exposed to water. Cost estimation of the pavement with anti-stripping
additives is very similar to the cost of the pavement without anti-stripping additives when
taking into consideration the cost of maintenance every 5 to 6 years of the pavement
service life.
Ksaibati and Conner (2004) performed laboratory tests and evaluated the effects
of the addition of bottom ash into HMA mixes, testing specimens for tensile strength, and
susceptibility to rutting. The data collected in this study showed that, in the absence of
lime additive, HMA mixes prepared with granite aggregate reached failure faster than

38
those mixes prepared with limestone aggregate. Also multiple freeze-thaw cycling
typically showed a rapid strength decrease between the zero cycle (unconditioned
specimens) and one freeze-thaw cycle for plant mix specimens of 4in. diameter.
2.7.2 Aggregate pre-treatment
Different pre-treatments have been shown to improve the adhesion between
asphalt and aggregate. Examples of pretreatment include: heating of aggregate to remove
any excess moisture, weathering, washing to remove very fine dust, and crushing. It also
has been shown that aggregates pre-coated with asphalt or recycled materials are better at
resisting moisture damage than are virgin materials (Hunter and Ksaibati, 2002).
2.8 IDENTIFICATION OF MOISTURE DAMAGE IN THE FIELD
Researchers are aware of the need to develop an investigative methodology to
identify the moisture damage problem in specific pavement sections. The most
commonly recommended procedure is taking cores and splitting them apart to visually
evaluate the stripping of asphalt from aggregates. This procedure is arbitrary and could
be uneconomical. Also, conclusions based on pavement distresses such as raveling,
flushing and rutting could also be erroneous since these distresses could be caused by
factors other than stripping. The literature review conducted for this research task
identified three procedures that show promise.
2.8.1 Maupin’s procedure
This procedure uses the development of a deterioration curve of the pavement
layer based on the in-situ, remolded, and conditioned tensile strength of the mix (Maupin,
1999). It is based on the concept that as the pavement ages, the stiffness of the mix,
(measured with the indirect tensile strength test) increases primarily due to age
hardening. If the pavement is affected by moisture damage, the strength of the mix drops
after the initial peak as shown in curve 2 on Figure 2.3. To evaluate the present and
future strengths of the mix, cores need to be tested for the following conditions:
In-situ strength: Cores taken from the pavement are to be tested for tensile
strength directly after removal and as soon as practical.
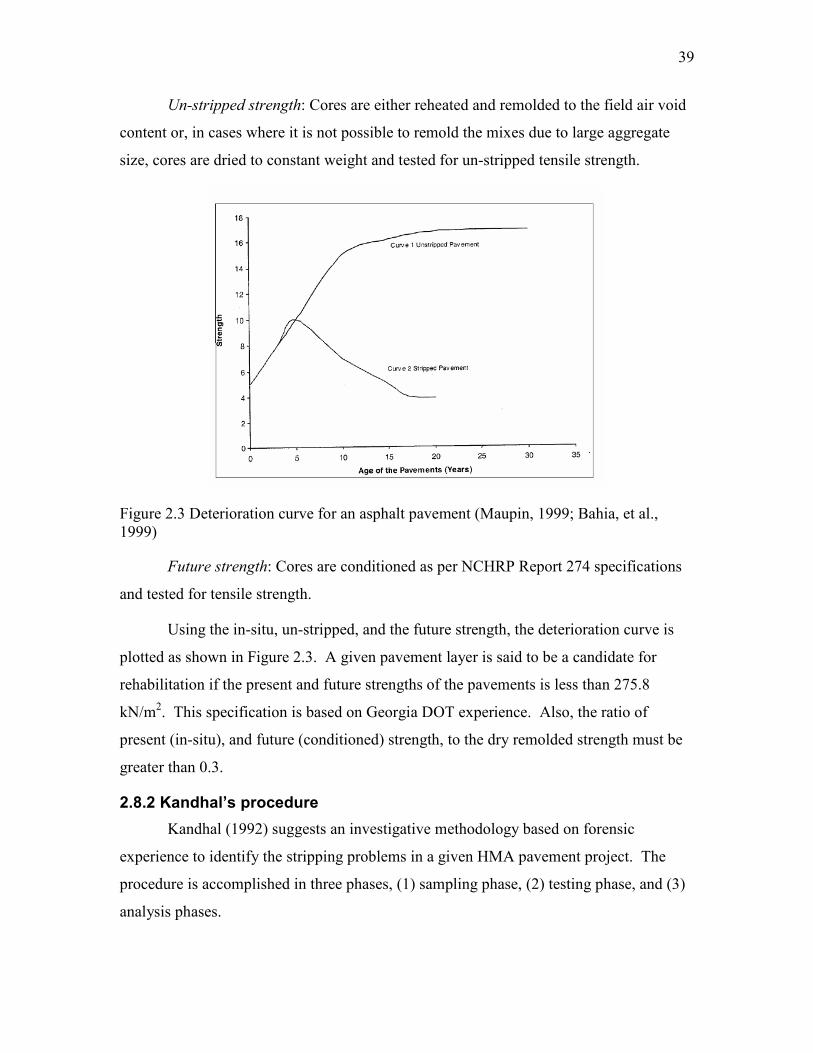
39
Un-stripped strength: Cores are either reheated and remolded to the field air void
content or, in cases where it is not possible to remold the mixes due to large aggregate
size, cores are dried to constant weight and tested for un-stripped tensile strength.
Figure 2.3 Deterioration curve for an asphalt pavement (Maupin, 1999; Bahia, et al.,
1999)
Future strength: Cores are conditioned as per NCHRP Report 274 specifications
and tested for tensile strength.
Using the in-situ, un-stripped, and the future strength, the deterioration curve is
plotted as shown in Figure 2.3. A given pavement layer is said to be a candidate for
rehabilitation if the present and future strengths of the pavements is less than 275.8
kN/m2. This specification is based on Georgia DOT experience. Also, the ratio of
present (in-situ), and future (conditioned) strength, to the dry remolded strength must be
greater than 0.3.
2.8.2 Kandhal’s procedure
Kandhal (1992) suggests an investigative methodology based on forensic
experience to identify the stripping problems in a given HMA pavement project. The
procedure is accomplished in three phases, (1) sampling phase, (2) testing phase, and (3)
analysis phases.

40
2.8.2.1 Sampling
Pavement sections of 500 ft are selected to record the distresses. At least seven
cores of 4-inch diameter are obtained at random locations. If it is a 4-lane highway, cores
from the inside wheel track of slow traffic (outside) lane is obtained. If it is a 2-lane
highway, cores from the outside wheel track of the lane is obtained. It is necessary to drill
these cores without using water as a coolant so that the in-situ moisture contents can be
determined. Cores should be sealed in air-tight containers for determining the in-situ
moisture content in the laboratory later. If dry coring cannot be done, then additional
pavement layer samples should be obtained adjacent to the wet coring sites using a jack
hammer. The HMA chunk samples loosened by the jack hammer from each layer should
also be sealed in air-tight containers so that the in-situ moisture content can be
determined in the laboratory later.
2.8.2.2 Testing
The in-situ moisture content should be determined by weighing the cores before
and after drying to constant weight. The thickness of core is measured. The cores are
observed for the evidence of stripping. The HMA layers are separated from the cores and
average thickness of each layer is measured. The bulk specific gravity is determined by
AASHTO T 166. The indirect tensile strength is determined using AASHTO T283 or
ASTM D 4867. The split exposed surfaces of the tested core are examined for stripping.
A visual rating of stripping on the exposed surface should be made and documented. The
procedure, however, does require some training for consistent interpretation of
observations. After cores have been rated, the maximum theoretical specific gravity is
determined by AASHTO T209. The extraction test (AASHTO T164) and gradation of
extracted aggregate (AASHTO T30) is done to determine the mix composition (asphalt
content and gradation).
2.8.2.3 Calculations and tabulation
The effective specific gravity of aggregates should be calculated using their
maximum theoretical specific gravity values and their respective asphalt content values.
The average effective specific gravity of the aggregate is calculated from these three
values. The maximum theoretical specific gravity is calculated using this average
41
effective specific gravity and their respective asphalt contents obtained by extraction. The
air void content and saturation level is calculated for each core.
The calculated and observed data are tabulated separately for “good” and
“distressed” areas. The mean, standard deviation, and 95 percent confidence limits for
each parameter are calculated. These values are compared to identify the differences.
The air void content and saturation level for each core was determined. The process
involved measuring the maximum theoretical specific gravity and asphalt content of three
samples per project. The effective specific gravity of the aggregate Gse, was then
computed. The average Gse for the three samples was assumed to apply to all samples for
a project. Then, using the asphalt content from the extraction test for each core and Gse,
the maximum theoretical specific gravity for the core was computed. This was used with
the bulk specific gravity of the core to determine the air voids of the core. The moisture
content of the core was then used to compute the level of saturation.
2.8.3 Tunnicliff and Root’s procedure
The Tunnicliff and Root procedure was developed as a part of NCHRP Report
373 on the field evaluation of anti-stripping additives in asphalt concrete mixtures (Bahia,
et al., 1999). To evaluate the performance of the anti-stripping additives over a period of
time, the researchers suggested a procedure that involves taking field cores from the
pavement periodically and testing them for tensile strength under varying conditions.
2.9 CHAPTER SUMMARY
Stripping is a serious problem for many highway agencies. Over the years, many
testing procedures have been developed to evaluate moisture susceptibility of HMA
mixtures. Two types of testing have been developed: strength and subjective. Of the
strength tests, those that use TSR data have been widely tested and accepted. More
specifically, the AASHTO T 283 method is recommended as part of the Superpave mix
design method.
Although several separate mechanisms have been identified to explain the process
of moisture damage in asphalt pavements, it is more likely that most asphalt pavements
suffer moisture damage as a result of a synergy of several processes. Researchers point
out that certain polar asphalt compounds develop more tenacious and moisture-resistant

42
bonds with the aggregate surface than others and that the development of the more
tenacious and long-lasting bonds can be promoted by treatment of the asphalt mixtures
with additives. Favorable chemical bonding between asphalt and aggregate alone will
not optimize the adhesive bond and minimize moisture damage. The bond is part
physical, and, therefore, the asphalt must be able to wet and permeate the aggregate
surface. This process is dependent on asphalt rheology at mixing temperatures and the
nature of the aggregate surface, pore size, pore shape, and aggregate mineralogy.
The complexity of the stripping process has inhibited the development of a
fundamental test method. All current methods for testing the moisture susceptibility are
empirically based. Although AASHTO T 283 is the recommended procedure it cannot be
conclusively stated that this method is reliable for determining the moisture susceptibility
of asphalt concrete. Aschenbrener, et al. (1995) criticizes the method for not being
capable of modeling the extended presence of moisture and corresponding development
of the pore pressures from the traffic. Several authors have presented conflicting results
concerning the test method specifications. Hunter and Ksaibati (2002) and Coplantz and
Newcomb (1988) concluded freeze-thaw conditioned sample results showed lower tensile
strengths than samples which were only saturated. Epps, et al. (2000) recommended the
use of saturation plus freeze-thaw conditioning even thought their test results were
inconclusive concerning conditioning methods. Mahoney and Stephens (1999)
recommended changes in the method for computing the degree of saturation, but Epps, et
al.'s data (2000) showed level of saturation was not an important factor. Choubane, et al.
(2001) suggested the degree of saturation should be greater for coarse mixes than for fine
mixes. Choubane, et al. (2001) also recommended a minimum requirement for wet
indirect tensile strength should be 410 kPa (60 psi). Both Pan and White (1999) and
Epps, et al. (2000) recommended field performance studies as part of the implementation
of a moisture sensitivity test requirement for the mix design process. Several authors
have presented methods to perform field studies to identify stripping problems.
Laboratory and field studies indicate lime is an effective antistrip measure.
Liquid anti-strip agents are not as effective as lime and there is some researchers have
found no benefit of using liquid anti-strip agents (Maupin, et al., 1999).

43
CHAPTER 3: EXPERIMENTAL DESIGN AND TESTING PROCEDURES
3.1 INTRODUCTION
As shown in Table 2.2 the moisture sensitivity test, AASHTO T 283 was changed
significantly between the 1989 and the 2003 versions. The change which was anticipated
to cause the greatest impact on mix designs in West Virginia was making the freeze-thaw
cycle mandatory in the 2003 version. The modifications to AASHTO T 283 were found
primarily on the results of NCHRP Project 9-13 (Epps, et al., 2000). In the report for this
project it was recommended that all states conduct a structured research program to
evaluate the implementation of the moisture sensitivity test. The research reported herein
is a preliminary investigation of using AASHTO T 283 as part of the Superpave mix
design procedure.
This research focused on the issue of including a freeze-thaw cycle in the
conditioning of samples evaluated for moisture sensitivity. The methods and procedures
prescribed in the 2003 version of AASHTO T 283 were followed with the exception that
some of the samples were only conditioned by saturation rather than by saturation and
freeze-thaw.
3.2 EXPERIMENTAL DESIGN AND TEST MATERIALS
The evaluation of moisture sensitivity was performed on three mixes. Superpave
9.5mm mixes from J.F. Allen and New Enterprise were evaluated. A 19mm Superpave
mix from Carl Kelly was tested. All aggregates were crushed limestone. The gradation
of each mix is shown in Figure 3.1 to 3.3. The aggregates obtained from the suppliers
were air dried and sieved using the following set of sieves: 37.5 mm, 25 mm, 19 mm,
12.5 mm, 9.5 mm, 4.75 mm, 2.36 mm, 1.18 mm, 0.6 mm, 0.3 mm and 0.075 mm. All
aggregates were washed to take off the fines, oven dried and stored in bins. The physical
characteristics of each type of aggregate were obtained from suppliers. All mixes were
prepared with a PG 70-22 from Marathon Ashland Petroleum LLC. The mixing and
compaction temperature ranges were supplied by the manufacturers as 159 to 165°C and
148 to 153°C, respectively. The maximum mixing temperature of 165°C and the

44
maximum compaction temperature of 153°C were selected for the experiment. This is a
typical binder used for Superpave mixes in West Virginia.
The effect of using a liquid anti-strip was tested for each mix. The liquid anti-
strip was provided by New Enterprise. Liquid anti-stripping additive weighing 0.2 to 0.5
percent by binder weight is added to the mix.
Gradation
0
10
20
30
40
50
60
70
80
90
100
Sieve Size
Percent Passing
50
37.5
19 25
12.5
9.5
4.75
2.36
1.18
0.6
0.075
0.3
Figure 3.1 Gradation for 9.5mm limestone aggregates from J.F. Allen source

45
Gradation
0
10
20
30
40
50
60
70
80
90
100
Sieve Size
Percent Passing
50
37.
25
19
12.
9.
4.75
2.3
1.18
0.3
0.6
0.075
Figure 3.2 Gradation for 9.5mm limestone aggregates from New Enterprise source
Gradation
0
10
20
30
40
50
60
70
80
90
100
Sieve Size
Percent Passing
50
37.525
12.59.5
4.75
2.36
1.18
0.6
0.3
0.075
19
Figure 3.3 Gradation for 19mm limestone aggregates from Carl Kelly source

46
3.2.1 Verification of mix design
Before testing for moisture sensitivity, each mix design was reviewed and
verified. The complete mix design package was obtained from the WVDOH. Bulk
specific gravity and maximum theoretical gravity were determined using the approximate
standard test methods. The verification demonstrated the mixes could be reproduced in
the WVU Asphalt Technology Laboratory.
The pills compacted to 100 gyrations were used to verify the mix designs. After
compaction, samples were allowed to cool. Weight in air, weight in water and saturated
surface dry weight were taken to compute the bulk specific gravity of the mix (AASHTO
T166). Using the following set of equations, the maximum theoretical specific gravity
and the bulk specific gravity of the mix, the volumetric properties of the asphalt mix were
evaluated.
,%mb
mm Ndes
mm
GG
G==== ……………………………………………………………...(3.5)
1
1
bse
b
mm b
PG
P
G G
−−−−====
−−−− ………………………………………………………………..(3.6)
(((( ))))100
se sbba b
sb se
G GP G
G G
−−−−====
………………………………………………….…...(3.7)
(((( ))))1be b ba bP P P P= − −= − −= − −= − − ………………………………………………………....(3.8)
# 200%
100
be
P
d
B P==== ………………………………………………………………... (3.9)
1 100mb
mm
GVTM
G
= −
……………………………………………………….. (3.10)
(((( ))))1100 1
mb b
sb
G PVMA
G
−−−−= −= −= −= −
………………………………………………. (3.11)
47
100VMA VTM
VFAVMA
−−−− ====
………………………………………………….. (3.12)
Where,
%Gmm,Ndes = Percent of maximum specific gravity at design number of revolutions;
Gmb = Bulk specific gravity;
Gmm = Maximum specific gravity;
Gse = Effective specific gravity of aggregate;
Pb = Percent binder;
Gb = Specific gravity of the binder;
Pba = Percent binder absorbed;
Gsb = Bulk specific gravity of aggregate;
Pbe = Effective percent binder;
%P#200 = Percent of the aggregate blend passing the #200 sieve;
%Gmm,Nini = Percent of maximum specific gravity at initial number of revolutions;
Hdes = Height at the design number of revolutions;
Hini = Height at the initial number of revolutions;
VTM = Air voids in compacted mixture;
VMA = Volume of voids in mineral aggregates; and
VFA = Voids filled with asphalt
3.2.2 Moisture sensitivity testing
Once the mix designs were verified, samples were prepared for the moisture
sensitivity testing. The flow of activities was summarized in Figure 3.4. Table 3.1 shows
the time schedule of the test procedure of AASHTO T 283 used in the asphalt concrete
laboratory in West Virginia University. Each set of moisture sensitivity samples required
sufficient material to make nine compaction samples plus a sample for measuring the
maximum theoretical specific gravity. Two additional compaction samples were
prepared and held in reserve for use as needed. The aggregate and asphalt were heated to
the upper temperature of the recommended range for compaction. A pre-weighed
quantity of aggregate was placed in the bucket mixer and the required amount of asphalt
was weighed in. The samples were mixed in four batches. Three batches contained
sufficient material for compacting three samples. For one batch per mix, the quantity of

48
material was sufficient for making two compaction samples plus one maximum
theoretical specific gravity sample.
Figure 3.4 Flow chart for the AASHTO T 283 test method
Sample Preparation
Loose Mix Aging:
16 hrs. at 60°C and 2 hrs at compaction temperature
Sample Compaction
Superpave Gyratory
Compactor 150x95mm
samples by AASHTO T
245
Compacted Mix Aging:
24±3 hr. at room
temperature
Bulk Specific
Gravities
AASHTO T 166
Theoretical
Maximum Specific
Gravities
AASHTO T 209
Determine Air
Void Content by
AASHTO T 269
Determine
Specimen
Thickness (D
3549) and
Diameter
No Conditioning
(Dry) Vacuum
saturation
No Freeze-thaw
Vacuum
saturation
Freeze-thaw
Grouping of
specimens into
subsets
Determine Indirect
Tensile Strength
(IDT)

49
Table 3.1 Time schedule for test procedure of AASHTO T 283
3
4
5
8
9
10
11
12
1
2
3
4
5
6
8
9
10
11
12
1
2
3
4
5
6
8
9
10
11
12
1
2
3
4
5
6
8
9
10
11
12
1
2
3
4
5
6
Day
Time
F
Freeze
M
T
W
R
VacST VacWB
140F
WB
77F
CF
WB
77FSTST
WB
77F
WB
140F
Gmb UC C wo/FMix, cool Oven 140FOven 153C Compact
UC-Unconditioned; C wo/F-Conditioned without Freezing (saturation only);
CF-Conditioned with Freezing; WB-Water Bath; ST-specimens Tested for IDT;
Vac-Vacuum saturation.
The J.F. Allen mix was also used to check the sensitivity of TSR to saturation
level. Samples were prepared with saturation conditioning of 60% which meets the 1989
requirement of 55 to 80 percent. The IDT of these samples were used to compute TSR.
The results obtained from these samples were compared to the results of samples
prepared to the 2003 requirement of 70 to 80 percent saturation.

50
3.2.1 Loose mix aging and compacted mix aging
Once the samples were mixed, the AASHTO T 283 loose mix aging procedure
was followed. The batches were quartered to achieve the required weight for three
compacted samples. One batch per mix had sufficient remaining material for
determining the maximum theoretical specific gravity.
The loose mix aging process consisted of allowing the mix to cool to room
temperature for two hours. The mix was then placed in the oven for 16 ±1 hour at 60°C.
The samples were then transferred to an oven at the compaction temperature and allowed
to remain for two hours. The samples used for determining maximum theoretical specific
gravity were allowed to cool to room temperature and the AASHTO T 209 method was
followed to determine the maximum theoretical specific gravity. The materials for
compaction samples were transferred to a pre-heated mold and compacted to the required
height. After compaction, the samples were slowly extruded from the mold and allowed
to cool at room temperature for 24±3 hours. The thickness, diameter and bulk specific
gravity (AASHTO T 166) were determined.
3.2.2 Sample selection
The void in the total mix, VTM, was determined for each sample. Samples with a
VTM outside 7±0.5 percent were rejected. Three samples were then selected for each of
the conditioning level. The samples were selected such that the average air void content
of the each group of the each groups of samples was as close as possible.
3.2.2.1 Unconditioned samples
After the specimens are grouped, the unconditioned (dry) sample was placed in a
heavy-duty leak-proof plastic bag. The specimens were then placed in a 25±0.5°C
(77±1°F) water bath for 2hours ± 10 minutes. The specimens were removed from water
bath and the indirect-tensile strength was measured. Figure 3.5 shows a sample subjected
to dry conditioning.

51
Figure 3.5 Sample subjected to dry conditioning
3.2.2.2 Subset conditioned with saturation only
The second subset consisted of conditioned with saturated only samples. Each
sample selected for saturation conditioning only was placed in a vacuum container filled
with potable water at room temperature. The sample was vacuum saturated at 13 to
67 kPa absolute pressure (10 to 26 in. Hg partial pressure) for approximately 5 to 10
minutes. The vacuum apparatus is shown in Figure 3.6. The vacuum was removed and
the specimen was allowed to submerge in water without any disturbance for a short time
of 5 to 10 minutes. The degree of saturation was determined for the specimens. If the
degree of saturation was greater than the 80 percent, the specimens were discarded. If the
degree of saturation was less than 70 percent, then specimens were subjected to vacuum
saturation again until the 70 percent saturation was attained. For the sample set used to
evaluate the effect of saturation, the process was same except the target saturation level
was 60 percent. The degree of saturation (S') was determined as:
''
a
100JS
V= ………………............................................. (3.1)
where:
S' = degree of saturation, percent
J' = volume of absorbed water, cubic centimeters
Va = volume of air voids
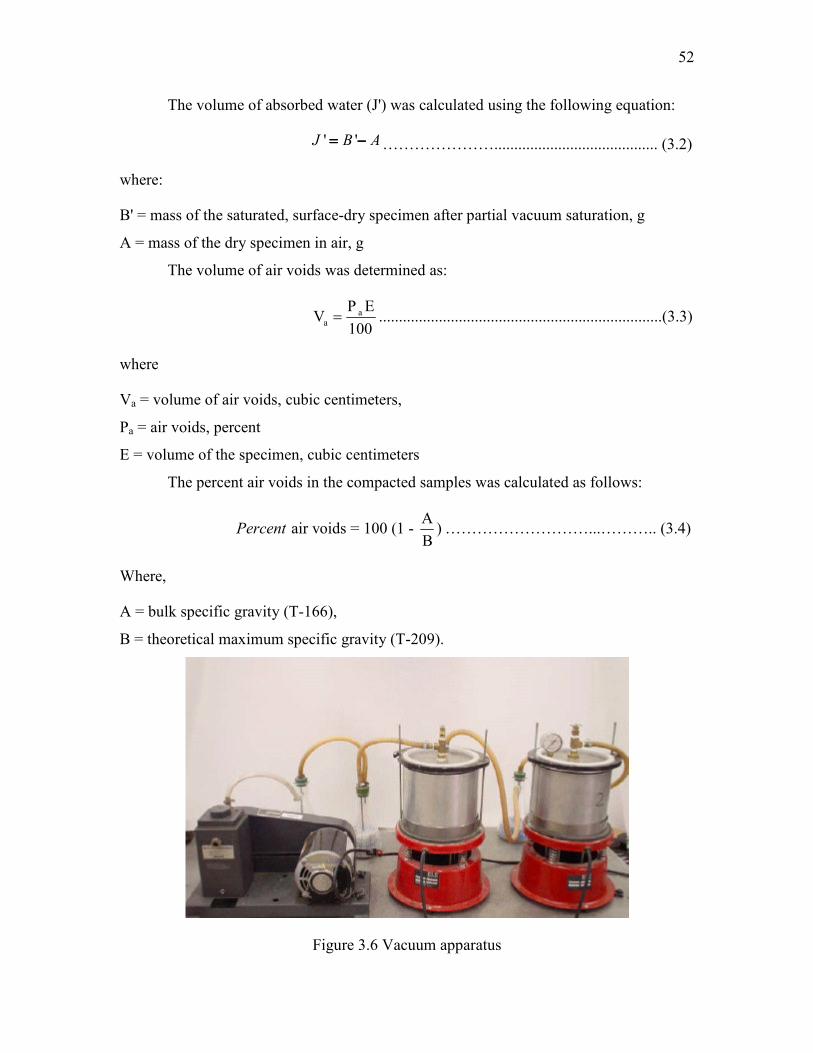
52
The volume of absorbed water (J') was calculated using the following equation:
' 'J B A= −= −= −= − …………………......................................... (3.2)
where:
B' = mass of the saturated, surface-dry specimen after partial vacuum saturation, g
A = mass of the dry specimen in air, g
The volume of air voids was determined as:
aa
P EV
100= .......................................................................(3.3)
where
Va = volume of air voids, cubic centimeters,
Pa = air voids, percent
E = volume of the specimen, cubic centimeters
The percent air voids in the compacted samples was calculated as follows:
A air voids = 100 (1 - )
BPercent ………………………...……….. (3.4)
Where,
A = bulk specific gravity (T-166),
B = theoretical maximum specific gravity (T-209).
Figure 3.6 Vacuum apparatus

53
After vacuum saturation, specimens were placed in a water bath at 60±1°C
(140±2°F) for 24 ± 1 hour. The specimens were then placed in another water bath at
25±0.5°C (77±1°F) for 2 hours ± 10 min. The specimens were removed from the water
bath, and the thickness (t') was determined by D3549 method. After the thickness was
measured, specimens were tested for indirect tensile strength in the Marshall stability and
flow machine. The tensile strength ratio (TSR) was calculated by dividing the average
ITS of the conditioned saturated only subset by the average ITS of the unconditioned
subset.
3.2.2.3 Subset conditioned with saturation plus freeze-thaw cycle
The third subset was subjected to vacuum saturation followed by the freeze-thaw
cycle, and then tested for IDT. The vacuum saturation process was the same as described
for conditioned saturation only samples. After vacuum saturation each specimen was
wrapped in Saran wrap, placed in a zip-lock bag and 10±0.5 mL water was added before
the freeze-thaw cycle was performed. The specimens were kept in the freezer at a
temperature of -18±3°C (0±5°F) for a minimum of 16 hours. The only difference
between conditioned saturation only and conditioned with saturation plus freeze-thaw
was that the specimens were subjected to freeze-thaw cycle. After the freeze-thaw cycle,
specimens were transferred to the water bath at 60±1°C (140±2°F) and the zip lock bag
and plastic film were removed from the specimens as soon as it was placed in the water
bath. The remaining process was same as described for the second subset. Figure 3.7
shows a sample subjected to wet conditioning followed by a vacuum saturation.

54
Figure 3.7 Sample subjected to wet conditioning
3.2.2.1 Indirect tensile strength test
The indirect tensile test was performed on a Marshall Stability and flow machine,
is shown in Figure 3.8 (a) with steel loading strips that have concave surfaces. Figure 3.8
(b) shows the laboratory test setup for the IDT strength test and the failure plane of
specimen.
The specimens were removed from 25±0.5°C water bath, and the thickness (t') for
the saturated only and saturated plus freeze-thaw samples was measured by the method of
D 3549. The specimens were placed between the steel loading strips which were
attached to bearing plates of the testing machine. The load was applied to the specimen
by the constant head rate, at 50mm (2in.) per minute. The maximum compressive force
was recorded and the load was continued until a vertical crack appeared on the specimen.
Then the specimen was removed from the machine and pulled apart at the crack. The
interior surface of the specimen was checked for any cracked or broken aggregates.
From the plot of load versus deformation, maximum load carried by the specimen was
found, and Equation 3.13 was used to determine the indirect tensile stress at failure. IDT
stress for the three specimens was averaged and reported as the IDT strength of each sets.
Typical plots of load versus deformation are shown in Figures 3.9 to 3.11.

55
2t
PS
dtπ= …………………………..………………….(3.13)
Where,
St = Horizontal tensile stress at center of specimen, psi
P = Applied load, lbs
d = Diameter of the specimen, inches
t = Thickness of the specimen, inches
Figure 3.8 IDT Strength test setup and failure plane
3.2.2.2 Tensile strength ratio
The tensile strength ratio (TSR) was calculated by dividing the average ITS of the
conditioned (saturated only or saturated plus freeze-thaw) subset by the average ITS of
the unconditioned subset. The TSR was calculated using the following equation:
2
1
TTensile Strength Ratio (TSR) =
T…………………...………..(3.14)
Where:
T1 = average tensile strength of dry subset,
T2 = average tensile strength of conditioned subset.
(a) (b)

56
Figure 3.9 Measuring tensile strength for the dry subset using Marshall Stability
and Flow Machine
Figure 3.10 Measuring tensile strength for the saturated no freeze-thaw subset using
Marshall Stability and Flow Machine

57
Figure 3.11 Measuring tensile strength for the saturated freeze-thaw subset using
Marshall Stability and Flow Machine

58
CHAPTER 4 DATA COLLECTION AND ANALYSIS
4.1 INTRODUCTION
This chapter includes a summary of the data generated from the lab testing of
samples selected for this project. The data includes volumetric properties and indirect
tension test results for the samples produced using Superpave Gyratory Compactor. The
samples were conditioned and tested in accordance with the AASHTO T 283 test method.
The experiment involved the production of samples from three different sources. The
purpose of these tests was to compare the mechanical properties of asphalt mixtures and
prediction of stripping potential using AASHTO T 283 test method.
4.2 VOLUMETRIC PROPERTIES
Samples were made from 9.5 mm and 19 mm NMAS, with original gradation and
asphalt content as determined by each contractor's Superpave mix design. The results
obtained on checking volumetrics for this asphalt content were compared with results
provided by the contractor for the same asphalt content in Table 4.1. For each mix, the
material prepared in the WVU Asphalt Technology Laboratory had higher VTM and
VMA and lower VFA than was found in the contractors' mix designs. The option of
altering the percent binder to lower the VTM was investigated but rejected. The
difference in the volumetric parameters was reasonable given the different labs and
technicians. It was reasoned that staying with the contractors' selected percent binder
would provide meaningful to the results for the WVDOH.
4.3 TEST RESULTS
Table 4.2 presents the results of the AASHTO T 283 evaluation of the three West
Virginia mixes. The complete data set was presented in Appendix A. Figure 4.1 is a
summary of the IDT results for the samples without anti-strip. Unconditioned samples
ranged from 91 psi for the New Enterprise mixes to 147 psi for the Carl Kelly mix, with
the J.F.Allen mix being 103 psi. These are reasonable values when compared to the
results in the literature. Epps, et al. (2000) reported unconditioned tensile strengths
ranging from 78.9 psi to 273 psi.

59
Table 4.1 Comparison of volumetric properties
Sources NMAS Volumetric
properties Criteria Contractor WVU lab
Pb, % - 5.7 5.7
VTM, % 3.0-5.0 4.0 5.0
VMA, % 15.0 min 15.6 16.5 JFA 9.5mm
VFA, % 65-75 74.4 69.8
Pb, % - 5.7 5.7
VTM, % 3.0-5.0 4.1 5.0
VMA, % 15.0 min 15.8 16.8 NE 9.5mm
VFA, % 65 – 75 74.1 69.3
Pb, % - 4.7 4.7
VTM, % 3.0-5.0 4.0 4.7
VMA, % 13.0 min 13.9 15.6 CK 19mm
VFA, % 65 – 75 71.3 69.9
The IDT of the saturated only conditioned samples indicate a large drop-off in
tensile strength. The IDT of the saturation samples ranged from 21.5 psi to 58 to 119 for
the New Enterprise, J.F.Allen, and Carl Kelly mixes, respectively. These produced
respective TSR values of 24, 56, and 81 percent as shown in Table 4.2. Only the Carl
Kelly mix passed the Superpave criteria, using the 1989 AASHTO T 283 conditioning
method. This was the only 19mm mix evaluated, so it cannot be concluded if the positive
result was due to the aggregate source or the mix type.

60
Table 4.2 Indirect tensile strength and TSR for all three sources
Source JFA NE CK
NMAS (mm) 9.5 9.5 9.5 9.5 19 19
Anti-stripping additive None Liquid None Liquid None Liquid
Avg. Air voids % 7.33 7.27 7.47 6.63 6.8 6.8
Dry Tensile Strength
(psi) 103.0 113.67 90.89 103.25 146.6 130.5
Air Voids % 7.37 7.23 7.43 6.6 6.9 6.8
Avg. Saturation % 75.0 74.8 76.2 70.6 72.0 70.8
Tensile Strength
(psi) 58 81.0 21.5 73.35 118.8 123.0
No F-T
@140°F
Tensile Strength
Ratio (%) 56.3 71.3 23.7 71.0 81.0 94.2
Air Voids % 7.33 7.2 7.13 6.63 6.87 6.87
Avg. Saturation % 73.9 72.4 73.8 72.8 71.8 70.9
Tensile Strength
(psi) 61.0 91.0 31.85 57.18 112.6 126.3
Sample conditioning
F-T
Tensile Strength
Ratio (%) 59.2 80.1 35.0 55.4 76.8 96.8
The IDT of the saturated plus freeze thaw conditioned samples again
demonstrates a reduction in the strength when compared to the unconditioned IDT. The
IDT of the saturated plus freeze-thaw samples were 32, 61, and 113 psi for the New
Enterprise, J.F.Allen, and Carl Kelly mixes, respectively. When compared on a TSR
basis the results were 35, 59, and 77 percent, respectively. In this case, all mixes failed
the Superpave TSR requirement of 80 percent.

61
0
20
40
60
80
100
120
140
160
Avg. Tensile Strength (psi)
Dry
No Freeze-Thaw
Freeze-Thaw
JFA NE CK
Figure 4.1 Comparison of tensile strength for different sample conditioning (without anti-
strip)
Figure 4.2 compares the TSR for samples with and without anti-strip for two
conditioning methods. The results of the AASHTO T 283 mixes demonstrate that two of
the mixes do not meet Superpave requirement when tested under the 1989 conditioning
protocol. This is disturbing in two ways. Since these are approved mixes, the
contractors' mix design determined that the use of anti-strip admixture was not required.
Yet two of the mixes failed the TSR requirement as tested during this research. The New
Enterprise mix had a particularly low TSR value. The resources allocated to this research
were not sufficient to explore the reasons for this discrepancy. However, the variability
in TSR results using the modified Lottman procedure was well documented in the
literature (Roberts, et al., 1996). The issue of variability was not addressed in NCHRP 9-
13 (Epps, et al., 2000). There is no precision and bias statement in the AASHTO T 283
test method.
The other area of concern is the lack of correlation between the test results and
field performance. Only one mix passed the TSR requirement with the 1989 conditioning
method. All three mixes failed when conditioned with the 2003 protocol.

62
0
20
40
60
80
100
120
TSR (%)
with Antistrip with Antistrip
No F-T No F-T No F-T F-T F-T F-T
F-T - Freeze-Thaw
JFA NE CK
Figure 4.2 Comparison of tensile strength ratio for subsets with and without anti-strip
However, as reported in the literature, there is not a moisture sensitivity problem
in West Virginia (TRB, 2003). Either AASHTO T 283 results are not reliable for
conditions in West Virginia, or the state may have an unrecognized moisture sensitivity
problem. The reliability of T 283 with respect to identifying field performance is an
unresolved issue in the literature. Aschenbrener et al (1995) concluded the method could
identify between good and poor performing mixes, but marginal mixes could not be
reliably detected. Pan and White (1999) concluded the TSR does not reflect a mixture's
stripping potential. Epps, et al. (2000), in the NCHRP Project designed to integrate the
TSR method with the Superpave mix design method, found an almost inverse correlation
between the test results and field performance. In this study, one mix known to be
moisture sensitive met the TSR requirement while two materials with good field
performance failed to pass the TSR requirement. The two remaining mixes in the
NCHRP study were rated as moderate to highly moisture sensitive; one passed and the
other failed the current Superpave TSR requirement. The failure of the West Virginia
mixes, which are believed to be good performers in the field, to pass the Superpave TSR
requirement is consistent with the inverse correlation found in NCHRP 9-13 (Epps, et al.
2000).

63
4.3.1 Samples with anti-strip admixture
The test results prepared with anti-strip are also presented in Table 4.2. Figure
4.3 shows the IDT results for the samples with anti-strip, for different levels of
conditioning. The liquid anti-strip increased the TSR for all mixes and for both
conditioning methods. The Carl Kelly material showed an improvement in TSR for the
1989 protocol, but anti-strip would not be recommended since the design requirements
were met without anti-strip. The anti-strip allowed the Carl Kelly material to pass the
2003 protocol which failed without the anti-strip. While the IDT of the conditioned
samples of materials was improved, the IDT of the unconditioned samples was lower
with the anti-strip than without it. This exposes one of the fallacies of the TSR method.
Low tensile strengths of unconditioned samples are undesirable but can actually result in
a material passing the TSR requirement. The J.F. Allen material with anti-strip failed to
pass the TSR requirement for the 1989 protocol, but passed the requirement when tested
under the 2003 protocol. The New Enterprise with anti-strip admixture material did not
pass the TSR requirement under either protocol.
0
20
40
60
80
100
120
140
Avg. Tensile Strength (psi)
Dry No Freeze-Thaw Freeze-Thaw
JFA NE CK
Figure 4.3 Comparison of tensile strength for different sample conditioning
(with anti-strip)
The influence of the anti-strip admixture on IDT is summarized in Figure 4.4. In
all cases, the IDT of conditioned samples improved with the addition of the admixture.

64
In two cases, the IDT of the unconditioned samples improved; in one case the IDT was
reduced when the anti-strip was added.
0
20
40
60
80
100
120
140
160Avg. Tensile Strength
without Antistrip with Antistrip
Dry DryDry No F-TNo F-T No F-T F-TF-TF-T
F-T - Freeze-Thaw
JFA NE CK
Figure 4.4 Comparison of tensile strength for subsets with and without anti-strip
4.3.2 Effect of conditioning method
One of the significant changes between the 1989 and 2003 testing protocols was
changing the freeze-thaw conditioning from optional to mandatory. By examination of
Table 4.2 and Figure 4.4 it can be determined that IDT decreased for four comparisons
and increased for two comparisons when the freeze-thaw cycle was included. These
results do not support the hypothesis that the inclusion of a freeze-thaw cycle in the test
protocol improves the ability to identify moisture-susceptible mixtures. The number of
samples measured during this research is too limited to draw a firm conclusion.
However, these test results are consistent with the findings of NCHRP Project 9-13
(Epps, et al., 2000). In the NCHRP research, 56 of 68 possible comparisons showed the
IDT was statistically equal between the conditioning protocols. When only the 150mm
samples compacted with the Superpave gyratory compactor were considered, all five
available comparisons had statistically equal strengths. Inclusion of the freeze-thaw
cycle in the recommended protocol was an attempt to "make the methodology

65
conservative" (Epps, et al., 2000). The researchers acknowledged that sample
conditioning was not identified as being important based on the analyses of their data.
4.3.3 Level of saturation
The allowable range for the level of saturation was reduced from 55 to 80 percent
in the 1989 protocol to 70 to 80 percent in the 2003 protocol. Table 4.3 shows test results
obtained for the J.F.Allen material using the two protocols for saturation levels. The IDT
of the condition samples are nearly identical, 58 versus 60 psi for the saturation only
samples and 61 versus 63 psi for the saturation plus freeze-thaw samples. The
differences in the TSR's are somewhat greater due to the differences in the IDT of the
unconditioned samples. There was approximately a 10 percent difference in the IDT of
the unconditioned samples.
The results of this experiment are consistent with the findings of Epps, et al.
(2000). They recommended a range of 55 to 80 percent for level of saturation. The level
of saturation range requirement in the 2003 protocol was implemented by the AASHTO
committee in an "attempt to reduce test variability" (Myers, 2005)
Table 4.3 Comparison of saturation level
Source JFA
NMAS (mm) 9.5 9.5
Anti-Stripping additive None None
Avg. Air Voids % 7.33 7.03 Dry
Tensile Strength (psi) 103.0 114.67
Air Voids % 7.37 6.93
Saturation % 75.0 61.6
Tensile Strength (psi) 58 60.0
No F-T
@140°F
Tensile Strength Ratio (%) 56.3 52.3
Air Voids % 7.33 6.97
Saturation % 73.9 64.33
Tensile Strength (psi) 61.0 62.7
Sample
conditioning
F-T
Tensile Strength Ratio (%) 59.2 54.7

66
CHAPTER 5: CONCLUSIONS AND RECOMMENDATIONS
5.1 CONCLUSIONS
The mechanisms associated with stripping are complex and there has been
number of theories to explain moisture damage mechanism in asphalt mixtures. Each
theory has its merits but is difficult to prove that it alone can explain this complex
phenomenon. Research has shown that stripping is associated with several factors. The
factors like mix design, construction issues, environmental factors and weather conditions
during construction are considered the major contributors of stripping.
There are many test methods for evaluating the moisture susceptibility of HMAC.
These test methods are empirically based and the research is focused on the development
of a test for identifying moisture susceptibility. These test methods range from simple
observations of conditioned samples to more elaborate methods of conditioning and
testing samples. Since only empirically based test methods are used to evaluate stripping
potential, none of the tests proved to be effective in predicting stripping potential.
AASHTO T283 test method has been recommended to determine moisture susceptibility
of HMA mixes until more suitable and reliable tests are developed and validated by
SHRP or other agencies (Kandhal, 1992). The general consensus among the users of
moisture damage tests is that the test results are highly variable and validation with field
performance is problematical (Roberts, et al., 1996).
Despite the recognized problems AASHTO T 283 is the most widely used test
method for HMAC moisture sensitivity. Hence, it was adopted as a required step in the
Superpave mix design method. Superpave implementation began in the 1990’s; at this
time, the 1989 version of AASHTO T 283 was in place. However, this version of the test
was developed prior to the availability of the Superpave gyratory compactor. In addition,
sample condition procedures were different between the Superpave requirements and
AASHTO T 283. Several research projects were performed to resolve issues concerning
the use of AASHTO T 283 and Superpave. NCHRP Project 9-13 was performed to
address this specific problem (Epps, et al., 2000). The results of this project were used to
guide the revision of AASHTO T 283 as published in 2003. NCHRP Project 9-13
developed several interesting conclusions concerning the effect of the test parameters on

67
the results of the test. Some of the findings were counterintuitive, such as the lack of
sensitivity of the test results to degree of saturation and the effect of the freeze-thaw cycle
on tensile strength ratio. The AASHTO committee overrode the scientific evidence from
NCHRP 9-13 and placed tight restrictions on the degree of saturation and required a
freeze-thaw cycle in the conditioning sequence. The NCHRP 9-13 research demonstrated
that even with these restrictions, AASHTO T 283 is not a reliable method for evaluating
the field performance of HMAC. The researchers recommended states perform a
structured research program when implementing AASHTO T 283.
West Virginia, in compliance with the national standards, requires the use of
AASHTO T 283 for Superpave mix designs. However, West Virginia reported on a
recent survey (TRB, 2003) that there was not a moisture sensitivity problem in the state.
Spurred on by the recent failure on I-68 where stripping may have been a contributing
factor, this project was conducted to gain insight into the issue of using AASHTO T 283
in West Virginia.
A limited laboratory program was conducted to evaluate the moisture sensitivity
of three mixes approved for use in the state. This limited data set indicated the mixes are
moisture sensitive. Only one of the three mixes could be modified to meet the Superpave
TSR requirement through the use of a liquid anti-strip. Although only three mixes were
evaluated, the results were consistent with NCHRP 9-13 with respect to:
1. Lack of sensitivity of the results to saturation level.
2. Results for samples conditioned with saturation only were similar to results
obtained from samples conditioned with saturation plus a freeze-thaw cycle.
3. TSR is not a reliable indicator of field performance
Results obtained in this study indicate that the tensile strength ratio of mixtures
did not satisfactorily meet the AASHTO T 283 test method. The aggregates from all
three sources have been classified as not water sensitive. However, only one aggregate
source passes the 1989 version of AASHTO T 283 test method. All three mixes failed
when conditioned with 2003 version of the test method. The resources allocated to this
research were not sufficient to explore the reasons for this discrepancy. So either the test

68
method is not reliable for conditions in West Virginia or the state may have unrecognized
stripping problem.
5.2 RECOMMENDATIONS
West Virginia is in a unique position of not recognizing a moisture susceptibility
problem in HMAC (TRB, 2003). A mix design from Maryland was included in NCHRP
9-13 because it was a moisture susceptible mix (Epps, et al., 2000). Stripping problems
in Pennsylvania have served as case studies in research performed by Kandhal, et al.
(1989). Given the proximity of these states, there is a potential that stripping can exist in
West Virginia. Research should be performed to verify whether or not there is a stripping
problem in the state. If the study verifies the current opinion that moisture damage is not
a problem, then the need for continued use of AASHTO T 283 must be questioned.
If the field study identifies a moisture sensitivity problem associated with mix
design, then the state should aggressively pursue testing of mixes for moisture sensitivity.
Unfortunately, the demonstrated lack of reliability of AASHTO T 283 suggests that an
alternative method should be pursued. This would require a significant research effort.
Development of a reliable test for moisture sensitivity of HMAC has not been resolved
through federal nationwide research programs.
In the interim, the limited data set examined during this research should be
expanded to embrace more mix types used throughout the state. If the expanded test
program verifies that AASHTO T 283 is not reliable, rejection of the national standard
would be justified.
One option which could be considered for immediate implementation would be to
return to the 1989 version of AASHTO T 283. The limited data set collected for the
West Virginia mixes concurs with the results of NCHRP Report 9-13. The level of
saturation restrictions and required freeze-thaw cycle increase the complexity and time
required to perform the test. However, they do not improve the reliability of the test with
respect to identifying mixes which are moisture susceptible

69
REFERENCES
Aschenbrener T., R. McGennis, and R. Terrel, 1995, Comparison of Several Moisture
Susceptibility Tests To Pavements of Known Field Performance, Proceedings of the
Association of Asphalt Paving Technologists, Vol. 64 (1995), pp. 162-196.
Bahia, H. and S. Ahmad, December 1999, Evaluation and Correlation of Lab and Field
Tensile Strength Ratio (TSR) Procedures and Values in Assessing the Stripping Potential
of Asphalt Mixes, The Asphalt Pavement Research Group, University of Wisconsin,
Madison, Wisconsin, Report No. WI/SPR-10-99.
Cheng, D., D. N. Little, R. L. Lytton, and J. C. Holste. 2002, Surface Energy
Measurement of Asphalt and Its Application to Predicting Fatigue and Healing in Asphalt
Mixtures, Transportation Research Record: Journal of the Transportation Research
Board, No. 1810, TRB, National Research Council, Washington, D.C., pp. 44–53.
Choubane B., G. Page, and J. Musselman, 2001, Effects of Water Saturation Level on
Resistance of Compacted Hot-Mix Asphalt Samples To Moisture-Induced Damage,
Transportation Research Record 1723, National Research Council, TRB, Washington,
D.C., pp. 97-106.
Coplantz J. and D. Newcomb, 1988, Water Sensitivity Test Methods for Asphalt
Concrete Mixtures: A Laboratory Comparison, Transportation Research Record 1171,
TRB, National Research Council, Washington, D.C. , pp. 44-50.
Epps J. A., P. E. Sebaaly, J. Penaranda, M. R. Maher, M. B. McCann, A. J. Hand, 2000,
Compatibility of a Test for Moisture-Induced Damage with Superpave Volumetric Mix
Design, Transportation Research Board, NCHRP Report 444, Washington D.C.
Fromm, H. J., 1974, The Mechanisms of Asphalt Stripping from Aggregate Surfaces,
Proc., Association of Asphalt Paving Technologists, Vol. 43, pp. 191–223.
Hunter E. R. and K. Ksaibati, November 2002, Evaluating Moisture Susceptibility of
Asphalt Mixes, Department of Civil and Architectural Engineering, University of
Wyoming, Laramie, Wyoming.
Johnson D. R. and R. B. Freeman, December 2002, Rehabilitation Techniques for
Stripped Asphalt Pavements, Western Transportation Institute, Bozeman, Montana,
Report No. FHWA/MT-002-003/8123.
Kandhal P. S., C. W. Lubold, F. L. Roberts, 1989, Water Damage To Asphalt Overlays:
Case Histories, Auburn University, Auburn, Alabama, NCAT Report No. 89-1.
Kandhal P. S., May 1992, Moisture susceptibility of HMA mixes: identification of
problem and recommended solutions, Auburn University, Alabama, NCAT Report No.
92-1.

70
Kanitpong K., and H. U. Bahia, March 2003, Role of Adhesion and Thin Film Tackiness
of Asphalt Binders in Moisture Damage of HMA, Association of Asphalt Paving
Technologists (AAPT).
Kanitpong K., H. U. Bahia, May 2003, Evaluation of the Extent of HMA Moisture
Damage in Wisconsin as it Relates to Pavement Performance, Department of Civil and
Environmental Engineering, University of Wisconsin, Madison.
Kiggundu B. M. and F. L. Roberts, September 1988, Stripping in HMA Mixtures: State-
of-The Art And Critical Review of Test Methods, NCAT, Auburn University, Auburn,
Alabama, Report No. 88-2.
Ksaibati K. and G. L. Conner, May 2004, et al, Laboratory Evaluation of Bottom Ash
Asphalt Mixes, Department of Civil and Architectural Engineering, University of
Wyoming, Laramie, Wyoming.
Lottman, R.P., L. White, and D. Frith, 1988, Methods of Predicting and Controlling
Moisture Damage in Asphalt Concrete. Transportation Research Record 1171,
Washington D.C.
Mahoney J. and J. Stephens, August 1999, Comparison of AASHTO Moisture Sensitivity
Test With Connecticut Department of Transportation Modified Test Method, Connecticut
Advanced Pavement Laboratory, University of Connecticut, Storrs, Connecticut, Report
No. CAPLab 99-1.
Maupin G., 1999, Evaluation of Stripping in Virginia’s Pavements, Transportation
Research Record 1681, National Research Council, TRB, Washington, D.C., pp. 37-42.
Myers, A.H., Email communications, Asphalt Branch Manager; Kentucky Department of
Transportation, AASHTO Committee, Division 2-Bituminous Materials and Mixtures,
Frankfort, Kentucky, August 2005.
Pan C. and T. D. White, February 1999, Conditions for Stripping Using Accelerating
Testing, Joint Transportation Research Program (JTRP), Purdue University, West
Lafayette, Indiana, Report No. FHWA/IN/JTRP-97/13.
Roberts F.L., P.S. Kandhal, E.R. Brown, D.Y. Lee, and T.W. Kennedy, 1996, Hot Mix
Asphalt Materials, Mixture Design, and Construction, NAPA Education Foundation,
Lanham, Maryland.
Sebaaly P. E., P. Tohme, E. Hitti, K. Stansbury and J. Epps, March 2003, Asphalt
Concrete Anti-Stripping Techniques, Pavements/Materials Program, Department of Civil
Engineering, University of Nevada, Reno, Nevada, Report No. SD99-10-F.
Shah B.D., August 2003, Evaluation of Moisture Damage within Asphalt Concrete
Mixes, Texas A&M University, College station, Texas.

71
Tandon V., N. Vemuri, S. Nazarian, and M. Tahmoressi, 1997, A Comprehensive
Evaluation of Environmental Conditioning System, Proceedings of the Association of
Asphalt Paving Technologists, Vol. 66 (1997), pp. 187-210.
Tayebali A. A., W. K. Fischer, Y. X. Huang, M. B. Kulkarni, June 2003, Effect of
Percentage Baghouse Fines on the Amount and Type of Anti-Stripping Agent Required
to Control Moisture Sensitivity, Department of Civil Engineering, North Carolina State
University, Raleigh, North Carolina, Report No. FHWA/NC/2003-04.
Transportation Research Board (TRB), February 2003, Moisture Sensitivity of Asphalt
Pavements, A National Seminar, San Diego, California.
West R. C., J. Zhang, A. Cooley, July 2004, Evaluation of The Asphalt Pavement
Analyzer for Moisture Sensitivity Testing, NCAT, Auburn University, Auburn, Alabama.

72
APPENDIX A - MOSITURE SENSITIVITY DATA SET
Project: JFA 9.5mm Compaction Method: Gyratory Compactor
Additive: None Dosage: None
Sample Identification 1 2 3 7 8 6 4 5 10
Diameter, in. D 5.91 5.91 5.91 5.91 5.91 5.91 5.91 5.91 5.91
Thickness, in. t 3.74 3.74 3.74 3.72 3.72 3.72 3.74 3.74 3.74
Dry Mass in Air, g A 3727.7 3727.1 3724.8 3723.1 3726.0 3725.8 3726.7 3726.6 3725.7
SSD Mass, g B 3755.6 3751.7 3745.7 3744.1 3745.4 3746.6 3745.2 3746.5 3743.5
Mass in Water, g C 2119.8 2115.5 2114.5 2112.0 2111.1 2112.0 2110.8 2113.9 2109.3
Volume, cc E 1635.8 1636.2 1631.2 1632.1 1634.3 1634.6 1634.4 1632.6 1634.2
Bulk Specific gravity Gmb 2.279 2.278 2.283 2.281 2.280 2.279 2.280 2.283 2.280
Max. Specific Gravity
Gmm 2.461 2.461 2.461 2.461 2.461 2.461 2.461 2.461 2.461
Number of Gyrations 56 55 45 42 44 42 48 45 41
% Air Voids Pa 7.4 7.4 7.2 7.3 7.4 7.4 7.4 7.2 7.4
Volume of Air voids,
cc Va 121.0 121.1 117.4 119.1 120.9 121.0 120.9 117.5 120.9
Load, lbf P 3560 3580 3560
Dry Strength, psi S1 103.0 103.0 103.0
Avg. Dry Tensile Strength
S1 103.0
N/A
Saturated min. @ 20-24 in. Hg
Thickness, in. t′ 3.72 3.72 3.72 3.74 3.74 3.74
SSD Mass, g B′ 3809.9 3819.2 3816.7 3816.0 3813.3 3815.2
Volume of absorbed
water, cc J′ 86.8 93.2 90.9 89.3 86.7 89.5
% Saturation S′ 72.9 77.1 75.1 73.9 73.8 74.0
Load, lbf P′ 2220 1500 2300 2140 2080 2110
Wet Strength, psi S2 64 43 67 62 60 61
Avg. Wet Tensile
Strength S2 58.0 61.0
Cracked/Broken
Aggregates Yes Yes Yes Yes Yes Yes
TSR
56.3% 59.2%

73
Project: JFA 9.5mm Compaction Method: Gyratory Compactor
Additive: Liquid Anti-Strip Dosage: 0.3% by Binder Weight
Sample Identification 1 5 9 2 4 8 3 7 11
Diameter, in. D 5.91 5.91 5.91 5.91 5.91 5.91 5.91 5.91 5.91
Thickness, in. t 3.74 3.70 3.72 3.74 3.72 3.72 3.72 3.72 3.70
Dry Mass in Air, g A 3727.2 3725.5 3724.1 3724.1 3724.6 3724.2 3724.4 3722.7 3722.9
SSD Mass, g B 3754.8 3745.7 3749.3 3746.9 3746.0 3746.9 3745.1 3744.8 3745.2
Mass in Water, g C 2120.8 2112.3 2112.8 2117.0 2110.0 2111.9 2114.8 2111.0 2113.7
Volume, cc E 1634.0 1633.4 1636.5 1629.9 1636.0 1635.0 1630.3 1633.8 1631.5
Bulk Specific gravity Gmb 2.281 2.281 2.276 2.285 2.277 2.278 2.284 2.279 2.282
Max. Specific
Gravity Gmm 2.458 2.458 2.458 2.458 2.458 2.458 2.458 2.458 2.458
Number of Gyrations 54 45 52 57 48 48 45 46 46
% Air Voids Pa 7.2 7.2 7.4 7.0 7.4 7.3 7.1 7.3 7.2
Volume of Air voids,
cc Va 117.6 117.6 121.1 114.1 121.1 119.4 115.8 119.3 117.5
Load, lbf P 3760 4100 3920
Dry Strength, psi S1 108.0 119.0 114.0
Avg. Dry Tensile
Strength S1 113.67
N/A
Saturated min. @ 15-22 in. Hg
Thickness, in. t′ 3.74 3.72 3.72 3.72 3.72 3.70
SSD Mass, g B′ 3815.0 3810.8 3812.1 3807.0 3812.6 3805.6
Volume of absorbed
water, cc J′ 90.9 86.2 87.9 82.6 89.9 82.7
% Saturation S′ 79.7 71.2 73.6 71.3 75.4 70.4
Load, lbf P′ 2960 2600 2880 3120 3050 3260
Wet Strength, psi S2 85 75 83 90 88 95
Avg. Wet Tensile
Strength S2 81.0 91.0
Cracked/Broken
Aggregates Yes Yes Yes Yes Yes Yes
TSR
71.3% 80.1%

74
Project: JFA 9.5mm at 55% saturation Compaction Method: Gyratory Compactor
Additive: None Dosage: None
Sample Identification 3 7 9 1 4 6 5 11 10
Diameter, in. D 5.91 5.91 5.91 5.91 5.91 5.91 5.91 5.91 5.91
Thickness, in. t 3.74 3.74 3.74 3.72 3.72 3.74 3.74 3.74 3.74
Dry Mass in Air, g A 3728.5 3727.9 3726.3 3729.3 3725.5 3726.3 3727.4 3724.5 3725.0
SSD Mass, g B 3750.7 3750.4 3748.5 3757.3 3749.0 3746.7 3748.4 3749.2 3747.6
Mass in Water, g C 2116.0 2116.3 2113.4 2118.8 2118.1 2117.3 2119.4 2114.8 2113.1
Volume, cc E 1634.7 1634.1 1635.1 1638.5 1630.9 1629.4 1629.0 1634.5 1634.5
Bulk Specific gravity Gmb 2.281 2.281 2.279 2.276 2.284 2.287 2.288 2.279 2.279
Max. Specific Gravity Gmm 2.452 2.452 2.452 2.452 2.452 2.452 2.452 2.452 2.452
Number of Gyrations 46 44 49 51 46 43 48 50 50
% Air Voids Pa 7.0 7.0 7.1 7.2 6.9 6.7 6.7 7.1 7.1
Volume of Air voids,
cc Va 114.4 114.4 116.1 118.0 112.5 109.2 109.1 116.0 116.0
Load, lbf P 3900 4150 3900
Dry Strength, psi S1 112 120 112
Avg. Dry Tensile
Strength S1 114.67
N/A
Saturated min. @ 15-20 in. Hg
Thickness, in. t′ 3.72 3.72 3.74 3.74 3.74 3.74
SSD Mass, g B′ 3800.4 3797.8 3792.2 3792.6 3802.0 3802.0
Volume of absorbed
water, cc J′ 71.1 72.3 65.9 65.2 77.5 77.0
% Saturation S′ 60.3 64.3 60.3 59.8 66.8 66.4
Load, lbf P′ 2150 2000 2370 2440 2150 1960
Wet Strength, psi S2 62 58 68 70 62 56
Avg. Wet Tensile
Strength S2 60 62.67
Cracked/Broken
Aggregates Yes Yes Yes Yes Yes Yes
TSR
52.3% 54.7%

75
Project: NE 9.5mm Compaction Method: Gyratory Compactor
Additive: None Dosage: None
Sample Identification 1 2 6 2 4 5 7 8 9
Diameter, in. D 5.91 5.91 5.91 5.91 5.91 5.91 5.91 5.91 5.91
Thickness, in. t 3.74 3.70 3.72 3.70 3.72 3.70 3.70 3.70 3.70
Dry Mass in Air, g A 3849.7 3846.2 3843.2 3846.4 3844.5 3843.2 3842.2 3842.3 3841.4
SSD Mass, g B 3867.7 3961.6 3857.7 3859.5 3855.5 3854.0 3855.5 3858.6 3856.2
Mass in Water, g C 2226.6 2222.6 2222.1 2219.7 2218.2 2217.6 2223.0 2227.4 2227.1
Volume, cc E 1641.1 1639.0 1635.6 1639.8 1637.3 1636.4 1632.5 1631.2 1629.1
Bulk Specific gravity Gmb 2.346 2.347 2.350 2.346 2.348 2.349 2.354 2.356 2.358
Max. Specific
Gravity Gmm 2.537 2.537 2.537 2.537 2.537 2.537 2.537 2.537 2.537
Number of Gyrations 47 48 42 43 44 42 48 44 40
% Air Voids Pa 7.5 7.5 7.4 7.5 7.4 7.4 7.2 7.1 7.1
Volume of Air voids,
cc Va 123.6 122.7 120.6 123.5 122.0 121.3 117.8 116.4 114.9
Load, lbf P 3000 3000 3410
Dry Strength, psi S1 86.0 87.0 99.0
Avg. Dry Tensile
Strength S1 90.89
N/A
Saturated min. @ 10-15 in. Hg
Thickness, in. t′ 3.70 3.72 3.70 3.70 3.70 3.70
SSD Mass, g B′ 3942.5 3937.6 3933.6 3929.3 3926.5 3927.8
Volume of absorbed
water, cc J′ 96.1 93.1 90.4 87.1 84.2 86.4
% Saturation S′ 77.8 76.3 74.5 73.9 72.3 75.2
Load, lbf P′ Failed 740 740 580 1400 1300
Wet Strength, psi S2 21 22 17 41 38
Avg. Wet Tensile
Strength S2 21.5 31.85
Cracked/Broken
Aggregates Yes Yes Yes Yes Yes Yes
TSR
23.7% 35.0%

76
Project: NE 9.5mm Compaction Method: Gyratory Compactor
Additive: Liquid Anti-strip Dosage: 0.5% by Binder Weight
Sample Identification 2 6 10 1 4 8 3 5 9
Diameter, in. D 5.91 5.91 5.91 5.91 5.91 5.91 5.91 5.91 5.91
Thickness, in. t 3.72 3.72 3.72 3.70 3.72 3.72 3.72 3.72 3.72
Dry Mass in Air, g A 3892.6 3884.8 3889.6 3890.1 3890.2 3887.1 3890.0 3890.6 3886.8
SSD Mass, g B 3904.9 3894.9 3899.2 3902.8 3899.9 3895.1 3899.1 3900.5 3897.8
Mass in Water, g C 2266.0 2258.1 2259.0 2264.1 2264.2 2255.5 2262.0 2259.6 2258.7
Volume, cc E 1638.9 1636.8 1640.2 1638.7 1635.7 1639.6 1637.1 1640.9 1639.1
Bulk Specific gravity Gmb 2.375 2.373 2.371 2.374 2.378 2.371 2.376 2.371 2.371
Max. Specific
Gravity Gmm 2.542 2.542 2.542 2.542 2.542 2.542 2.542 2.542 2.542
Number of Gyrations 69 55 56 67 59 51 58 58 57
% Air Voids Pa 6.6 6.6 6.7 6.6 6.5 6.7 6.5 6.7 6.7
Volume of Air voids,
cc Va 107.7 108.8 110.3 108.3 105.5 110.3 106.9 110.4 110.3
Load, lbf P 3400 3840 3450
Dry Strength, psi S1 99 111 100
Avg. Dry Tensile
Strength S1 103.25
N/A
Saturated min. @ 15-23 in. Hg
Thickness, in. t′ 3.70 3.72 3.72 3.72 3.72 3.72
SSD Mass, g B′ 3967.0 3964.5 3964.8 3966.0 3972.2 3967.7
Volume of absorbed
water, cc J′ 76.9 74.3 77.7 76.0 81.6 80.9
% Saturation S′ 71.0 70.4 70.4 71.1 73.9 73.3
Load, lbf P′ 2680 2600 2300 2130 1790 2000
Wet Strength, psi S2 78 75 67 62 52 58
Avg. Wet Tensile
Strength S2 73.35 57.18
Cracked/Broken
Aggregates Yes Yes Yes Yes Yes Yes
TSR
71.0% 55.4%

77
Project: CK 19mm Compaction Method: Gyratory Compactor
Additive: None Dosage: None
Sample Identification 1 6 9 2 4 10 3 7 11
Diameter, in. D 5.91 5.91 5.91 5.91 5.91 5.91 5.91 5.91 5.91
Thickness, in. t 3.74 3.72 3.74 3.72 3.74 3.74 3.74 3.74 3.74
Dry Mass in Air, g A 3810.0 3812.1 3811.2 3812.6 3812.0 3809.6 3813.6 3812.6 3812.3
SSD Mass, g B 3825.6 3826.3 3827.2 3829.9 3827.1 3827.8 3831.1 3828.2 3829.2
Mass in Water, g C 2210.4 2203.5 2202.1 2210.0 2203.0 2201.0 2206.6 2204.4 2207.9
Volume, cc E 1615.2 1622.8 1625.1 1619.9 1624.1 1626.8 1624.5 1623.8 1621.3
Bulk Specific gravity Gmb 2.359 2.349 2.345 2.354 2.347 2.342 2.348 2.348 2.351
Max. Specific
Gravity Gmm 2.522 2.522 2.522 2.522 2.522 2.522 2.522 2.522 2.522
Number of Gyrations 95 59 61 95 70 64 72 67 68
% Air Voids Pa 6.5 6.9 7.0 6.7 6.9 7.1 6.9 6.9 6.8
Volume of Air voids,
cc Va 104.4 111.3 114.1 107.9 112.7 116.1 112.1 112.0 109.9
Load, lbf P 5170 5060 5000
Dry Strength, psi S1 149 147 144
Avg. Dry Tensile
Strength S1 146.6
N/A
Saturated min. @ 15-25 in. Hg
Thickness, in. t′ 3.72 3.74 3.74 3.74 3.74 3.74
SSD Mass, g B′ 3889.1 3893.4 3894.2 3892.5 3895.0 3890.9
Volume of absorbed
water, cc J′ 76.5 81.4 84.6 78.9 82.4 78.6
% Saturation S′ 70.9 72.2 72.9 70.4 73.6 71.5
Load, lbf P′ 4280 4060 4000 3700 3920 4100
Wet Strength, psi S2 124 117 115 107 113 118
Avg. Wet Tensile
Strength S2 118.8 112.6
Cracked/Broken
Aggregates Yes Yes Yes Yes Yes Yes
TSR
81.0% 76.8%

78
Project: CK 19mm Compaction Method: Gyratory Compactor
Additive: Liquid Anti-strip Dosage: 0.5% by Binder weight
Sample Identification 1 2 3 5 6 8 7 9 10
Diameter, in. D 5.91 5.91 5.91 5.91 5.91 5.91 5.91 5.91 5.91
Thickness, in. t 3.72 3.74 3.72 3.74 3.72 3.74 3.72 3.72 3.72
Dry Mass in Air, g A 3791.9 3792.8 3791.8 3789.8 3791.3 3788.3 3791.7 3788.7 3788.5
SSD Mass, g B 3815.5 3815.2 3810.4 3811.2 3809.2 3808.3 3809.3 3809.5 3805.7
Mass in Water, g C 2195.0 2194.6 2191.6 2196.0 2181.9 2193.8 2194.3 2185.6 2183.4
Volume, cc E 1620.5 1620.6 1618.8 1615.2 1627.3 1614.5 1615.0 1623.9 1622.3
Bulk Specific gravity Gmb 2.340 2.340 2.342 2.346 2.330 2.346 2.348 2.333 2.335
Max. Specific
Gravity Gmm 2.512 2.512 2.512 2.512 2.512 2.512 2.512 2.512 2.512
Number of Gyrations 63 79 59 55 52 59 63 51 56
% Air Voids Pa 6.8 6.8 6.8 6.6 7.2 6.6 6.5 7.1 7.0
Volume of Air voids,
cc Va 111.0 111.0 109.6 106.7 117.9 106.7 105.4 115.7 114.3
Load, lbf P 4520 4520 4500
Dry Strength, psi S1 131 130 130
Avg. Dry Tensile
Strength S1 130.5
N/A
Saturated min. @ 15-22 in. Hg
Thickness, in. t′ 3.74 3.72 3.74 3.72 3.72 3.72
SSD Mass, g B′ 3864.5 3874.0 3865.5 3865.8 3871.0 3870.1
Volume of absorbed
water, cc J′ 74.7 82.7 77.2 74.1 82.3 81.6
% Saturation S′ 70.0 70.1 72.4 70.3 71.1 71.4
Load, lbf P′ 4180 4050 4550 4480 4450 4150
Wet Strength, psi S2 120 117 131 130 129 120
Avg. Wet Tensile
Strength S2 123.0 126.3
Cracked/Broken
Aggregates Yes Yes Yes Yes Yes Yes
TSR
94.2% 96.8%


