
NASA/CR-2002-211941
Investigation of RF Emissions FromWireless Networks as a Threat to Avionic
Systems
Maria Theresa P. Salud
Lockheed Martin, Hampton, Virginia
October 2002
The NASA STI Program Office ... in Profile
Since its founding, NASA has been dedicated
to the advancement of aeronautics and spacescience. The NASA Scientific and Technical
Information (STI) Program Office plays a key
part in helping NASA maintain this importantrole.
The NASA STI Program Office is operated by
Langley Research Center, the lead center forNASA's scientific and technical information.
The NASA STI Program Office provides
access to the NASA STI Database, the largest
collection of aeronautical and space science
STI in the world. The Program Office is alsoNASA's institutional mechanism for
disseminating the results of its research and
development activities. These results are
published by NASA in the NASA STI Report
Series, which includes the following report
types:
TECHNICAL PUBLICATION. Reports
of completed research or a major
significant phase of research that
present the results of NASA programsand include extensive data or theoretical
analysis. Includes compilations of
significant scientific and technical dataand information deemed to be of
continuing reference value. NASA
counterpart of peer-reviewed formal
professional papers, but having less
stringent limitations on manuscript
length and extent of graphic
presentations.
TECHNICAL MEMORANDUM.
Scientific and technical findings that are
preliminary or of specialized interest,
e.g., quick release reports, working
papers, and bibliographies that containminimal annotation. Does not contain
extensive analysis.
CONTRACTOR REPORT. Scientific and
technical findings by NASA-sponsored
contractm_ and grantees.
CONFERENCE PUBLICATION.
Collected papers from scientific and
technical conferences, symposia,
seminars, or other meetings sponsored
or co-sponsored by NASA.
SPECIAL PUBLICATION. Scientific,
technical, or historical information from
NASA programs, projects, and missions,
often concerned with subjects having
substantial public interest.
TECHNICAL TRANSLATION. English-
language translations of foreignscientific and technical material
pertinent to NASA's mission.
Specialized services that complement the
STI Program Office's diverse offerings
include creating custom thesauri, building
customized databases, organizing and
publishing research results ... even
providing videos.
For more information about the NASA STI
Program Office, see the following:
• Access the NASA STI Program Home
Page at http://www.sti.nasa.gov
• E-mail your question via the Internet to
• Fax your question to the NASA STI
Help Desk at (301) 621-0134
• Phone the NASA STI Help Desk at (301)621-0390
Write to:
NASA STI Help Desk
NASA Center for AeroSpace Infomlation7121 Standard Drive
Hanover, MD 21076-1320
NASA/CR-2002-211941
Investigation of RF Emissions FromWireless Networks as a Threat to Avionic
Systems
Maria Theresa P. Salud
Lockheed Martin, Hampton, Virginia
National Aeronautics and
Space Administration
Langley Research Center
Hampton, Virginia 23681 2199
Prepared for Langley Research Center
under Contract NAS1 00135
October 2002

The use of trademarks or names of manufacturers in the report is for accurate reporting and does not constitute anofficial endorsement, either expressed or implied, of such products or manufacturers by the National Aeronautics andSpace Administration or the U.S. Army.
Available from:
NASA Center for AeroSpace Information (CASI)
7121 Standard Drive
Hanover, MD 21076-1320
(301) 621-0390
National Technical Information Service (NTIS)
5285 Port Royal Road
Springfield, VA 22161-2171
(703) 605-6000

Abstract
The paper focuses on understanding and obtaining preliminary
measurements of radiatedfield (RF) emissions of laptop/wireless localarea network (WLAN) systems. This work is part of a larger researchproject to measure radiated emissions of wireless devices to provide a
better understanding for potential inte_erence with crucial aircraftavionics systems. A reverberation chamber data collection process is
included, as well as recommendations for additional tests. Analysis ofmeasurements from devices under test (DUTs) proved inconclusive for
addressing potential inte_erence issues. Continued effort is expected toresult in a complete easily reproducible test protocol. The data and
protocol presented here are considered preliminary.
Introduction
The use of wireless technology onboard commercial aircraft will continue to be of concern to theaviation industry. Airlines are interested in use of wireless technology to provide in flight Internet
service, as well as, possible security and monitoring functions. Also, while the airlines would prefer toimpose fewer restrictions on passenger use of Personal Electronic Devices (PEDs), new PEDs will
include more advanced technology including wireless communications. Currently the FAA prohibits theuse of intentional transmitters, such as cellular phones (wireless technology), while the airplane is taxiing
down the runway, ascending, descending, and landing because of their potential to interfere with thenavigational equipment. The most likely type of interference results from spurious emissions from PEDs
that couple into the antenna ports of the communication and navigational equipment. Navigation systemssuch as Distance Measuring Equipment (DME), Global Positioning System (GPS), Instrument LandingSystem (ILS), Traffic Alert and Collision Avoidance System (TCAS), and Very High Frequency
Omnidirectional Range (VOR), utilize the frequency bands that the final test protocol will thoroughlyinvestigate.
Since PED technologies are advancing rapidly, they allow users to have more functionality in one
hand held device. Some devices are incorporating multiple technologies together in one device such aswireless LANs, cellular phones, personal digital assistants (PDAs), web browsers, MP3 players and
laptop computers. Hence, detecting if a carried on device is an intentional transmitter will be difficult.With respect to wireless LANs, travelers want the capability to use their PED to connect with other PEDs
or the Internet as they do in their home and office. Therefore, NASA Langley Research Center isconducting research to investigate the use of portable devices on board airplanes.
The High Intensity Radiated Fields Laboratory will devise a final test methodology to assess the new
wireless technology threat to aircraft systems. Preliminary wireless network systems tests wereconducted in a reverberation chamber, since the test method is simpler, more thorough, and has betterrepeatability than the standard anechoic method. Unlike the anechoic method, which yields results in
field strength at a given distance from the test device, the reverberation method measures the totalradiated power from the device. However, future tests will incorporate peak radiated amplitude
measurements from a semi-anechoic chamber based on a modified DO-160 procedure similar to that inDO-233.

Preliminaryinvestigationofwirelessnetwork(802.1lb andBluetooth)emissionsproducedinsightastowhichfrequencybandcontainedspuriousradiatedemissions.Testingbeganwithachamberandcablecalibration.Lossesmeasuredduringcalibrationweresubtractedfromthe peak-radiatedamplitudeyieldingthetruetotalradiatedemissionsemittedbytheDUT. A baselinereferencewasdonetoseparatewirelessdatalinkemissionsfromthoseof portablecomputers.Thedataplots,in theanalysissectionofthepaper,provethatthewirelesstechnologiesmeetFCC15.209andBluetooth1.1standards.However,wirelessunitswill needtomeettheRTCADO-160Dstandardsforapprovalforuseonboardaircrafts.
Reverberation Chambers
A reverberation chamber was used for this initial investigation of WLAN products. Properties of this
type of chamber simplify the process of measuring emission data from the computers and wireless datalinks.
Properties of Reverberation Chambers
Even though reverberation chambers have been in existence for over fifty years, engineers today are
finding even more ways to utilize them, and their use is becoming increasingly popular. Engineers haveproven that using reverberation chambers to test electromagnetic interference is cheaper, faster, and morerealistic than tests conducted in a semi-anechoic chamber where the DUT's orientation and location
should be taken under consideration. A reverberation or "mode-stirred" chamber is a large RF shieldedmetallic cavity used to test electromagnetic shielding effectiveness, susceptibility, and radiated emissions
in a manner that is highly reproducible and technically thorough. By design, reverberation chambersprovide statistically homogenous and isotropic electromagnetic field distributions. Large reflective
mechanical stirrers rotate during testing to help mix standing waves inside the chamber.
The stirrer reflects the electromagnetic waves onto walls, ceiling, and floor thereby creating anelectromagnetic field equal in magnitude to the vector sum of all the reflected waves at any point [1].
Reflected waves that arrive at a given point will have a different magnitude according to the number ofreflections that previously occurred. The phase for each wave will be different from one another since the
path lengths to reach a given point is different. Therefore, allowing the stirrer to change position causesthe magnitude and phase of reflected waves to be different at every point in the chamber [2]. The stirrers
effectively enable collecting statistical field emissions data inside the chamber with an antenna positionedin a single location.
Bulkhead Panel
Stirrer
Figure 1. Reverberation Chamber with DUT
2

HIRF Laboratory Facility
All DUT tests were conducted in reverberation chamber A in the laboratory facility. Chamber A waschosen because it provides the lowest useable frequency of operation for the testing. A field uncertainty
of+/- 6 dB can be obtained at 80 MHz in this chamber [3]. To achieve a more suitable performance, thelowest frequency chosen was 100 MHz, which established a number of modes over the minimum required
sixty modes for an effective chamber. At this frequency, the chamber field uniformity is approximately+2 dB, according to the standard deviation of 30 measurements of maximum electric field, and continues
to improve at higher frequencies.
Chamber A __
14.33m x 7.01m x 2.90m
t_> Stirrer
DI _T_
Chamber B7.01m x 3.96m x 2.90n
Door
:::::::::::::::::::::::::::::::::::::::
Bulkhead
Panels
Amplifier Room5.49m x 7.32m x 3.05m
..................... Control RoomI _ 5.49m x 7.32m x 3.05m
Door _
TJmx lSm*x ,0m
Door
Antennas
HP 85644A TrackingSource
-- HP 8561E Spectrum
Analyzer
Figure 2. HIRF Lab layout
The dimension of the chamber determines the lowest frequency that will achieve a sufficient mode
density to operate effectively. Since this chamber's electromagnetic environment has been characterizedand documented by the National Institute of Standards and Technology, there is no need to use the
equation to calculate the lowest frequency limit for this chamber. Since the two equations to calculate thelower frequency limit and total number of resonant modes within the chamber at a given frequency are
outside the scope of this paper, refer to [4,5] for a detailed explanation.
Basic Test Configuration
Antennas
The emissions tests were run over a wide frequency band of 100 MHz to 5 GHz. Two different types
of antennas were utilized to cover the frequency range and to collect the most accurate data. A logperiodic antenna with a range of 100 MHz to 1.1 GHz was used to take measurements in the two lower
frequency bandwidths, 100 MHz - 300 MHz and 300 MHz - 1 GHz. In the higher frequency band of1 GHz - 5 GHz, a double ridge guide horn antenna was employed. The ridges inside the horn shaped
structure allow the antenna to collect emissions within a broad frequency band. Certified testing range forthis antenna is from 1 GHz to 18 GHz.
Spectrum Analyzer and Agilent Visual Engineering Environment Software
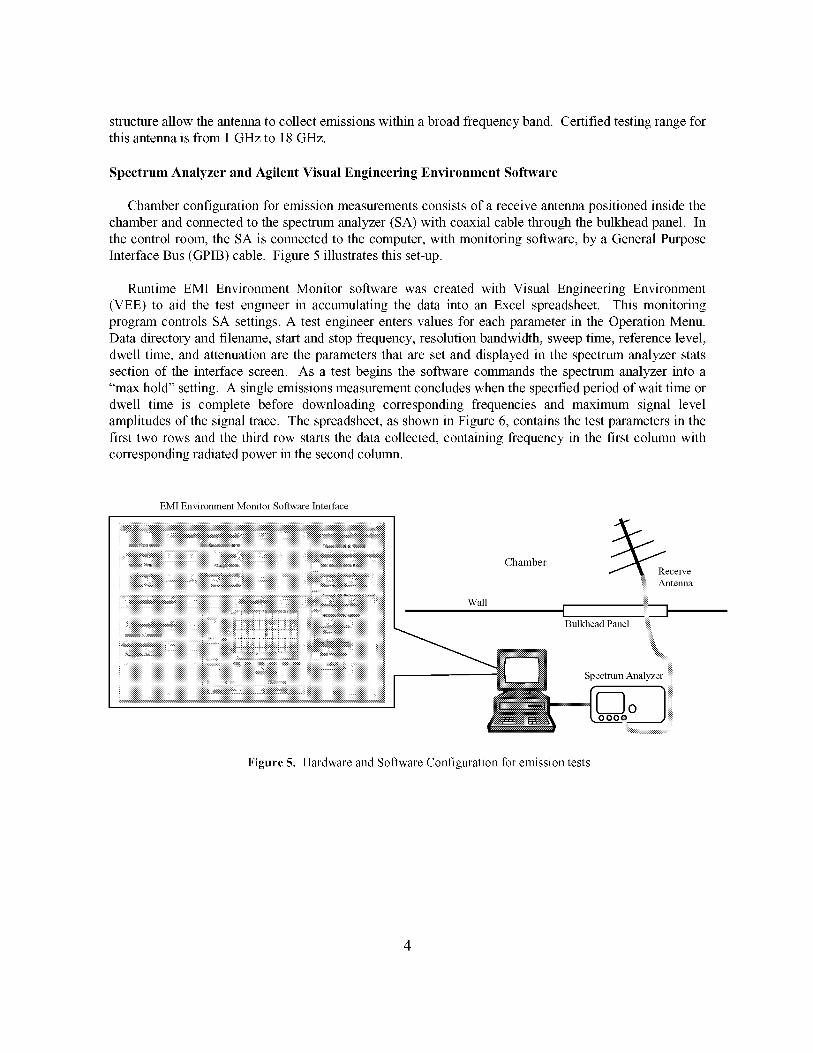
Chamber configuration for emission measurements consists of a receive antenna positioned inside the
chamber and connected to the spectrum analyzer (SA) with coaxial cable through the bulkhead panel. In
the control room, the SA is connected to the computer, with monitoring software, by a General Purpose
Interface Bus (GPIB) cable. Figure 5 illustrates this set-up.
Runtime EMI Environment Monitor software was created with Visual Engineering Environment
(VEE) to aid the test engineer in accumulating the data into an Excel spreadsheet. This monitoring
program controls SA settings. A test engineer enters values for each parameter in the Operation Menu.
Data directory and filename, start and stop frequency, resolution bandwidth, sweep time, reference level,
dwell time, and attenuation are the parameters that are set and displayed in the spectrum analyzer stats
section of the interface screen. As a test begins the software commands the spectrum analyzer into a
"max hold" setting. A single emissions measurement concludes when the specified period of wait time or
dwell time is complete before downloading corresponding frequencies and maximum signal level
amplitudes of the signal trace. The spreadsheet, as shown in Figure 6, contains the test parameters in the
first two rows and the third row starts the data collected, containing frequency in the first column with
corresponding radiated power in the second column.
EMI Environment Monitor Software Interface
Chamber
Wall
Bulkhead Panel
ReceiveAntenna
Spectrum Analyzer
O
Figure 5. Hardware and Software Configuration for emission tests

Date Time
16:07:0115:21:02100.00 -70.50100.33 -71.00100.67 -70.17101.00 -71.00101.34 -72.17101.67 -71.50102.00 -71.83102.34 -69.50
Start Stop Res Swp RefLvl AttenFreq Freq BndwdthTime100.00300.00 0.10 2.00 -40.00 0.00
Figure6.ExcelSpreadSheetthatcontainsthedata
Testing Procedure
Chamber and Cable Calibration
Calibration of the test environment is the first step in gathering emissions data. This process provides
an opportunity for verification of a properly working receiver antenna and efficient cables. All tests were
conducted using the same parameters for the SA in three frequency bands.
Start and Stop Frequency
100 300MHz
300 1000MHz
1000 5000MHz
Resolution Bandwidth 100 kHz
Sweep Time 2 secReference Level -40 dB
Dwell Time 120 sec
Attenuation 0 dB
Laptop computers (DUTs) are placed on a large Styrofoam block inside the chamber. This particular
Styrofoam's dielectric constant is very similar to free space and is considered invisible by radiated fields.
However, any other object placed inside the chamber may add loss and potentially affect the power level.
'Load' is the term for an object that absorbs some of the incident energy causing a loss to occur in the
chamber power density. It is for this reason a chamber calibration is performed, so the chamber's
cumulative loadings are characterized and later normalized out.

Chamber A _,1_
Dual R_e Hom _DUTs-_-_ i Stirrer
_ _ig___ "e_ I D°°r
_ _ 4'' HP85644A Tracking
j_f'--]o ]_'_'_ HP 8561E Spectrum
ii_ Analyzer
Figure 7. Chamber setup for radiated emission calibration measurement
Ely [unpublished data by J. Ely, Langley Research Center] describes the chamber loss value as being
the relationship of the power transmitted into the chamber and power coupled out through the receiveantenna. The power lost is primarily caused by the absorptions from transmit and receive cables, chamber
walls and stirrers, and by other objects in the chamber. Figure 7 illustrates how the instruments are set upto measure all loss factors together and equation (1) is the mathematical expression.
where px,,,,(dBm)
(i)
= Transmitted Power from the tracking source (lmW).
= Transmitted cable loss from tracking source to transmit antenna
connection.
= Receive cable loss from the receive antenna to the SA connection.
= Chamber loss
= Chamber Calibration containing all the loss factors
It is essential to isolate the transmit cable loss in order to subtract the value out of the final data
normalization equation. To directly measure the transmit cable loss, the cable must be disconnected fromthe transmit antenna and reconnected directly to the SA. Figure 8 shows the new set up for themeasurement.
Local Oscillator Connection
Spectrum Analyzer
c 1Transmit Cable
Figure 8. Transmit cable calibration

(2)
The chamber and transmit cable calibration values obtained for each frequency band are used in
additional calculations to determine the total radiated power, discussed in the data normalization section,emitted from the DUT.
Laptop Computer Specifications
Four different brands of laptop computers were tested to quantify each of their emissions. Emission
intensity is based on the radio frequency and electromagnetic field pattern generated by the entire system
or device while in a particular mode of operation. Laptops included in this research are representative of
older and newer models used by travelers today and are depicted in the table below. The models vary by
processor speed, RAM, hard drive, and placement of chips and traces on the circuit boards.
Laptop L1 L2 L3 L4Components
Processor speed 266 MHz 366 MHz 1 GHz 266 MHz
RAM 64 Mbytes 229 Kbytes 255 Mbytes 64 MbytesPCMCIA slots 2 2 2 2
Floppy drive 3 1A 3 1A 3 1A 3 1A
Hard drive 16.8 Gbyte 4 Gbyte 18.6 Gbyte 1.99 & 1.81 GbyteCD ROM Yes Yes Yes Yes
Sound Yes Yes Yes Yes
Video Yes Yes Yes Yes
Baseline Tests
Baseline references for each of the laptops were completed prior to inserting WLAN products for tests.
A baseline provides emissions solely emitted by the laptop while operating at the same level of processor,
memory access, disk read/write, and video activity. This makes it possible to separate radiated emissions
from the wireless data link and those from the laptops.
The baseline tests were run for the purpose of identifying the emissions from a processed task. Data
collected from each processed task overlapped in a graph created an envelope of maximum peaks emitted
from the laptop (see Appendix A). Task names were inserted into the filename along with each brand of
laptop and the designated frequency band to specify the measurement taken. Implemented task names
and a brief description of each follow. Screensaver task uses the 3D Flowerbox design that comes
standard with the Microsoft Windows 2000 Operating System. Under the screensaver menu options, the
flower box was selected to be a large smooth checkerboard cube pattern that spins and blooms at
maximum complexity. Internal Tran task is simply a hard drive file transfer from one folder to another.HD Tran MD task is a file transfer from the hard drive to a PCMCIA slot mounted Microdrive. Audio
task plays an audio CD. In the future, collecting emissions from the laptop playing a DVD is important,
since travelers with this feature in their laptop may watch a movie on long flights. Emissions solely
collected from the laptops reveal the quality of shielding each manufacturer incorporates into their units
for EMI protection and controlling spurious emissions.
Wireless Local Area Network
The following is a brief description of some of the current and future technologies adding versatility toan existing network in the home and workplace. Basic knowledge of their capabilities and modes of
operation assist in conducting a fair investigation of the wireless units.
IEEE 802.11b
Overview
The term "wireless local area network" (WLAN) describes the transmission of data betweencomputing devices using radio frequency (RF), which provides freedom to roam about a fairly spaciousarea. An organization called Wireless Ethernet Compatibility Alliance (WECA) devised the Wireless
Fidelity (Wi-Fi) certification program to measure 802.1 lb equipment interoperability. 802.1 lb WLANproducts must comply with Wi-Fi's standard of association and roaming capabilities, throughput, and
required features such as 64-bit encryption to gain their logo for interoperability [6]. Thus Wi-Fi isinterchangeable with 802.1 lb. Consumers are free to mix 802.1 lb products stamped with the Wi-Fi logo
and communicate while roaming in and out of public coverage areas.
WLAN contains all the features of an Ethernet system without the hassle of cables. 802.1 lb operatesin the unlicensed 2.4 GHz Industrial, Scientific, and Medical (ISM) frequency band. The exact band802.11b operates in is 2.4 to 2.4835 GHz under US FCC 15.247 and 15.249 regulations. FCC Part 15.247
states that a system (intentional radiator) will use frequency hopping spread spectrum (FHSS) or directsequence spread spectrum (DSSS) with additional guidelines. FCC Part 15.209 contain specific limits
adhered to by wireless components on the field strengths of emissions from intentional radiators.
802.1 lb is an extension of IEEE 802.11 standard. In order to increase the data transfer rate, 802.1 lbutilizes DSSS, a modulation technique to allow a device to communicate at a higher rate by distributing
its energy over a contiguous frequency band [7]. 802.1 lb communicates with a throughput of 11Mbpsover a 22 MHz passband. In the 83.5 MHz frequency band there are fourteen 22 MHz wide sub-channels
that the access point can use, of which three channels are non-overlapping. In North America the currentmaximum transmitted power for this wireless device is 100 mW, however, the standard allows 1000 mW
if power control is built into the AP and PC cards. For more information about 802.1 lb read [6, 7].
There are two network topologies. Peer-to-Peer is the basic mode to create a network of two or more
computing devices that share and transfer files. Infrastructure mode uses the access point (AP) to connecta mobile computer to the wired network.
Peer -to-Peer
This mode of operation is also referred to as an ad-hoc network. Figure 8 illustrates the configuration
of an independent basic service set (IBSS) of stations equipped with wireless network interface cards(NIC). Figure 9 illustrates the NIC and its placement into a laptop computer. The wireless stations must
be configured with the same radio channel in order to communicate with each other in a given coveragearea. The IBSS is an on the fly connection between stations when an infrastructure containing an
Ethernet backbone is not required for services or in places that simply don't have one.

Figure8.Peer-to-Peer(Adhoc)wirelessconnection
II tl
//0Figure 9. wireless NIC
Infrastructure
802.1 lb's more useful mode uses the AP to bridge any freely mobile station requesting connection tothe network. The layout of two basic service sets (BSS) along with an extended service set (ESS) is
shown in Figure 10. A BSS contains an AP connected to the wired backbone with wireless end stations.ESS is two or more overlapping BSSs connected to the same Ethernet backbone. In infrastructure modethe configuration of stations are required to have the same radio channel and extended service set
identifier (ESSID). ESSID is a 32-character maximum case sensitive code known to an individualnetwork and the wireless devices within that network. The stations can move in and out of cell coverageareas with ease. The AP and software will transmit information to enable a hand off to occur between the
two APs.
server Desktop with Ethernet
NIC Q
[NNNNN!
DesktopwithEthernet
NIC_
with
Wireless NIC
Access Point
Laptop withWireless NIC
with
Wireless NIC
.$Access Point
Laptop withWireless NIC
Figure 10. Infrastructure setup in BSS and ESS

Bluetooth
Leading commtmication and computer companies make up the Bluetooth Special Interest Group (SIG)that maintains specifications of the protocol profiles, testing and qualifications, interoperability and
compatibility. Bluetooth is leading the wireless personal area network (WPAN) IEEE 802.15.1 standard.Bluetooth technology implements RF in order to replace proprietary cables that connect one device to
another within a short range. An excellent example for implementing this technology is with a desktopcomputer and all the peripherals connected to it.
There are three power classes specified in the Bluetooth technology standards. Class 1 is 100mW
(20dBm) with a radius coverage area of up to 100m. A Class 1 device is required to control itstransmitter power by implementing a link with Link Manager Protocol (LMP) commands. The remote
device wishing to commtmicate in a power controlled link measures its own receiver signal strength usinga Receiver Signal Strength Indicator (RSSI). The measurement reported back determines if thetransmitter on the other side of the link should increase or decrease its output power level. This enables
all classes to communicate without damage to the RF front ends of the lower power classes. Class 2 is2.5mW (4dBm) with a radius coverage area of up to 20m. Class 3 is lmW (0dBm) with a radius
coverage area of up to 10m. Environments that the Bluetooth enabled devices operate in determines thecommtmication distance that can be achieved.
Like the 802.11b standard, Bluetooth operates in the ISM band of 2.4 to 2.4835 GHz producing a
maximum data transfer rate of 1 Mbps. Bluetooth utilizes FHSS technique to reduce interference and
fading [9]. This particular wireless technology frequency hops at 1600 hops per second with a 625gsdwell time for any of the 79 given channels, with a 1 MHz spacing.
Bluetooth eliminates wires by having units connect to each other using RF to form a piconet. Apiconet consists of a unit acting as a master establishing links with up to seven clients. The Bluetooth
link is achieved via identification of the master and synchronization of clocks between the master and theslaves. This information known only between the units within the piconet is called a hop channel. It is
possible to expand a piconet to include more slave devices by placing an active slave into park mode andactivating another [9,10].
The unique feature with Bluetooth, as compared to 802.1 lb, is the capability of voice transmission.
Bluetooth supports three simultaneous operable voice channels. This enables the user to connect to theInternet with use of a Bluetooth equipped mobile phone.
Wireless Testing
802.11b configuration of the software is different for each manufacturer's product. The brand involvedin these tests had a fairly straightforward software package. The 802.1 lb PC card could be configured in
either ad-hoc or infrastructure mode. Once the two PC cards find one another through scanning anidentical BSS ID is assigned to both to establish a commtmication link.
Another aspect to the setup is the network software within Windows OS. To gain access into another
laptop's files, one has to see the other laptop under their network neighborhood. In order for this to occur,configuration of all commtmicating laptops had to participate in the same workgroup.
802.11b tests were conducted in each of the respective modes as previously mentioned, with one
additional test outside the definition of the infrastructure mode. All of the following conducted tests
10

transferredsizeablefilesbetweenthetwolinkedlaptops.Testcaseonedealtwithad-hoc.Ad-hochadasimplesetupthatconsistedof twolaptopsoutfittedwithwirelessNICsplacedapproximately12"apartwith thecardspointingat eachotherto remainlinked. A preliminarytestto theinfrastructuremodeconsistedof afiletransferthroughtheAPwithoutbeingconnectedtothenetwork.TheAPwasplacedintheadjacentcontrolroomoutsidethetestchamberto keepnoisefromcouplingintothechamberthroughitspowercord. AntennasfromtheAP werebroughtintothechamberthroughthebulkheadpanelandwereextendedbycablessothattheycouldbein themiddleof thetwoNICs(Figure11). Thiswastoreducethemultipatheffectsin thechamber,whichdisruptedthecommtmicationbetweenthetwowirelessenableddevices.Thepreliminarytestwastoverifythattheconnectionwasworkingbeforemovingon.Testscenariotwowasin theinfrastructuremodewiththeEthernetpluggedintotheAP.
ControlRoom Chamber
Figure11.LaptopssetuptocommunicatethroughtheAP.
Bluetoothtestsemulatedthead-hocmodeof 802.11b.Althoughthereis a minordifferencewhentransferringafile, theoperatorofthereceivedevicehasto approveit. YetthismightonlybeindicativetothesoleWPANourfacilityacquiredtotest.
A largefilewascreatedin orderto obtainatransferdurationtimeof about10minutes.Thiswasasufficientamountof timeto setthetransferupandgetoutof thechamberto takethemeasurement.Transfertimewasalsocushionedwiththeamountof timeit takesfor theautomaticair pistonchamberdoorto close.Thedwelltimefor allowingtheSAto receiveall themaximumpeaksfor thefrequencybandwas2minutes.
Preliminaryinvestigationevaluatedandassessedvariouscasesfor theirrelevancein thefinal testprotocol.Aftertheinvestigationconcluded,wedeterminedthattwoadditionalnoisefloormeasurementsshouldbeacquiredto comparethedifferenceinemissionlevelsduringfile transfertothatofjustthetwodeviceslinked.
Problems Encountered
Network design can be a challenge when dealing with RF path loss. Path loss is loss of signal power
between the two commtmicating devices. Factors that affect path loss are transmission distance, objectsin the area, the room structure, and the transmission frequency. RF signals reflecting off of the objects in
the surrounding environment while traveling to its destination cause multipath interference. Strong
11

multipathinterferencemayleadtolossoftransmissionbetweenthetwocommunicatingunits.
Withthis in mind,the802.11bhadsomedifficultieswith theRF signalsinsidethereverberationchamber.Intermittentproblemswith theNICs 'seeing'oneanotherinsidethe chamberposedachallenge.Thisinterferencewaslikelycausedby theNIC'santennabeingoverwhelmedwith strongreflectionof theoriginalsignalhavingsimilarmagnitude,butbeingout of phase,thiscausedtotalcancellationresultingin signalloss.Whentheproblemappeared,it wasnecessaryto removethetwowirelesslaptopsfromthe chamber to re-establish a link.
When the AP was introduced into the chamber and the wireless configuration software was switchedto infrastructure mode, failure in communication between the devices occurred. In some cases, it was
probably due to what occurred in the ad-hoc mode. Often times, the positioning and distance inside the
chamber affected whether or not the computer could reach the AP. Yet, at times, position and distancecould not be the culprit because the NICs were positioned close to the AP antennas. The position could
be a result of the location of modes in the chamber. Multipath commtmication issues between two laptopsplaced in a metal enclosure, such as on board an airplane, will need to be addressed in further tests.
Data Normalization
As previously highlighted, all the data collected by the SA is normalized with the calibration data toreveal actual total radiated power (TRP) values. The formula is easily applied to the values in the data
spreadsheets. While the calibrated signal source remains outside the chamber, it transmits a signal intothe chamber and the received value is that of the total path loss. Chamber calibration measurementcontains both transmit and receive cable path loss in addition to the actual chamber loss. Since the
transmit cable path loss is no longer applicable during DUT emission measurements, it is subtracted outof the chamber calibration in the transfer function (H(f)) equation.
Equation (3) solves for total radiated power, PTpminside the reverberation chamber pertaining toemissions emitted by the DUT [unpublished data from J. Ely, Langley Research Center].
r_ (dBm) = rMe_,(dBm)- H(f)(dB)
(3)
(4)
where PMe_s(dBm) = Power measured at SA
o:x,,,,,cb,(dB) = Cable loss from the transmit antenna connector to power source
occbr_.,,(dB) = Chamber Calibration including all loss factors
Figures 12 and 13 demonstrate how the above expressions are applied. In Figure 11, column E (H(f))is the summation of column D subtracted from column B.
12

A B C D E
Frequency (J,CbrCal (J,XmtCbl H(f)(MHz) (dB) (dB) (dB)
300.00 -8.33 -1.33 -7.00
301.17 -8.50 -1.33 -7.17
302.34 -7.00 -1.33 -5.67
303.51 -8.00 -1.50 -6.50
304.67 -8.00 -1.50 -6.50
305.84 -7.50 -1.50 -6.00
Figure 12. Chamber calibration spreadsheet with transmit cable loss and calculated H(f).
The spreadsheet below is a portion of the emissions data from the DUT implementing the screensaver.
Column E, true TRP from the DUT, is the summation of subtracting column D (H(f)) from column B,Measured data.
A
Frequency(MHz)
300.00
301.17
302.34
303.51
304.67
305.84
307.01
Figure 13. Sample file
B C D E
PMeas H(_ PTRP
(dBm) (dB) (dBm)
-71.33 -7.00 -64.33
-72.00 -7.17 -64.83
-72.17 -5.67 -66.50
-70.67 -6.50 -64.17
-71.17 -6.50 -64.67
-71.50 -6.00 -65.50
-73.67 -4.83 -68.83
with the normalized amplitudes (total radiated power)
Analysis of Results
The Federal Communications Commission (FCC) limit line illustrated in the graphs is an estimated
radiated emissions value. Estimated values were taken from Title 47, FCC 15.209 three meter emission
limit. The limits given by the FCC are in microvolts/meter. In order to compare these figures to the
laptop emission graphs, field strength measurements were converted to radiated power assuming an
isotropic radiation pattern [ 1].
E 2* 4a-R 2Pt - (5)
120_
E2
= -- watts, when R= 1 meter (6)30
where Pt = Equivalent Radiated Power Watts
E = Measured Field Strength V°ltS/mete r
R = Distance m
13

This furnished the total radiated power values for a 1 m limit (dBm) used to construct the estimationline.
-10
-2O
-3O
-£m -40
_- -50E<
-6O
-7O
-8O
-9O
--All laptops--SA Noise Floor
....... Laptop 3
....... Laptop 2
........Laptop 4
Laptop 1-------FCC Limit
I
I I I
I I I
I I I
I I I
I I I
I
I
I I
I I
I I
I I
I
I
I
i i i
I I I
I I I
I I I
I I I I I I I Ii i i
FCC Estimated
Limit Line
100 590 1080 1570 2060 2550 3040 3530 4020 4510 5000
Frequency (MHz)
Figure 14. Screensaver emissions graph.
Laptop, unintentional transmitter, emissions produced in the lower frequencies (100MHz to 1.1GHz)exceeded or remained just under the estimated limit line. Since aeronautical radio commtmication and
navigation equipment operate in designated bandwidths within 100MHz to 1100MHz bands, there may berisk of interference from the peaks depicted in Figure 14. RF generated from the laptop may causeinterference if coupling were to occur with select aeronautical frequency bands.
Another result from the baseline tests revealed that each computer has its own unique signature. A
computer signature is a discemable pattern created by levels of maximum peak radiated power at variousfrequencies. This is possibly due to the variety of shielding techniques used by manufacturers to protect
the computer's internal components. Moreover, within the given signature, different activities induceddiversified RF emission levels. Appendix A contains graphs for the four laptops tested.
The graphs for the wireless LAN tests exposed a few relatively high emissions with respect to the FCClimit line from laptops performing file transfers while the access point was connected to the wired
network. Again, the emissions are concentrated in the lower frequency band in both Figure 14 and Figure15. Note that the spike is acceptable at approximately 2.46 GHz because the 802.1 lb Access Point is
designated to operate at this frequency. The same is true for Bluetooth's several spikes in the range of2.402 GHz - 2.482 GHz. In addition, the FCC estimated limit shown on the graph is a general restriction
for non-intentional and intentional RF emissions, but does not pertain to the designated carrier frequencysignal band for 802.1 lb and Bluetooth systems.
14

0
-10
-20
-30
-g-40
_. -50E
-60
i
SA Noise Floor
.......Access PointNoise Floor
....... FileTransfer 1 L3to L2
---- FileTransfer 2 L2to L3
FCCLimit
II
FCC Estimated
Limit Line
-70
-80
-9O
100 590 1080 1570
Figure 15.
2060 2550 3040 3530 4020
Frequency (MHz)
802. l lb graph for Infrastructure file transfer.
4510 5OOO
-10
-15
-20
-25
-30
-35
-40
"_ -45
.-e_Q- -50E
-55
-60
-65
-70
-75
-80
'-- --Antenna inside NIC:E....... Antenna out and vertical
_'"'"" Bluetooth Specification Ver 1.1'__-- FCC Limit Line
FCC Estimated
Limit Line
-85
-90
100 450 800 1150 1500 1850 2200 2550 2900 3250 3600 3950 4300Frequency (MHz)
Figure 16. Bluetooth emissions while transferring files
4650 5000
15

If these technologies were to be permitted for use on board a commercial aircraft it is likely they
would be required to pass RTCA DO-160D Category M, Airborne Equipment Qualification Limits for
out of band emissions. The standard states equipment and wiring located in a passenger cabin and cockpit,
not directly in view of aircraft radio receiver antennas are permitted when the emissions do not exceed the
limits. VOR, Localizer, VHF Comm., Glideslope, TCAS, ATCRBS, GPS, and SatCom are in lower
frequency bands where spurious emissions from the laptops/WLAN tend to be concentrated.
Conclusions
This preliminary study of emissions from laptop computers and wireless LAN technology provides a
foundation for further testing. Tests spanned a broad frequency range for a general overview of spurious
emissions from the DUTs. Analysis of this data was for electromagnetic interference (EMI) assessments
for aircraft systems and other equipment as well.
It is evident that computers are the main source of significant radiated emissions. The screensaver
emissions' graph illustrated this conclusion. 802.1 lb and Bluetooth devices tested emit a relatively small
level of emissions that are added to those emitted by the computers, since WLANs assist computers in
creating or maintaining a network and do not function on their own.
Further study with laptop computers and wireless networks will be necessary in order to determine if
the spurious emissions will indeed affect radio navigation equipment on a commercial airplane. The tests
will focus on the narrow frequency bands specific to VOR, Glideslope, TCAS, GPS, etc. Further tests of
802.1 lb and Bluetooth enabled devices in radio navigation bands will include: several 802.1 lb units or
Bluetooth units linked in commtmication; simultaneous operation of both wireless technologies in the
chamber; changing modulation techniques, power setting, and channels as they apply to the appropriate
wireless network. The final goal is to formulate a well-devised test plan, which will rigorously test
WLANs and laptops being considered for aircraft use by passengers.
16

[11
[21
[31
[41
[51
[61
[71
[81
[91[101
References
RTCA/DO-233, "Portable Electronic Devices Carried on Board Aircraft", August 1996.
Goldsmith, Kevin, "Reverberation Chamber What are they?", IEEE International Symposium on
Electromagnetic Compatibility, Seattle, WA, August 1999.
Ladbury, John, Koepke, Galen, Camell, Dennis, "Evaluation of the NASA Langley Research Center Mode-
Stirred Chamber Facility", NIST Technical Note 1508, January 1999.
Crawford, M.L., Koepke, G.H., "Design, Evaluation, and Use of a Reverberation Chamber for Performing
Electromagnetic Susceptibility/Vulnerability Measurements"; NIST Technical Note 1092, April 1986.
Liu, Bing-Hope, Chang, David C., Ma, Mark T., "Eigenmodes and the Composite Quality Factor of aReverberating Chamber", NBS Technical Note 1066, August 1983.
Dell Computer Corporation, "Deploying 802.1 lb (Wi-Fi) in the Enterprise Network", Vectors White Paper,
2001. _)://wwwdeil.com/t;s/er_/_ics/vectors 200 I-wireless _l_wmetat.btm
Mobilian Corporation, "Wi-Fi TM (802.1 lb) and BluetoothTM: An Examination of Coexistence Approaches",
White Paper, Hillsboro, OR, 2001.
A.H Systems Inc. "Antenna Calibration Data", Chatsworth, CA, May 1995. Section 1.
AU-Systems, "Bluetooth White Paper", wwwoau_s2_n, January 2000.
Symbol Technologies, "Bluetooth: The Leading Edge in Wireless Personal Area Networking", WhitePaper, Holtsville, NY, May 2001.
17

Appendix A: Baseline Test Results from the Laptops
Graphs depicted in this section provide each brand of laptops' envelope of emitted maximum radiated
peaks. Furthermore, wireless data can be
emissions added to the laptop levels.
superimposed on these graphs to deduce the amount of
0.00
-10.00
-20.00
A -30.00 -E
I11
L1
r- -, T I F T - 'I I I I I I I I
I I I I I I I I
I II I I I I I
I I I I I I
I I I I I I
I I I I I I
I I I I I I
I I I I I I
I I I I I I
I I I I I I
I I I I I I
I I I I I I
I I I I I I
I I I I I I
......... Intern Tran
........ Screensaver
_-- Noise Floor
--FCC Est LimitI I
I I
I I
I I
I I
-40.00
-50.00
-60.00 -
-70.00 -
-80.00 -
-90.00
-100.00
100.00
I I I I I I I I I
I _ I I I I I I I I
I i I I I I I I I I • _. .t.
_:. ............................ _ ___:_
i : I I I I " " ' " '1 I I I
_ _ _ i :1 i_ : " I I I I I I
: _:::::_1" ........: ,.: :_= ::+x, ._ I I I I I I I I
i_ iii_:_:'_ I I I I I I I Iiii I I I I I I I I
NI_ r : T T r : T TI I I I I I I I I
I I I I I I I I I
I I I I I I I I I
I I I I I I I I I
I I I I I I I I I
I I I I I I I I I
I I I I I I I I I
590.00 1080.00 1570.00 2060.00 2550.00 3040.00 3530.00 4020.00 4510.00 5000.00
Frequency (MHz)
0
"O¢
I--
0.00 -
-10.00
-20.00
-30.00
L2
I I I I I I I I I
I I I I I I I I I
I I I I I I I I I
I I I I I I --Audio CD I
I I I I I I
I I I I I I
I I I I I I
I I I I I I
I I I I I I
I I I I I I
I I I I I I
I I I I I I
I I I I I I
I I I I I I
--------Intern Tran
--HD to MD.........Screensaver
-FCC Est LimitI I
I I
I I
I I
-40.00 - I I I I I I I I II " T r 1" [" "f YI _ I I I I I I I
I _ I I I I I I I I
................................... i L i L i L _-_ _': _si_._#!_F_ [email protected] _ ,._ _,_ __%._,,.,.,. :_,._.,
, , , , , "_.-'.{,__:_ ,.,'_._::_ _ "__ :....
I I I I 5N&! ._, ._g';$:;:" '1 I I I
I I I . . I ' _:;_:_i I I I I-60.00 _ y_'_x !_ : I "- _ _ ]
I • i_ I t_ _._j:_: _.'_ I I I I I I
1 I • il li _ l_ ,::If _i!_:: / ,. _::_i'_?:_ " I .....
-70.00 i_ _ .u/_i_i_i_?l:_:_l_i_i_:t_!h":'_" r T r T r _ F_} )i."} ,_:_._{._i_£_._!_;:_" I I I I I I I I
_ii I_ iiiiiiiil l !iliiiiii _" I I I I I I I I
_ _<_:_ ........-80.00 - _ _ r T r T r T r _ r
I I
I I
I I
I I
I I
I I
I I
I I
I I
-90.00 , , , , , ,I I I I I I
I I I I I I
I I I I I I
-100.00
100.00 590.00 1080.00 1570.00 2080.00 2550.00 3040.00
Frequency (MHz)
18
I I
I I
I I
i i
I I
I I
I I
3530.00 4020.00 4510.00 5000.00

0.00 •
-10.00
-20.00
-100.00
100.00
L3
I I I I I I I I I
I I I I I I I
I I I I I I I
590.00
I I I I I I
I I I I I I
I I I I I I
I I I I I I
I I I I I I
I I I I I I
I I I I I I
I I I I I I I I •
I I I I I I I I
I I I I I I I I
I I I I I I I I
I I I I I I I I
--Audio CD
-- Intern Tran
--------HD to MD
--------Screensaver
_ --Noise Floor
-------"FCC Est Limit
1080.00 1570.00 2060.00 2550.00 3040.00 3530.00 4020.00 4510.00 5000.00
Frequency (MHz)
0.00
-10.00
-20.00
-30.00
-40.00
0
-50.00-¢
-60.00
-70.00
L4
I I I I I I
I I I I I I
I I I I I I
I I I I I I
I I I I I I
I I I I I I
I I I I I I
I I I I I I
I I I I I I
I I I I I I
I I I I I I
I I I I I I
I I I I I I
I I I I I I
I I I I I I
I I I I I I
I I I I I I
I
I
I I
I
--Audio CD I
......... Intern Tran i
i
................Screensaver I
I
.........Noise Floor I
--FCC Est Limit II
I I I
I I I
I I I
I I I
I I I
I I
I
-100.00-
100.00 590.00 1080.00 1570.00 2060.00 2550.00 3040.00
Frequency (MHz)
3530.00 4020.00 4510.00 5000.00
19

REPORT DOCUMENTATION PAGE Form ApprovedOMB No 0704-0188
Public reporting burden for this collection of information is estimated to average 1 hour per response, including the time for reviewing instructions, searching existing datasources, gathering and maintaining the data needed, and completing and reviewing the collection of information. Send comments regarding this burden estimate or any otheraspect of this collection of information, including suggestions for reducing this burden, to Washington Headquarters Services, Directorate for Information Operations andReports, 1215 Jefferson Davis Highway, Suite 1204, Arlington, VA 22202-4302, and to the Office of Management and Budget, Paperwork Reduction Project (0704-0188),Washington, DC 20503.
1. AGENCY USE ONLY (Leave blank) 2. REPORT DATE 3. REPORT TYPE AND DATES COVERED
October 2002 Contractor Report
4. TITLE AND SUBTITLE 5. FUNDING NUMBERS
Investigation of RF Emissions From Wireless Networks as a Threat toAvionic Systems
6. AUTHOR(S)Maria Theresa P. Salud
7. PERFORMING ORGANIZATION NAME(S)AND ADDRESS(ES)
Lockheed Martin Corporation Langley Program OfficeLangley Research CenterHampton, VA 23681-2199
9. SPONSORING/MONITORING AGENCY NAME(S) AND ADDRESS(ES)
National Aeronautics and Space AdministrationLangley Research Center
Hampton, VA 23681-2199
NAS1-00135722-64-10-53
8. PERFORMING ORGANIZATIONREPORT NUMBER
10. SPONSORING/MONITORING
AGENCY REPORT NUMBER
NASA/CR-2002-211941
11. SUPPLEMENTARY NOTES
Langley Technical Monitor: Reuben A. Williams
12a. DISTRIBUTION/AVAILABILITY STATEMENT
Unclassified-Unlimited
Subject Category 32 Distribution: StandardAvailability: NASA CASI (301) 621-0390
12b. DISTRIBUTION CODE
13. ABSTRACT (Maximum 200 words)
The paper focuses on understanding and obtaining preliminary measurements of radiated field (RF) emissions oflaptop/wireless local area network (WLAN) systems. This work is part of a larger research project to measureradiated emissions of wireless devices to provide a better understanding for potential interference with crucialaircraft avionics systems. A reverberation chamber data collection process is included, as well asrecommendations for additional tests. Analysis of measurements from devices under test (DUTs) provedinconclusive for addressing potential interference issues. Continued effort is expected to result in a completeeasily reproducible test protocol. The data and protocol presented here are considered preliminary.
14. SUBJECT TERMS
Wireless Local Area Network, Emissions, EMI, Aircraft Avionics
17. SECURITY CLASSIFICATIONOF REPORT
Unclassified
18. SECURITY CLASSIFICATIONOF THIS PAGE
Unclassified
19. SECURITY CLASSIFICATIONOF ABSTRACT
Unclassified
15. NUMBER OF PAGES
2416. PRICE CODE
20. LIMITATIONOF ABSTRACT
UL
NSN 7540-01-280-5500 Standard Form 298 (Rev. 2-89)Prescribed by ANSI Std Z-39-18298-102


