
April 2019
Investor Presentation

The Private Securities Litigation Reform Act of 1995 provides a “safe harbor” for forward-looking statements. Certain information included in this presentation contains statements that are forward-looking, such as statements relating to
results of operations and financial conditions and business development activities, as well as capital spending and financing sources. Such forward-looking
information involves important risks and uncertainties that could significantly affect anticipated results in the future and, accordingly, such results may differ materially from those expressed in any forward-looking statements made by or
on behalf of Mercer. For more information regarding these risks and uncertainties, review Mercer’s filings with the United States Securities and
Exchange Commission. Unless required by law, we do not assume any obligation to update forward-looking statements based on unanticipated events or changed
expectations
The historical pro forma information respecting our acquisition of DMI included herein is not necessarily indicative of our future operating results or combined
financial position. Such pro forma information should be read together with the unaudited pro forma consolidated financial statements included in our Form 8-K
dated December 14, 2018 and the notes thereto
3
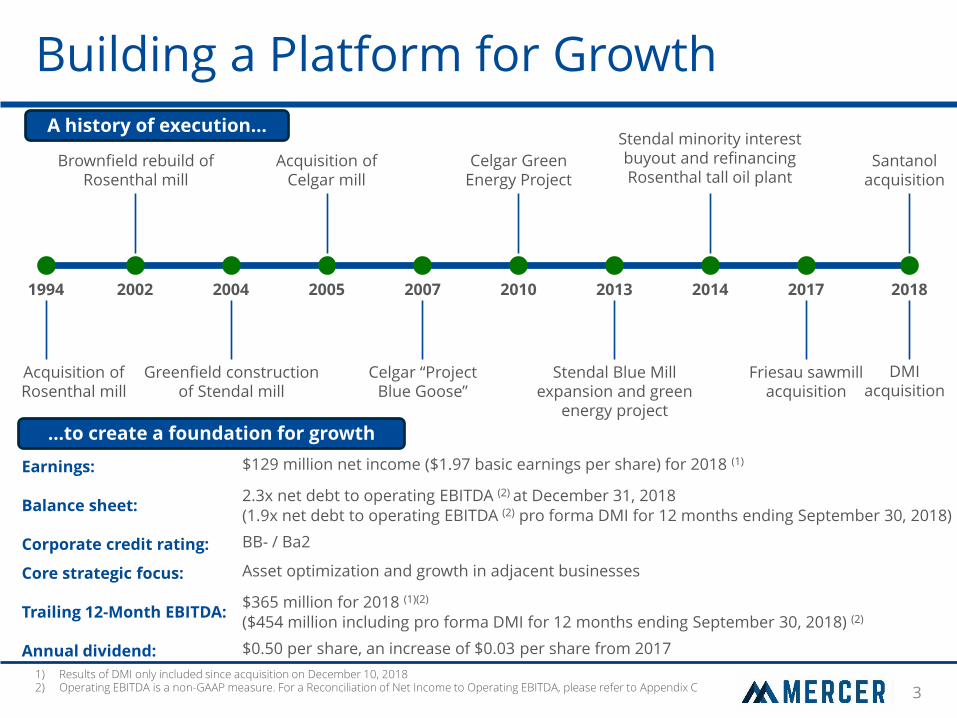
Earnings: $129 million net income ($1.97 basic earnings per share) for 2018 (1)
Balance sheet: 2.3x net debt to operating EBITDA (2) at December 31, 2018
(1.9x net debt to operating EBITDA (2) pro forma DMI for 12 months ending September 30, 2018)
Corporate credit rating: BB- / Ba2
Core strategic focus: Asset optimization and growth in adjacent businesses
Trailing 12-Month EBITDA: $365 million for 2018 (1)(2) ($454 million including pro forma DMI for 12 months ending September 30, 2018) (2)
Annual dividend: $0.50 per share, an increase of $0.03 per share from 2017
Building a Platform for Growth
…to create a foundation for growth
1) Results of DMI only included since acquisition on December 10, 2018 2) Operating EBITDA is a non-GAAP measure. For a Reconciliation of Net Income to Operating EBITDA, please refer to Appendix C
Acquisition of Rosenthal mill
2002
Brownfield rebuild of Rosenthal mill
1994
Greenfield construction of Stendal mill
2005 2014 2010 2004 2007 2017 2013
Acquisition of Celgar mill
Celgar “Project Blue Goose”
Celgar Green Energy Project
Stendal Blue Mill expansion and green
energy project
Stendal minority interest buyout and refinancing Rosenthal tall oil plant
Friesau sawmill acquisition
A history of execution…
2018
Santanol acquisition
DMI acquisition

4
Peace River 475,000 tonnes
NBSK/NBHK
65 MW energy
Celgar 520,000 tonnes NBSK
100 MW energy
Rosenthal 360,000 tonnes NBSK
57 MW energy
$1.4 million bio-extractives (2)
Stendal 660,000 tonnes NBSK
148 MW energy
$13 million bio-extractives (2)
Friesau 550,000 Mfbm lumber
13 MW energy
Cariboo 170,000 tonnes NBSK (1)
28.5 MW energy (1)
Santanol 2,500 hectares of Indian Sandalwood
A Diverse & Complimentary Growth Business
1) Represents Mercer’s 50% share of operations 2) Year ended December 31, 2018 by revenue
Sales Mix
US
30%
EU
56%
Other
14%
Wood Products(2)
China
25%
EU
54%
Other
21%
NBSK Pulp(2)
Japan
33%
China
28%
Other
16%
North
America
23%
NBHK Pulp
Combined, our Pulp and Wood Products segment include $74 million in green energy and $15 million in bio-extractives revenue

5
$95 $93 $92
$101
$87 $84
$101
$89
-
$25
$50
$75
$100
$125
2011 2012 2013 2014 2015 2016 2017 2018
Re
ve
nu
e (
$ m
illio
ns)
Bio-Chemicals Energy
Energy & Bio-Chemical Revenue
-
200
400
600
800
1,000
Ave
rag
e M
ill C
ap
aci
ty (
00
0 t
on
ne
s)
APP (Paper
Excellence)
Mercer
International
Paper
(Ilim)
Metsä
Fibre
Södra
Cell
BillerudKorsnäs
Canfor
Pulp
Domtar
SCA
UPM Resolute
IP
Aditya Birla
Nanaimo Heinzel
Catalyst
Mondi
10152025303540455055Average Technical Age (years)
NBSK Producer Competitiveness (1)(2)
Stora Enso
Metsä Board
Our pulp operations are some of the largest and most modern facilities in the world
• Low production cost
• Low maintenance capital requirements
1) Source: FisherSolve Q4 2018. Mercer includes Peace River, excludes 50% interest in Cariboo. SCA, Metsa Fibre reflect completion of ramp-up of Östrand and Äänekoski
2) NBSK market pulp only 3) Friesau reflects estimated annualized pro forma revenue based on 2017 operating results, excluding synergies 4) Results of DMI only included since acquisition on December 10, 2018
Continuously Improving, Competitive Pulp Mills
West Fraser
• Strong environmental performance
• Net energy exporters
(3) (4)
6
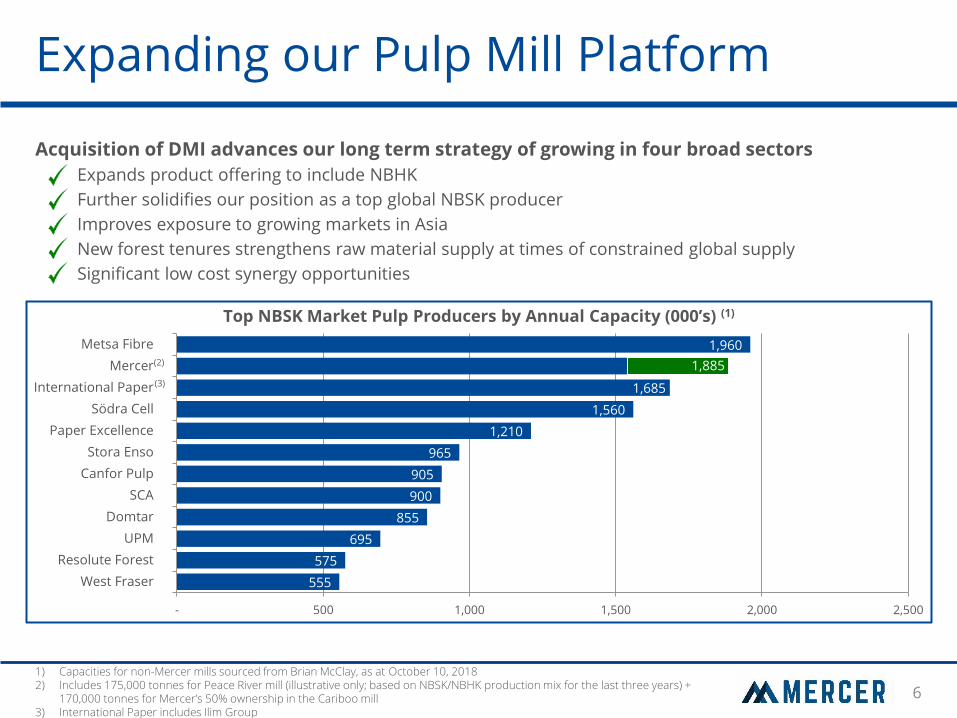
Expanding our Pulp Mill Platform
Acquisition of DMI advances our long term strategy of growing in four broad sectors
Expands product offering to include NBHK
Further solidifies our position as a top global NBSK producer
Improves exposure to growing markets in Asia
New forest tenures strengthens raw material supply at times of constrained global supply
Significant low cost synergy opportunities
1) Capacities for non-Mercer mills sourced from Brian McClay, as at October 10, 2018 2) Includes 175,000 tonnes for Peace River mill (illustrative only; based on NBSK/NBHK production mix for the last three years) +
170,000 tonnes for Mercer’s 50% ownership in the Cariboo mill 3) International Paper includes Ilim Group
555
575
695
855
900
905
965
1,210
1,560
1,685
1,885
1,960
- 500 1,000 1,500 2,000 2,500
West Fraser
Resolute Forest
UPM
Domtar
SCA
Canfor Pulp
Stora Enso
Paper Excellence
Södra Cell
International Paper
Mercer
Metsa Fibre
Top NBSK Market Pulp Producers by Annual Capacity (000’s) (1)
(3)
(2)

7
Friesau Sawmill: Building on Success
Friesau – a strong entry into the global softwood lumber market
Comparable size to some of the largest sawmills in North America
Capable of producing green, kiln-dried and planed lumber for all global markets
Announced expansion and optimization project designed to increase production capacity to ~750 Mfbm
550
-
100
200
300
400
500
600
700
800
900
Ilim
Wis
ma
r
Ca
nfo
r P
late
au
Ca
nfo
r H
ou
sto
n
We
st F
rase
r
Qu
esn
el
Me
rce
r Fri
esa
u
Bin
de
rho
lz
Kö
sch
ing
Off
ne
r W
olf
be
rg
Ilim
La
nd
sbe
rg
Du
nk
ley
Co
nif
ex
Ma
cke
nzi
e
Ba
ur
Ho
lz
Po
stst
raß
e
WY
Lo
ng
vie
w
Sch
we
igh
ofe
r
Se
be
s
Sch
we
igh
ofe
r
Ra
da
uti
An
te-H
olz
Ro
ttle
be
rod
e
An
te-H
olz
So
mp
lar
WY
Co
tta
ge
Gro
ve
Ilim
Ust
-Ilim
sk
Ch
ug
ok
u
Hir
osh
ima
Ch
ug
ok
u K
ash
ima
Mfb
m
North America Europe Other
Top 20 Largest Softwood Sawmills (1)
Increase to ~750
Note: Converted from m3 to board feet at a rate of 1.6 m3 per board foot 1) Source: Sawmill capacities as per www.sawmilldatabase.com
8
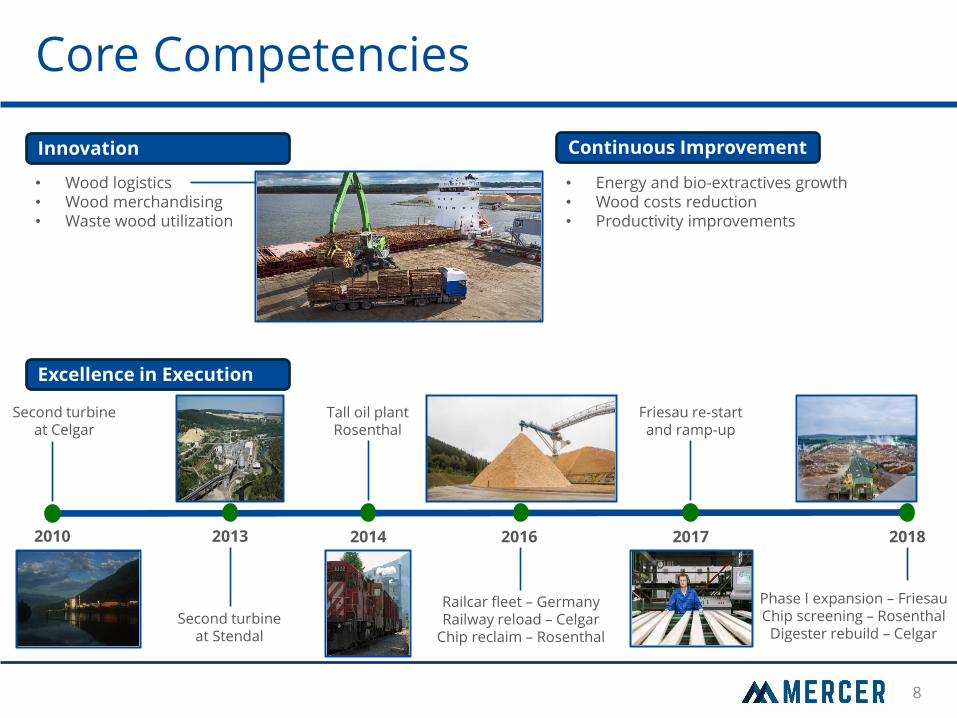
Core Competencies
• Wood logistics • Wood merchandising • Waste wood utilization
• Energy and bio-extractives growth • Wood costs reduction • Productivity improvements
Second turbine at Stendal
2014
Tall oil plant Rosenthal
2013
Railcar fleet – Germany Railway reload – Celgar
Chip reclaim – Rosenthal
2017 2016 2018
Friesau re-start and ramp-up
Phase I expansion – Friesau Chip screening – Rosenthal
Digester rebuild – Celgar
Innovation Continuous Improvement
Excellence in Execution
2010
Second turbine at Celgar
9
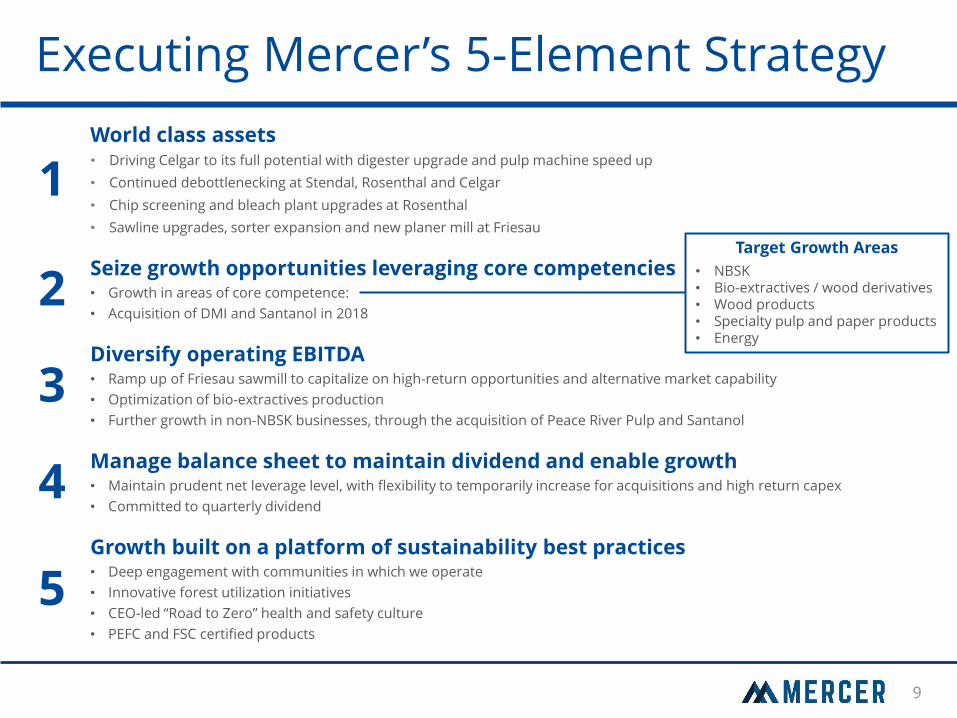
Executing Mercer’s 5-Element Strategy
1 World class assets • Driving Celgar to its full potential with digester upgrade and pulp machine speed up
• Continued debottlenecking at Stendal, Rosenthal and Celgar
• Chip screening and bleach plant upgrades at Rosenthal
• Sawline upgrades, sorter expansion and new planer mill at Friesau
2 Seize growth opportunities leveraging core competencies • Growth in areas of core competence:
• Acquisition of DMI and Santanol in 2018
3 Diversify operating EBITDA
• Ramp up of Friesau sawmill to capitalize on high-return opportunities and alternative market capability
• Optimization of bio-extractives production
• Further growth in non-NBSK businesses, through the acquisition of Peace River Pulp and Santanol
4 Manage balance sheet to maintain dividend and enable growth • Maintain prudent net leverage level, with flexibility to temporarily increase for acquisitions and high return capex
• Committed to quarterly dividend
5 Growth built on a platform of sustainability best practices • Deep engagement with communities in which we operate
• Innovative forest utilization initiatives
• CEO-led “Road to Zero” health and safety culture
• PEFC and FSC certified products
Target Growth Areas
• NBSK • Bio-extractives / wood derivatives • Wood products • Specialty pulp and paper products • Energy
10
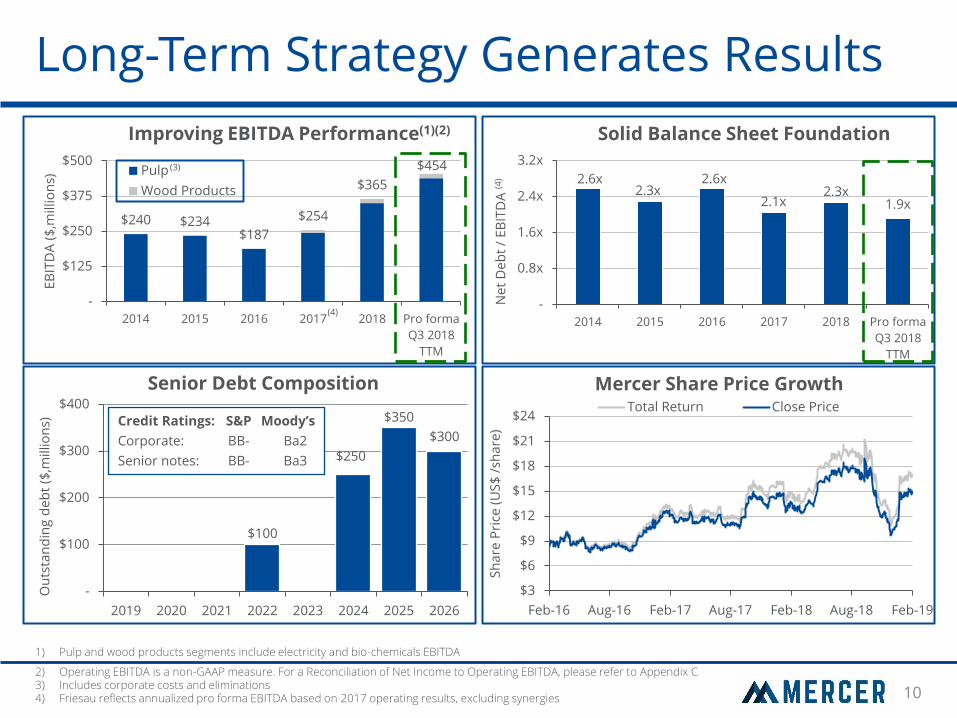
$240 $234 $187
$254
$365
$454
-
$125
$250
$375
$500
2014 2015 2016 2017 2018 Pro forma
Q3 2018
TTM
EB
ITD
A (
$,m
illio
ns)
Improving EBITDA Performance(1)(2)
Pulp
Wood Products
Long-Term Strategy Generates Results
1) Pulp and wood products segments include electricity and bio-chemicals EBITDA
2) Operating EBITDA is a non-GAAP measure. For a Reconciliation of Net Income to Operating EBITDA, please refer to Appendix C 3) Includes corporate costs and eliminations 4) Friesau reflects annualized pro forma EBITDA based on 2017 operating results, excluding synergies
(4)
$100
$250
$350
$300
-
$100
$200
$300
$400
2019 2020 2021 2022 2023 2024 2025 2026
Ou
tsta
nd
ing
de
bt
($,m
illio
ns)
Senior Debt Composition
Credit Ratings: S&P Moody’s
Corporate: BB- Ba2
Senior notes: BB- Ba3
$3
$6
$9
$12
$15
$18
$21
$24
Feb-16 Aug-16 Feb-17 Aug-17 Feb-18 Aug-18 Feb-19
Sh
are
Pri
ce (
US
$ /
sha
re)
Mercer Share Price Growth Total Return Close Price
2.6x 2.3x
2.6x
2.1x 2.3x
1.9x
-
0.8x
1.6x
2.4x
3.2x
2014 2015 2016 2017 2018 Pro forma
Q3 2018
TTM
Ne
t D
eb
t /
EB
ITD
A (4
)
Solid Balance Sheet Foundation
(3)
11
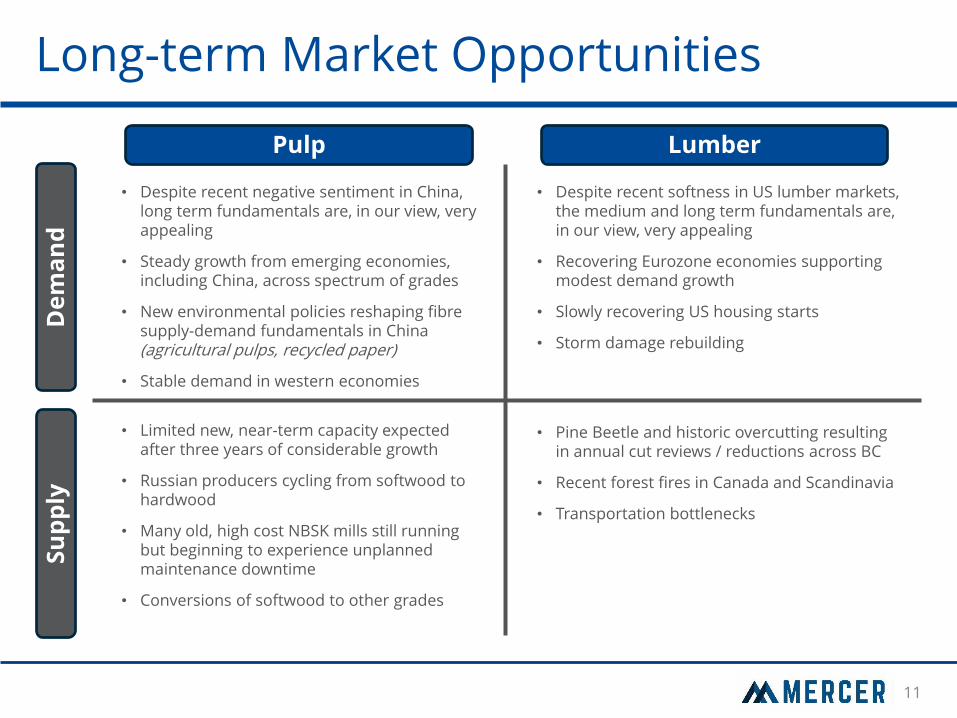
Long-term Market Opportunities
Pulp Lumber
• Despite recent negative sentiment in China, long term fundamentals are, in our view, very appealing
• Steady growth from emerging economies, including China, across spectrum of grades
• New environmental policies reshaping fibre supply-demand fundamentals in China (agricultural pulps, recycled paper)
• Stable demand in western economies
• Despite recent softness in US lumber markets, the medium and long term fundamentals are, in our view, very appealing
• Recovering Eurozone economies supporting modest demand growth
• Slowly recovering US housing starts
• Storm damage rebuilding
• Limited new, near-term capacity expected after three years of considerable growth
• Russian producers cycling from softwood to hardwood
• Many old, high cost NBSK mills still running but beginning to experience unplanned maintenance downtime
• Conversions of softwood to other grades
• Pine Beetle and historic overcutting resulting in annual cut reviews / reductions across BC
• Recent forest fires in Canada and Scandinavia
• Transportation bottlenecks
De
ma
nd
S
up
ply

12
Mercer: Sustainable, Profitable Growth
Attractive long-term fundamentals in key markets
Management committed to growth, in spaces where we have clear competencies
Consistent investor return, commitment to the dividend
Strong balance sheet discipline, within solid parameters
Commitment to best practices in sustainability and operational excellence, a strong foundation for long term value creation

Appendix A Market Primer

14
NBSK, NBHK Market Primer Overview
Softwood Kraft
44%
Other
0%
Hardwood Kraft
56%
Birch
3%
BEK
68%
Asian
HW
17% NBHK
9%(2)
SBHK
3% NBSK
59%(3)
Radiata
13%
SBSK /
Fluff
28%
Chemical Pulp Demand (1)
(58 million tonnes)
Bleached Hardwood Kraft Pulp Demand (1)
(32 million tonnes)
Bleached Softwood Kraft Pulp Demand (1)
(26 million tonnes)
1) Source: Hawkins Wright (December 2018) for 2017A 2) 2017A NBHK demand ~3.0 million tonnes 3) 2017A NBSK demand ~15.1 million tonnes
Northern Bleached Softwood Kraft (“NBSK”) is produced from spruce, pine, fir and cedar grown primarily in Canada, Northern Europe and North-Central Russia
NBSK and NBHK Key End Uses
Tissue, printing and writing paper and specialties
Northern Bleached Hardwood Kraft (“NBHK”) is produced from aspen, maple, balsam, birch and beech grown primarily in Southern Canada, Russia and Northern Europe
NBSK Characteristics
• Long fiber length yielding high tensile strength
• High fiber diameter yielding good bonding surface
• Low cell wall thickness yielding high flexibility
NBHK Characteristics
• Short fiber length yielding low tensile strength
• Strong optical, opacity and bulk qualities
• High cell wall thickness yielding low flexibility
15
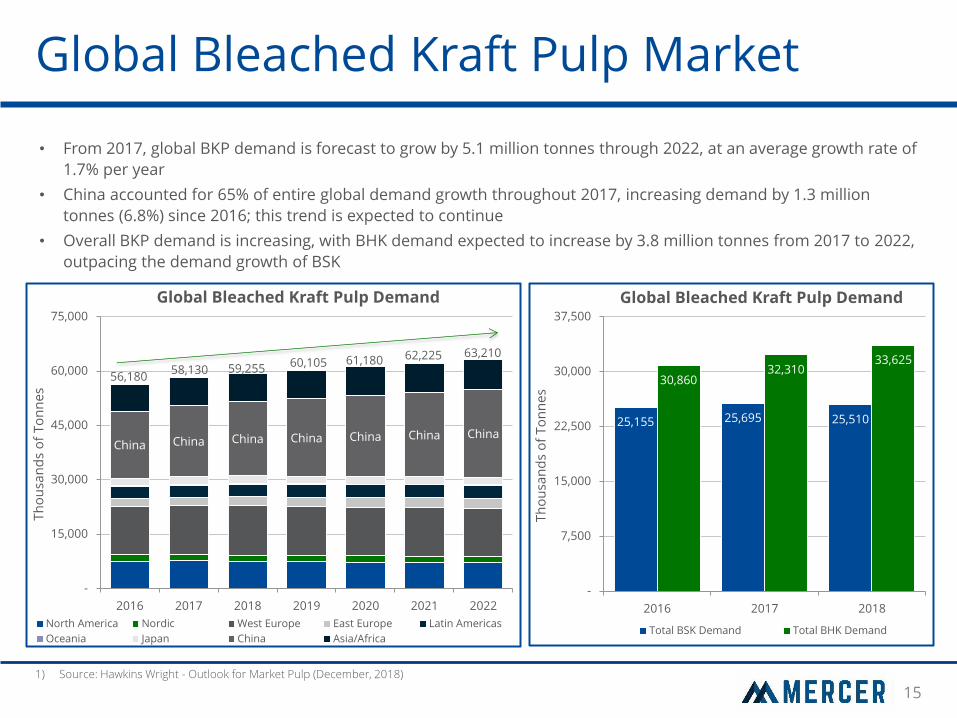
Global Bleached Kraft Pulp Market
• From 2017, global BKP demand is forecast to grow by 5.1 million tonnes through 2022, at an average growth rate of
1.7% per year
• China accounted for 65% of entire global demand growth throughout 2017, increasing demand by 1.3 million
tonnes (6.8%) since 2016; this trend is expected to continue
• Overall BKP demand is increasing, with BHK demand expected to increase by 3.8 million tonnes from 2017 to 2022,
outpacing the demand growth of BSK
25,155 25,695 25,510
30,860 32,310
33,625
-
7,500
15,000
22,500
30,000
37,500
2016 2017 2018
Th
ou
san
ds
of
To
nn
es
Global Bleached Kraft Pulp Demand
Total BSK Demand Total BHK Demand
China China China China China China China
56,180 58,130 59,255 60,105 61,180 62,225 63,210
-
15,000
30,000
45,000
60,000
75,000
2016 2017 2018 2019 2020 2021 2022
Th
ou
san
ds
of
To
nn
es
Global Bleached Kraft Pulp Demand
North America Nordic West Europe East Europe Latin Americas
Oceania Japan China Asia/Africa
1) Source: Hawkins Wright - Outlook for Market Pulp (December, 2018)
16
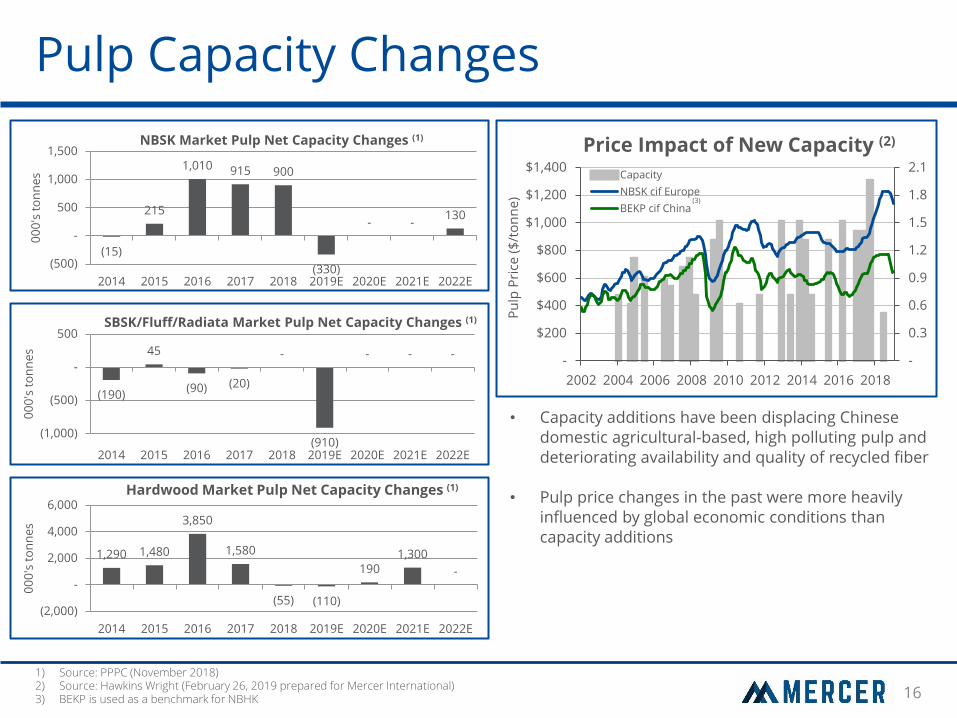
Pulp Capacity Changes
1) Source: PPPC (November 2018) 2) Source: Hawkins Wright (February 26, 2019 prepared for Mercer International) 3) BEKP is used as a benchmark for NBHK
• Capacity additions have been displacing Chinese domestic agricultural-based, high polluting pulp and deteriorating availability and quality of recycled fiber
• Pulp price changes in the past were more heavily influenced by global economic conditions than capacity additions
(15)
215
1,010 915 900
(330)
- - 130
(500)
-
500
1,000
1,500
2014 2015 2016 2017 2018 2019E 2020E 2021E 2022E
00
0's
to
nn
es
NBSK Market Pulp Net Capacity Changes (1)
(190)
45
(90) (20)
-
(910)
- - -
(1,000)
(500)
-
500
2014 2015 2016 2017 2018 2019E 2020E 2021E 2022E
00
0's
to
nn
es
SBSK/Fluff/Radiata Market Pulp Net Capacity Changes (1)
1,290 1,480
3,850
1,580
(55) (110)
190 1,300
-
(2,000)
-
2,000
4,000
6,000
2014 2015 2016 2017 2018 2019E 2020E 2021E 2022E
00
0's
to
nn
es
Hardwood Market Pulp Net Capacity Changes (1)
-
0.3
0.6
0.9
1.2
1.5
1.8
2.1
-
$200
$400
$600
$800
$1,000
$1,200
$1,400
2002 2004 2006 2008 2010 2012 2014 2016 2018
Pu
lp P
rice
($
/to
nn
e)
Price Impact of New Capacity (2)
Capacity
NBSK cif Europe
BEKP cif China(3)
17
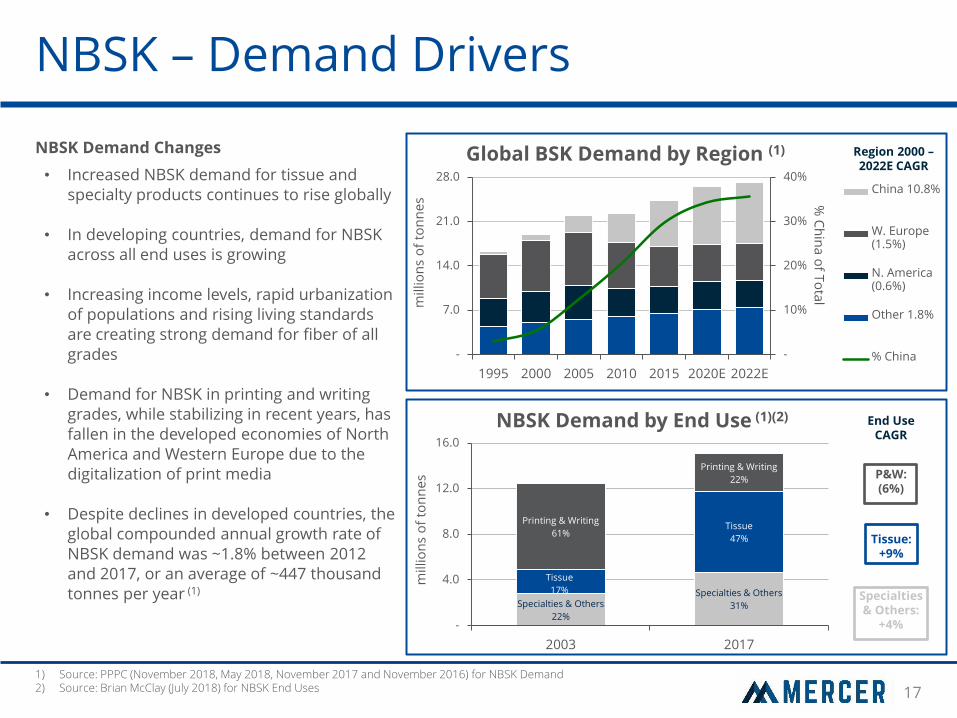
NBSK – Demand Drivers
NBSK Demand Changes
• Increased NBSK demand for tissue and specialty products continues to rise globally
• In developing countries, demand for NBSK across all end uses is growing
• Increasing income levels, rapid urbanization of populations and rising living standards are creating strong demand for fiber of all grades
• Demand for NBSK in printing and writing grades, while stabilizing in recent years, has fallen in the developed economies of North America and Western Europe due to the digitalization of print media
• Despite declines in developed countries, the global compounded annual growth rate of NBSK demand was ~1.8% between 2012 and 2017, or an average of ~447 thousand tonnes per year (1)
Specialties & Others
22%
Specialties & Others
31%
Tissue
17%
Tissue
47%
Printing & Writing
61%
Printing & Writing
22%
-
4.0
8.0
12.0
16.0
2003 2017
millio
ns
of
ton
ne
s NBSK Demand by End Use (1)(2)
-
10%
20%
30%
40%
-
7.0
14.0
21.0
28.0
1995 2000 2005 2010 2015 2020E 2022E
% C
hin
a o
f To
tal m
illio
ns
of
ton
ne
s
Global BSK Demand by Region (1)
China 10.8%
W. Europe (1.5%)
N. America (0.6%)
Other 1.8%
% China
Region 2000 – 2022E CAGR
1) Source: PPPC (November 2018, May 2018, November 2017 and November 2016) for NBSK Demand 2) Source: Brian McClay (July 2018) for NBSK End Uses
End Use CAGR
P&W: (6%)
Tissue: +9%
Specialties & Others:
+4%

18
-
1.5
3.0
4.5
6.0
7.5
2007 2010 2013 2015 2017
millio
ns
on
to
nn
es
China’s BSK Pulp Demand by End Use (4)
Other – 7.5%
P&W Papers – 5.7%
Specialty Papers – 8.9%
Paperboard – 14.5%
Tissue – 16.6%
Fastest Growth
NBSK – The Chinese Market
China is the leader of demand growth in
developing economies
• In China, demand for NBSK grew on average by 9.3% between 2010 and 2017 on a compounded basis (1)
• Growth has been driven by higher living standards which is driving growth across all end uses, but is most pronounced in high NBSK-containing tissue and specialties products
61%
17%
45%
1.3 1.9
0.9 0.3
0.9
2.2
0.5
0.3
2.1
4.1
1.4
0.7
-0.51.01.52.02.53.03.54.04.55.0
2017 2018 2019 2020
millio
ns
of
ton
ne
s
Tissue Capacity Growth by Region (6)
China Rest of World
-
$4
$8
$12
$16
$20
-
2.0
4.0
6.0
8.0
1990 2000 2010
Inco
me
(00
0’s U
S$
/ pe
rson
) Tis
sue
De
ma
nd
(k
g /
pe
rso
n)
Tissue Demand & Income in China (2)(3)
Income per Capita 2008-2018 CAGR: +7.4%
Tissue Demand per Capita 2008-2018 CAGR: +7.8%
1) Source: PPPC (November 2018) for NBSK demand 2) Source: PPPC (February 26, 2019, prepared for Mercer International)
3) Note: Income measured at purchasing power parity in constant 2011 US dollars 4) Source: PPPC (November 2018) for BSK demand and PPPC (September 2018) for end uses 5) Other includes fluff-based products, kraft papers, mechanical printing & writing grades and newsprint 6) Source: Brian McClay (February 11, 2019), some numbers may not add due to rounding
(5)
End Use 2007 – 2017 CAGR

19
NBSK – Pricing Trend
• Most NBSK is produced in euro and Canadian dollar zones, so the U.S. dollar NBSK price can be influenced by changing exchange rates, as was the case in 2015
• NBSK was, until the early 2000’s, the global benchmark pulp grade used in most paper applications
• With the introduction of southern eucalyptus hardwood plantations and mills, hardwood pushed NBSK out of many low-strength paper grades
• During this time the global NBSK capacity rationalized to supply customers seeking high strength and bonding characteristics
1) Source: PPPC monthly World Chemical Market Pulp Flash reports for inventories 2) Source: Brian McClay Market Pulp Monthly reports for pricing 3) Source: FactSet for exchange rates
(1) (2) (2)(3) (2)(3)
-
7
14
21
28
35
42
49
$300
$450
$600
$750
$900
$1,050
$1,200
$1,350
$1,500
$1,650
2003 2005 2007 2009 2011 2013 2015 2017
Glo
ba
l NB
SK
Inve
nto
ry (#
Da
ys)
NB
SK
Pri
ce (
no
ted
cu
rre
ncy
/ t
on
ne
)
NBSK Price & BSK Global Inventory
BSK Global Inventory NBSK List Price (in US$) NBSK List Price (in CAD) NBSK List Price (in €)

20
NBHK – Demand
Overview
• The BHK market has grown on average 3.2% per year since 2008, in contrast to NBSK which has grown by 2.1% during the same period
• BHK consists of many species with unique attributes suitable for various applications
• BEK dominates the BHK market due to its high fibre density, accounting for 67% of global BHK capacity and 68% of global BHK demand(1)
Aspen NBHK
• Peace River Pulp produces Aspen NBHK – a niche product ideal for applications requiring a smooth surface (eg. gravure, cigarette papers)
– Aspen NBHK is included within the NBHK pulp
category
– Demand for NBHK is forecast to grow 11.24% by
2022, while capacity is forecast to grow by 3.50%
over the same period(1)
• Similar to NBSK this supply demand imbalance for NBHK is expected to be favourable for Aspen NBHK pricing
1) Source: Hawkins Wright – Outlook for Market Pulp (December, 2018)
Species 2017 – 2022E CAGR
32,310 33,625 34,160 34,810 35,435 36,090
-
10,000
20,000
30,000
40,000
2017 2018 2019 2020 2021 2022
To
nn
es,
00
0's
Global BHK Demand - by Species
SBHK – (2.9%)
NBHK – 2.2%
Asian HW – (1.0%)
BEKP – 3.1%
Birch – 3.1%
30,000
31,000
32,000
33,000
34,000
35,000
36,000
37,000
2017 2018 2019 2020 2021 2022
To
nn
es,
00
0's
Forecast BHK Demand - Supply Gap
Demand Supply
21
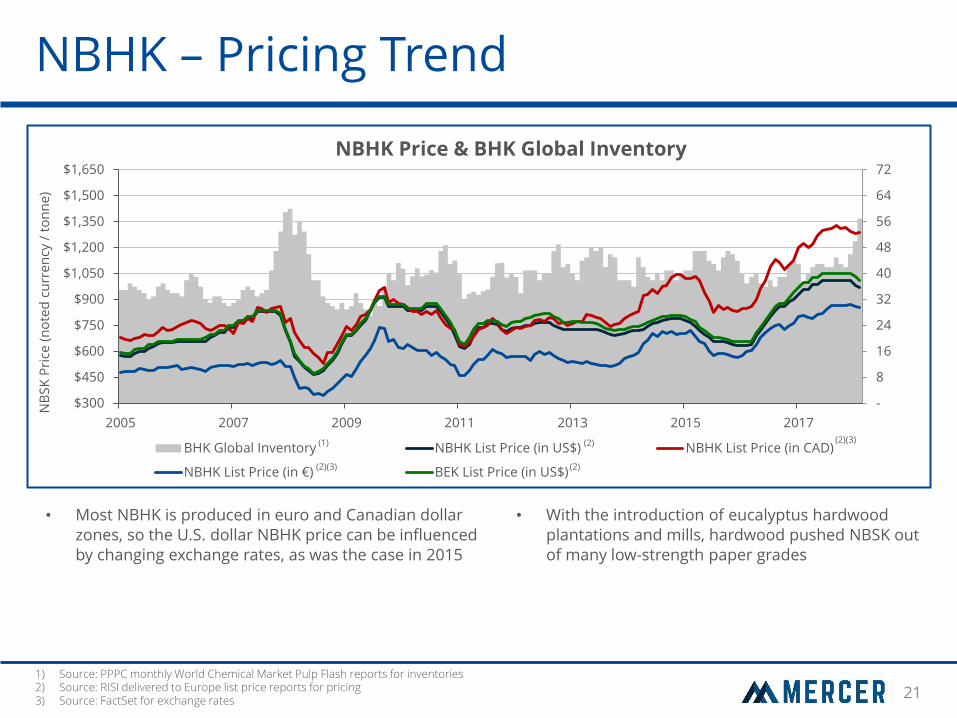
NBHK – Pricing Trend
• Most NBHK is produced in euro and Canadian dollar zones, so the U.S. dollar NBHK price can be influenced by changing exchange rates, as was the case in 2015
• With the introduction of eucalyptus hardwood plantations and mills, hardwood pushed NBSK out of many low-strength paper grades
1) Source: PPPC monthly World Chemical Market Pulp Flash reports for inventories 2) Source: RISI delivered to Europe list price reports for pricing 3) Source: FactSet for exchange rates
(1)
(2) (2)(3)
(2)(3) (2)
-
8
16
24
32
40
48
56
64
72
$300
$450
$600
$750
$900
$1,050
$1,200
$1,350
$1,500
$1,650
2005 2007 2009 2011 2013 2015 2017
NB
SK
Pri
ce (
no
ted
cu
rre
ncy
/ t
on
ne
)
NBHK Price & BHK Global Inventory
BHK Global Inventory NBHK List Price (in US$) NBHK List Price (in CAD)
NBHK List Price (in €) BEK List Price (in US$)
Appendix B Overview of Operations
23
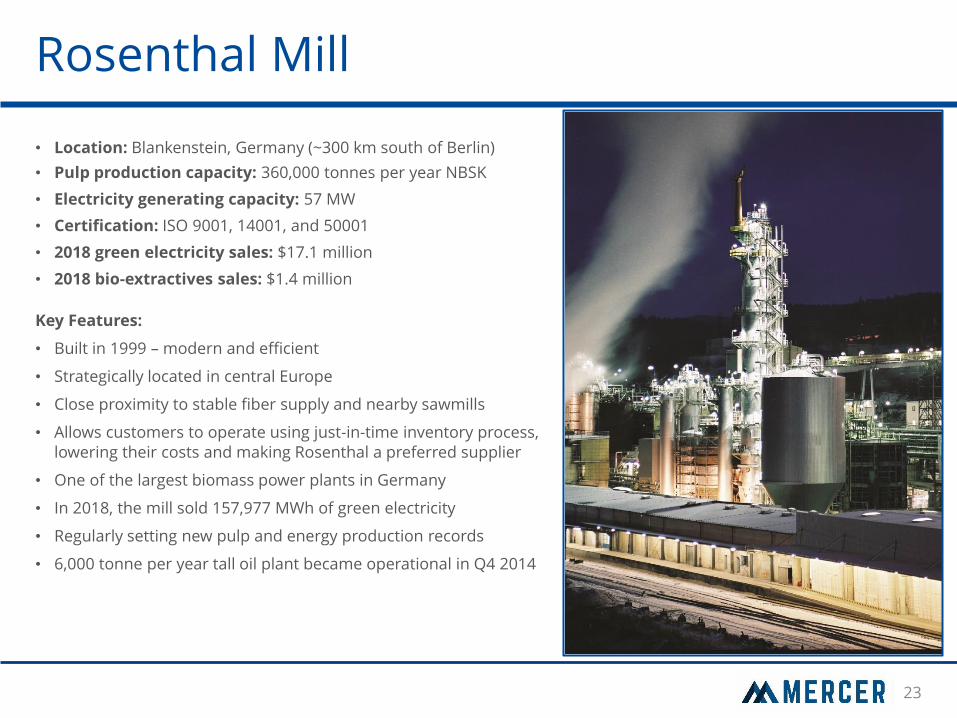
Rosenthal Mill
• Location: Blankenstein, Germany (~300 km south of Berlin)
• Pulp production capacity: 360,000 tonnes per year NBSK
• Electricity generating capacity: 57 MW
• Certification: ISO 9001, 14001, and 50001
• 2018 green electricity sales: $17.1 million
• 2018 bio-extractives sales: $1.4 million
Key Features:
• Built in 1999 – modern and efficient
• Strategically located in central Europe
• Close proximity to stable fiber supply and nearby sawmills
• Allows customers to operate using just-in-time inventory process, lowering their costs and making Rosenthal a preferred supplier
• One of the largest biomass power plants in Germany
• In 2018, the mill sold 157,977 MWh of green electricity
• Regularly setting new pulp and energy production records
• 6,000 tonne per year tall oil plant became operational in Q4 2014
24
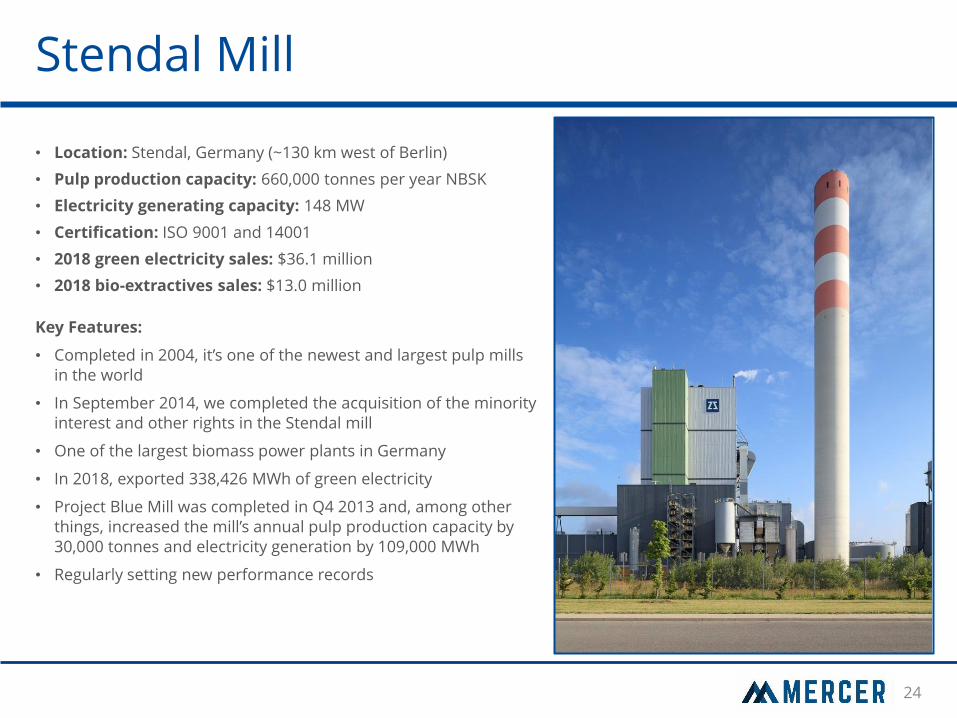
Stendal Mill
• Location: Stendal, Germany (~130 km west of Berlin)
• Pulp production capacity: 660,000 tonnes per year NBSK
• Electricity generating capacity: 148 MW
• Certification: ISO 9001 and 14001
• 2018 green electricity sales: $36.1 million
• 2018 bio-extractives sales: $13.0 million
Key Features:
• Completed in 2004, it’s one of the newest and largest pulp mills in the world
• In September 2014, we completed the acquisition of the minority interest and other rights in the Stendal mill
• One of the largest biomass power plants in Germany
• In 2018, exported 338,426 MWh of green electricity
• Project Blue Mill was completed in Q4 2013 and, among other things, increased the mill’s annual pulp production capacity by 30,000 tonnes and electricity generation by 109,000 MWh
• Regularly setting new performance records
25
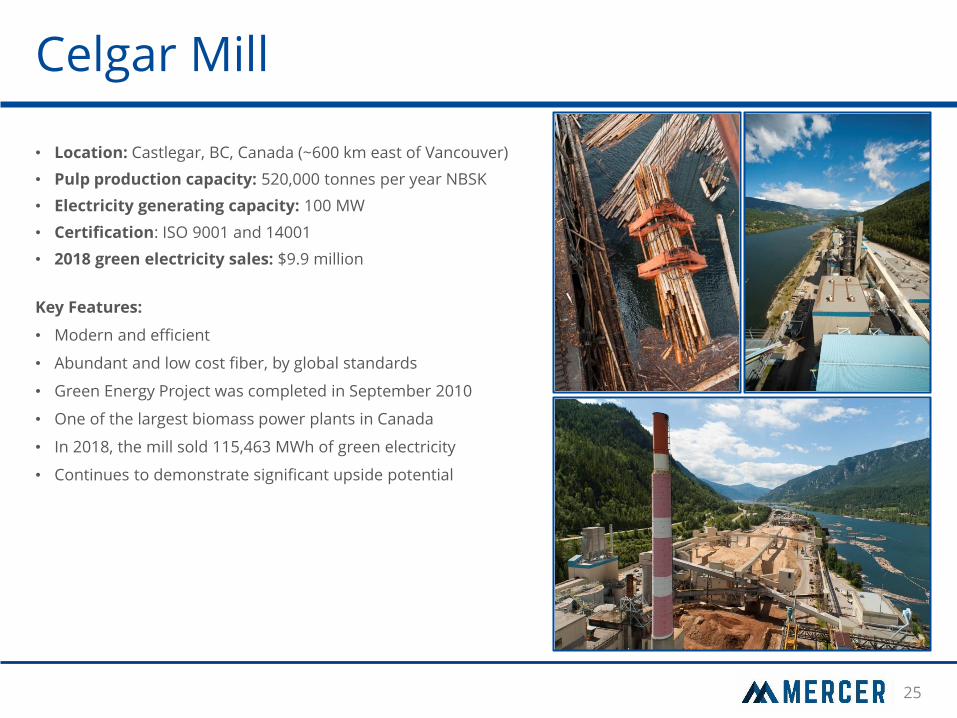
Celgar Mill
• Location: Castlegar, BC, Canada (~600 km east of Vancouver)
• Pulp production capacity: 520,000 tonnes per year NBSK
• Electricity generating capacity: 100 MW
• Certification: ISO 9001 and 14001
• 2018 green electricity sales: $9.9 million
Key Features:
• Modern and efficient
• Abundant and low cost fiber, by global standards
• Green Energy Project was completed in September 2010
• One of the largest biomass power plants in Canada
• In 2018, the mill sold 115,463 MWh of green electricity
• Continues to demonstrate significant upside potential

26
Peace River Mill
• Location: Peace River, Alberta (~500 km northwest of Edmonton)
• Pulp production capacity: 475,000 tonnes per year NBSK/NBHK
• Energy generating capacity: 65 MW
• Certification: ISO 9001 and ISO 14001
• 2018 green electricity sales: $2.6 million(1)
Key Features:
• Modern, high performing kraft mill
• Abundant and low cost fiber, by global standards
• NBSK / NBHK swing mill
• 20 year term forest tenure including annually 400,000 m3 of softwood and 2.4 million m3 of hardwood
• Bio-mass fueled cogeneration power plant with two turbines; a 40 MW back pressure turbine to power pulp production and a 25 MW condensing turbine generator to generate electricity for sale to the Alberta grid
• In 2018, the mill sold 60,302(1) MWh of green electricity
1) Represents full year results for the year ended December 31, 2018
27
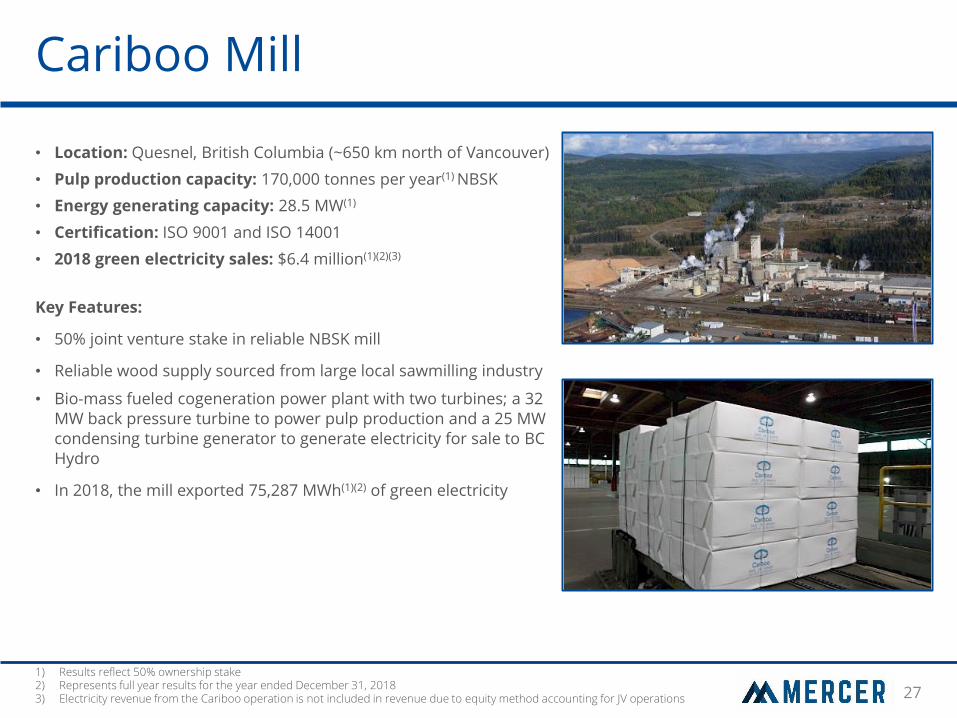
Cariboo Mill
• Location: Quesnel, British Columbia (~650 km north of Vancouver)
• Pulp production capacity: 170,000 tonnes per year(1) NBSK
• Energy generating capacity: 28.5 MW(1)
• Certification: ISO 9001 and ISO 14001
• 2018 green electricity sales: $6.4 million(1)(2)(3)
Key Features:
• 50% joint venture stake in reliable NBSK mill
• Reliable wood supply sourced from large local sawmilling industry
• Bio-mass fueled cogeneration power plant with two turbines; a 32 MW back pressure turbine to power pulp production and a 25 MW condensing turbine generator to generate electricity for sale to BC Hydro
• In 2018, the mill exported 75,287 MWh(1)(2) of green electricity
1) Results reflect 50% ownership stake 2) Represents full year results for the year ended December 31, 2018 3) Electricity revenue from the Cariboo operation is not included in revenue due to equity method accounting for JV operations
28
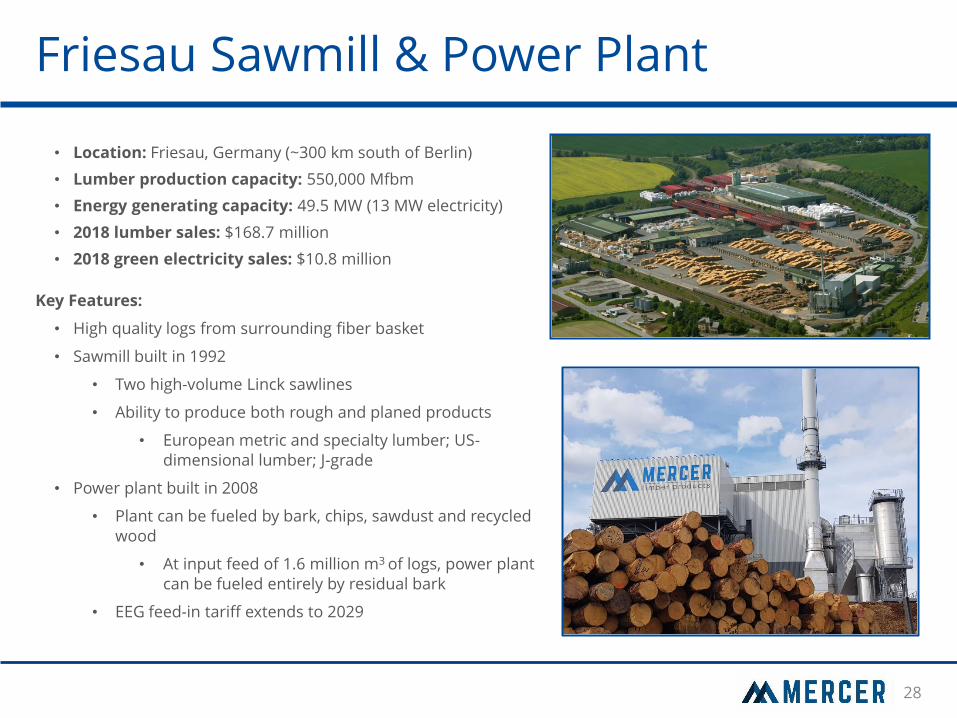
Friesau Sawmill & Power Plant
• Location: Friesau, Germany (~300 km south of Berlin)
• Lumber production capacity: 550,000 Mfbm
• Energy generating capacity: 49.5 MW (13 MW electricity)
• 2018 lumber sales: $168.7 million
• 2018 green electricity sales: $10.8 million
Key Features:
• High quality logs from surrounding fiber basket
• Sawmill built in 1992
• Two high-volume Linck sawlines
• Ability to produce both rough and planed products
• European metric and specialty lumber; US-dimensional lumber; J-grade
• Power plant built in 2008
• Plant can be fueled by bark, chips, sawdust and recycled wood
• At input feed of 1.6 million m3 of logs, power plant can be fueled entirely by residual bark
• EEG feed-in tariff extends to 2029
Appendix C Financial Highlights

30
$244 $350
$438 $10
$15
$15
$57
$297
$233
$138 $110
$240 $234 $187
$254
$365
$454
-
$100
$200
$300
$400
$500
2009 2010 2011 2012 2013 2014 2015 2016 2017 2018 Pro forma
Q3 2018 TTM
Op
era
tin
g E
BIT
DA
($
,millio
ns)
Annual Operating EBITDA by Product(1)(2)(6)
Pulp
Wood Products
Stabilizing EBITDA
Note: Some numbers may not add due to rounding 1) Operating EBITDA is a non-GAAP measure. For a Reconciliation of Net Income to Operating EBITDA, please refer to Appendix C 2) Our reporting currency was the euro up until October 1, 2013. Prior figures have been converted to US dollars at the average FX rates in effect during the period 3) Includes EBITDA from energy and bio-extractives. Includes corporate costs & eliminations
4) Includes EBITDA from energy and bio-extractives 5) Friesau reflects estimated annualized pro forma EBITDA based on 2017 operating results, excluding synergies 6) Operating EBITDA Margin is Operating EBITDA expressed as a percentage of revenues
(3)
(5)
6.6%
24.7%
18.6%
12.8% 10.1%
20.4% 22.6%
19.9% 22.8%
27.6%
9.9% 7.8%
0%
10%
20%
30%
40%
2009 2010 2011 2012 2013 2014 2015 2016 2017 2018
Op
era
tin
g E
BIT
DA
Ma
rgin
Annual Operating EBITDA Margin by Product (1)(2)(7)
Pulp Segment Margin
Wood Products Segment Margin
(4)
31
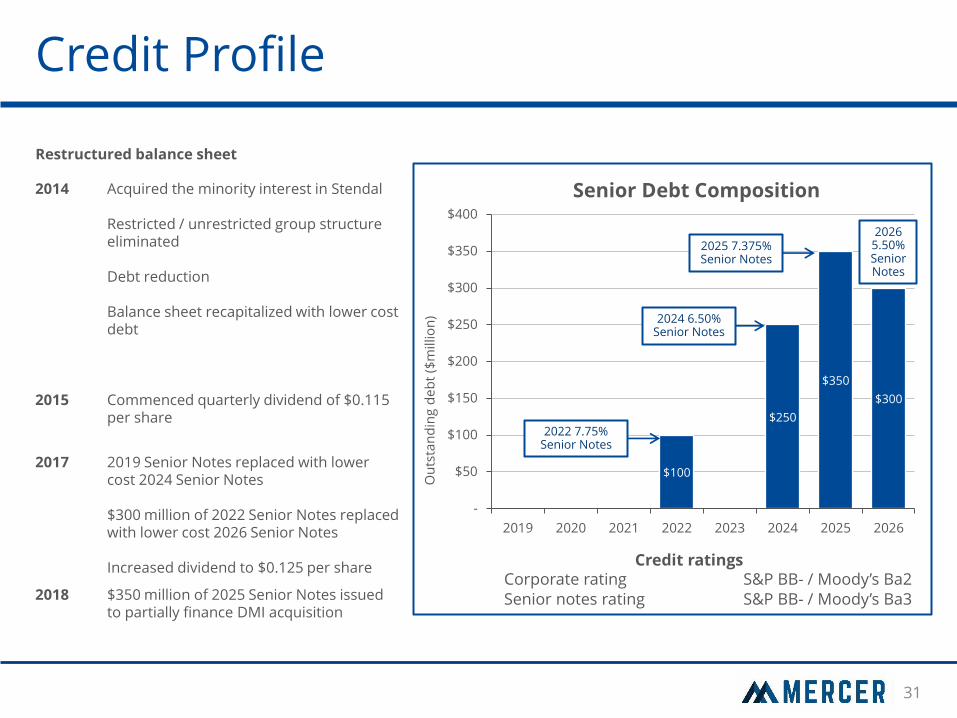
Credit Profile
$100
$250
$350
$300
-
$50
$100
$150
$200
$250
$300
$350
$400
2019 2020 2021 2022 2023 2024 2025 2026
Ou
tsta
nd
ing
de
bt
($m
illio
n)
Senior Debt Composition
Credit ratings Corporate rating S&P BB- / Moody’s Ba2 Senior notes rating S&P BB- / Moody’s Ba3
Restructured balance sheet
2014 Acquired the minority interest in Stendal Restricted / unrestricted group structure eliminated Debt reduction Balance sheet recapitalized with lower cost debt
2015 Commenced quarterly dividend of $0.115 per share
2017 2019 Senior Notes replaced with lower cost 2024 Senior Notes $300 million of 2022 Senior Notes replaced with lower cost 2026 Senior Notes Increased dividend to $0.125 per share
2018 $350 million of 2025 Senior Notes issued to partially finance DMI acquisition
2024 6.50% Senior Notes
2022 7.75% Senior Notes
2025 7.375% Senior Notes
2026 5.50% Senior Notes

32
Reconciling Net Income to EBITDA
Note: See next page for additional disclosures
Note: The following reconciles actual EBITDA to net income. Some numbers may not add due to rounding 1) Includes debt settlement loss of $10.7 million related to the 2019 Senior Notes from Q1 2017 2) Includes debt settlement loss of $21.5 million related to the 2022 Senior Notes and legal cost award of $7.0 million from Q1 2018
in US$ millions 2015 2016 2017 2018 Pro Forma Q3
2018 TTM
Net Income Attributable to Common Shareholders 75.5 34.9 70.5 128.6 163.8
Add: Income Tax Provision 29.4 24.5 33.5 48.7 64.4
Add: Interest Expense 53.9 51.6 54.8 51.5 78.0
Add: Loss on Derivative Instruments 0.9 - - - -
Add: Other Expense 5.9 4.1 9.8 (1) 39.1 (2) 26.5 (2)
Operating Income 165.7 115.1 168.6 267.9 332.7
Add: Depreciation and Amortization 68.3 72.0 85.3 96.8 121.2
Operating EBITDA 234.0 187.1 253.9 364.6 453.9
Operating EBITDA Comprised of:
Pulp 238.4 196.1 252.1 362.0 449.3
Wood Products (Lumber & Energy) - - 9.7 14.7 15.4
Corporate Costs & Eliminations (4.4) (9.0) (7.9) (12.1) (10.8)

33
Reconciling Net Income to EBITDA
Note: For other reconciliations of Net Income (Loss) to Operating EBITDA in periods not shown, please refer to that period’s respective Form 10-Q or 10-K, which can be found on our website (www.mercerint.com) Operating EBITDA is defined as operating income (loss) plus depreciation and amortization and non-recurring capital asset impairment charges. Management uses Operating EBITDA as a benchmark measurement of its own operating results, and as a benchmark relative to its competitors. Management considers it to be a meaningful supplement to operating income (loss) as a performance measure primarily because depreciation expense and non-recurring capital asset impairment charges are not an actual cash cost, and depreciation expense varies widely from company to company in a manner that management considers largely independent of the underlying cost efficiency of their operating facilities. In addition, we believe Operating EBITDA is commonly used by securities analysts, investors and other interested parties to evaluate our financial performance. Operating EBITDA does not reflect the impact of a number of items that affect our net income (loss) attributable to common shareholders, including financing costs and the effect of derivative instruments. Operating EBITDA is not a measure of financial performance under the accounting principles generally accepted in the United States of America (“GAAP”), and should not be considered as an alternative to net income (loss) or income (loss) from operations as a measure of performance, nor as an alternative to net cash from operating activities as a measure of liquidity. Operating EBITDA has significant limitations as an analytical tool, and should not be considered in isolation, or as a substitute for analysis of our results as reported under GAAP. Operating EBITDA should only be considered as a supplemental performance measure and should not be considered as a measure of liquidity or cash available to us to invest in the growth of our business. Because all companies do not calculate Operating EBITDA in the same manner, Operating EBITDA as calculated by us may differ from Operating EBITDA or EBITDA as calculated by other companies. We compensate for these limitations by using Operating EBITDA as a supplemental measure of our performance and by relying primarily on our GAAP financial statements.
Mercer International Inc.
www.mercerint.com
Phone: (1) 604 684 1099 | Fax: (1) 604 684 1094
Suite 1120, 700 West Pender Street, Vancouver, BC, V6C 1G8, Canada
Copyright© 2018 Mercer International Inc.


