
Ion diffusion from Sellafield OPC paste
formulations
by
Sandeep Kadam
A thesis submitted in partial fulfilment of the requirements for the degree of
Doctor of Philosophy at the University of Central Lancashire
September 2015

Dedicated in loving memory of Sunita who was a great mum


iv
Acknowledgements
First and foremost I would like to extend my deep and sincere gratitude to my
supervisory team. Firstly, my Director of Studies, Professor Gary Bond for giving
me the opportunity to be a part of UCLan Nuclear Materials Chemistry group to
pursue my PhD research, for his constant guidance, encouragement and moral
support, I am truly grateful. It has been a distinct privilege to work under the
supervision of Professor Harry Eccles. He has been a great inspiration and his
critical thinking has contributed tremendously to this project. My sincere thanks
also to Professor Glyn Morton for keeping me motivated especially during the
challenges of the research process. I could not have imagined a better
supervisory team for my PhD research and will always be grateful.
I would like to express my gratitude to the University of Central Lancashire for the
award of a research studentship and for providing the research facilities.
Completing a large amount of the sample analysis for this research would not
have been possible without the expertise of the technical team. Many thanks to
Dr Runjie Moa for BET and SEM/EDAX analysis, Tamar Garcia Sorribes and Jim
Donnelly for their assistance in using ICP-MS and Ion Chromatography, Sal
Tracey for chemicals and materials required for the experiments.
Thanks also goes to Research Student Registry office, particularly Professor
Mike Holmes, Fiona Mair and Clare Altham for their help and support, especially
during my time at Westlakes campus in Cumbria. My special thanks to Maddy
Buckley (former head of the “I”) for being my mentor, encouraging me to engage

v
with many aspects of British culture, which helped me to overcome the isolation
of PhD research. In addition, I would like to thank all my colleagues from UCLan
Nuclear Materials Chemistry group and fellow postgraduates from 2nd floor in
particular Hajira, Amritvir, Vinod kumar, Okoh, and Mohammad for their help and
support.
I am thankful to all my friends Rohan, Rouchelle, Sanitha, Laura and Laureena
for their help and moral support whenever it was needed, irrespective of their
busy schedule.
Finally, I would like to acknowledge the love, support and understanding given to
me over the years by father and sister, Sonya for her support and patience.
vi
Abstract
The disposal of nuclear waste is highly regulated and the disposal option will be
dependent on the radionuclide content of the waste. The encapsulation of nuclear
waste to prevent migration of radionuclides into the environment and as a safe
means of long term storage and disposal can be achieved using ordinary Portland
cement (OPC) and various additives such as blast furnace slag (BFS) or
pulverised fly ash (PFA). Treated radioactive wastes in this manner are
characterised by good thermal, chemical, physical stability and compressive
strength. In addition the alkaline chemistry of concrete renders most
radionuclides highly insoluble. The ultimate destination of some of these
encapsulated wastes is in a Deep Geological Facility (GDF), where for many
years the wastes will remain inert to their environment. In the longer-term the
environmental conditions will change and the inertness of these waste forms
could be affected from the seepage of water into the facility along with microbial
activity. The diffusivity or leaching behaviour of cement encapsulated radioactive
waste is crucial to ensure the overall safety of a storage/disposal system.
The research presented in this thesis evaluates the diffusivity of strontium,
caesium and cobalt when added as inactive forms to BFS:OPC and PFA:OPC
formulation as their chlorides and for strontium when added as chloride and
carbonate. The cylindrical cement paste samples (CPS) having diameter of 3.2
cm and height 5.3 cm were immersed in re-circulating test solutions consisting
of de-ionised water, concentrated Sellafield pore water (CSPW), diluted Sellafield
pore water (DSPW) and bacterial inoculated water, John Innes Soil Solution
(JISS). Strontium carbonate was selected to determine the influence of a water
vii
insoluble compound on diffusivity of the cation. Freshly cured and aged BFS:OPC
samples were also studied to evaluate the impact of carbonation on cation
diffusivity. Chloride salts were used, as these would be benign to
microorganisms, i.e. would not stimulate or support growth unlike nitrate or
sulphate anions. The outcome of this study indicate that the make-up water
composition affected the segregation of inherent and added cations in the cement
paste samples and also both the bleed water volume and physical characteristics
of the cement paste samples. Strontium when added as a soluble salt to the
make-up water influenced the rate of diffusivity. Depending on the type of
formulation (BFS:OPC, PFA:OPC), a direct correlation was observed between
diffusivity of Sr2+ and total amount of Ca2+ present in the CPS. The rate of
diffusivity and the depth of cation diffusion was significantly higher in 3% SrCl2
PFA:OPC having lower concentration of Ca2+ compared to its BFS counterpart.
The concentration of the added salt to the make-up water also affected the
diffusivity. The difference in the diffusivity was observed between closed and
open diffusivity system. The solubility limits were not a factor in open circuit which
was comparable with the pH values; contrary to the closed circuits. The
concentration of cations and anions in the test solution influenced strontium and
caesium diffusivity. The diffusivity of sulphate was influenced by the nature of the
cation added to the make-up water. Strontium had the greatest effect on lowering
the diffusion primarily due to the formation of sparingly soluble strontium sulphate.
The pH values of the circulating JISS test solutions from all the contaminated
cement samples were lower in comparison with control, which was comparable
with viable population in the circulating system. There was no significant viable
viii
population measured in the JISS from control CPS. The JISS test solution
composition retard strontium diffusivity but accelerated caesium diffusion in
comparison with distilled water values, this retardation could be due to the
inherent sulphate content (≈8600 ppb) of the JISS test solution.
This work provides fundamental understanding of the physic-chemical factors
influencing the diffusivity of cations from BFS:OPC and PFA:OPC formulations.
The scheme i.e. closed circuit recirculation adopted in this research would be
more fitting of the real situation i.e. stagnation followed by percolation and
therefore diffusivity of ions will be greatly influenced by the test solution chemistry
and composition.
ix
Table of contents
Student declaration ......................................................................................... iii
Acknowledgements ......................................................................................... iv
Abstract ............................................................................................................ vi
Table of contents ............................................................................................. ix
List of Tables ................................................................................................... xv
List of figures ............................................................................................... xviii
List of abbreviations .................................................................................... xxiv
Chapter 1: Introduction
1.1 Radioactive waste ........................................................................................... 1
1.1.1 Composition and classification of waste radioactive waste .............................. 2
1.1.2 UK radioactive waste inventory ....................................................................... 4
1.2 Radioactive waste disposal ............................................................................. 5
1.3 Immobilisation of waste ................................................................................... 7
1.4 Cement ........................................................................................................... 9
1.4.1 Cement Composites ...................................................................................... 10
1.4.1.1 Blast Furnace Slag (BFS).............................................................................. 11
1.4.1.2 Pulverised Fly Ash (PFA) .............................................................................. 11
1.5 Degradation of concrete ................................................................................ 12
1.5.1 Dissolution in ground water ........................................................................... 15
1.5.2 Carbonation .................................................................................................. 18
1.5.2.1 Carbonation of unhydrated cement ............................................................... 19
1.5.3 Chloride interaction ....................................................................................... 20
1.5.4 Reaction with sulphate ion ............................................................................ 20
1.5.5 Organic interaction ........................................................................................ 21
1.5.6 Microbial degradation .................................................................................... 21
1.5.6.1 Micro-organisms involved in the biodegradation of concrete ......................... 22
1.6 Potential for microbial activity under conditions within GDF ........................... 26
1.6.1 The potential microbial activity during pre-closure period .............................. 26

x
1.6.1.1 Microbiologically Induced Corrosion (MIC) and biofilm .................................. 28
1.6.1.2 The potential microbial activity during post-closure period ............................. 29
1.7 Cations/radionuclides of interest ................................................................... 30
1.7.1 Strontium ...................................................................................................... 30
1.7.2 Caesium ........................................................................................................ 31
1.7.3 Cobalt ........................................................................................................... 31
1.8 Aims and objective of project ........................................................................ 32
Chapter 2: Materials and methods
2.1 Materials and chemicals ................................................................................ 34
2.2 Preparation of cement paste samples ........................................................... 34
2.3 Analysis of cement materials and hardened cement paste ............................ 37
2.3.1 Analysis of OPC, BFS and PFA .................................................................... 37
2.3.2 Chemical analysis of CPS ............................................................................. 38
2.3.3 Water content of CPS ................................................................................... 38
2.3.4 Surface and pore-size area ........................................................................... 38
2.4 Experimental setup and procedure ................................................................ 40
2.4.1 Closed circuit diffusivity system ..................................................................... 40
2.4.2 Open circuit diffusivity system ....................................................................... 41
2.4.3 Nature of test solution ................................................................................... 42
2.4.3.1 Preparation of simulated Sellafield pore water .............................................. 42
2.4.3.2 Preparation of John Innes Soil Solution (JISS) .............................................. 43
2.5 Chemical analysis of test solutions ................................................................ 43
2.5.1 pH measurement .......................................................................................... 43
2.5.2 ICP-MS ......................................................................................................... 44
2.5.3 Ion Chromatography ..................................................................................... 44
2.6 General growth media for the isolation and propagation of microorganisms .. 45
2.7 Characterisation of heterotrophic bacterial isolates ....................................... 45
2.8 Characterisation of fungal isolates ................................................................ 46
2.9 Viable counts of bacteria ............................................................................... 46
2.10 Statistical analyses........................................................................................ 46
2.11 Diffusion coefficient ....................................................................................... 46
2.12 Rate of diffusivity ........................................................................................... 47
Chapter 3: Cement chemistry discussion
3.1 Introduction ................................................................................................... 49

xi
3.2 Physical properties of cement paste composition .......................................... 49
3.2.1 Preparation/ composition confirmation .......................................................... 49
3.2.2 Hydration ...................................................................................................... 50
3.2.3 BFS v/s PFA ................................................................................................. 56
3.2.4 Distribution of water ...................................................................................... 57
3.2.5 Segregation and bleeding ............................................................................. 60
3.2.6 Pore water composition ................................................................................. 63
3.3 Chemistry of solid and liquid system ............................................................. 64
3.3.1 Influence of test solution composition ............................................................ 67
3.3.2 pH effect ....................................................................................................... 69
3.3.3 Diffusion/leaching .......................................................................................... 72
3.3.3.1 Nature of added cation .................................................................................. 74
3.3.3.2 Nature of test solution and influence on diffusivity of added cations .............. 80
3.3.4 Open vs closed system ................................................................................. 86
3.4 Chemistry and interaction of anions .............................................................. 90
3.4.1 Chloride interaction ....................................................................................... 90
3.4.2 Internal sulphate attack ................................................................................. 90
3.5 Diffusion coefficient values of cement paste samples .................................... 92
3.6 Depth of dissolution/leaching ........................................................................ 97
3.7 Microbial impact on migration of ions from CPS .......................................... 101
3.7.1 Mobilisation of metal ions ............................................................................ 105
3.7.2 Immobilisation of metal ions ........................................................................ 107
Chapter 4: Diffusivity from BFS:OPC CPSs with distilled water as a test
solution
4.1 Aims of study .............................................................................................. 110
4.2 Introduction ................................................................................................. 110
4.3 Cement paste samples ............................................................................... 111
4.4 Results ........................................................................................................ 112
4.4.1 Chemical analysis of cement paste ............................................................. 113
4.4.2 Moisture content of CPS ............................................................................. 113
4.4.3 Average micropore and surface area micropore area analysis of cement paste sample measured by BET method .............................................................. 114
4.4.4 Test solution analysis .................................................................................. 115
4.4.4.1 pH values .................................................................................................... 115
4.4.4.2 Chemical analysis of test solution ............................................................... 116

xii
4.5 Conclusions ................................................................................................ 123
Chapter 5: Diffusivity from PFA:OPC CPSs with distilled water as a test solution
5.1 Aims of study .............................................................................................. 148
5.2 Introduction ................................................................................................. 148
5.3 Cement paste samples ............................................................................... 149
5.4 Results ........................................................................................................ 149
5.4.1 Chemical analysis of cement paste sample ................................................. 150
5.4.2 Moisture content of CPS ............................................................................. 150
5.4.3 Micropore and surface area analysis of cement paste sample measured by BET method ................................................................................................ 151
5.4.4 Test solution analysis .................................................................................. 152
5.4.4.1 pH values .................................................................................................... 152
5.4.4.2 Chemical analysis of test solution ............................................................... 153
5.5 Conclusions ................................................................................................ 157
Chapter 6: Diffusivity from BFS:OPC CPSs with Sellafield pore water as a
test solution
6.1 Aims of study .............................................................................................. 169
6.2 Introduction ................................................................................................. 169
6.3 Cement paste samples ............................................................................... 170
6.4 Results and discussion ............................................................................... 170
6.4.1 Micropore and surface area analysis of cement paste sample measured by BET method ................................................................................................ 170
6.4.2 Test solution analysis .................................................................................. 171
6.4.2.1 pH values .................................................................................................... 171
6.4.2.2 Chemical analysis of test solution ............................................................... 172
6.5 Conclusions ................................................................................................ 177
Chapter 7: Diffusivity from PFA:OPC CPSs with Sellafield pore water as a
test solution
7.1 Aims of study .............................................................................................. 193
7.2 Introduction ................................................................................................. 193
7.3 Cement paste samples ............................................................................... 194
7.4 Results ........................................................................................................ 194
xiii
7.4.1 Micropore and surface area analysis of cement paste sample .................... 194
7.4.2 Test solution analysis .................................................................................. 195
7.4.2.1 pH values .................................................................................................... 195
7.4.2.2 Chemical analysis of test solution ............................................................... 195
7.5 Conclusions ................................................................................................ 199
Chapter 8: Diffusivity from BFS:OPC CPSs with John Innes soil solution
as a test solution
8.1 Aims of study .............................................................................................. 204
8.2 Introduction ................................................................................................. 204
8.3 Cement paste samples ............................................................................... 204
8.4 Results and discussion ............................................................................... 205
8.5 Micropore and surface area analysis of CPS measured by BET method ..... 205
8.5.1 Test solution analysis .................................................................................. 206
8.5.1.1 pH values .................................................................................................... 206
8.5.1.2 Chemical analysis of test solutions .............................................................. 206
8.5.1.3 Microbial community profile ......................................................................... 209
8.5.1.4 Total viable count of John Innes soil solution .............................................. 210
8.5.1.5 Microbial analysis of test solution ................................................................ 210
8.6 Conclusion .................................................................................................. 212
Chapter 9: Diffusivity from PFA:OPC CPSs with John Innes soil solution
as a test solution
9.1 Aims of study .............................................................................................. 217
9.2 Introduction ................................................................................................. 217
9.3 Cement paste samples ............................................................................... 217
9.4 Result and discussion ................................................................................. 218
9.4.1 Micropore area and surface area analysis of CPS....................................... 218
9.5 Test solution analysis .................................................................................. 219
9.5.1 pH values .................................................................................................... 219
9.5.2 Chemical analysis of test solution ............................................................... 219
9.6 Microbial community profile ......................................................................... 223
9.6.1.1 Microbial analysis of test solution ................................................................ 223
9.7 Conclusions ................................................................................................ 225
Chapter 10:Conclusions

xiv
10.1 Generic conclusion...................................................................................... 230
10.2 Implication of findings to nuclear industry .................................................... 232
Chapter 11:Future Work ............................................................................... 231
References..................................................................................................... 243
Appendices.................................................................................................... 263

xv
List of Tables
Table 1.1 Classification of radioactive waste in the UK [8] ............................................ 3
Table 1.2 UK Radioactive Waste inventory at 1 April 2013 [9] ...................................... 4
Table 1.3 Categorisation of cement under European standard EN-197-1[17] ............. 10
Table 1.4 Composition of OPC, BFS and PFA (%) (literature values) [23-25] ............. 12
Table 1.5 Composition of Portland cement [16] .......................................................... 12
Table 1.6 Initial screening of the ILW pre-closure environments [65] .......................... 28
Table 1.7 Potential organic and inorganic acids produced by microorganism [65]. ...... 30
Table 2.1 Cement paste mixture proportions .............................................................. 35
Table 2.2 Dimensions of cement paste samples (CPS) ............................................. 36
Table 2.3 Nominal composition of the test solution used............................................. 43
Table 2.4 Instrument parameters for Dionex ICS-2000 for the determination of Cl- and
SO42- in test solution ................................................................................. 45
Table 3.1 Typical composition of Portland cement with chemical composition and
weight percentage [16]. ............................................................................ 51
Table 3.3 Water distribution in some BFS:OPC CPSs ................................................ 60
Table 3.4 Water distribution in some PFA:OPC CPSs ................................................ 60
Table 3.5 The Ksp and K values of possible soluble compounds present in the test
solution ..................................................................................................... 66
Table 3.6 Chemical equilibrium expression for each solid phase [122, 123] ................ 67
Table 3.7 Concentration of some ions in the various test solutions (ppb) .................... 68
Table 3.8 Predicted hydroxide concentration based on pH value ................................ 70
Table 3.9 Ksp values for selected salts ........................................................................ 71
Table 3.10 Comparison of total cations removed from the BFS:OPC cement paste
samples with tap water ............................................................................. 88

xvi
Table 3.11 Comparison of total cations removed from the PFA:OPC samples with tap
water ........................................................................................................ 88
Table 3.12 Diffusion coefficient values (De) from BFS:OPC CPS ................................ 94
Table 3.13 Diffusion coefficient values (De) from PFA:OPC CPS ................................ 95
Table 3.14 Concentration of ions present in the CPS .................................................. 98
Table 3.15 Predicted concentration of ions in the first 1mm of CPS ............................ 99
Table 3.16 % ions removed from first 1mm shell of CPS ............................................ 99
Table 3.17 Microorganisms involved in the biodegradation of concrete [69]. ............. 104
Table 3.18 The major mechanisms of microbial metal interaction [175, 187] ............ 105
Table 3.19 Summary table showing pH values and microbial analysis of JISS from
BFS:OPC JISS experiment ..................................................................... 108
Table 3.20 Summary table showing pH values and microbial analysis of JISS from
PFA:OPC JISS experiment ..................................................................... 109
Table 4.1 Cement paste samples and test solution used .......................................... 111
Table 4.2 Analysis of as received OPC and BFS (%). ............................................... 112
Table 4.3 Cation, surface and micro-pore area analysis ≈3% SrCl2 and ≈3% CsCl CPS
............................................................................................................... 113
Table 4.4 % moisture content of BFS:OPC CPS ...................................................... 114
Table 4.5 Average micropore and surface area of cement paste samples measured by
BET method prior to diffusivity experiments ............................................ 115
Table 4.6 Analysis of tap water ................................................................................. 116
Table 4.7 Concentration of Cl- calculated in BFS:OPC CPS in mmoles .................... 121
Table 4.8 Concentration of SO42- calculated in BFS:OPC in mmoles ......................... 122
Table 5.1 Cement paste samples and test solutions used. ....................................... 149
Table 5.2 Analysis of as received OPC and PFA (%). ............................................... 150
Table 5.3 % moisture content of PFA:OPC CPS ..................................................... 151
xvii
Table 5.4 Micropore and surface area analysis of dissected PFA:OPC cement paste
samples measured by BET method ........................................................ 152
Table 5.5 Average micropore and surface area of PFA:OPC cement paste samples
measured by BET method ...................................................................... 152
Table 5.6 Concentration of Cl- calculated in PFA:OPC CPS in mmoles .................... 156
Table 5.7 Concentration of SO42- calculated in PFA:OPC CPS in mmoles. ............... 156
Table 6.1 Nominal composition of the test solution used [65] .................................... 169
Table 6.2 BFS: OPC cement paste samples and test solution used ......................... 170
Table 6.3 Average micropore and surface area of cement paste samples measured by
BET method ........................................................................................... 171
Table 7.1 PFA: OPC cement paste samples and test solutions used ........................ 194
Table 7.2 Average micropore and surface area of PFA: OPC cement paste samples
measured by BET method ...................................................................... 195
Table 8.1 BFS:OPC cement paste samples and test solution used .......................... 205
Table 8.2 Average micropore and surface area of cement paste samples measured by
BET method ........................................................................................... 206
Table 8.3 Analysis of JISS ........................................................................................ 206
Table 8.4 Summary table showing total viable count measured in JISS. ................... 211
Table 8.5 Summary table showing bacteria isolated from JISS ................................. 211
Table 9.1 BFS:OPC cement paste samples and test solution used........................... 217
Table 9.2 Average micropore and surface area of cement paste samples measured by
BET method ........................................................................................... 218
Table 9.3 Summary table showing total viable count measured in JISS .................... 224
Table 9.4 Summary table showing bacteria isolated from JISS ................................. 224
xviii
List of figures
Figure 1.1 Illustration of the Uranium Nuclear Fuel Cycle (NFC) [2] .............................. 1
Figure 1.2 Phased geological repository concept [13] ................................................... 6
Figure 1.3 The PGRC for long term management of HLW/ILW ..................................... 7
Figure 1.4 Predicted evolution of pore solution pH during leaching by pure water [42].
................................................................................................................. 16
Figure 1.5 Microbial deterioration of cementitious material ......................................... 23
Figure 1.6 The microbial sulphur cycle [65] ................................................................. 24
Figure 1.7 The microbial nitrogen cycle [65] ............................................................... 25
Figure 2.1 (a) freshly prepared CPS, (b, c) caps were removed after seven days (d)
samples left open for further curing........................................................... 36
Figure 2.2 Dissected CPS named as top; middle bottom; side and base layer for
elemental analysis. ................................................................................... 37
Figure 2.3 Experimental setup of closed circulating leaching system showing diffusivity
vessel containing CPS and reservoir vessel. ............................................ 41
Figure 2.4 Experimental setup of open leaching system showing diffusivity vessel
containing CPS and reservoir vessel. ....................................................... 42
Figure 3.1 composition of cement clinker [99] ............................................................. 51
Figure 3.2 Cement hydration process [101] ................................................................ 52
Figure 3.3 Segregation of Ca2+ and added cations ...................................................... 62
Figure 3.4 Micropore area of BFS:OPC CPSs ............................................................ 62
Figure 3.5 Micropore area of PFA:OPC CPSs ............................................................ 63
Figure 3.6 Bjerrum plot showing the activities of inorganic carbon species as a function
of pH for a value of total inorganic carbon of 10-3 moles L-1 [126]. ............. 71
Figure 3.7 Comparative average rate of diffusivity of calcium from BFS: OPC CPSs in
DW, DSPW, CSPW and JISS. .................................................................. 83

xix
Figure 3.8 Comparative average rate of diffusivity of calcium from PFA: OPC CPSs in
DW, CSPW and JISS. .............................................................................. 83
Figure 3.9 Comparative average rate of diffusivity of strontium from 3% SrCl2 and 3%
SrCO3 BFS:OPC CPSs in DW, DSPW, CSPW and JISS. ........................ 84
Figure 3.10 Comparative average rate of diffusivity of strontium from 3% SrCl2 and 3%
SrCO3 PFA:OPC CPSs in DW, CSPW and JISS. ..................................... 84
Figure 3.11 Comparative average rate of diffusivity of caesium from 3% CsCl BFS:OPC
CPSs in DW, DSPW, CSPW and JISS. .................................................... 85
Figure 3.12 Comparative average rate of diffusivity of caesium from 3% CsCl PFA:OPC
CPSs in DW, CSPW and JISS. ................................................................. 85
Figure 3.13 Comparative average rate of diffusivity of sulphate from BFS:OPC CPSs in
DW, DSPW, CSPW, JISS. ........................................................................ 91
Figure 3.14 Comparative average rate of diffusivity of sulphate from PFA:OPC CPSs in
in DW, CSPW, JISS ................................................................................. 92
Figure 3.15 Illustration of ion disposition in CPS. ..................................................... 101
Figure 4.1 Rate of diffusivity of cations (a) and anions (b) from control BFS:OPC CPS
in DW ..................................................................................................... 125
Figure 4.2 Rate of diffusivity of cations (a) anions (b) from ≈3% SrCl2 BFS:OPC CPS in
DW ......................................................................................................... 126
Figure 4.3 Rate of diffusivity of cations (a) and anions (b) from ≈3% CsCl BFS:OPC
CPS in DW ............................................................................................. 127
Figure 4.4 Rate of diffusivity of cations (a) Co2+ (b) and anions (c) from ≈1.27 % CoCl2
BFS:OPC CPS in DW ............................................................................. 129
Figure 4.5 Rate of diffusivity of cations (a) and anions (b) from combined metal
BFS:OPC CPS in DW ............................................................................. 130
Figure 4.6 Rate of diffusivity of cations (a) and anions (b) from aged control BFS:OPC
CPS in DW ............................................................................................. 131
xx
Figure 4.7 Rate of diffusivity of cations (a) anions (b) from aged ≈3% SrCl2 BFS:OPC
CPS in DW ............................................................................................. 132
Figure 4.8 Rate of diffusivity of cations (a) Cs+ (b) and anions (c) from aged ≈3% CsCl2
BFS:OPC CPS in DW ............................................................................. 134
Figure 4.9 Rate of diffusivity of cations (a) Sr2+ (b) and anions (c) from ≈0.3% SrCl2
BFS:OPC CPS in DW ............................................................................. 136
Figure 4.10 Rate of diffusivity of cations (a) Cs+ (b) and anions (c) from ≈0.3% CsCl
BFS:OPC CPS in DW ............................................................................. 138
Figure 4.11 Rate of diffusivity of cations (a) Sr2+ (b) and anions (c) from ≈0.3% SrCO3
BFS:OPC CPS in DW ............................................................................. 140
Figure 4.12 Rate of diffusivity of cations (a) Sr2+ (b) and anions (c) from ≈3% SrCO3
BFS:OPC CPS in DW ............................................................................. 142
Figure 4.13 Rate of diffusivity of cations (a) and anions (b) from control BFS:OPC CPS
in tap water (open circuit) ....................................................................... 143
Figure 4.14 Rate of diffusivity of cations (a) and anions (b) from ≈3% SrCl2 BFS:OPC
CPS in tap water (open circuit) ............................................................... 144
Figure 4.15 Rate of diffusivity of cations (a) and anions (b) from ≈3% CsCl BFS:OPC
CPS in tap water (open circuit) ............................................................... 145
Figure 4.16 Rate of diffusivity of cations (a) and anions (b) from ≈3% SrCO3 BFS:OPC
CPS in tap water (open circuit) ............................................................... 146
Figure 4.17 Rate of diffusivity of cations (a) and anions (b) from ≈3% SrCl2 BFS:OPC
CPS in tap water (closed circuit) ............................................................. 147
Figure 5.1 Rate of diffusivity of cations (a) and anions (b) from control PFA:OPC CPS
in DW ..................................................................................................... 159
Figure 5.2 Rate of diffusivity of cations (a) and anions (b) from ≈ 3% SrCl2 PFA:OPC
CPS in DW ............................................................................................. 160

xxi
Figure 5.3 Rate of diffusivity of cations (a) and anions (b) from ≈ 3% CsCl PFA:OPC
CPS in DW ............................................................................................. 161
Figure 5.4 Rate of diffusivity of cations (a) and anions (b) from ≈3% SrCO3 PFA:OPC
CPS in DW ............................................................................................. 162
Figure 5.5 Rate of diffusivity of cations (a) and anions (b) from ≈0.3% SrCl2 PFA:OPC
CPS in DW ............................................................................................. 163
Figure 5.6 Rate of diffusivity of cations (a) and anions (b) from ≈0.3% CsCl PFA:OPC
CPS in DW ............................................................................................. 164
Figure 5.7 Rate of diffusivity of cations (a) and anions (b) from control PFA:OPC CPS
in tap water (open circuit) ....................................................................... 165
Figure 5.8 Rate of diffusivity of cations (a) and anions (b) from ≈3% SrCl2 PFA:OPC
CPS in tap water (open circuit) ............................................................... 166
Figure 5.9 Rate of diffusivity of cations (a) and anions (b) from ≈3% CsCl PFA:OPC
CPS in tap water (open circuit) ............................................................... 167
Figure 5.10 Rate of diffusivity of cations (a) and anions (b) from ≈3% SrCO3 PFA:OPC
CPS in tap water (open circuit) ............................................................... 168
Figure 6.1 Rate of diffusivity of cations (a) and anions (b) from control BFS:OPC CPS
in CSPW ................................................................................................. 178
Figure 6.2 Rate of diffusivity of cations (a) and anions (b) from control BFS:OPC CPS
in DSPW ................................................................................................. 179
Figure 6.3 Rate of diffusivity of cations (a) anions (b) from ≈3% SrCl2 BFS:OPC CPS in
CSPW .................................................................................................... 180
Figure 6.4 Rate of diffusivity of cations (a) anions (b) from ≈3% SrCl2 BFS:OPC CPS in
DSPW .................................................................................................... 181
Figure 6.5 Rate of diffusivity of cations (a) anions (b) from ≈3% CsCl BFS:OPC CPS in
CSPW .................................................................................................... 182

xxii
Figure 6.6 Rate of diffusivity of cations (a) anions (b) from ≈3% CsCl BFS:OPC CPS in
DSPW .................................................................................................... 183
Figure 6.7 Rate of diffusivity of cations (a) anions (b) from ≈3% SrCO3 BFS:OPC CPS
in CSPW ................................................................................................. 184
Figure 6.8 Rate of diffusivity of cations (a) anions (b) from ≈3% SrCO3 BFS:OPC CPS
in DSPW ................................................................................................. 185
Figure 6.9 Rate of diffusivity of cations (a) anions (b) from ≈0.3% SrCl2 BFS:OPC CPS
in CSPW ................................................................................................. 186
Figure 6.10 Rate of diffusivity of cations (a) anions (b) from ≈0.3% SrCl2 BFS:OPC
CPS in DSPW ........................................................................................ 187
Figure 6.11 Rate of diffusivity of cations (a) anions (b) from ≈0.3% CsCl BFS:OPC CPS
in CSPW ................................................................................................. 188
Figure 6.12 Rate of diffusivity of cations (a) anions (b) from ≈0.3% CsCl BFS:OPC CPS
in DSPW ................................................................................................. 189
Figure 6.13 Rate of diffusivity of cations (a) anions (b) from ≈0.3% SrCO3 BFS:OPC
CPS in CSPW ........................................................................................ 190
Figure 6.14 Rate of diffusivity of cations (a) anions (b) and Sr2+ (c) from ≈0.3% SrCO3
BFS:OPC CPS in DSPW ........................................................................ 192
Figure 7.1 Rate of diffusivity of cations (a) and anions (b) from control PFA: OPC CPS
in CSPW ................................................................................................. 200
Figure 7.2 Rate of diffusivity of cations (a) and anions (b) from ≈3% SrCl2 PFA: OPC
CPS in CSPW ........................................................................................ 201
Figure 7.3 Rate of diffusivity of cations (a) and anions (b) from ≈3% CsCl PFA: OPC
CPS in CSPW ........................................................................................ 202
Figure 7.4 Rate of diffusivity of cations (a) and anions (b) from ≈3% SrCO3 PFA: OPC
CPS in CSPW ........................................................................................ 203
Figure 8.1 Rate of diffusivity of cations (a) and anions (b) from control CPS in JISS . 213

xxiii
Figure 8.2 Rate of diffusivity of cations (a) and anions (b) from ≈3% SrCl2 CPS in JISS
............................................................................................................... 214
Figure 8.3 Rate of diffusivity of cations (a) and anions (b) from ≈3% CsCl CPS in JISS
............................................................................................................... 215
Figure 8.4 Rate of diffusivity of cations (a) and anions (b) from ≈3% SrCO3 CPS in JISS
............................................................................................................... 216
Figure 9.1 comparative plot of average rate of diffusivity of sulphate from PFA:OPC in
JISS, PFA:OPC in DW and BFS:OPC in JISS ........................................ 223
Figure 9.2 Rate of diffusivity of cations (a) and anions (b) from control CPS in JISS . 226
Figure 9.3 Rate of diffusivity of cations (a) and anions (b) from ≈3% SrCl2 CPS in JISS
............................................................................................................... 227
Figure 9.4 Rate of diffusivity of cations (a) and anions (b) from ≈3% CsCl CPS in JISS
............................................................................................................... 228
Figure 9.5 Rate of diffusivity of cations (a) and anions (b) from ≈3% SrCO3 CPS in JISS
............................................................................................................... 229

xxiv
List of abbreviations
BFS Blast furnace slag
cfu colony-forming unit
CPS Cement paste sample
C-S-H Calcium silicate hydrate phase
CSPW concentrated Sellafield pore water
De effective diffusion coefficient
DSPW diluted Sellafield pore water
d-v diffusivity vessel
DW distilled water
GDF Geological disposal facility
HLW High Level Waste
ICP-MS Inductively coupled plasma mass spectroscopy
ILW Intermediate Level Waste
JISS John Innes No. 3 soil solution
K Equilibrium constant
KSP solubility product
LLW Low Level Waste
MIC Microbial induced corrosion
NFC Nuclear Fuel Cycle
OPC Ordinary Portland cement
p Pearson coefficient
PFA Pulverised fly ash
xxv
PGRC Phased Geological Repository concept
Q Reaction quotient
r-v reservoir vessel
SEM-EDAX Scanning electron microscopy - energy dispersive X-ray
SOB sulphide oxidising bacteria
SRB sulphate reducing bacteria
w/c Water cement ratio

Chapter 1: Introduction
1
1.1 Radioactive waste
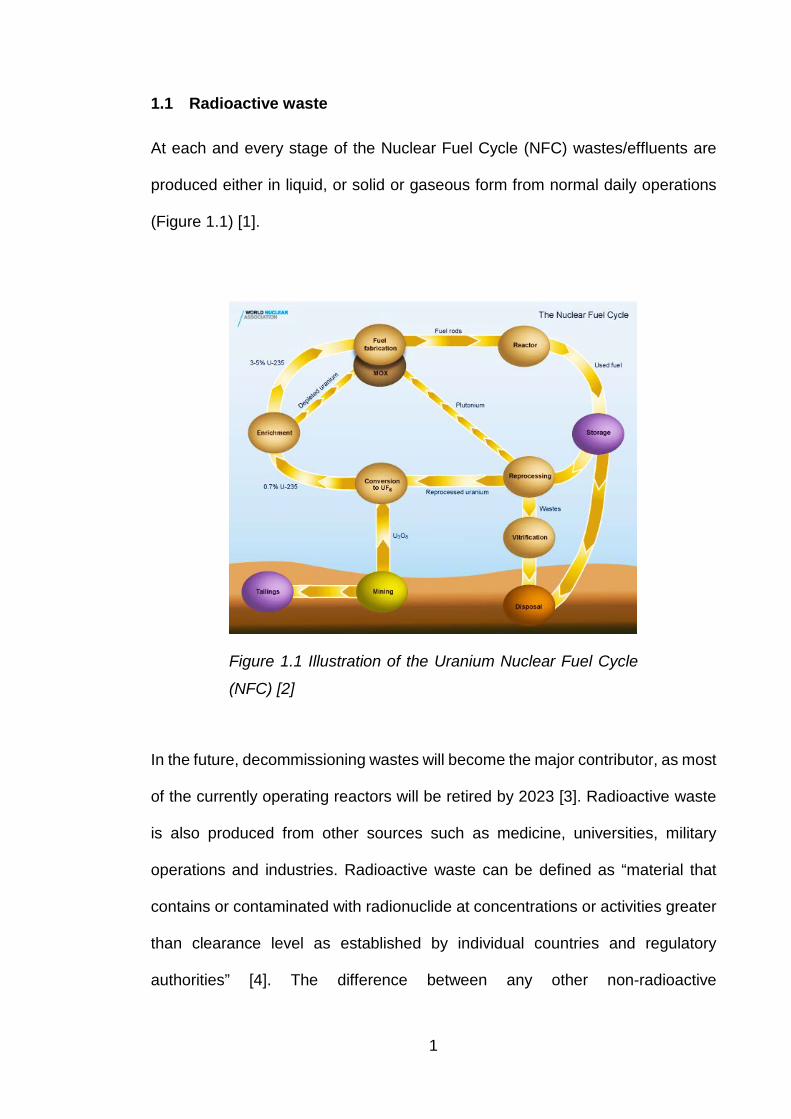
At each and every stage of the Nuclear Fuel Cycle (NFC) wastes/effluents are
produced either in liquid, or solid or gaseous form from normal daily operations
(Figure 1.1) [1].
Figure 1.1 Illustration of the Uranium Nuclear Fuel Cycle
(NFC) [2]
In the future, decommissioning wastes will become the major contributor, as most
of the currently operating reactors will be retired by 2023 [3]. Radioactive waste
is also produced from other sources such as medicine, universities, military
operations and industries. Radioactive waste can be defined as “material that
contains or contaminated with radionuclide at concentrations or activities greater
than clearance level as established by individual countries and regulatory
authorities” [4]. The difference between any other non-radioactive

2
waste/chemical waste and radioactive waste is that the latter can be
accompanied with significant levels of ionising radiation and may require
immobilisation to prevent spreading around the biosphere. During the normal
operation of a typical reactor over 200 radionuclides are produced; most of the
radionuclides are relatively short-lived and decay to low levels within a few
decades [5]. Some radioactive waste has the potential to specifically target
aquatic and terrestrial ecosystems, due to their long half-lives and damaging
effects on cells as compared to other chemical pollutants [6]. The radioactive
wastes consist of various irradiated materials, which is a subject of concern. The
main objective of radioactive waste management is to deal with it in a manner
that protects human health and the environment. It is sensible to understand
various classifications of wastes to execute the appropriate management system.
1.1.1 Composition and classification of waste radioactive waste
The options for disposal of nuclear waste will be dependent on the radionuclide
content of the waste (Table 1.1). These wastes/effluents can be classified as Low
Level Waste (LLW), Intermediate Level Waste (ILW) and High Level Waste
(HLW) depending on their radioactive content [7].

3
Table 1.1 Classification of radioactive waste in the UK [8]
LLW
The largest volume of wastes produced is LLW, from cooling
waters, plant operations, and across the nuclear fuel cycle
including some parts of fuel reprocessing cycle (>4 MBq/m2
alpha, to 12 MBq/m2 beta/gamma), which contain only small
levels of radionuclides and certain nuclide which decay in
relatively short period of time.
ILW ILW wastes, from laboratory operations and fuel reprocessing,
contain higher amounts of radioactivity than LLW and may
require special shielding. It mainly comprises resins, chemical
sledges and reactor components, graphite from reactor cores, as
well as contaminated materials from reactor decommissioning.
HLW HLW consists of highly radioactive fission products, used fuel
itself and some transuranic elements generated in the reactor
core and are the type of nuclear waste with the highest activity (>
3.7 x 10⁶ kBq/m2 alpha, to > 37 x 106 kBq/m2 beta/gamma). Due
to the high level of radioactivity, the heat produced by the
radioactive decay of the material requires cooling, as well as
special shielding during handling and transport
Most of the wastes/effluents arising at the front end of the cycle contain natural
occurring radioisotopes and are likely to be categorised as low level wastes but
the quantities involved will be significant. After the fuel has undergone irradiation,
wastes/effluents are produced that fall into the Intermediate and High Level
Waste categories. These wastes are substantially smaller in quantity but as they

4
contain fission products and other actinides require more engineered treatment
and disposal systems.
LLW has a comparative short half-life with 90% of the elements becoming
harmless after 100 years and is currently disposed of at the Drigg landfill site in
Cumbria. Most ILW that has been produced since 1990 is currently being held in
temporary surface storage facilities at various locations within the UK. The period
of risk to public spans from hundred years to over one thousand years. The spent
fuel is reprocessed; the separated waste is vitrified by incorporating it into
borosilicate (Pyrex) glass which is sealed inside stainless steel canisters for
eventual disposal [8].
1.1.2 UK radioactive waste inventory
The Radioactive Waste & Materials Inventory, updated every three years,
provides the latest national record on radioactive wastes and materials in the UK.
An overview of these data is given in Table 1.2. The negative number for HLW
future arising indicates that the volumes will fall in the future due to two reasons,
one being vitrification of waste which is one third of the volume of the original
waste. Secondly, the UK is returning processed HLW to overseas customers in
vitrified forms [9].
Table 1.2 UK Radioactive Waste inventory at 1 April 2013 [9]
Waste category
Volume (m3)
Reported at
1 April 2013 Estimated future
arisings Lifetime
Total
HLW 1,770 -700 1,080
ILW 95,600 190,000 286,000
LLW 66,700 1,300,000 1,370,000
Total 164,070 1,489,300 1,657,080
5
1.2 Radioactive waste disposal
Nuclear waste disposal is highly regulated with in many instances decades of
proven experience, but for ILW and HLW research is still underway to ensure the
selected routes i.e. deep geological disposal can meet stringent requirements
[10]. There have been emphases on the disposal of irradiated graphite (i-
graphite) that will arise from the decommissioning of UK graphite moderated
reactors; Magnox and AGRs. All ILW waste such as Magnox swarf, i-graphite etc.
will be encapsulated in cement within a suitable metal container, stored prior to
being deposited in a Geological Disposal Facility (GDF) [11]. I-graphite is
categorised as ILW largely due to its 14C content (10 to 100ppm) as the Drigg’s
(LLW repository for the UK) 14C authorisation is so restrictive that only a fraction
of the UK’s i-graphite (~ 95,000 tones Magnox and AGR) could be disposed of
[12].
ILW contain enough radioactivity that it requires special treatment to minimise
any potential release into environment. Nuclear Decommissioning Authority
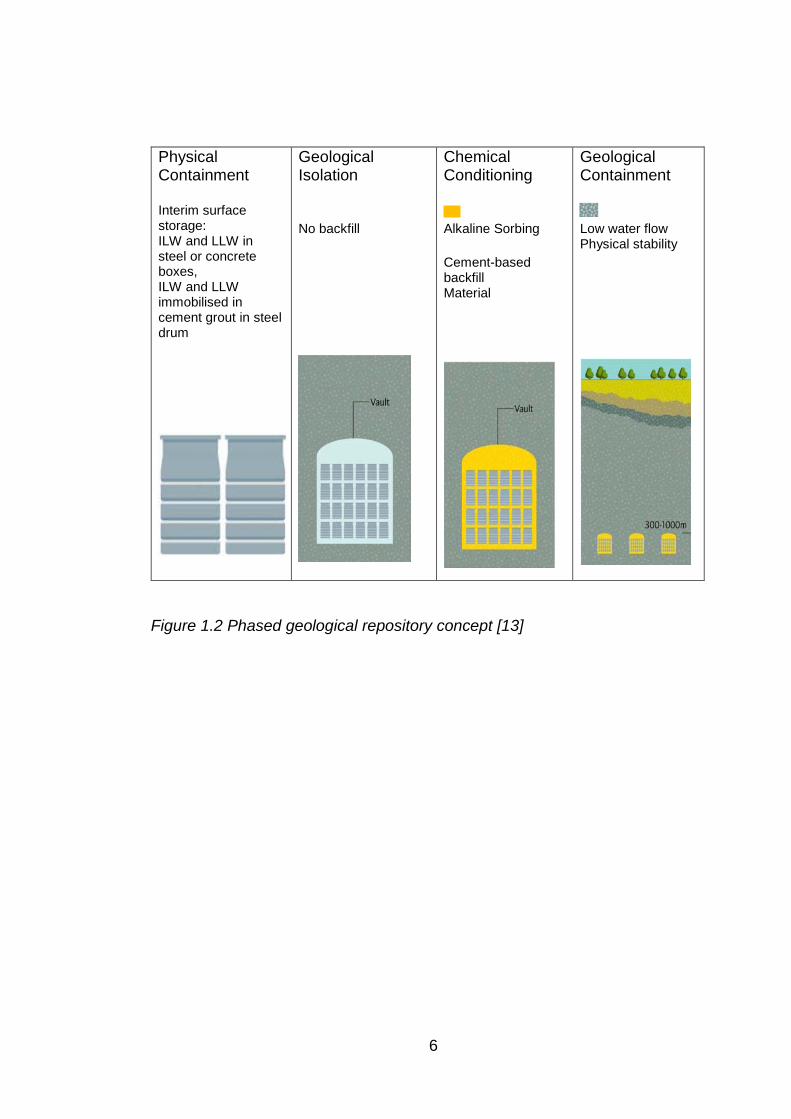
(NDA) has developed Phased Geological Repository concept (PGRC) (Figure
1.2) for safe and long-term management of radioactive waste, which is a multi-
barrier, multi-phased approach based on placing the waste deep underground,
beyond any disruption from any man – made events.
The phased nature of the PGRC involves number of processes/stages in the
management and eventual disposal of radioactive waste. Figure 1.3 shows the
summary of key stages involved in the radioactive waste management in PGRC.
6
Physical Containment Interim surface storage: ILW and LLW in steel or concrete boxes, ILW and LLW immobilised in cement grout in steel drum
Geological Isolation No backfill
Chemical Conditioning Alkaline Sorbing Cement-based backfill Material
Geological Containment Low water flow Physical stability
Figure 1.2 Phased geological repository concept [13]

7
Figure 1.3 The PGRC for long term management of HLW/ILW
1.3 Immobilisation of waste
Immobilisation of waste is essential part of waste management in order to convert
the waste into to a form suitable for further handling, transport storage and

8
disposal. Technically, the purpose of stabilisation is to convert the waste to a
physically and chemically more stable form, by binding the waste into the cement.
Cementation is considered as a most widely robust and cost-effective technology
for conditioning of ILW [14]. For most ILW, the waste will be immobilised in
cement-based materials within stainless steel drums.
Encapsulation of wastes using Ordinary Portland Cement (OPC) has several
benefits, which include:
(a) inexpensive and mechanically, physically and chemically stable for
handling, transport and disposal.
(b) provide radiation shielding
(c) maintain a high pH which in turn decreases radionuclide solubility
(d) can incorporate many ions into solid solution and are tolerant to a wide
variety of wasteforms.
Although cementation is widely used within the civil nuclear industry worldwide
for encapsulation of higher activity wastes (such as ILW), some of the waste
streams generated by the industry are difficult to encapsulate using this method
and other techniques have been evaluated [15]. Most fall into the category of
polymeric encapsulation and studies have shown that they provide a number of
advantages for treatment of contentious waste streams. Their superior
mechanical properties allow for good waste loadings (up to 75 % by weight for
graphite, for example), allowing the number of packages to be reduced, while
maintaining the integrity of the waste forms. The potential for polymers to degrade
radiolytically whilst stored or even worse during disposal liberating gaseous
products is a major consideration of the regulatory authorities.
9
1.4 Cement
Cement or Ordinary Portland Cement (OPC) in particular, can be defined as a
bonding material having adhesive and cohesive properties used in conjugation
with additives such as stones, sand and other additives/aggregates [16]. The term
hydraulic cement derives from the fact that the cement have properties of setting
and hardening in presence of water. The name “Portlanland” originates from a
trade name used by Joseph Aspdin (1779-1835) in 1824 who patented the clay
and limestone cement, because it looked like the stone quarried on the isle of
Portland. Portland cement was first used in the civil engineering project by
Isambard Kingdom Brunel (1806 -1856), as the lining for Thames Tunnel [16].
OPC is produced by burning limestone and clay or shale (source of
aluminosilicates) at high temperature (1500°C) to produce cement clinker. The
final product consist of ground 95% cement clinker with 5% gypsum to produce
the final product cement. The process can be carried out dry or mixed with water;
depending on the technique employed, it’s classified as dry or wet. About 78%
of cement produced in Europe is generated using the dry process. Calcium
sulphate which is commonly referred to as gypsum controls the rate of settling
and influences the rate and strength development. A typical clinker has a
composition of 67% CaO, 22% SiO2, 5% Al2O3, 3% Fe2O3 and 3% other materials
[16]. The composition of OPC depends on the origin of the limestone and clay
used in the manufacturing process. Cement is categorised into five different types
under European standard EN 197-1 [17] (Table 1.3 ).

10
Table 1.3 Categorisation of cement under European standard EN-197-1[17]
Category Description Proportion of cement clinker
Proportion of other constituents
CEM I Portland cement
95-100% 0-5%
CEM II Blended cement (sub-divided depending on the material used, e.g. ‘Portland fly ash cement’, ‘Portland slag cement’, ‘Portland limestone cement’, etc.)
65-94% 6-35%
CEM III Blastfurnance cement (incorporating ground granulated blastfurnance slag or G.G.B.S.)
5-64% 35-95%
CEM IV Pozzolanic cement (incorporating natural or synthetic pozzolanic material, e.g. volcanic ash)
45-89% 11-55%
CEM V Composite cement (incorporating both G.G.B.S. and pozzolanic material)
20-64% 18-50% G.G.B.S 18-50% Pozzolanic material.
1.4.1 Cement Composites
The term blended cement refers to composites of cements that are hydraulic
cements composed of OPC and one or more inorganic materials that play an
important role in cement hydration reaction and hydration/final products.
Admixtures such as CaCl2, also influences the cement hydration process but do
not contribute to the final product. The most important additives are Blast Furnace
slag (BFS) and Pulverised Fly Ash (PFA) (Table 1.4). Blended cement with up to
90% BFS and 75% PFA, are currently being employed in nuclear industry for
encapsulation [18, 19].
11
1.4.1.1 Blast Furnace Slag (BFS)
BFS is a by-product generated during iron making process. The limestone that
has been used to remove the acidic impurities from iron ore are broken down to
form carbon dioxide and calcium oxide in the high temperature of blast furnace.
The calcium oxide reacts with the acidic impurities in molten steel to transfer them
into blast furnace slag. The composition of slag varies depending on the nature
of ore, the composition of limestone flux and the kind of iron being made. The
major constituents of BFS include lime, silica, alumina and magnesia. The
chemical composition of BFS is CaO (30%-50%), SiO2 (28%-38%) and Al2O3
(8%-24%). In the UK, BFS is produced in three steel making facilities at Teesside,
Scunthorpe and Port Talbot [16].
1.4.1.2 Pulverised Fly Ash (PFA)
PFA is obtained by electrostatic or mechanical precipitation of dust from flue gas
that are generated after combustion of coal in coal fired power station. PFA falls
into subdivision of artificial pozzolanas and consist of silica and alumina. The
chemical composition depends on the inorganic mineral composition of the coal
gangue. Based on calcium content, PFA is categorised into two types: low –
calcium flyash (Class F), containing less than 10% of analytical CaO and high-
calcium flyash (class C), containing 15-40% analytical CaO [20]. Low-calcium
flyash is predominantly being used due to technical benefits and economic factors
[21, 22].

12
Table 1.4 Composition of OPC, BFS and PFA (%) (literature values) [23-25]
Material CaO SiO2 Al2O3 Fe2O3 MgO SO3 Na2O K2O
OPC 61.3 20.1 4.2 2.5 3.1 4.0 0.2 0.4
BFS 45.3 33.9 13.1 1.7 2.0 trace n.d. n.d
PFA 3.1 46.2 27.0 10.4 2.0 1.6 0.9 3.3
From the Table 1.5, the main constituents of cement can be seen to be di and tri
calcium silicate/aluminosilicates. Thus addition of water forms major component
which include calcium silicate hydrates (C-S-H) and portlandite Ca(OH)2. The
chemistries of these components must be considered when determining the
stability of cement and concrete.
Table 1.5 Composition of Portland cement [16]
Cement Compound Chemical Formula
Tricalcium silicate (C3S) Ca3SiO5 or 3CaO.SiO2
Dicalcium silicate (C2S) Ca2SiO4 or 2CaO.SiO2
Tricalcium aluminate (C3A) Ca3Al2O6 or 3CaO .Al2O3
Tetracalcium aluminoferrite (C4AF) Ca4Al2Fe2O10 or 4CaO.Al2O3.Fe2O3
Gypsum CaSO4.2H2O
1.5 Degradation of concrete
The ultimate destination of some of these encapsulated wastes is in a deep
geological facility (GDF), where for many years the wastes will remain inert to
their environment. The integrity of the waste form will have to meet stringent
conditions, not least timeframe; for a deep geological repository the integrity will
be considered over a 100,000 years, due to the GDF conditions as they present
significant challenges with the varying environment conditions from operation to

13
post closure. These varying conditions will also influence the presence, growth
pattern and impact of microorganisms on encapsulated waste. The ability of
cement-based materials to resist the deterioration depends on the environmental
conditions as well as material properties. Most cement hydration phases are
unstable below pH 10. This raises a concern in regard to interaction of hardened
cement paste in natural water which is near neutral pH and may have low mineral
content, it is one of the worst case scenario which can be envisaged [14, 26], this
poses a risk to thermodynamic equilibrium of cement paste solids with its pore
solution may lead to dissolution. In GDF of seeping water, concrete durability will
be potentially affected by pH, redox condition and the salinity of incoming ground
water. This produces a progressive neutralisation of the alkaline nature of the
cement paste, removing alkalis and dissolving portlandite, i.e. calcium hydroxide
and calcium silicate hydrate (C-S-H) gel [27]. Not surprisingly, the interactions
between the nuclear waste, cement, steel container, ingress of pore water and
leaching of radionuclides, have received extensive studies [28-32] . However,
most of these studies are of short duration and have used distilled/deionised (d/d)
water which characterises the concentration gradient, diffusion leaching type of
studies. The influence of salinity and presence of ions in leachate is not well
known despite the fact that several countries (Canada, Finland, Sweden, possibly
UK) are planning to emplace the waste in GDF which may likely have ingress of
saline water and/ or brine. Few of these studies have been carried out using
accelerated leaching [33-37] . Although such studies have generated data on long
–term leaching scenario, they do not replicate the actual leaching process that
might take place in GDF facilities. There have been few studies carried out on
leaching concrete material in the presence of aqueous medium with high salinity

14
and ionic concentration, which may represent the ground water leaching scenario
in GDF. However, such studies have been carried out cementitious materials
which have been subjected to harsh marine environment [30]. There are few
studies that have addressed the implications of microbial activity on pore water
chemistry and hence on the mobility of radionuclides under investigation. Those
studies that have included microbial activity have tended to concentrate on the
implications to encapsulated spent fuel in a thick-walled copper cylinder (direct
disposal) [38].
The use of cement and potential effect of groundwater and minerals has raised
many concerns and assurance is needed in terms of their integrity and
subsequent release of radionuclide from the encapsulated waste form. Although
cement (in the form of concrete) has been used for underground constructions
for many years, scant information is known about its long-term integrity as an
encapsulated wasteform, the nature of chemical interactions between hardened
cement paste and groundwater in particular, saline water and brine. Although the
durability of the cementitious material has been confirmed over periods in excess
of 100 years; has primarily been designed for civil engineering purposes. The use
of OPC was not designed for the purpose of waste encapsulation for disposal.
The vulnerability depends on both internal properties of the material and the
external environmental factors that contribute to the degradation process.
Degradation of concrete can take place by various mechanisms such as alkali -
silica reaction, carbonation, chloride or sulphate attack, leaching, abrasion,
corrosion etc. [16].

15
1.5.1 Dissolution in ground water
Cement paste degradation takes place due to combined effect of diffusion-
transport effects and chemical reactions. One of the major factor contributing
towards the dissolution of hardened cement paste is its porous nature, in which
case a large amount of water flow may be able to dissolve the sparingly soluble
components present in the cement paste. This transportation is diffusion
controlled when the pore size distribution of cement paste is small. As the volume
of the flow paths increases it becomes convection controlled [39, 40].
The difference in the concentration causes the net transfer of ions from higher
concentration (concrete) to lower concentration (aqueous solution) in the case of
diffusion. This relevant property of concrete is referred to as diffusivity [16].
Steady-state diffusion is normally assumed to be the controlling step when
determining the leachability of nuclear wastes, when encapsulated into
cements/binders, hence Fick’s law is assumed to be the rate controlling
mechanism for release [41].
This diffusion is best described by Fick’s Law; where no pressure head exists and
the magnitude of mass transfer by diffusion is dependent on the concentration
gradient across the medium concerned:
Where
F = mass flux (mass of solute per unit area per unit time)
D is diffusion coefficient (area per unit time) and
dD/dx is the concentration gradient.

16
The dissolution and effective migration of encapsulated cations/radionuclides
from cement matrix to surrounding aqueous media will take place once the
dissolution of C-S-H gel and change in pH takes place.
Figure 1.4 Predicted evolution of pore solution pH during leaching by pure water
[42].
The chemical changes taking place due to the movement of water into the porous
structure can be explained by using Figure 1.4. The contents of pore water is
highly charged with Na+ and K+ and Ca2+ and OH-, this creates a concentration
gradient between a aqueous solution with low mineral content and interstitial
solution. The movement of water into the hardened cement paste will bring down
the pH by initially dissolving the most soluble species i.e. Na+ and K+ which
controls the pH of the pore solution above 13 at initial stages of dissolution. This
stage will produce high plume of pH in the surrounding ground water (if stagnant
conditions exist). The stability and the thermodynamic equilibrium of pore solution
with its solid is disturbed once the pH of the pore water is changed [26].The

17
presence of strong alkali (NaOH and KOH) are dominant in pore water solution
which gives the pH values of 13.5; at high pH, the solubility of Ca2+ is controlled
by Na+ and K+ in the pore fluid. Once the alkali have been leached out, the pH of
pore fluid which comes down to 12.5 is controlled by Ca(OH)2 [37]. The relatively
high content of unreacted Ca(OH)2 in the hardened cement paste maintains this
pH for a longer time. The presence of Mg2+ and CO32- ions in the ground water
may precipitate to give brucite (Mg(OH)2). Once all the unreacted Ca(OH)2 has
been removed, the Ca/Si ratio falls down to about 1.8 from its initial value of 4.5.
At this point depending on the Ca2+ and SiO44- content of the leachate, two
possible processes may take place:
(a) In low salinity ground water or distilled water, slow congruent dissolution of
CSH takes place which drops the pH continuously to around 10.8, until all the
CSH is removed. This process takes considerable time.
(b) The ground water containing significant amount of Ca2+ and SiO44-;
incongruent dissolution of CSH takes until Ca2+ and SiO44- are completely
removed. The presence of Ca2+ and SiO44- may form minerals such as ettrigent
and brucite, until the buffering capacity of the cement is consumed. Brucite can
form protective layers on cement paste, hence may slow down the dissolution
process in saline ground water. The high plume of pH will persist in stagnant
water and will influence the absorption of cations/radionuclides except some of
the alkaline metals such as Cs+ and Sr2+ which are poorly absorbed into the
cement [43].
18
1.5.2 Carbonation
Deterioration of cement paste takes place due to its reaction with carbon dioxide.
Dissolved species of carbonate and bicarbonate react with main cement
hydrates, i.e. calcium silicate hydrate, calcium hydroxide and various calcium
aluminate or ferro-aluminate hydrates, in three ways, depending on its mode of
delivery and surrounding environment [14]:
(a) Added as an aggregate, calcium carbonate, a supplementary cementing
material or with waste [44]
(b) In gaseous form, as carbon dioxide from local environment [27].
(c) Dissolved in ground water [27]
Carbonation of cement paste takes place in following sequential manner
Ca(OH)2 (s) + CO2(g) → CaCO3 (s) + H2O (1.1)
Calcium hydroxide plays a predominant role in the carbonation process, however,
other hydration products of cement such as C-S-H and unhydrated cement
compounds can react with CO2 in following manner.
CxSyHz + (x-x')CO2 → Cx'SyHz' + (x-x')CaCO3 + (z-z')H2O (1.2)
As shown in the reaction 1.2, the composition of C-S-H changes upon its
depletion of calcium content. As the carbonation process continues, Ca:Si ratio

19
decreases until C-S-H is completely decalcified and finally transformed into
calcium carbonate and highly polymerised silica gel. (1.3)
CxSyHz + xCO2 → xCaCO3 +ySiO2 + zH2O (1.3)
The carbonation doesn’t proceed to other hydrates until the pH has dropped
below 12.4 [45].
1.5.2.1 Carbonation of unhydrated cement
Carbonation can also accelerate the hydration process of cement paste by
converting C3S and C2S into calcium carbonate and C-S-H, thus
C3S + yH2O + (3- x)CO2 → xCSy H + (3- x)CaCO3 (1.4)
C2S + yH2O + (2- x)CO3 → xCSy H + (3- x)CaCO3 (1.5)
Carbonation affects the physical properties of the hardened cement paste. The
conversion of soluble cement hydrates to relatively insoluble phases, leads to
alteration of microstructure of hydrated paste [46, 47], thus reduces the
permeability and hence leaching of some of the waste form [48]. However, the
dissolution of Ca(OH)2 and C-S-H buffer brings down the pH of pore solution.
This may increase the solubility of some of the cations/radionuclides from
encapsulated waste form [49]. Reference studies have shown that the totally
carbonated layer will have a pH of about 8.3 [50]. Carbonation may also lead to
20
shrinkage due to the evaporation of waste generated from the carbonation
reaction [45], hence cracking of the cement paste. This would influence the
leaching and mobilisation of encapsulated waste form.
1.5.3 Chloride interaction
The interaction of chloride and cement has received significant attention [51, 52]
in relation with corrosion of steel reinforced concrete materials. Possibilities of
chloride in concrete arises if it is made up with seawater or saline groundwater or
use of sea-dredged aggregates. Chloride present in the mixture generally enters
the AFm (ferroaluminate) phase with 60% of the Cl- bound to the cement paste
as monochloroaluminate and the remainder dissolved in the pore water [53, 54].
When Cl- in combination with the AFm phase, results in the formation of Friedel’s
salt (4CaO.Al2O3.(Cl,OH)10), above 40°C, below 20°C, the trichloride complex
(AFt) is formed. The degradation by chloride ingress mostly affects the corrosion
of reinforcement steel bars in the concrete [16]. The high pH of the pore water
maintains the passivation of steel. However, chloride ion in the presence of water
and oxygen destroys the protective oxide film; causing chloride induced corrosion
of steel [27, 54].
1.5.4 Reaction with sulphate ion
Interaction with sulphate ion with cement paste takes place as internal sulphate
(derived with in the cement matrix), as well as external sulphate attack. Sulphate
is commonly found in ground water with calcium, magnesium and to lesser extent
sodium [27, 30]. There have been several studies on sulphate attack on cement
paste leading to physical expansion, leading to cracking and spalling. Both the
mechanisms, internal and external sulphate attack will produce gypsum from the
21
reaction with free Ca(OH)2. The gypsum produced may further react with C-S-H
to produce ettringite and may degrade the cement paste [54].
1.5.5 Organic interaction
The other possibility of affecting the pH of cement paste is interaction of
encapsulated organic material and subsequent production of HCO3-, from the
degradation of cellulose and gloves and HCl, due to radiolysis of chlorinated
polymers such as PVC, will react with OH groups and lower the pH [54, 55], hence
affecting the stability of encapsulated waste.
1.5.6 Microbial degradation
The use of cementitious material in the building industry goes back for centuries.
Thus, there is a relatively large body of data available on the susceptibility of
concrete to microbial attack [56]. One of the concerns raised is the
survival/existence of a viable population of microorganisms at a pH value
equivalent to that of repository concrete that can possibly influence by its
performance by degrading activities such as acid production [57]? Research
evidence has shown that extremophiles can survive at a pH as great as 12 in
laboratory conditions [58]. A number of studies on underground sewers , roads
and bridges, have shown that that the integrity of concrete over extended
timescales can be influenced by microorganisms [59, 60]. These studies have
shown the presence of sulphur-oxidizing bacteria such as Acidithiobacillus
thiooxidans, which produces sulphuric acid under aerobic conditions through the
oxidation of reduced sulphur, sulphide, and thiosulfate compounds [60]. The
sulphuric acid produced dissolves the C-S-H and portlandite cement constituents
[61]. Another example of acid-mediated degradation, is that mediated by acid
22
nitrifying bacteria that use inorganic nitrogen compounds (i.e., ammonium,
nitrite). However, there will be a limited supply of oxygen in GDF in contrary to
sewers and roads and bridges. It is envisaged that , oxygen would no longer be
available once utilised for corrosion, mineral dissolution and microbial redox
reaction [56]. Microbial growth in any habitat will depend on the availability of
nutrients and is usually controlled by growth-limiting factors such as the presence
of the macronutrients, carbon, nitrogen and phosphorus [62].
1.5.6.1 Micro-organisms involved in the biodegradation of concrete
The deterioration of cementitious material is caused by biotic and abiotic factors
and can be categorised by their mechanism of attack. A summary of microbial
degradation of concrete is shown in Figure 1.5. The first report of concrete
degradation dates back to 1900 [63] by Olmstead and Hamlin who reported the
corrosion of concrete sewage pipes due to their exposure to the hydrogen
sulphide gas. Early workers reported that this corrosion resulted from a chemical
reaction between the sewage and the walls of sewage pipes. A range of chemical
by-products/species produced as a result of microbial metabolism have a
detrimental impact on cementitious material.

23
Figure 1.5 Microbial deterioration of cementitious material
Sulphur Species
Microbial metabolism plays an important role in mineral transformation, and
global cycling of the elements throughout nature by Sulphur bacteria, have a
significant role in metabolising sulphur (Figure 1.6). Depending on their metabolic
activities, sulphur bacteria are classified as sulphide oxidising bacteria (SOB) and
sulphate reducing bacteria (SRB). Sulphur is a major microbial metabolite of
Sulphur bacteria.
(a) sulphide oxidising bacteria (SOB)
Sulphur oxidation involves the oxidation of reduced sulphur compounds, such as
sulphide, inorganic sulphur, and thiosulfate to form sulphuric acid. SOBs,
chemolithotrophs , are able to carry out a reaction, coupling the reduction of
carbon dioxide to sulphide oxidation; reduced sulphur compounds are converted
to sulphite and subsequently converted to sulphate by the enzyme sulphite
oxidase [64]. These organisms are blue-green or purple as a result of presence
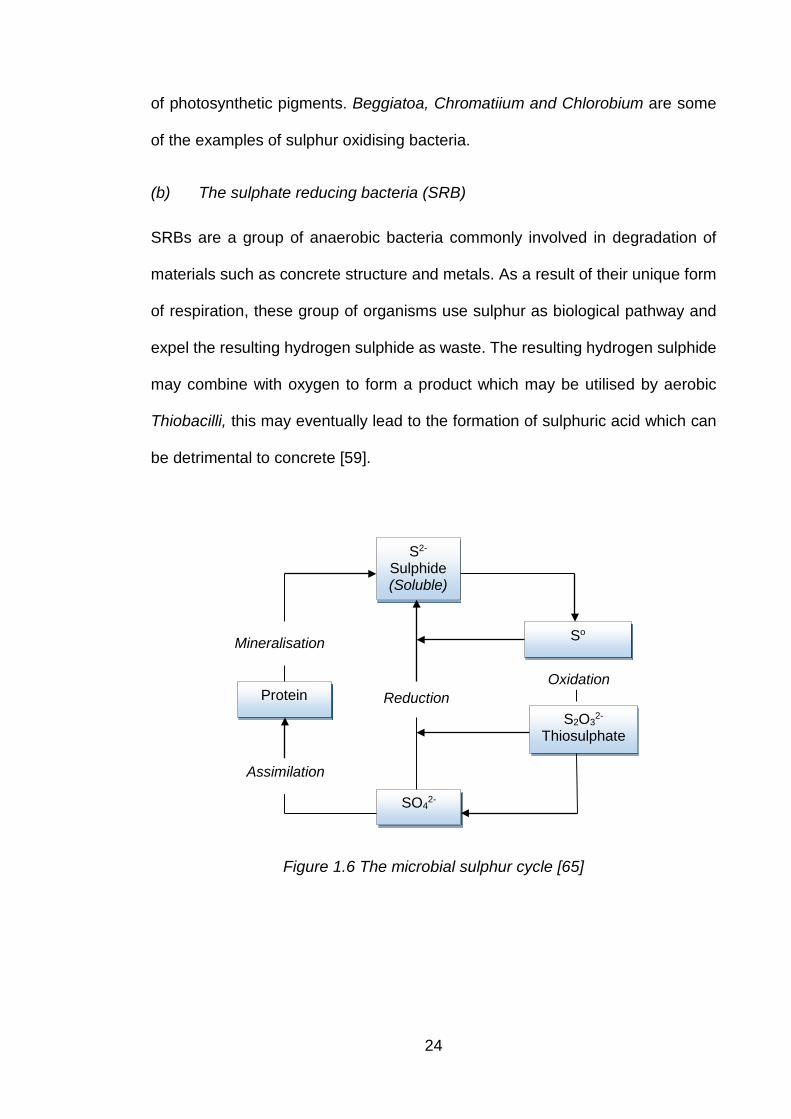
24
of photosynthetic pigments. Beggiatoa, Chromatiium and Chlorobium are some
of the examples of sulphur oxidising bacteria.
(b) The sulphate reducing bacteria (SRB)
SRBs are a group of anaerobic bacteria commonly involved in degradation of
materials such as concrete structure and metals. As a result of their unique form
of respiration, these group of organisms use sulphur as biological pathway and
expel the resulting hydrogen sulphide as waste. The resulting hydrogen sulphide
may combine with oxygen to form a product which may be utilised by aerobic
Thiobacilli, this may eventually lead to the formation of sulphuric acid which can
be detrimental to concrete [59].
Figure 1.6 The microbial sulphur cycle [65]
S2-
Sulphide (Soluble)
So
S2O32-
Thiosulphate
SO42-
Oxidation Reduction Protein
Assimilation
Mineralisation
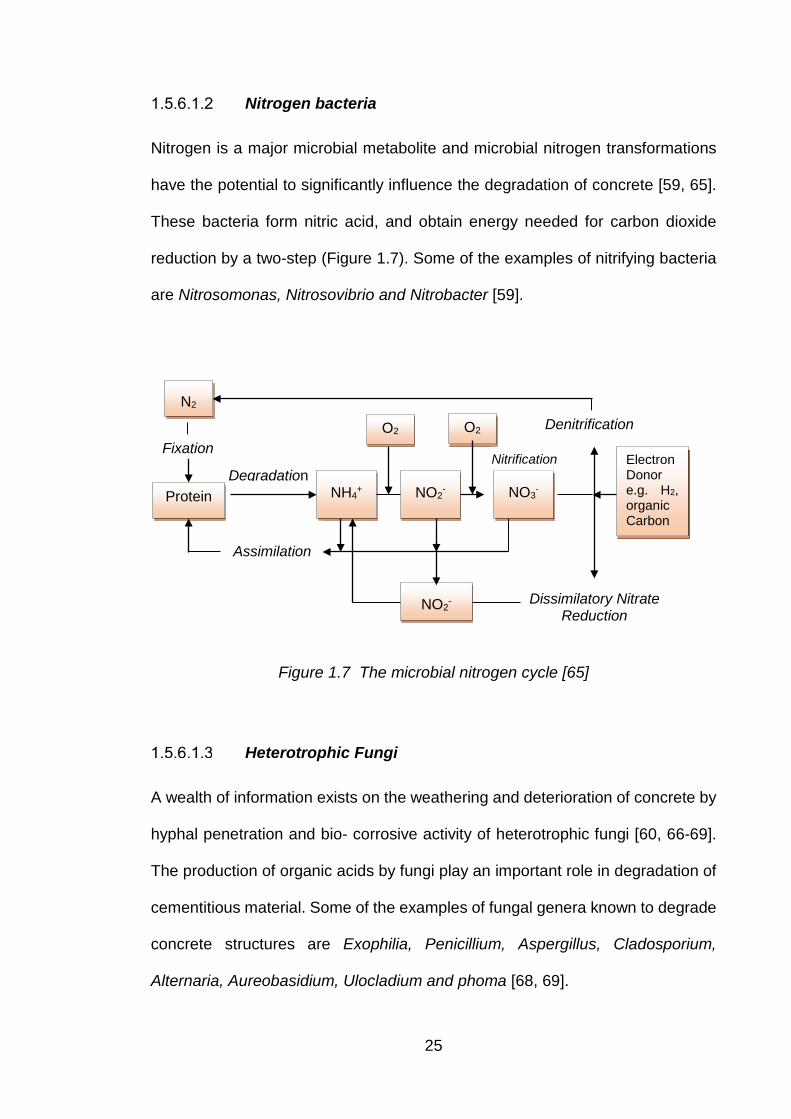
25
Nitrogen bacteria
Nitrogen is a major microbial metabolite and microbial nitrogen transformations
have the potential to significantly influence the degradation of concrete [59, 65].
These bacteria form nitric acid, and obtain energy needed for carbon dioxide
reduction by a two-step (Figure 1.7). Some of the examples of nitrifying bacteria
are Nitrosomonas, Nitrosovibrio and Nitrobacter [59].
Figure 1.7 The microbial nitrogen cycle [65]
Heterotrophic Fungi
A wealth of information exists on the weathering and deterioration of concrete by
hyphal penetration and bio- corrosive activity of heterotrophic fungi [60, 66-69].
The production of organic acids by fungi play an important role in degradation of
cementitious material. Some of the examples of fungal genera known to degrade
concrete structures are Exophilia, Penicillium, Aspergillus, Cladosporium,
Alternaria, Aureobasidium, Ulocladium and phoma [68, 69].
N2
Fixation
Protein Degradation
NH4+ NO2
- NO3-
O2 Denitrification
Electron Donor e.g. H2, organic Carbon
Dissimilatory Nitrate Reduction
NO2-
Assimilation
Nitrification
O2

26
1.6 Potential for microbial activity under conditions within GDF
Any GDF will have a period before closure and post-closure. The pre-closure
phase involves storage and packaging at a nuclear facility, which will then be
transported to an ILW surface handling facility and subsequently placed in the
underground repository in the GDF awaiting closure/backfilling. The period prior
to closure may last from ten years to few hundred years. Post-closure period will
involve backfilling and sealing, during which no further human management will
be involved.
A recent review on Microbiologically Influenced Corrosion (MIC) induced in waste
packages by Humphreys et al. [70], indicated that the UK’s geological
environment that could plausibly hold a GDF will have an indigenous population
of microorganism. Although microbes will be present in both pre- and post-
closure phases, depending upon the particular conditions they may not be
metabolically active [65]; microorganisms will vary spatially and temporarily. The
report also talks about presence of SRBs in severely hyper-alkaline conditions
within “supercontainers”. The report further says that that micro-organisms will
occur within at least some parts of most waste forms, on the surfaces of metal
waste canisters and within the natural environment of a GDF, possibly as a
dormant form of bacteria. These micro-organisms may be active to greater or
lesser degrees, depending upon the particular physic-chemical conditions within
the waste, engineered barrier or rock-water system within which they occur [65].
1.6.1 The potential microbial activity during pre-closure period
It is likely that the potential microbial activity will be present during the pre-closure
phase of GDF, in particular within ILW areas, rather than the HLW. areas
27
Absence of free water, organic matter and heat producing high radiation from a
HLW, may restrict the growth of some microorganism, however, evidence has
shown the presence of viable population of micro-organism in the nuclear ponds
which confirms that some of the micro-organism have high resistance to radiation
[71-73]. Most aerobic microbial activity will occur during pre-closure phase and
may subsequently affect the handling and transport of waste packages. During
pre-closure period, aerobic degradation will be encouraged involving fungi and
acidophilic bacteria, producing organic acid, from cellulose degradation, very
unlikely that the GDF will become anaerobic during this phase [65]. The presence
of artificial light may influence the phototrophic microbial growth (algae and
photosynthetic bacteria) in the presence of moisture, eventually resulting in
biofilm formation and this may influence the anaerobic microbial activities. The
potential source of sulphate would likely be ground water, which will influence the
SRB and SOB growth. Summary of initial screening of the ILW pre-closure
environments (Table 1.6) [65] indicates, in all the three phases of pre-closure
(interim storage, pre-backfilling and post-backfilling pre final) microbes, a source
of sulphate and energy will be present.

28
Table 1.6 Initial screening of the ILW pre-closure environments [65]
Microbes Present
Sulphate Present Energy Sources
Interim Storage
Yes - wide range of organisms dominated by environmental isolates transported by air, human contact activity and associated with the waste.
Low levels of sulphate present external to the waste form. Potential sources include vehicle emissions. Potential sulphate sources present in waste.
The energy sources available to drive microbial activity include: light, organic waste components; organic additive in the encapsulants; reduced N and S compounds in the waste; corrosion; organic contamination e.g. diesel fumes.
Pre- backfilling GDF Storage
As above plus some potential contamination by microbes present in the rocks and groundwater.
As above.
Post- backfilling, pre- final GDF closure
As above plus greater potential contamination by microbes present in the rocks and groundwater.
As above plus sulphate available in the groundwater and associated with the rocks (which may be mobilised by groundwater).
As above, but no light or further organic contamination from operations (e.g. from diesel fumes).
1.6.1.1 Microbiologically Induced Corrosion (MIC) and biofilm
Localised corrosion/degradation is initiated by aerobic microorganisms when they
form biofilms. Biofilms are a heterogeneous structures that, trapping dirt and
other particulate materials, increasing the disfiguring effects of the biofilm and
making the structures more difficult to clean [68]. Biofilm consist of consortia of
micro-organisms embedded in extracellular polymeric matrix (EPM). The
polymers are generally of polysaccharides which act as a glue for trapping dirt
and other particulate matter [60, 68], thus creating a wide variety of
electrochemical environments. In addition the sedentary or sessile (attached)
29
organism can utilise different carbon sources than free floating (planktonic)
organism and produce different degrading enzymes and may become more
resistance to anti-microbial agents. Studies have shown that biofilms can be
formed under a variety of conditions including those with low nutrition levels [74]
including spent nuclear fuel ponds [75]. Numerous features and biofilm formation
are described by Busscher and Van der Mei [76].
A relatively large variety of micro-organisms may affect overall performance of
deep GDF [65] that may facilitate:
(a) potential for direct damage to storage container by creating corrosion-
aggressive environment, hence
(b) deterioration of concrete and engineered barrier system (EBS)
components and this may
(c) influence the mobility and transfer of leached cations/radionuclides from
near to far-field environment.
1.6.2 The potential microbial activity during post-closure period
The post-closure period will initially have a period of oxidation, this will occur
immediately after GDF closure and the availability of reduced sulphur and
nitrogen compounds. The late post-closure period will be anaerobic, where
sulphate reduction to sulphide may lead to increased degradation of concrete.
The presence of ground water may contribute significantly as a source of sulphate
[56]. The potential source of sulphate would be from buffer and backfill material
which will influence the activity of SRBs and biofilm formation. In an anaerobic
environment, microbes can generate both inorganic (sulphuric and nitric acids)
and organic acids e.g. (acetic acid) [61]. The summary of potential organic and
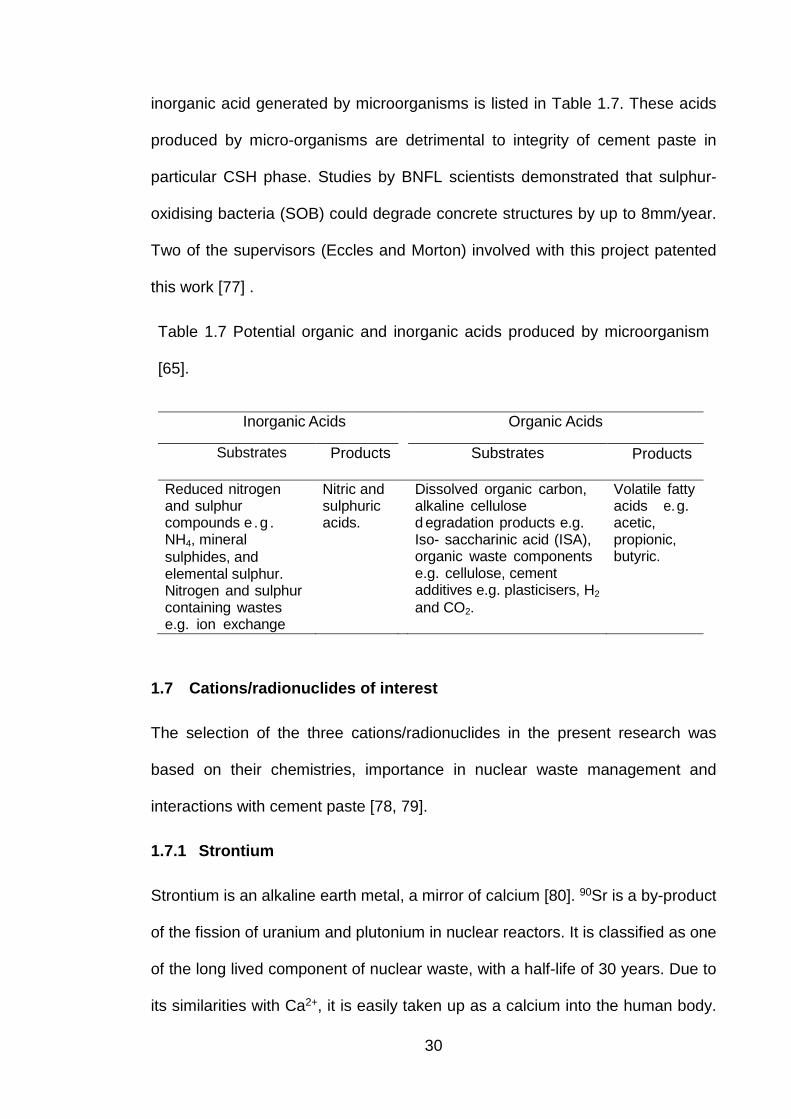
30
inorganic acid generated by microorganisms is listed in Table 1.7. These acids
produced by micro-organisms are detrimental to integrity of cement paste in
particular CSH phase. Studies by BNFL scientists demonstrated that sulphur-
oxidising bacteria (SOB) could degrade concrete structures by up to 8mm/year.
Two of the supervisors (Eccles and Morton) involved with this project patented
this work [77] .
Table 1.7 Potential organic and inorganic acids produced by microorganism
[65].
Inorganic Acids
Organic Acids
Substrates Products Substrates Products
Reduced nitrogen and sulphur compounds e .g . NH4, mineral sulphides, and elemental sulphur. Nitrogen and sulphur containing wastes e.g. ion exchange
Nitric and sulphuric acids.
Dissolved organic carbon, alkaline cellulose d egradation products e.g. Iso- saccharinic acid (ISA), organic waste components e.g. cellulose, cement additives e.g. plasticisers, H2 and CO2.
Volatile fatty acids e. g. acetic, propionic, butyric.
1.7 Cations/radionuclides of interest
The selection of the three cations/radionuclides in the present research was
based on their chemistries, importance in nuclear waste management and
interactions with cement paste [78, 79].
1.7.1 Strontium
Strontium is an alkaline earth metal, a mirror of calcium [80]. 90Sr is a by-product
of the fission of uranium and plutonium in nuclear reactors. It is classified as one
of the long lived component of nuclear waste, with a half-life of 30 years. Due to
its similarities with Ca2+, it is easily taken up as a calcium into the human body.
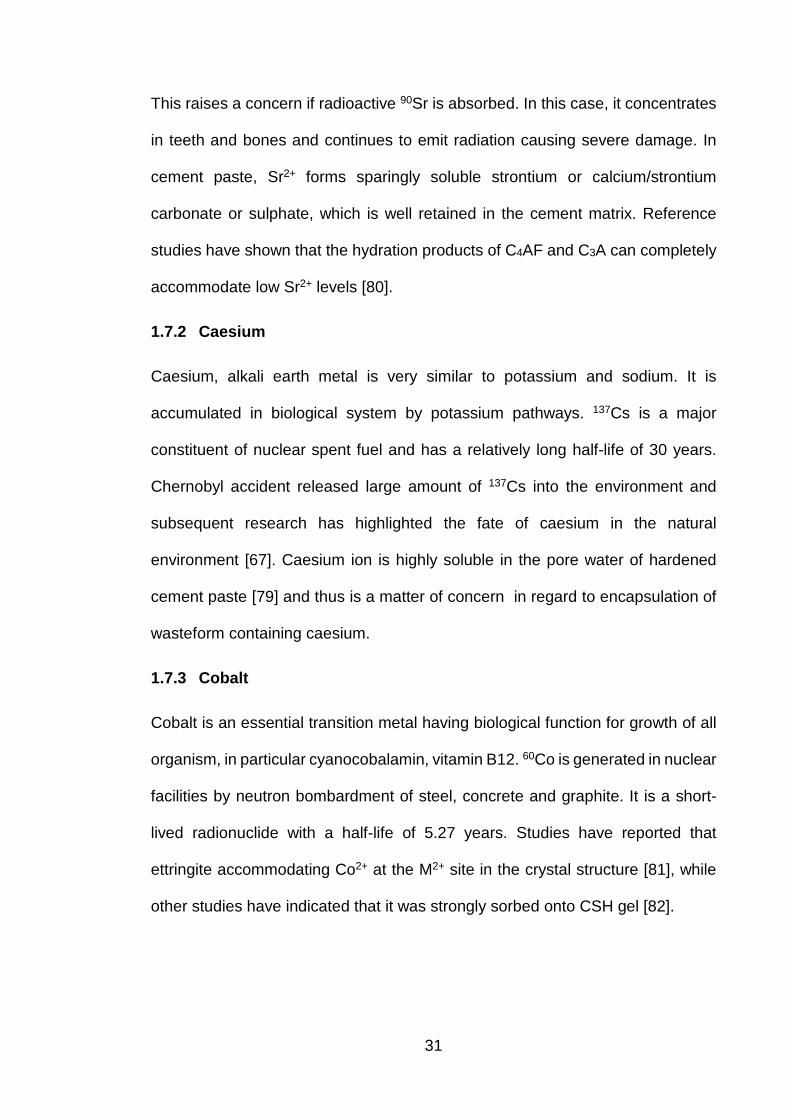
31
This raises a concern if radioactive 90Sr is absorbed. In this case, it concentrates
in teeth and bones and continues to emit radiation causing severe damage. In
cement paste, Sr2+ forms sparingly soluble strontium or calcium/strontium
carbonate or sulphate, which is well retained in the cement matrix. Reference
studies have shown that the hydration products of C4AF and C3A can completely
accommodate low Sr2+ levels [80].
1.7.2 Caesium
Caesium, alkali earth metal is very similar to potassium and sodium. It is
accumulated in biological system by potassium pathways. 137Cs is a major
constituent of nuclear spent fuel and has a relatively long half-life of 30 years.
Chernobyl accident released large amount of 137Cs into the environment and
subsequent research has highlighted the fate of caesium in the natural
environment [67]. Caesium ion is highly soluble in the pore water of hardened
cement paste [79] and thus is a matter of concern in regard to encapsulation of
wasteform containing caesium.
1.7.3 Cobalt
Cobalt is an essential transition metal having biological function for growth of all
organism, in particular cyanocobalamin, vitamin B12. 60Co is generated in nuclear
facilities by neutron bombardment of steel, concrete and graphite. It is a short-
lived radionuclide with a half-life of 5.27 years. Studies have reported that
ettringite accommodating Co2+ at the M2+ site in the crystal structure [81], while
other studies have indicated that it was strongly sorbed onto CSH gel [82].
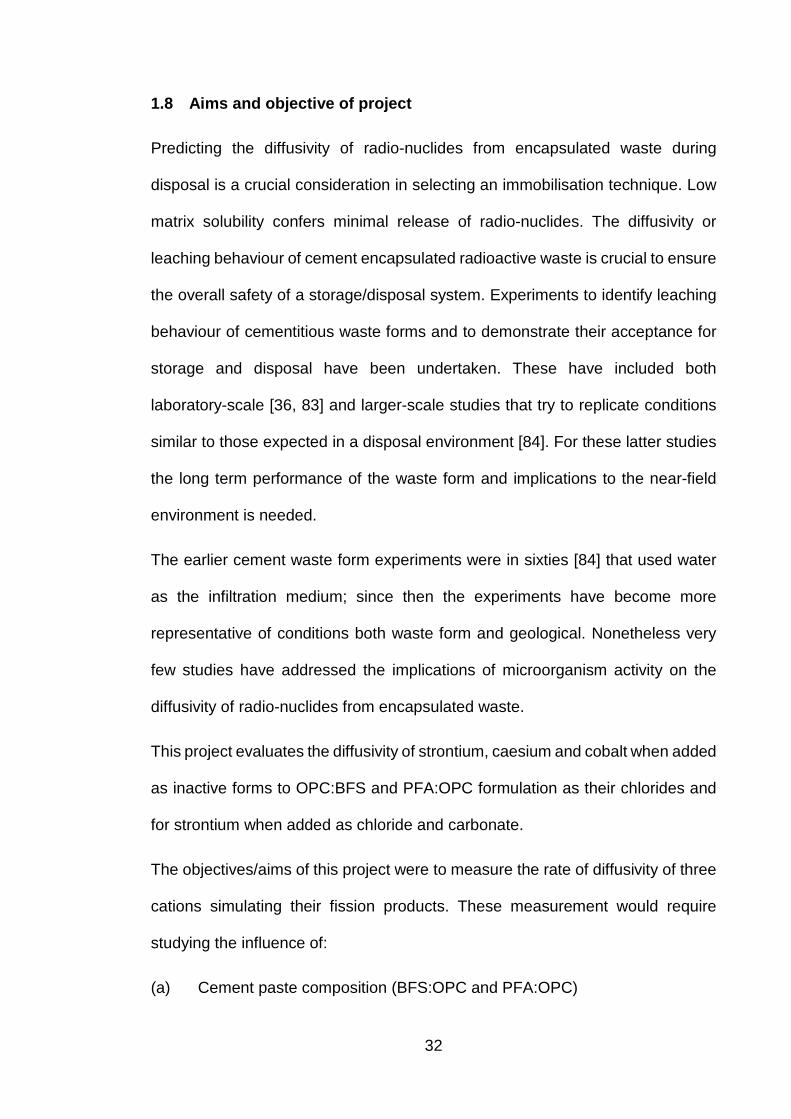
32
1.8 Aims and objective of project
Predicting the diffusivity of radio-nuclides from encapsulated waste during
disposal is a crucial consideration in selecting an immobilisation technique. Low
matrix solubility confers minimal release of radio-nuclides. The diffusivity or
leaching behaviour of cement encapsulated radioactive waste is crucial to ensure
the overall safety of a storage/disposal system. Experiments to identify leaching
behaviour of cementitious waste forms and to demonstrate their acceptance for
storage and disposal have been undertaken. These have included both
laboratory-scale [36, 83] and larger-scale studies that try to replicate conditions
similar to those expected in a disposal environment [84]. For these latter studies
the long term performance of the waste form and implications to the near-field
environment is needed.
The earlier cement waste form experiments were in sixties [84] that used water
as the infiltration medium; since then the experiments have become more
representative of conditions both waste form and geological. Nonetheless very
few studies have addressed the implications of microorganism activity on the
diffusivity of radio-nuclides from encapsulated waste.
This project evaluates the diffusivity of strontium, caesium and cobalt when added
as inactive forms to OPC:BFS and PFA:OPC formulation as their chlorides and
for strontium when added as chloride and carbonate.
The objectives/aims of this project were to measure the rate of diffusivity of three
cations simulating their fission products. These measurement would require
studying the influence of:
(a) Cement paste composition (BFS:OPC and PFA:OPC)

33
(b) Hydration of cement
(c) Added chloride salt to the makeup water
(d) These salts on pore water composition
(e) The design of the diffusivity experiments e.g. open and closed systems
(f) The test solution composition e.g. distilled water (DW), concentrated
Sellafield pore water (CSPW), diluted Sellafield pore water (DSPW) and
John Innes soil solution (JISS).

Chapter 2: Materials and methods
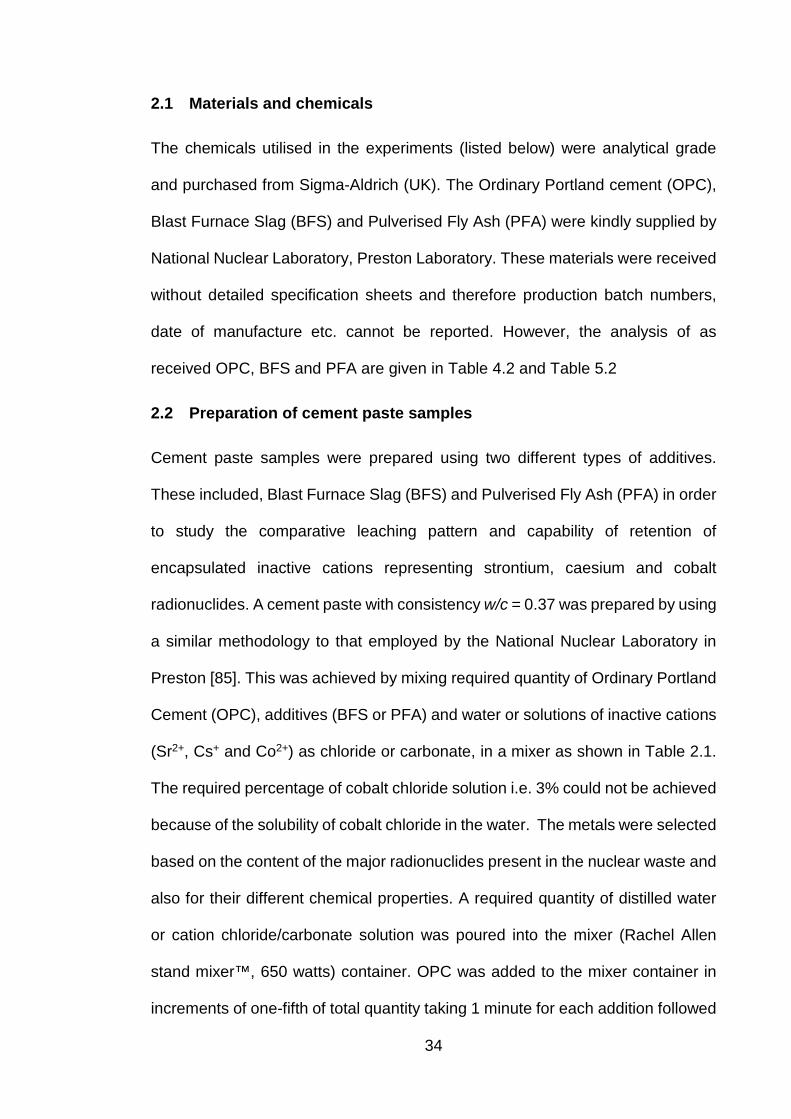
34
2.1 Materials and chemicals
The chemicals utilised in the experiments (listed below) were analytical grade
and purchased from Sigma-Aldrich (UK). The Ordinary Portland cement (OPC),
Blast Furnace Slag (BFS) and Pulverised Fly Ash (PFA) were kindly supplied by
National Nuclear Laboratory, Preston Laboratory. These materials were received
without detailed specification sheets and therefore production batch numbers,
date of manufacture etc. cannot be reported. However, the analysis of as
received OPC, BFS and PFA are given in Table 4.2 and Table 5.2
2.2 Preparation of cement paste samples
Cement paste samples were prepared using two different types of additives.
These included, Blast Furnace Slag (BFS) and Pulverised Fly Ash (PFA) in order
to study the comparative leaching pattern and capability of retention of
encapsulated inactive cations representing strontium, caesium and cobalt
radionuclides. A cement paste with consistency w/c = 0.37 was prepared by using
a similar methodology to that employed by the National Nuclear Laboratory in
Preston [85]. This was achieved by mixing required quantity of Ordinary Portland
Cement (OPC), additives (BFS or PFA) and water or solutions of inactive cations
(Sr2+, Cs+ and Co2+) as chloride or carbonate, in a mixer as shown in Table 2.1.
The required percentage of cobalt chloride solution i.e. 3% could not be achieved
because of the solubility of cobalt chloride in the water. The metals were selected
based on the content of the major radionuclides present in the nuclear waste and
also for their different chemical properties. A required quantity of distilled water
or cation chloride/carbonate solution was poured into the mixer (Rachel Allen
stand mixer™, 650 watts) container. OPC was added to the mixer container in
increments of one-fifth of total quantity taking 1 minute for each addition followed

35
by BFS to the OPC slurry in a similar manner to OPC addition. The final, paste
after stirring for a further 2 minutes, was then spooned into small plastic bottles
of 60 ml capacity (CPS dimensions 32 mm dia by 50 to 57 mm height), tapped
several times to remove entrapped air bubbles and finally capped and agitated
for a further for 4 minutes to ensure uniform mixing and minimal air entrapment.
A total of 9 sets of each BFS:OPC and PFA:OPC cement paste samples were
prepared, i.e. (i) control; (ii) ≈3% strontium chloride; (iii) ≈0.3% strontium chloride;
(iv) ≈3% caesium chloride; (v) ≈0.3% caesium chloride; (vi) ≈3% strontium
carbonate; (vii) ≈0.3% strontium carbonate; (viii) ≈1.3% cobalt and (ix) combined
metal chloride (≈3% SrCl2, ≈3% CsCl and ≈1.3% CoCl2). After 7 days the caps
were removed to allow the bleed water either to evaporate or re-adsorb. After 45
days, the cement paste samples were removed by gently tapping the base of the
plastic bottle and left standing in the laboratory (Figure 2.1, Table 2.2) until
employed in the diffusivity experiments. Detailed summary of sample dimensions,
cation concentration, and specific gravity of cation solution of each CPS is
mentioned in appendix 2.1 and 2.2.
Table 2.1 Cement paste mixture proportions
CPS BFS OPC PFA Water Total mass (Kg)
BFS:OPC 1.2 0.4 0 0.59 2.19 PFA:OPC 0 0.4 1.2 0.59 2.19
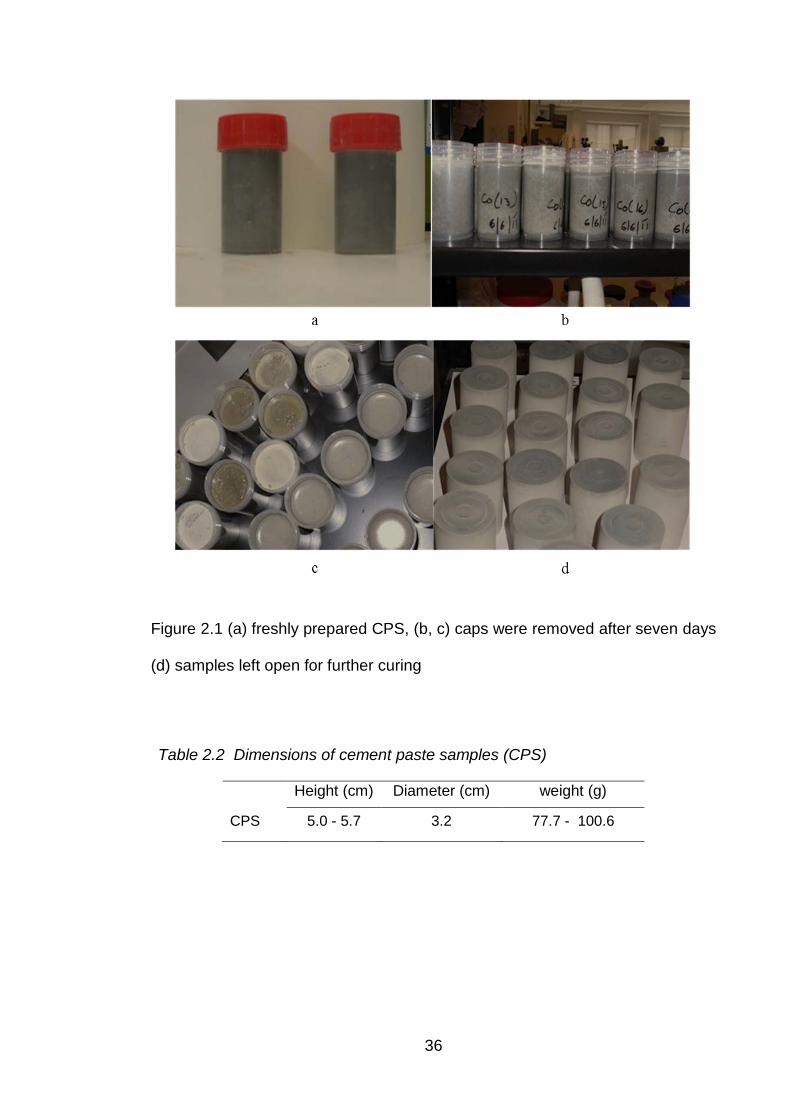
36
Figure 2.1 (a) freshly prepared CPS, (b, c) caps were removed after seven days
(d) samples left open for further curing
Table 2.2 Dimensions of cement paste samples (CPS)
Height (cm) Diameter (cm) weight (g)
CPS 5.0 - 5.7 3.2 77.7 - 100.6

37
2.3 Analysis of cement materials and hardened cement paste
Analysis of the whole CPS (cylinder) was not undertaken, but the composition of
cation/anion was estimated from EDAX analysis of OPC, BFS and PFA.
However, to measure the uniformity of the samples, they were dissected into
three equal sections, i.e. top, middle and bottom (Figure 2.2), using a tile cutter
(Erbauer ™ 750W Tile Saw 230V, UK). The sectioning was carried out on three
different occasions during the course of this research, prior to the start of new
diffusivity experiments, to understand the pore size distribution along the vertical
column of cement cylinder and also to examine the distribution of metal ions.
Figure 2.2 Dissected CPS named as top; middle bottom; side and base layer for
elemental analysis.
2.3.1 Analysis of OPC, BFS and PFA
Elemental analyses of cement materials (OPC, BFS and PFA) were carried out
using a Scanning Electron microscope/Energy dispersive X-ray spectroscopy
(SEM/EDX). A Quanta 200™ SEM with EDAX™ EDX system was used for
SEM/EDX analysis at the accelerating voltage of 20 kV. Each material was fixed

38
to an adhesive carbon pad attached to an aluminium stub. These stubs were
placed upon the stage in line with the electron beam into the vacuum chamber of
the SEM and the analysis was carried employing a magnification of 140x. EDX
analysis was carried out by using a semi quantitative programme Genesis EDAX
SEM Quant ZAF version 3.51.
2.3.2 Chemical analysis of CPS
Crushed CPS of ≈100 mg from each layer was boiled in 25 ml of concentrated
HNO3 at 130°C for 30 minutes. The resulting solution was diluted with de-ionised
water to 500 ml in standard volumetric flask. The solution was analysed by
Inductively Coupled Plasma Mass Spectrometry (ICP-MS, Thermo X series™,
UK) for Na+, K+, Ca2+, Sr2+ and Cs+.
2.3.3 Water content of CPS
The water content of the CPS was measured as follows: Approximately 1 gram
of crushed CPS from each section was weighed using a calibrated balance and
placed in a crucible in a conventional oven for (≈ 14-16 hours) at 105°C. The dried
sample was then transferred to desiccator before measuring the weight loss. The
difference in weight (before and after) was calculated and expressed as the water
content of CPS.
2.3.4 Surface and pore-size area
The nitrogen adsorption method (BET) [86] which is based on the physical
adsorption of gas molecules on a solid surface, was employed to measure the
surface area and porosity of cement paste samples. There are numerous
methods used for the surface area and porosity measurements [87]. The most
common method is BET method based on the work of Brunauer, Emmett, and
39
Teller [86]. The basic concept behind the gas sorption technique is physical
adsorption of gases or vapours on surfaces of solids and to the walls of the pores
within the studied solid. The surface area is determined by the amount of gas
absorbed at the given pressure. The standard BET equation is written as:
Where
Prel is the pressure of the gas in equilibrium with the specimen P, relative to the
saturation vapour pressure P0. V is the amount of gas adsorbed at pressure P.
CBET is a constant and Vm is the amount of gas required for a monolayer of
coverage. The specific surface area, S (m2/g), may then be calculated using
following equation
Where Nm is the number of gas molecules in one monolayer and may be
substituted for (Vm/v) where v is one molecular volume. σ is the cross sectional
area of a gas molecule and m is the mass of the specimen.
To determine the surface area and porosity, ≈ 1.5 grams of crushed cement paste
sample from each section was weighed using a calibrated weighing balance and
placed in a sample tube and degassed overnight at 105˚C [88], until the vacuum
reached 5 mm Hg. After degassing, samples were weighed and placed in the
analysis chamber (Micrometric ASAP 2010™). The nitrogen BET surface area
and pore size area values were calculated automatically by the system software
and reported as m2/g.
40
2.4 Experimental setup and procedure
2.4.1 Closed circuit diffusivity system
Dynamic diffusivity measurements of cations and two anions from the prepared
cement paste samples were achieved using the following experimental
arrangement. A polypropylene diffusivity vessel (d-v) and polypropylene reservoir
vessel (r-v) each of 120 ml volume, were connected via plastic tubing to a
peristaltic pump (Watson Marlow™ 323 series). Each specimen (3.2 X 5. ± 0.4
cm) was placed inside the d-v containing a plastic platform to prevent the cement
paste sample blocking the bottom liquor inlet. A polypropylene air-tight lid with a
top outlet connected the d-v to the r-v as illustrated in Figure 2.3. A constant flow
rate of 5ml per minute of test solution over the cement paste sample was
maintained using the peristaltic pump. The pump was capable to supplying test
solution to 5 d-vs. The vessels were placed on wooden racks i.e. without stirring,
shaking or agitation. Sampling of the test solution was achieved via the r-v at
planned time intervals, at seven day intervals 20 ml of test solution was pipetted
from all the r-vs and an equivalent volume of test solution was added to maintain
constant volume in the circuit (200 ml). This volume was sufficient to ensure the
cement paste sample was completely submerged at all times.

41
Figure 2.3 Experimental setup of closed circulating leaching system showing
diffusivity vessel containing CPS and reservoir vessel.
2.4.2 Open circuit diffusivity system
Open circuit diffusivity studies were carried out using tap water; which was
continuously supplied to the diffusivity vessel. A constant pump flow rate of 10
rpm (equivalent to 5ml per minute), was maintained using a peristaltic pump. Test
solutions were collected in 40L plastic reservoir vessel. Sampling of test solutions
was carried out after every 3rd and 4th day; the remaining test solution was
discarded due to the limited capacity of the reservoir (Figure 2.4). Analysis of tap
water was carried out using ICP-MS and Ion chromatography for cations and
anions respectively, which was cross checked with water analysis data published
by United Utilities for Preston area code PR1.
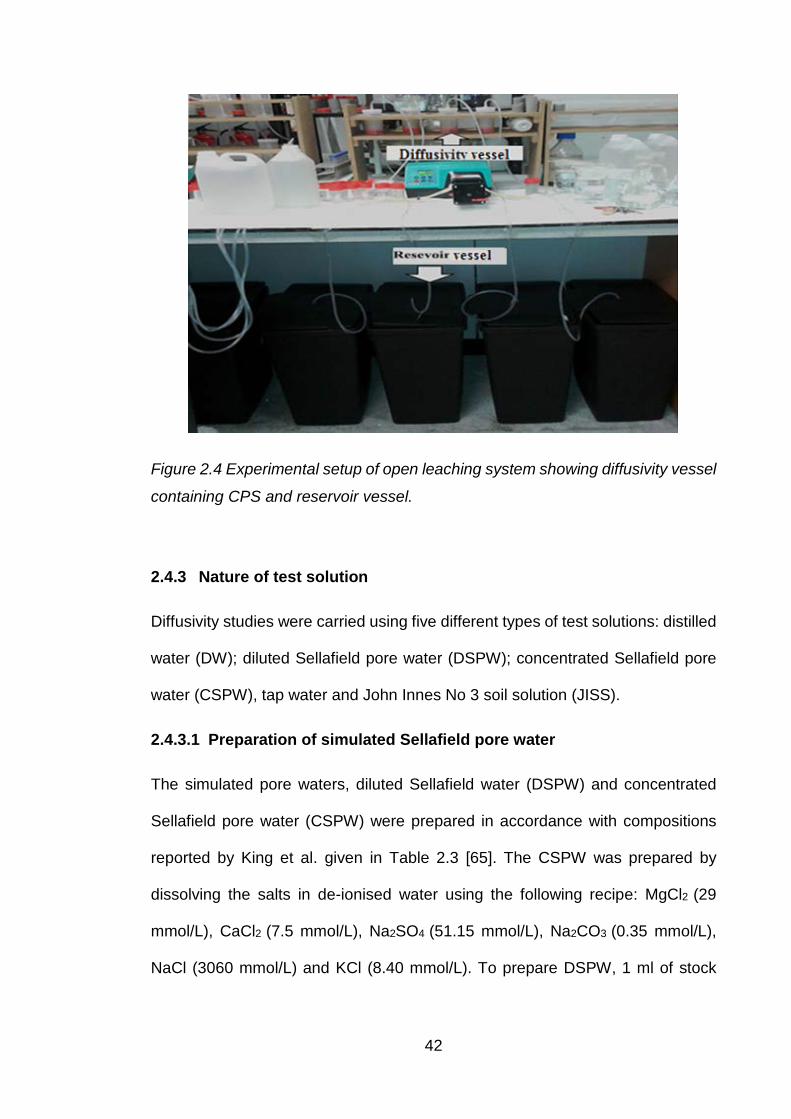
42
Figure 2.4 Experimental setup of open leaching system showing diffusivity vessel
containing CPS and reservoir vessel.
2.4.3 Nature of test solution
Diffusivity studies were carried using five different types of test solutions: distilled
water (DW); diluted Sellafield pore water (DSPW); concentrated Sellafield pore
water (CSPW), tap water and John Innes No 3 soil solution (JISS).
2.4.3.1 Preparation of simulated Sellafield pore water
The simulated pore waters, diluted Sellafield water (DSPW) and concentrated
Sellafield pore water (CSPW) were prepared in accordance with compositions
reported by King et al. given in Table 2.3 [65]. The CSPW was prepared by
dissolving the salts in de-ionised water using the following recipe: MgCl2 (29
mmol/L), CaCl2 (7.5 mmol/L), Na2SO4 (51.15 mmol/L), Na2CO3 (0.35 mmol/L),
NaCl (3060 mmol/L) and KCl (8.40 mmol/L). To prepare DSPW, 1 ml of stock
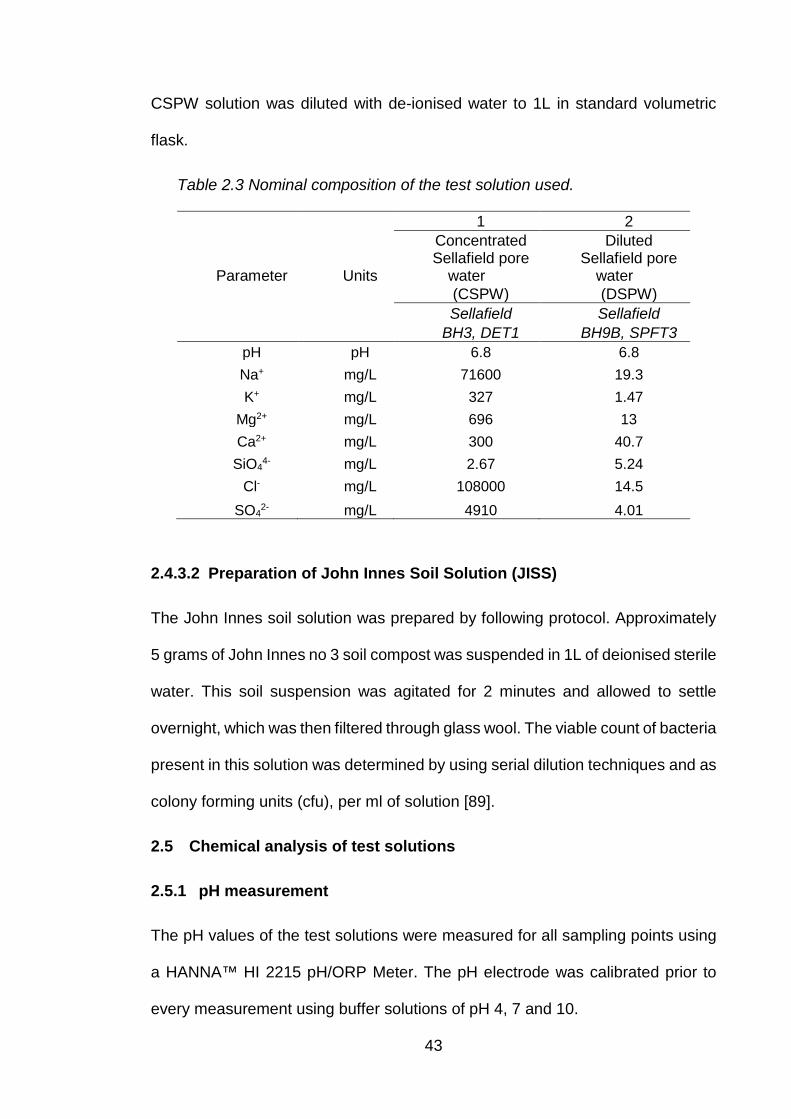
43
CSPW solution was diluted with de-ionised water to 1L in standard volumetric
flask.
Table 2.3 Nominal composition of the test solution used.
1 2 Concentrated Diluted
Parameter Units Sellafield pore
water Sellafield pore
water (CSPW) (DSPW) Sellafield Sellafield BH3, DET1 BH9B, SPFT3
pH pH 6.8 6.8 Na+ mg/L 71600 19.3 K+ mg/L 327 1.47
Mg2+ mg/L 696 13 Ca2+ mg/L 300 40.7
SiO44- mg/L 2.67 5.24
Cl- mg/L 108000 14.5 SO4
2- mg/L 4910 4.01
2.4.3.2 Preparation of John Innes Soil Solution (JISS)
The John Innes soil solution was prepared by following protocol. Approximately
5 grams of John Innes no 3 soil compost was suspended in 1L of deionised sterile
water. This soil suspension was agitated for 2 minutes and allowed to settle
overnight, which was then filtered through glass wool. The viable count of bacteria
present in this solution was determined by using serial dilution techniques and as
colony forming units (cfu), per ml of solution [89].
2.5 Chemical analysis of test solutions
2.5.1 pH measurement
The pH values of the test solutions were measured for all sampling points using
a HANNA™ HI 2215 pH/ORP Meter. The pH electrode was calibrated prior to
every measurement using buffer solutions of pH 4, 7 and 10.
44
2.5.2 ICP-MS
Inductively Coupled Plasma Mass Spectrometry (ICP-MS, Thermo X series™,
UK) was used to measure the concentration of Na+, Ca2+, Co2+, Sr2+ and Cs+
present in test solution, using 0.1 mg/L of rhodium as an internal standard. All the
samples were diluted with 2% (v/v) nitric acid. The instrument was calibrated
using multielement standard solution for ICP-MS (Sigma-Aldrich, UK) (0.01 to 2
ppm), with calibration checks and blanks run after every 10 samples to check the
instrument drift was within 10%, if the drift was over 10% samples were rerun. All
calibrations gave R2 values > 0.99.
ICP-MS was tuned on weekly basis with 10 ppb standard multielement tune A
solution (Thermo Scientific, UK).
2.5.3 Ion Chromatography
Ion chromatography (Dionex ICS-2000 series™, UK) was used for the
determination of Cl- and SO42-. All the samples were diluted 20 fold in de-ionised
water before analysis. The instrument was calibrated using Cl- and SO42-
standard solutions (2 - 250 ppm) diluted from a stock solution (500 ppm),
prepared from salts (KCl and K2SO4). Standards were regularly re-run (after
every 10 samples) and if instrumental drift was > 10%, samples were rerun.
Instrument parameters are shown in Table 2.4.
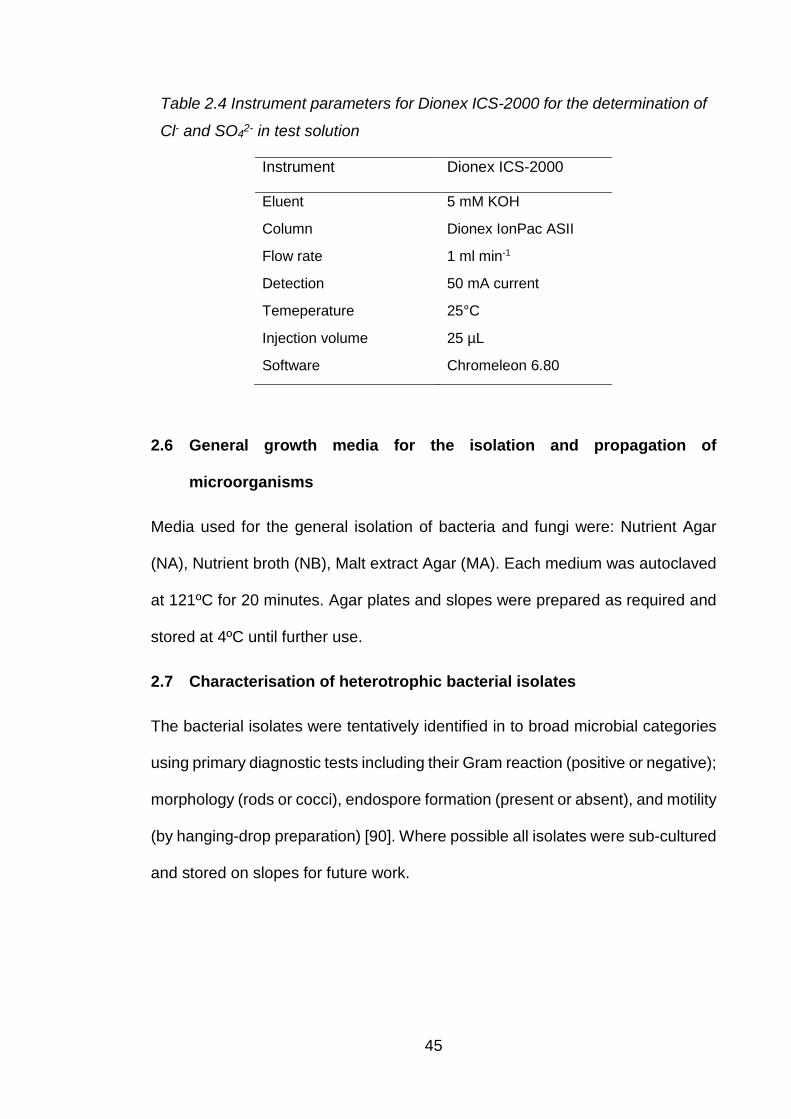
45
Table 2.4 Instrument parameters for Dionex ICS-2000 for the determination of
Cl- and SO42- in test solution
Instrument Dionex ICS-2000
Eluent 5 mM KOH
Column Dionex IonPac ASII
Flow rate 1 ml min-1
Detection 50 mA current
Temeperature 25°C
Injection volume 25 µL
Software Chromeleon 6.80
2.6 General growth media for the isolation and propagation of
microorganisms
Media used for the general isolation of bacteria and fungi were: Nutrient Agar
(NA), Nutrient broth (NB), Malt extract Agar (MA). Each medium was autoclaved
at 121ºC for 20 minutes. Agar plates and slopes were prepared as required and
stored at 4ºC until further use.
2.7 Characterisation of heterotrophic bacterial isolates
The bacterial isolates were tentatively identified in to broad microbial categories
using primary diagnostic tests including their Gram reaction (positive or negative);
morphology (rods or cocci), endospore formation (present or absent), and motility
(by hanging-drop preparation) [90]. Where possible all isolates were sub-cultured
and stored on slopes for future work.
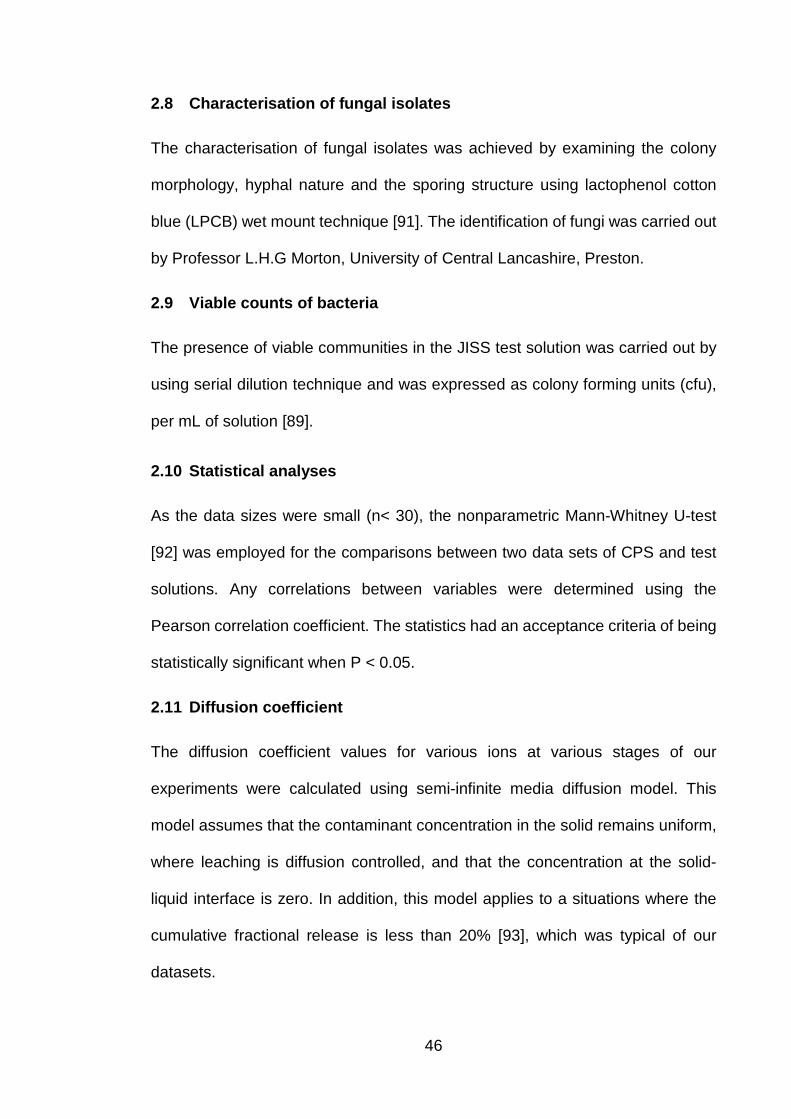
46
2.8 Characterisation of fungal isolates
The characterisation of fungal isolates was achieved by examining the colony
morphology, hyphal nature and the sporing structure using lactophenol cotton
blue (LPCB) wet mount technique [91]. The identification of fungi was carried out
by Professor L.H.G Morton, University of Central Lancashire, Preston.
2.9 Viable counts of bacteria
The presence of viable communities in the JISS test solution was carried out by
using serial dilution technique and was expressed as colony forming units (cfu),
per mL of solution [89].
2.10 Statistical analyses
As the data sizes were small (n< 30), the nonparametric Mann-Whitney U-test
[92] was employed for the comparisons between two data sets of CPS and test
solutions. Any correlations between variables were determined using the
Pearson correlation coefficient. The statistics had an acceptance criteria of being
statistically significant when P < 0.05.
2.11 Diffusion coefficient
The diffusion coefficient values for various ions at various stages of our
experiments were calculated using semi-infinite media diffusion model. This
model assumes that the contaminant concentration in the solid remains uniform,
where leaching is diffusion controlled, and that the concentration at the solid-
liquid interface is zero. In addition, this model applies to a situations where the
cumulative fractional release is less than 20% [93], which was typical of our
datasets.
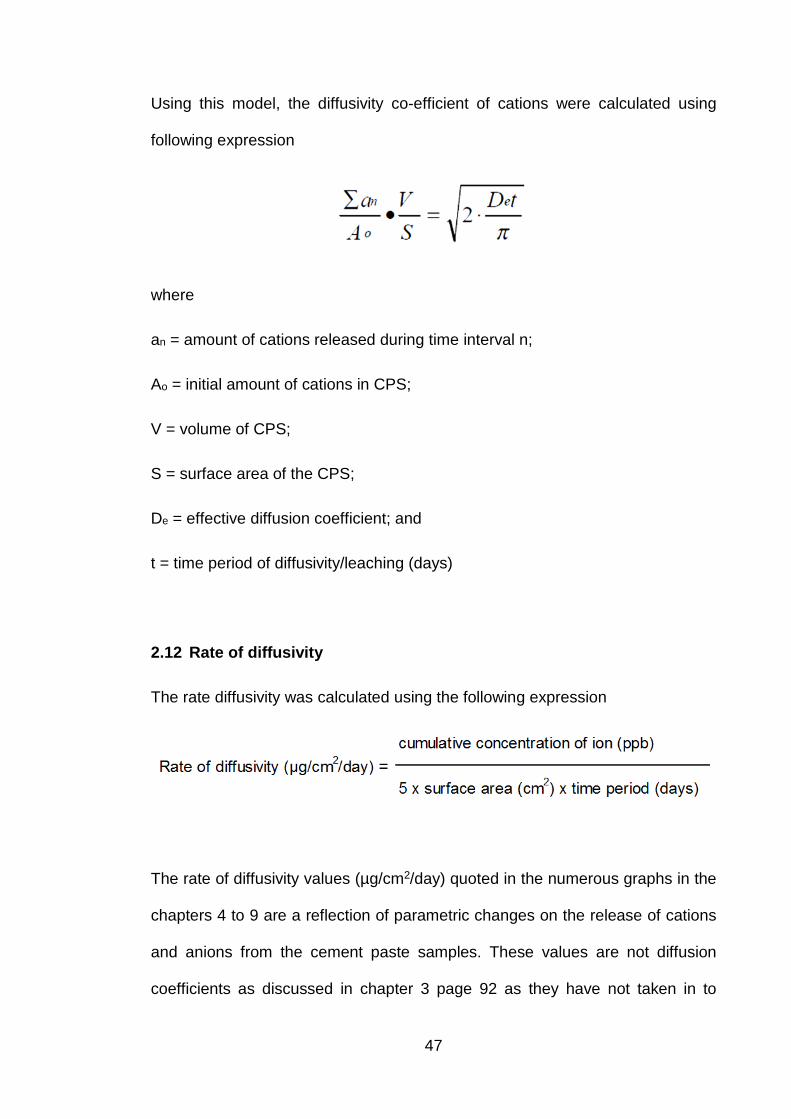
47
Using this model, the diffusivity co-efficient of cations were calculated using
following expression
where
an = amount of cations released during time interval n;
Ao = initial amount of cations in CPS;
V = volume of CPS;
S = surface area of the CPS;
De = effective diffusion coefficient; and
t = time period of diffusivity/leaching (days)
2.12 Rate of diffusivity
The rate diffusivity was calculated using the following expression
The rate of diffusivity values (µg/cm2/day) quoted in the numerous graphs in the
chapters 4 to 9 are a reflection of parametric changes on the release of cations
and anions from the cement paste samples. These values are not diffusion
coefficients as discussed in chapter 3 page 92 as they have not taken in to
48
consideration the initial content of the cement paste sample of the particular
cation/anion.
All the steps were taken to ensure quality of data, weighing balanced was
checked with standard weights before weighing the sample; all the glassware
were thoroughly washed and triple rinsed with de-ionised water and dried at 80˚C.
Standardised aseptic techniques were followed while carrying out microbiological
procedures and analysis.

Chapter 3: Cement chemistry discussion
49
3.1 Introduction
This chapter encompasses both:
a. a description of the fundamentals of cement chemistry to allow the reader
to understand and appreciate some of the subtleties that influence this
chemistry prior to engagement with the results.
b. some results/data that have been generated in this PhD project are
included to emphasise and underpin this understanding.
The chapter has been formatted in this manner also for the ease of reading and
for ergonomic reasons, i.e. to minimise the reader flicking from one chapter to
another and to minimise duplication of data/results in more than one chapter. The
bulk of the diffusion data is reported in subsequent chapters that are devoted to
a specific parametric topic.
3.2 Physical properties of cement paste composition
3.2.1 Preparation/ composition confirmation
The measured compositions of the as received OPC, BFS and PFA from the NNL
were similar with other cements, slags and fuel ash used in waste encapsulation
[94]. The cation (Sr2+, Cs+ and Co2+) concentrations selected were based on likely
compositions of encapsulated nuclear waste [4]. Cation chloride and carbonate
compounds were selected taking into consideration experiments involving
influence of microorganisms on the diffusivity of cations from the CPS. Use of
other cation compounds such as their nitrates or sulphates would influence the

50
genera and metabolic activity of microorganisms present in the test solution, not
necessarily reflecting a realistic situation.
The hydration of OPC and additives such as BFS and PFA has received
significant attention for a variety of reasons. Some of these studies have
addressed the ratio of water to cement (w/c) and its impact on the formation of
the various phases produced during hydration, strength, porosity, tortuosity, pore
size etc. of the cement pastes [95, 96]. Other studies have concentrated on the
chemistry of make-up water and how for example the inclusion of salts in this
water influences the pore water chemistry [97]. Although our studies are restricted
to only one w/c namely 0.37 and two formulations with BFS:OPC and PFA:OPC
(3:1 ratio for each), the composition of the make-up water has been varied due
to the inclusion of cation chlorides (Sr2+, Cs+, Co2+ and mixture of all three) and
largely at two concentrations (≈120 g/L and ≈12 g/L). These different water
compositions (pore and free), their chemistries and subsequent impact on the
diffusivity/leachability of added and inherent ions (such as Na+, K+, Mg2+, Ca2+
and SO42-) in BFS/PFA:OPC have been studied. It is sensible at this stage of the
thesis to consider cement hydration, pore water chemistry and their impacts on
cation/anion diffusivities.
3.2.2 Hydration
The hydration of cement is a series of irreversible exothermic chemical reactions
between cement and water. The reaction of water with the cement in concrete is
extremely important to its properties and may continue for many years. Portland
cement consists primarily of calcium aluminates and calcium silicates as
illustrated in Table 3.1and Figure 3.1 below:

51
Table 3.1 Typical composition of Portland cement with chemical composition
and weight percentage [16].
Cement Compound Weight Percentage Chemical Formula
Tricalcium silicate (C3S) 50% Ca3SiO5 or 3CaO.SiO2
Dicalcium silicate (C2S) 25% Ca2SiO4 or 2CaO.SiO2
Tricalcium aluminate (C3A) 10% Ca3Al2O6 or 3CaO .Al2O3
Tetracalcium aluminoferrite (C4AF) 10% Ca4Al2Fe2O10 or 4CaO.Al2O3
.Fe2O3 Gypsum 5% CaSO4
.2H2O
Gypsum controls the rate of setting and influences the rate of strength
development.
Figure 3.1 composition of cement clinker [98]
Addition of water allows each of the compounds to undergo hydration process
contributing to the final concrete product. During this process, tri-calcium silicate
(C3S) reacts quickly and is responsible for most of the early strength (first 7 days).
The reaction products calcium hydroxide (Ca(OH)2) and calcium silicate hydrate
(C-S-H) phase are formed [95]. Di-calcium silicate (C2S), rather reacts slowly and
contributes only to the strength at later times. Similar reaction products with
significantly lower amount of Ca(OH)2 are formed in comparison with C3S
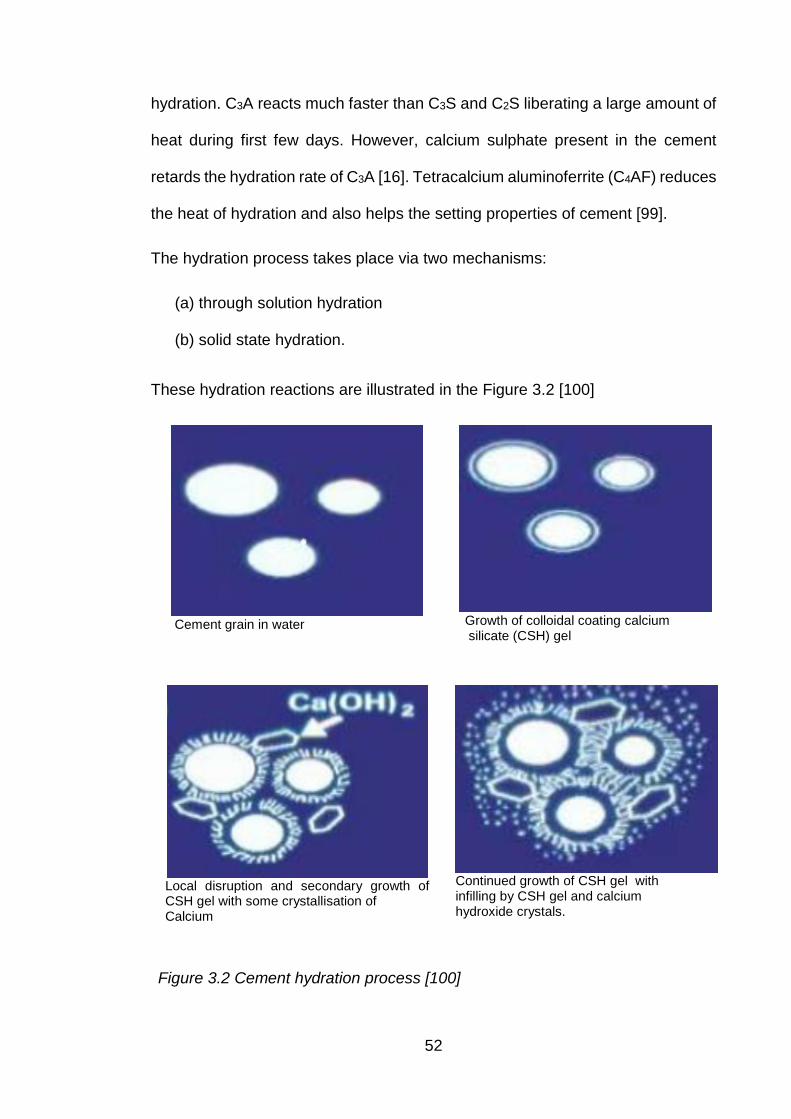
52
hydration. C3A reacts much faster than C3S and C2S liberating a large amount of
heat during first few days. However, calcium sulphate present in the cement
retards the hydration rate of C3A [16]. Tetracalcium aluminoferrite (C4AF) reduces
the heat of hydration and also helps the setting properties of cement [99].
The hydration process takes place via two mechanisms:
(a) through solution hydration
(b) solid state hydration.
These hydration reactions are illustrated in the Figure 3.2 [100]
Cement grain in water
Growth of colloidal coating calcium silicate (CSH) gel
Local disruption and secondary growth of CSH gel with some crystallisation of Calcium
Continued growth of CSH gel with infilling by CSH gel and calcium hydroxide crystals.
Figure 3.2 Cement hydration process [100]

53
There are five stages of cement hydration that occur comparatively quickly (stage
1 less than 15 minutes) to stage 5 that can occur over many years. These stages
are reported in
Table 3.2: The five stages of concrete curing
Stage no
Reaction Kinetics of reaction
Chemical process
Time period
Illustration[100]
1 Initial hydrolysis
Chemical control; rapid
Dissolution of ions
< 15 minutes
2 Induction period
Nucleation control; slow
Continued dissolution
of ions
2 – 4 hours
3 Acceleration Chemical control; rapid
Initial formation of
hydration products
2 – 4 hours
4 Deceleration Chemical
and diffusion control; slow
Continued formation of
hydration products
Several hours
5 Steady state Diffusion control
Slow formation of
hydration products
years
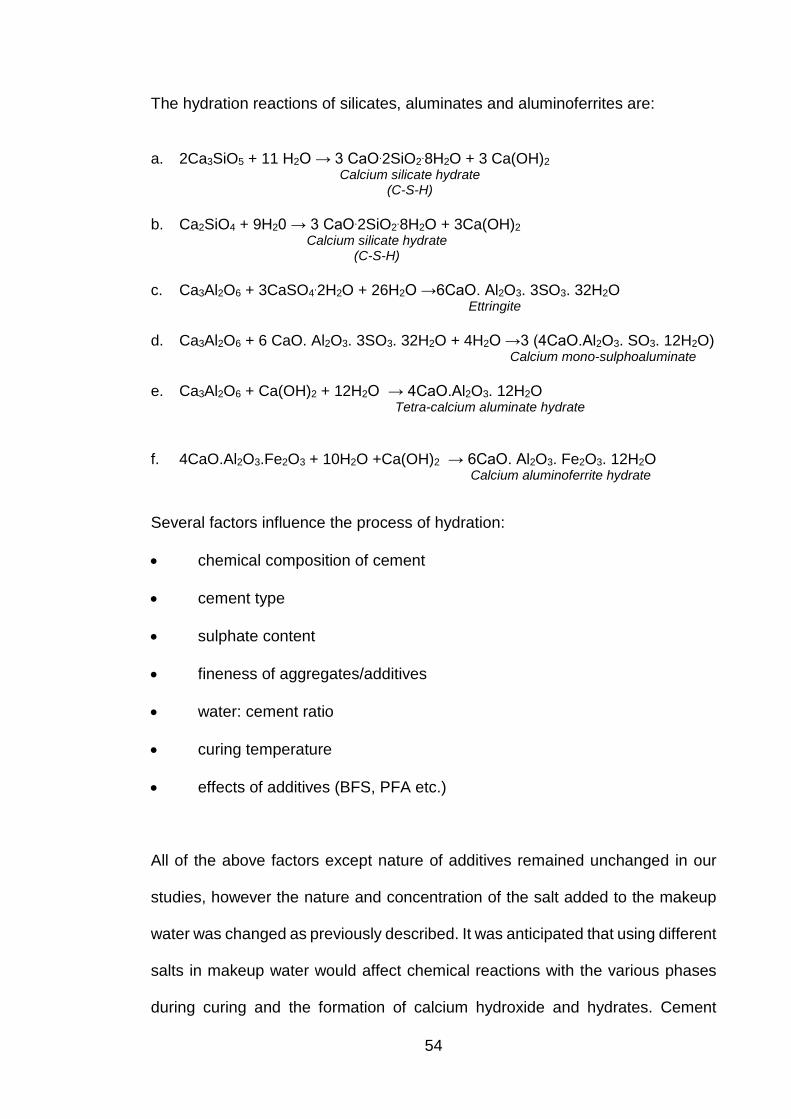
54
The hydration reactions of silicates, aluminates and aluminoferrites are:
a. 2Ca3SiO5 + 11 H2O → 3 CaO.2SiO2.8H2O + 3 Ca(OH)2 Calcium silicate hydrate
(C-S-H)
b. Ca2SiO4 + 9H20 → 3 CaO.2SiO2.8H2O + 3Ca(OH)2 Calcium silicate hydrate
(C-S-H)
c. Ca3Al2O6 + 3CaSO4.2H2O + 26H2O →6CaO. Al2O3. 3SO3. 32H2O Ettringite
d. Ca3Al2O6 + 6 CaO. Al2O3. 3SO3. 32H2O + 4H2O →3 (4CaO.Al2O3. SO3. 12H2O)
Calcium mono-sulphoaluminate
e. Ca3Al2O6 + Ca(OH)2 + 12H2O → 4CaO.Al2O3. 12H2O Tetra-calcium aluminate hydrate
f. 4CaO.Al2O3.Fe2O3 + 10H2O +Ca(OH)2 → 6CaO. Al2O3. Fe2O3. 12H2O Calcium aluminoferrite hydrate
Several factors influence the process of hydration:
• chemical composition of cement
• cement type
• sulphate content
• fineness of aggregates/additives
• water: cement ratio
• curing temperature
• effects of additives (BFS, PFA etc.)
All of the above factors except nature of additives remained unchanged in our
studies, however the nature and concentration of the salt added to the makeup
water was changed as previously described. It was anticipated that using different
salts in makeup water would affect chemical reactions with the various phases
during curing and the formation of calcium hydroxide and hydrates. Cement

55
hydration in the presence of chloride, as is the case for the majority of our
diffusivity experiments, Friedel’s salt (3CaO.Al2O3.CaCl2.10H2O) and Kuzel’s salt
(3CaO.Al2O3.0.5CaSO4.0.5CaCl2.10H2O) can be formed in concrete [101].
Formation of these salts could be accentuated by the Cl- in the makeup water in
our studies. Inherent Cl- present in OPC (0.11 wt%), BFS (0.26 wt%) and PFA
(0.05 wt%) also contributes to formation of these salts (Table 4.2 and Table 5.2).
It has been demonstrated that there is a chemical equilibrium between the
chloride concentration in hydration products and the chloride concentration in the
pore water solution [102]. The distribution of chloride in concrete depends on the
total chloride content. The amount of bound chloride decreases with decreasing
content of dissolved chloride in the pore solution [103]. It has also been shown
that the amount of chloride in the pore solution increases significantly on
carbonation [104].
The CPSs that had been aged in the laboratory environment for 240 days would
undergo some carbonation, but as this conversion is a relatively slow process
and the depth of penetration, would be insignificant for this time period i.e. only a
few mm.
It is unlikely that the solid SrCO3 added at the cement paste make-up stage
interacted during curing/post-curing with other materials/hydrates as on
dissection of the appropriate cement paste samples, the SrCO3 particles were
clearly visible and relatively uniformly distributed throughout the cylinder. This is
not surprising as the SrCO3 is only partially soluble in water (Ksp =10-10).

56
3.2.3 BFS v/s PFA
The influence of cement paste composition on the leaching of radionuclides has
received some attention, but with the greater number of publications targeting the
influence of the water to cement ratio [105-108]. Various compositions excluding
the water ratio have included incorporating other minerals such as Blast Furnace
Slag (BFS), Pulverised Fly Ash (PFA) and others to variety of superplasticisers
[109-112]. As reported in this thesis only the impact of incorporating BFS and
PFA with a water to cement ratio of 0.37 in cement paste samples on the
diffusivity of simulated radionuclides (Cs+, Sr2+ and Co2+) have been addressed.
Although the chemical composition of BFS or PFA in the cement paste ought to
have marginal impact on the diffusivity of cations and anions from the cement
paste samples; the data reported later indicates this is quite contrary.
Addition of siliceous materials, such as BFS and PFA to cement has number of
benefits such as to increase strength of the wet mix, to reduce heat evolution
during set and to improve the durability and resistance to chemical attack
[25]. PFA, artificial pozzolanas, contain un-melted residual minerals such as
quartz as well as mullite, graphite, spinel which are thermally generated,
contained within a glassy matrix [113]. These additives have a profound
impact on the mineralogy of the cement paste composition during and post-
curing. The engineering benefits include enhanced resistance to thermal
cracking due to lower heat of hydration, improvement of ultimate strength,
reduced permeability due to pore refinement, and a better durability to chemical
attacks such as chloride, sulphate water, soil and alkali- aggregate expansion.
Replacement of cement by BFS reduces the C3A content of the material and
decreases the CH content and the permeability of the mortar/concrete [114]. The
57
reaction of pozzolanic material with calcium hydroxide liberated by the hydrating
Portland cement which forms cementitious compounds generally known as C-S-
H gel can be represented as:
C3S + 6H → C3S2H3+ 3Ca(OH)2
3C3S + 4H → C3S2H3+3Ca(OH)2
Ca(OH)2 + (SiO2 +Al2 O3) → C3S2H3+ other components
Thus increases the properties of hardened cement paste. In our studies, the
cement paste mixture preparation of PFA:OPC showed high fluidity in
comparison to the BFS: OPC mixture. During the curing stage, loss of liquid
(bleed) was more prominent in BFS:OPC cement paste samples in contrary to
the PFA:OPC cement paste samples, lost considerably smaller quantity.
3.2.4 Distribution of water
Make-up water distributes via three different interactions: water that was
chemically bound into the cement paste, the physically bound or “glassy water”
that interacted with the surface of the gel pores in the paste (free water), and
unbound water molecules that are restrained within the larger capillary pores of
cement paste (pore water) [115]. Free water and pore water of all the cement
paste samples were measured by weight loss at 1050C (section 2.3.3) [16]. Some
workers have suggested that gel water may also be lost at this temperature [116].
Although the volume of make-up water gave a w/c of 0.37 this ratio excluded the
moisture associated with the OPC, BFS and PFA which was measured 26.2%,
0.2% and 0.1% respectively (Table 4.2 and Table 5.2). This moisture content
represents in the cement paste cylinders about 4% w/w average which is
58
equivalent to 3.4 g and 3.0 g for BFS:OPC and PFA:OPC CPSs respectively. The
actual influence of this moisture content will remain consistent throughout. This
is due to the fact that higher percentage of moisture comes from OPC, which was
constant along with the amount of water used in all the CPS preparations. It is
generally accepted that a w/c of about 0.25 is required to fully hydrate the calcium
silicates but complete hydration rarely occurs below a w/c of 0.38 [117] cf our
ratio of 0.37 but excludes moisture levels of the original materials. At this point
hydration will proceed leaving a small amount of water in fine gel pores. The
hydrated cement is a porous mass of C-S-H gel comprising of both hydrated and
unhydrated cement particles along with several different types of water. A
chemically combined “bound water” is non evaporable and forms a definite part
of hydrated compounds, whereas unbound water is free and evaporable present
in the different types of pores [117]; the moisture content of the original materials
must fall into unbound water. The hydration process will stop if there is insufficient
water to fill the gel pores. Water also fills the capillary pores between the hydrated
cement particles. As hydration proceeds, the formation of more hydration
products decreases the amount of water in capillary pores and grow into the
space while the gel water increases, reducing overall porosity. Studies have
shown that at complete hydration, 1 g cement binds 0.23 g water and 0.19 g of
strongly physically bound water, so complete and uninhibited hydration requires
a w/c of ≈0.42 [117]. If the moisture levels in the original feed materials are
included with make-up water volumes then w/c is very close to this number.
In addition to the w/c other factors can influence porosity, in our study the
composition of make-up water and subsequent reactions of dissolved salts with
C-S-H gels and other hydrates were considered. Although the hydration process
59
of cement continues over many months if not years with implications to chemistry
and diffusivity of ions, the distribution of make-up water within the cement paste
samples will reach a steady state within the first few weeks of curing. It is the
distribution of this water and its corresponding composition that can influence the
kinetics and thermodynamics of ion diffusivity [118].
The first partitioning of make-up water occurs due to bleed loss, which is
dependent on both the w/c value and cement paste composition i.e. ratio of OPC
to additives [119]. From previous concrete bleed water studies the information
suggests that our w/c of 0.37 (but corrected to near 0.42 due to the moisture
content of original feed materials) would be about 0.9 g [120] i.e. 0.9 cm3 which
represents a height of about 1mm in the moulds used to prepare our cement
paste samples. Observations after 7-day curing recorded a height of 2 to 3mm of
bleed water on the surface of the cement paste cylinder, this difference could be
due to the presence of cations in the make-up water as previously reported in this
thesis. The addition of cations not only influenced bleed water volume but the
surface of the cement paste cylinder. The loss of bleed water took shorter
duration of time from ≈3% SrCl2 CPS in comparison with control CPS which was
substantially slower than all other CPSs. However, there was no bleeding noticed
from 3%SrCO3 CPS.
Although the same ratio of water to cement/additive was used for all the studies,
the influence of added chloride salt affected both free water value and the pore
volume and consequently would affect the pore water value. The bound water,
free water and pore water values calculated from the moisture content (section
2.3.3) of their respective ≈86 g BFS:OPC CPS used in our diffusivity experiments
are reported in Table 3.3. The corresponding values in Table 3.4 are for

60
PFA:OPC, but in this case the weight of cement paste samples was on average
≈74g.
Table 3.2 Water distribution in some BFS:OPC CPSs
CPS Makeup water
+ moisture Free water and
pore water Bound water
(g) (g) (%) (g) (%)
control 26.2 11.9 45.4 14.3 54.6
≈3% SrCl2 25.5 19.3 75.7 6.2 24.3
≈3% CsCl 25.8 16.7 64.7 9.1 35.3
≈1.3% Co Cl2 26.2 17.9 68.3 8.3 31.7
combined cation chlorides 24.6 17.6 71.5 7 28.5
Table 3.3 Water distribution in some PFA:OPC CPSs
CPS Makeup water + moisture
Free water and pore water
Bound water
(g) (g) (%) (g) (%)
control 23.2 3.2 13.8 20 86.2
≈3% SrCl2 23.2 5.6 24.1 17.6 75.9
≈3% CsCl 22.6 3.8 16.8 18.8 83.2
≈3% SrCO3 21 3.9 18.6 17.1 81.4
3.2.5 Segregation and bleeding
The differences in the size of particles and specific gravity may cause the
segregation of aggregates during the settling and curing stage of cement mixture
[16]. Segregation is generally overcome by adequate vibration, but not over-
vibration of the cement mix, to prevent the lighter and denser materials
partitioning [121]. As hydration processes also occur during the first phases of
curing, the segregation of aggregates will also lead to differences in the water

61
profile. Although our cement paste samples were agitated only for 4 minutes after
mixing the OPC, BFS or PFA and make-up water; segregation was evident on
dissection of the cured CPS cylinders. Segregation affected cation distribution of
both added cations in the make-up water such as Cs+ and Sr2+ but also inherent
cations present in both OPC and BFS or PFA such as calcium (Figure 3.3). This
segregation was also instrumental in affecting water (Table 3.3 to 3.4) and pore
size distribution (Figure 3.4 to 3.5). As few, if any, previous studies have
monitored segregation with make-up water composition, we postulate that the
following sequence is likely to occur:
(a) hydration of OPC, BFS or PFA particles, not necessarily complete
hydration, which allows
(b) the cations present in make-up water to be absorbed on to the surface of
OPC, BFS or PFA particles and/or to react with these particles resulting in;
the chemistry of hydrates being influenced, producing either increased gel
formation and/or further insoluble matter that impacts on pore size and pore
volume.
From the distribution of cations i.e. enrichment in the upper regions would
suggest that adsorption on to less dense additives occurred and/or a chemical
reaction occurred between the added cations and hydrates to produce lighter,
slightly more voluminous solids and smaller, denser particulate material settled
to the lower regions affecting pore size and water distribution. This segregation
could have been exacerbated by the density of the make-up water which ranged
from 1.0 g/cm3 for distilled water to 1.3 g/cm3 for mixed cations (Cs+ plus Sr2+ and
Co2+), with densities of 1.14 and 1.08 for strontium chloride and caesium chloride
make-up water respectively. The more dense liquors will uphold the less dense
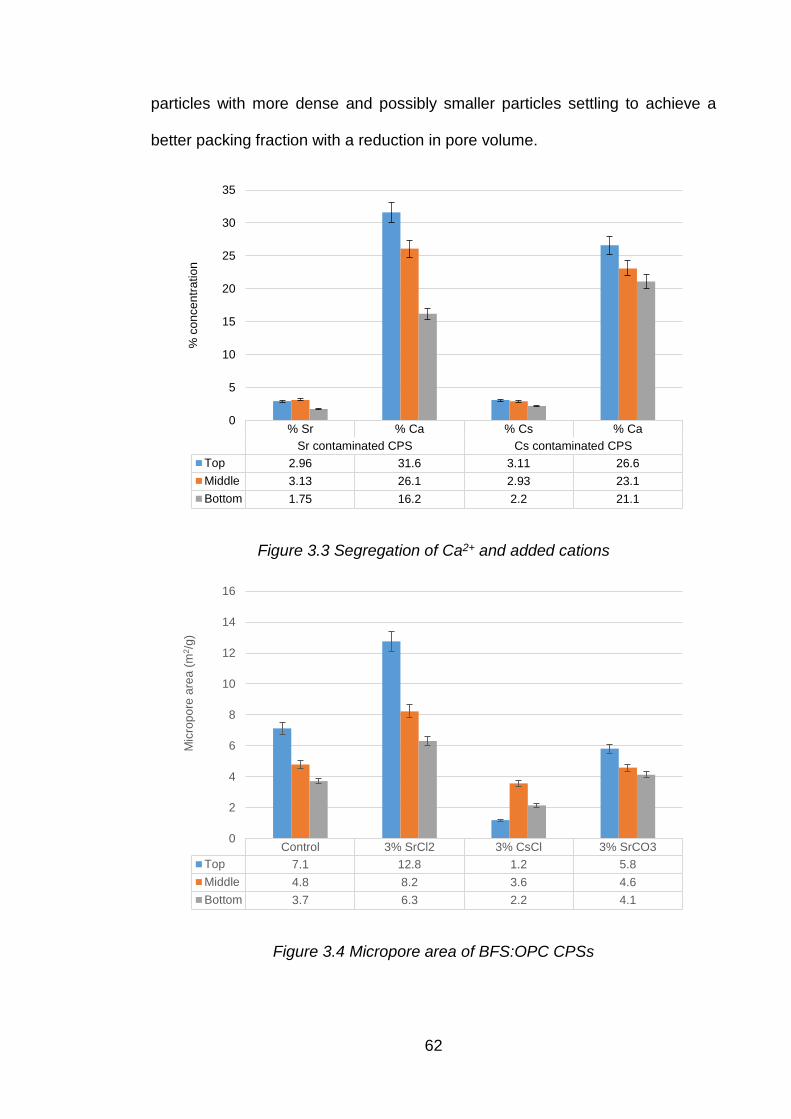
62
particles with more dense and possibly smaller particles settling to achieve a
better packing fraction with a reduction in pore volume.
Figure 3.3 Segregation of Ca2+ and added cations
Figure 3.4 Micropore area of BFS:OPC CPSs
% Sr % Ca % Cs % CaSr contaminated CPS Cs contaminated CPS
Top 2.96 31.6 3.11 26.6Middle 3.13 26.1 2.93 23.1Bottom 1.75 16.2 2.2 21.1
0
5
10
15
20
25
30
35%
con
cent
ratio
n
Control 3% SrCl2 3% CsCl 3% SrCO3Top 7.1 12.8 1.2 5.8Middle 4.8 8.2 3.6 4.6Bottom 3.7 6.3 2.2 4.1
0
2
4
6
8
10
12
14
16
Mic
ropo
re a
rea
(m2 /g
)

63
Figure 3.5 Micropore area of PFA:OPC CPSs
3.2.6 Pore water composition
The composition of pore water is influenced by:
(a) composition of make-up water,
(b) formulation of cement paste,
(c) curing time.
At initial stages, the pore water contains largely alkali hydroxides which will
become depleted at the surface due to the recirculation of test solution in our
experiments as the diffusivity of sodium and potassium first, but then replaced by
calcium hydroxide liberated from the solid cement phases. This transformation
reduces the pH of pore water from a peak of about 14.0 to around 12.0. Hydroxyl
concentration of pore water also decreases with increasing level of cement
substitution by PFA; this hydroxyl reduction also occurs when BFS substitutes for
cement but the effect is less marked than for PFA because of calcium content.
Control 3% SrCl2 3% CsCl 3% SrCO3Top 4.0 3.4 3.0 3.8Middle 3.1 2.2 4.2 3.5Bottom 4.5 3.5 3.5 4.0
0
1
2
3
4
5
Mic
ropo
re a
rea
(m2 /g
)

64
When chloride as sodium chloride is incorporated into the make-up water the
dissolved chloride concentration of pore water decreases with hydration over a
short timescale i.e. 4 days and is also reduced by a higher w/c [121]. This is
attributed to the incorporation of Cl- in to Friedel’s salt, the formation of this salt
increases over the period of time.
In the early stages of hydration the concentration of sodium and potassium
cations are typically 0.05 to 0.2M and 0.1 to 0.6M respectively depending on the
OPC formulations but for calcium ions a fraction of these concentrations (<0.05M)
[16, 54]. Sulphur possibly as sulphate in pore water is generally a few thousand
micro-molar concentration, with the hydroxyl concentration significant around
0.2M. The presence of these ions affects the ionic strength of pore solution and
hence the solubility of cement hydrates, but total dissolution of these hydrates is
highly unlikely and presents challenges in determining which are physically or
chemically bound.
Understanding the pore water chemistry will assist in the interpretation of cation
diffusivity from the cement paste samples.
3.3 Chemistry of solid and liquid system
In the present research, the experiments were designed to simulate two leaching
conditions:
(a) diffusivity occurring in stagnant water where the reaction can reach
equilibrium and
(b) diffusivity in mobile or stirred water where the reaction may not reach
equilibrium.

65
Cementitious material in an aqueous solution is an excellent example of salt in a
solvent. De-ionised water is the most aggressive aqueous surrounding for
concrete because of its lower ionic strength. Dissolution of concrete occurring in
stagnant water can reach equilibrium resulting in a saturated solution. The
reaction quotient (Q) is equal to the solubility product (KSP) of respective
reactants. The reactant with lower KSP will most likely to dissolve first in
comparison with the reactants with higher KSP values.
If “Q” is greater than KSP, the solution reaches to over-saturation state and the
dissolved salt will precipitate until the reaction equilibrium (K) is reached. If the
“Q” is smaller than KSP, there is under-saturation and the salts will dissolve until
the KSP is reached [39].
In the case of mobile phase, the mobile water, rate of reaction and diffusion
velocities play an important role.
The steps involved in the mobile phase can be represented as follows:
(a) The time taken for water to reach the reaction place
(b) The chemical reaction taking place (e.g. Ca(OH)2 → Ca2+ + 2OH-)
(c) The time taken for products (Ca2+, 2OH-) to leave the reaction place.
Step 1 and 3 are the rate determining steps and depend on the dissolution
velocities of the reaction and products [39]. However, ion strength and common
ion effect also influences the reaction.
All the solid substance in hardened cement paste and in the pore solution are in
thermodynamic balance with each other and surroundings. This balance is
disturbed in a leaching process and the dissolution of these substance depend
on their solubility products.

66
The soluble compounds that could have been present in the test solution and
their respective Ksp and K values are provided in Table 3.5. The solubility product
values are designated to the compounds which are sparingly soluble.
Table 3.4 The Ksp and K values of possible soluble compounds present in the
test solution
Cation Compound Solubility product
solubility at room
temperature in water
Equilibrium
constant
Ksp g/L mmol/L (K) Ca2+ CaSO4.2H2O→ Ca2+ + SO42-
+2H2O 10-4.58 2.49 14.0 10 2.3
Ca(OH)2 →Ca2+ + 2OH- 10 -5.2 1.85 24.9 10 1.22
CaCO3→Ca2+ + CO32- 10 -8.48 0.01 0.35 103.22
CaCl2→ Ca2+ + 2Cl- 595 5,360
Sr2+ SrSO4→ Sr2+ + SO42- +2H2O 10-7 0.11 0.6
Sr(OH)2 →Sr2+ + 2OH- 10-3 4.1 33.7
SrCO3 →Sr2+ + CO32- 10-10 0.01 31.3
SrCl2 + Sr2+ + 2Cl- 435 2,744
Mg2+ MgSO4→Mg2+ + SO42- +2H2O 260 2,159
Mg(OH)2 →Mg2+ + 2OH- 0.01 0.2
MgCO3→Mg2+ + CO32- 0.11 1.3
MgCl2 + Mg2+ + 2Cl- 542.5 5,698
Na+ NaOH →Na+ + OH- 420 10,652
NaCl →Na+ + Cl- 357 6,102
Na2SO4 →2Na+ + SO42- 47.6 335
Na2CO3 →2Na+ + CO32- 71 700
K+ KOH →K+ + OH- 970 17,290
KCl →K+ + Cl- 347 4,657
K2SO4 →2K+ + SO42- 68.5 393
K2CO3 →2K+ + CO32- 1120 8,104
Cs+ CsOH →Cs+ + OH- 3995 26,367
CsCl →Cs+ + Cl- 1617 9,650
Cs2SO4 →2Cs+ + SO42- 1670 4,615
Cs2CO3 →2Cs+ + CO32- 2605 7,996
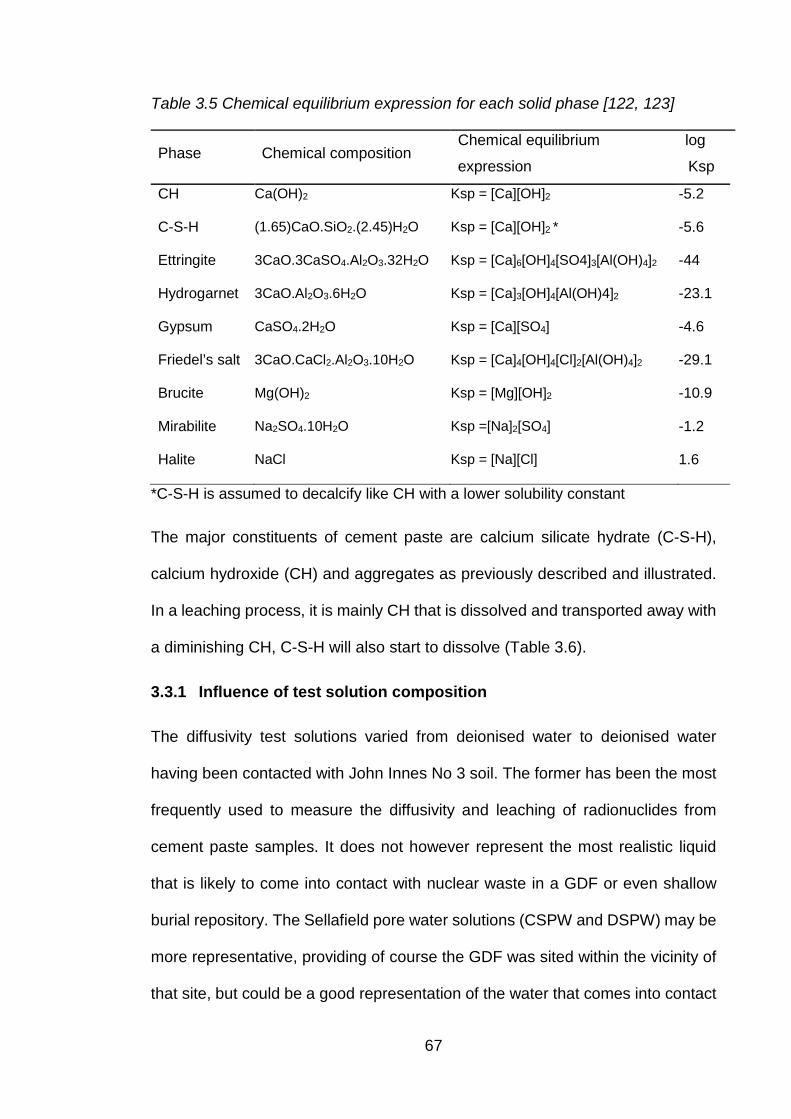
67
Table 3.5 Chemical equilibrium expression for each solid phase [122, 123]
Phase Chemical composition Chemical equilibrium
expression
log
Ksp
CH Ca(OH)2 Ksp = [Ca][OH]2 -5.2
C-S-H (1.65)CaO.SiO2.(2.45)H2O Ksp = [Ca][OH]2 * -5.6
Ettringite 3CaO.3CaSO4.Al2O3.32H2O Ksp = [Ca]6[OH]4[SO4]3[Al(OH)4]2 -44
Hydrogarnet 3CaO.Al2O3.6H2O Ksp = [Ca]3[OH]4[Al(OH)4]2 -23.1
Gypsum CaSO4.2H2O Ksp = [Ca][SO4] -4.6
Friedel’s salt 3CaO.CaCl2.Al2O3.10H2O Ksp = [Ca]4[OH]4[Cl]2[Al(OH)4]2 -29.1
Brucite Mg(OH)2 Ksp = [Mg][OH]2 -10.9
Mirabilite Na2SO4.10H2O Ksp =[Na]2[SO4] -1.2
Halite NaCl Ksp = [Na][Cl] 1.6
*C-S-H is assumed to decalcify like CH with a lower solubility constant
The major constituents of cement paste are calcium silicate hydrate (C-S-H),
calcium hydroxide (CH) and aggregates as previously described and illustrated.
In a leaching process, it is mainly CH that is dissolved and transported away with
a diminishing CH, C-S-H will also start to dissolve (Table 3.6).
3.3.1 Influence of test solution composition
The diffusivity test solutions varied from deionised water to deionised water
having been contacted with John Innes No 3 soil. The former has been the most
frequently used to measure the diffusivity and leaching of radionuclides from
cement paste samples. It does not however represent the most realistic liquid
that is likely to come into contact with nuclear waste in a GDF or even shallow
burial repository. The Sellafield pore water solutions (CSPW and DSPW) may be
more representative, providing of course the GDF was sited within the vicinity of
that site, but could be a good representation of the water that comes into contact
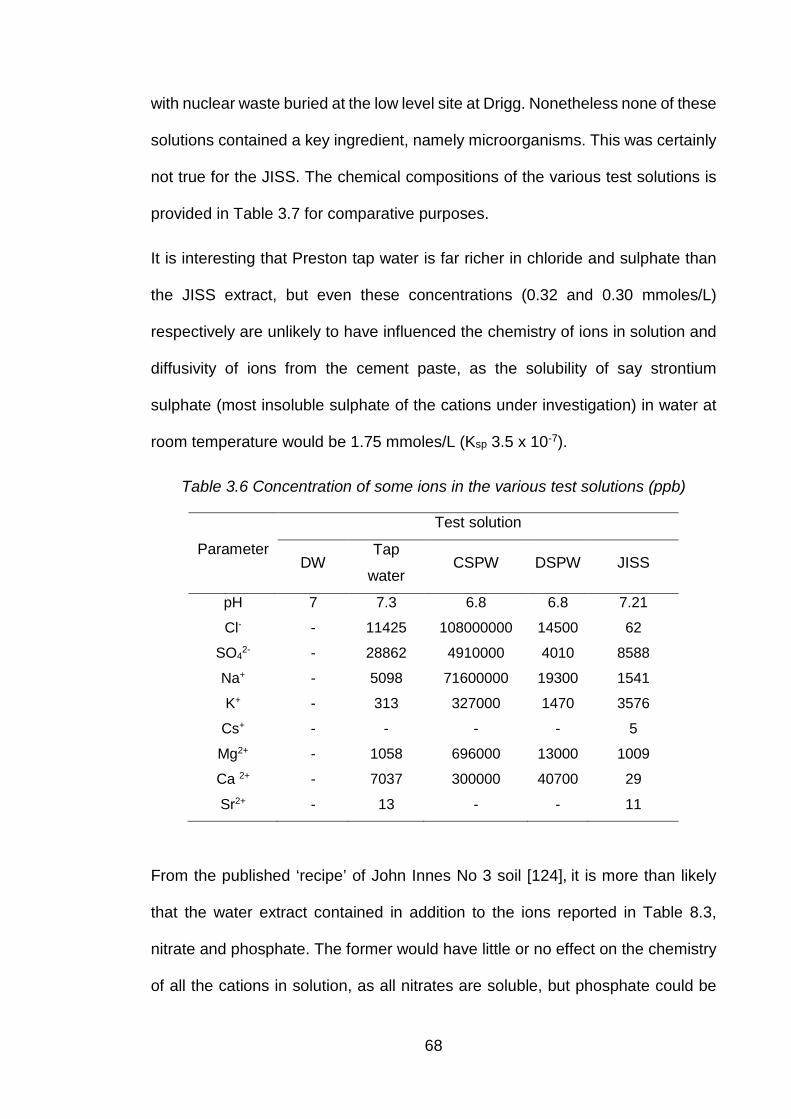
68
with nuclear waste buried at the low level site at Drigg. Nonetheless none of these
solutions contained a key ingredient, namely microorganisms. This was certainly
not true for the JISS. The chemical compositions of the various test solutions is
provided in Table 3.7 for comparative purposes.
It is interesting that Preston tap water is far richer in chloride and sulphate than
the JISS extract, but even these concentrations (0.32 and 0.30 mmoles/L)
respectively are unlikely to have influenced the chemistry of ions in solution and
diffusivity of ions from the cement paste, as the solubility of say strontium
sulphate (most insoluble sulphate of the cations under investigation) in water at
room temperature would be 1.75 mmoles/L (Ksp 3.5 x 10⁻⁷).
Table 3.6 Concentration of some ions in the various test solutions (ppb)
Parameter
Test solution
DW Tap
water CSPW DSPW JISS
pH 7 7.3 6.8 6.8 7.21
Cl- - 11425 108000000 14500 62
SO42- - 28862 4910000 4010 8588
Na+ - 5098 71600000 19300 1541
K+ - 313 327000 1470 3576
Cs+ - - - - 5
Mg2+ - 1058 696000 13000 1009
Ca 2+ - 7037 300000 40700 29
Sr2+ - 13 - - 11
From the published ‘recipe’ of John Innes No 3 soil [124], it is more than likely
that the water extract contained in addition to the ions reported in Table 8.3,
nitrate and phosphate. The former would have little or no effect on the chemistry
of all the cations in solution, as all nitrates are soluble, but phosphate could be

69
more influential than all other anions as the Ksp for strontium phosphate for
example is 4 x 10-28 which is a far smaller than for strontium carbonate (5.6 x10-
10). This very low solubility of strontium phosphate did not hinder the release of
strontium from the ≈3% strontium chloride cement paste into solution (maximum
Sr2+ concentration in the JISS test solution for the closed system 0.34 mmoles,
i.e. about 0.6% of Sr2+ leached from the cement paste).
3.3.2 pH effect
The pH values of the test solution during the diffusivity experiments varied from
≈7 to over 12. The initial pH value for most of these experiments was 7 (deionised
water) and 7.03 (tap water), but others for example the simulated CSPW and
JISS affected by the make-up salts or the ions leached from the soil, had a pH
value of 6.8 and 7.21 respectively. Although pH values were regularly and
routinely measured during the course of the experiments the concentration of
hydroxide and carbonate were not.
The alkalinity (hydroxide concentration) can be calculated from the formula:
[OH-] = Kw/[H+] = 10-14/[H+]
Assuming an ideal situation i.e. vey dilute solution, then for the following pH
values the concentration of hydroxide ions (Table 3.8) will be

70
Table 3.7 Predicted hydroxide concentration based on pH value
pH value OH- (moles/L)
7 10-7
8 10-6
9 10-5
10 10-4
11 10-3
12 10-2
One of the highest variation in pH value was for the 0.3% strontium chloride
contaminated BFS:OPC; the initial pH value after 7 days was 7.50 increasing to
11.85 after 105 days (Figure 4.9). This would require about 10 mmoles of
hydroxide i.e. about 5 mmoles of Ca(OH)2. The maximum calcium concentration
measured for this experiment was 2.24 mmoles/L which suggest some of the
other alkali/alkaline earth metals (Na+, K+, and Mg2+) contributed to the pH
increase.
At pH values above 12, the concentration of hydroxide ions will be equivalent to
if not greater than the chloride and/or sulphate concentrations due to the anions
diffused from the cement paste (for both these cations for the majority of the
experiments the maximum concentration was significantly less than 10 mmoles).
As will be discussed latter this concentration of hydroxide would influence the
solubility of the cations; Ca2+, Sr2+, Co2+ etc.
From the Bjerrum plot (Figure 3.6) below (which is for a water with a total carbon
value of 1mmole/L) the concentration of both carbonate and bicarbonate can be
predicted. At pH values of about 10 and above, the concentration of HCO3- rapidly
decreases with a corresponding increase of CO32- concentration. If anything a
1mmole total carbon value for this work is an over estimation as the diffusivity

71
circuit was a closed system with air ingress unlikely. Even if carbon dioxide
ingress into the diffusivity experimental circuit had occurred with subsequent
adsorption then conversion to carbonate would have been low at pH values under
8 (less than 1mmole/L) but at higher pH values would increase to about 10 mmole
at pH 9.5. Making an allowance for this adsorption/conversion at the higher pH
values monitored in these experiments then the impact of carbonate on the
speciation of calcium would predominate but significantly less so for Sr2+ and Co2+
when compared with hydroxide and sulphate anions Ksp data (Table 3.9).
Table 3.8 Ksp values for selected salts
anion cation
Ca2+ Sr2+ Co2+ OH- 5.02. x 10-6 6.4.x 10-3 1.1.x 10-15
CO32- 3.36.x 10-9 5.6.x 10-6 1.x 10-10
SO42- 4.93 x 10⁻⁵ 3.44.x 10-7
Figure 3.6 Bjerrum plot showing the activities of inorganic carbon species as a
function of pH for a value of total inorganic carbon of 10-3 moles L-1 [125].

72
Attempts to demonstrate the influence of pH alone on the diffusivity of
cations/anions were hindered and complicated by other contributors. The
changes with time of cement hydrates composition in equilibrium with pore water
coupled with the impact of added salts to the make-up water on the release of
alkali metals and subsequently Ca2+ are not easily isolated. It is reasonable to
assume that at lower pH values of the test solution i.e. 7 to 8 could interact with
the surface of the CPS leading to leaching of alkali metals (Na+, K+, Cs+) that
produce soluble salts. At higher pH values (>11.0) diffusivity via pore water would
predominate.
3.3.3 Diffusion/leaching
The leaching process begins when solid compounds in concrete are dissolved by
surrounding aqueous phase and then transported away, either due to
concentration gradients (diffusion), by the flow of water (convection) or
electromigration [39]. This process occurs in a sequence of stages, which are
dependent on the solubility product values of the compounds. The most soluble
elements such as alkali hydroxides are removed first from the solid sample. In
the second stage, the calcium hydroxide (i.e. portlandite) is dissolved, followed
by the dissolution of the calcium-silicate-hydrate (C-S-H) gel phases. In a final
stage other cement phases, such as ettringite are dissolved [40]. Solid materials
are dissolved depends on theirs solubility (Ksp) and where they are located in the
pore system in relation to pure water and each other. When dissolved, the ions
will diffuse towards water with less content of the ions. Leaching of lime originates
from the calcium hydroxide Ca(OH)2, due to its large amount in cement paste and
comparative easy solubility. At the same time, but to a much less amount, as long
there is Ca(OH)2 left, lime will also be dissolved from the other hydration products

73
calcium silicate hydrate (C-S-H), calcium aluminium hydrates (C3A) and calcium
aluminium iron hydrate (C4AF), viz:
H2O + [Ca(OH)2; C-S-H; AFT; AFM] = Ca2+aq
Convection flow of ions is totally governed by the water flow; generally the
quickest leaching degradation of a concrete structure occurs when ions are
leached by convection. Diffusion flow of ions is probably influenced by
concentration gradients, inter-molecular forces between dissolved ions and
intermolecular forces between dissolved ions and solid walls.
The design of the diffusivity experiments in the present research was based on
the cement paste sample surface area ( ≈ 71 cm2), the volume of test solution
(200 cm3) in the circuit and the test solution flow rate (300 cm3/hour). This flow
rate was sufficient for good mixing but not excessive to create erosion of the
cement paste samples. The data generated from the diffusivity experiments
carried out on BFS:OPC and PFA:OPC CPSs with different test solutions
revealed that there are number of factors which contribute towards the rate of
diffusivity of cations:
(a) The nature and the concentration of added cation
(b) The composition of cement paste sample (BFS:OPC and PFA:OPC).
(c) Nature of test solution used in diffusivity experiments

74
3.3.3.1 Nature of added cation
The rate of diffusivity of Cs+ was higher than Sr2+ and Co2+ (Figure 3.9 to Figure
3.12). Caesium ion as Na+, will be highly soluble in the pore water of OPC grout,
which has been measure in pore water [118] and thus, leaching is diffusion
controlled, whereas Sr2+ forms sparingly soluble strontium or calcium/strontium
carbonate or sulphate, which is well retained in grout. Strontium ion is likely to
substitute for Ca2+ in some of the compounds highlighted in Table 3.1. However,
the number of Ca2+ present in OPC:BFS CPS (602 mmoles) were more in
comparison with PFA:BFS CPS (147 mmoles) (Table 3.14). The higher content
of Ca2+ in BFS:OPC comes from Ca2+ content of BFS (38.22 wt%). As mentioned
earlier, the dissolution and solubility of species will depend on Ksp values of salts
formed by Sr [SrSO4 (Ksp=10-7); Sr(OH)2 (Ksp=10-3), SrCO3 (Ksp=10-10)]. Caesium
is readily soluble and therefore Ksp values do not apply. The similar behaviour of
Sr2+ and Ca2+ can be explained in terms of their electronic configuration. From
concrete degradation experiments, it has been shown that Sr2+ is strongly linked
to Ca(OH)2 [126]. Strontium becomes chemically bonded to concrete by the
exchange of Sr2+ for Ca2+ in hydrated silicate or ettringite [127, 128]. This makes
Sr2+ relatively less soluble in the pore water of concrete [129]. Leaching studies
carried out on 137Cs and 60Co radionuclides from both ordinary Portland cement
and cement mixed with two ratios of silica fume and ilmenite produced a
decreasing pattern of diffusivity as 137Cs >60Co, indicating the larger diffusion
coefficient for caesium in waste matrices [83].
The diffusivity of cations is dependent on the age of the cement paste sample.
The rate of diffusivity of Sr2+ from non-aged CPS (Figure 4.2) was higher than the
aged 3% SrCl2 (Figure 4.7) and 3% SrCO3.(Figure 4.16). Similar results were

75
found in case of Cs+ diffusivity (Figure 4.3 and Figure 4.8). This could be due to
the effect of aging and carbonation process that may have decreased the porosity
and hence lowered the diffusion of cations. The carbonation reaction leads to the
reduction in the porosity of cement paste and contributes to formation of
protective layer at the surface of cement paste [27, 130]. Studies have shown
that the formation of calcite as a result of carbonation, reduces the porosity due
to higher molar volume (36.9 cm3/mol compared to 33.1cm3/mol for CH) [27].
The micro-pore areas of aged and SrCO3 CPSs were lower than the non-aged
CPSs (Table 4.5). As mentioned earlier, carbonation leads to the formation of
calcium carbonate, silica gel and metallic oxides which over the period of time
begin to accumulate in the pores of concrete grout resulting in the physical and
chemical changes to cementitious waste forms. Much of the research on
carbonation of cementitious materials, however, has focused upon structural
aspects i.e., compressive strength, permeability and creep in reinforced concrete
[131-134]. Nevertheless, scant information exists regarding the influence of
carbonation on the chemical properties of cement-based materials with respect
to the diffusivity of encapsulated waste. Few of such studies have been carried
out on accelerated carbonation process [135-139] that produced lowered
diffusional release of strontium but increased the release of other metal ions
[139]. Lower diffusivity of Sr2+ from aged CPS could be attributed to formation of
SrCO3 (Ksp= 10-10).
There is a strong correlation between the diffusivity of metal ions through a
cement paste and w/c. As mentioned earlier, the w/c determines the porosity of
the cement paste sample. Studies have shown that the change in the w/c

76
between 0.2 and 0.7 could increase the diffusivity of Cs+ by up to 3 order
magnitude [140].
Incorporation of Sr2+ as an insoluble salt such as carbonate has affected the
physio chemical features of the CPS. Calcium carbonate, similar to SrCO3
enhances the hydration of cement paste. Portland–limestone cements are the
most widely used cements according to the European cement standard ENV 197-
1 [141]. Since early 1980, the Canadian cement standard (CSA 1998 - CAN/CSA-
A5) permits the use of 5% ground limestone in Portland cement [142] and in more
than 25 countries. The considerable lower rates of diffusivity of Sr2+ from CPS
incorporated with SrCO3 (Figure 4.12) compared to the SrCl2 (Figure 4.2) is
attributed to the difference in their solubility which is significantly higher for SrCl2.
The outcome from the diffusivity experiments with CPS incorporated with SrCO3
suggests that further research is required with CPS incorporating carbonate in
cement paste samples to ascertain the rates of diffusivity of Cs+ and Sr2+, when
fillers are used in the formulation. It is envisaged that addition of CaCO3/
limestone as a filler will reduced the rates of diffusivity of encapsulated cations to
an insignificant level. Caesium carbonate is quite soluble and therefore any effect
will have to be due to pore blocking.
Incorporation of Sr2+ as a carbonate has also affected the pH of the test solution.
The pH of the test solution starts to fall after 100 days of diffusivity in both the
0.3% and 3% incorporated SrCO3 CPS (Figure 4.11 and 4.12). The surface wash-
out rather than the diffusion could be attributed towards the lower rates of
diffusivity of cations and anions after 100 days. The use of filler/CaCO3 may be
beneficial for waste disposal/cement encapsulation of waste, our experiments
have shown the lower rate of diffusivity of cations.
77
It is suggested that the effect of CaCO3 is only physical [16]. Presence of
carbonate salt in the CPS has also lowered the rate of diffusivity of Ca2+, Na+,
SO42- in both the formulations. The presence of carbonate salt reduced the
diffusivity of Ca2+ by a factor of ≈ 27 in comparison with CPS chloride salt of Sr2+.
The effect is more pronounced in PFA:OPC; the rate of diffusivity was reduced
significantly in comparison with BFS:OPC 3% SrCl2. This is due to the effect of
mass action; the amount of Ca2+ present in PFA:OPC CPS (147 mmoles) which
was significantly smaller than BFS:OPC CPS (602 mmoles) (Table 3.14).
Another interesting feature observed; incorporation of Cs+ in the CPS has
lowered the rate of diffusivity of Ca2+ by a factor of ≈ 12 in comparison with control
CPS and 54 times slower in comparison with 3% SrCl2 (Figure 4.1 to Figure 4.3).
The diffusivity of Cs+ is comparable with measured pH values of the test solution
(DW). Cs+ is highly soluble in the pore water, it is more than likely that Cs+ will
behave like Na+ and K+ in the pore water because of their similarities in solubility
properties and position in the periodic table. Caesium diffused out much before
other alkali metal ions. This attributed to the concentration of Cs+ (21.31 mmoles)
present in the CPS which was far greater than the Na+ (12.6 mmoles) and K+
(11.3 mmoles). The sequence of diffusivity of metal ions shown in 3% CsCl CPS
in both the formulation is similar i.e. Cs+> Cl->K+>SO42->Na+>Ca2+. However the
sequence of diffusivity shown in the 3%SrCl2 CPS is Cl->Ca2+>Sr2+>K+>SO42-
>Na+, this demonstrates the binding nature of both Sr2+ and Cs+ is one of the
major factor contributing their rate of diffusivity. When both the Cs+ and Sr+
incorporated together in cement paste sample the sequence of diffusivity of metal
ions was Cl->Cs+>Ca2+>K+>Sr2+>SO42->Na+ (Figure 4.5) indicating that Cs+
78
diffuses faster than Ca2+ which is significant and needs special attention to lower
its diffusivity.
An interesting feature is, the rate of diffusivity of Cs+ remains the same when
added as a single cation or as a cation combined with battery of cations (Sr2+,
Co2+). There was no significant difference (p >0.05) observed in the rate of Cs+
from 3% CsCl and combined metal CPS. However such pattern is not observed
with Sr2+ and Co2+. When strontium encapsulated/added in combination with
other cations of interest; the diffusivity reduced by a factor of 1.5. This suggests
that the diffusivity of Sr2+ changes based on its status how it’s been added, single
cation or a as a mixture with other cations/ radionuclide. The same is not
applicable to Cs2+. This attributes to the nature of binding of Cs2+. Caesium ion is
highly soluble in pore water like other alkali cations Na+, K+ [31, 143]. The degree
of chloride binding is influenced by the nature of cation chloride added to the
make-up water. Due to their similar chemistry (dictated by their electronic
configuration and hence position in periodic table, group II), Sr2+ would be
expected to behave similarly to Ca2+ and hence the cement paste would bind
more chloride, unlike Cs+ if comparable with Na+ that would have less bound
chloride, as explained earlier. The addition of caesium chloride, if behaviour is
similar to sodium chloride, would also result in higher pore solution pH in
comparison with strontium chloride addition. This pH increase for CsCl addition
may be explained by the following:
2NaCl (aq) + Ca3Al2O6.6H2O (s) + Ca(OH)2 (aq) + 4H2O → Ca3Al2O6.CaCl2.10H2O (s) +
2NaOH (aq)

79
Increasing pH will also disfavour the formation of the sparingly soluble calcium
hydroxide (1.859/L at room temp). This will explain why chloride binding is higher
for alkaline earth metals (Ca2+, Sr2+) when used as the chloride source:
CaCl2 (aq) + Ca3Al2O6.6H2O (s) + 4H2O → Ca3Al2O6.CaCl2.10H2O (s)
Both C3A and C4AF bind chloride. The ability of calcium hydroxide to bind chloride
when exposed to a calcium chloride solution has been demonstrated simply by
adding Ca(OH)2 to the calcium chloride solution and analysing the solid and liquid
phases. A similar experiment but using sodium chloride solution indicated that
NaCl did not form compounds with calcium hydroxide to any significant extent.
The workers postulated the following reactions:
2NaCl (aq) + 4Ca(OH)2 (s) + 12H2O → CaCl2.3Ca(OH)2.12H2O (s) + 2NaOH (aq)
The above reaction is negligible, but the following reaction is thermodynamically
favourable:
CaCl2 (aq) + 3Ca(OH)2 (s) + 12H2O → CaCl2.3Ca(OH)2.12H2O (s)
Other reactions, in addition to chloride ion substitution reactions identified above,
occur in cement hydrate and between the various hydrates. The inherent sulphur
particularly in BFS influences the sulphate content and alkalinity of pore solution.
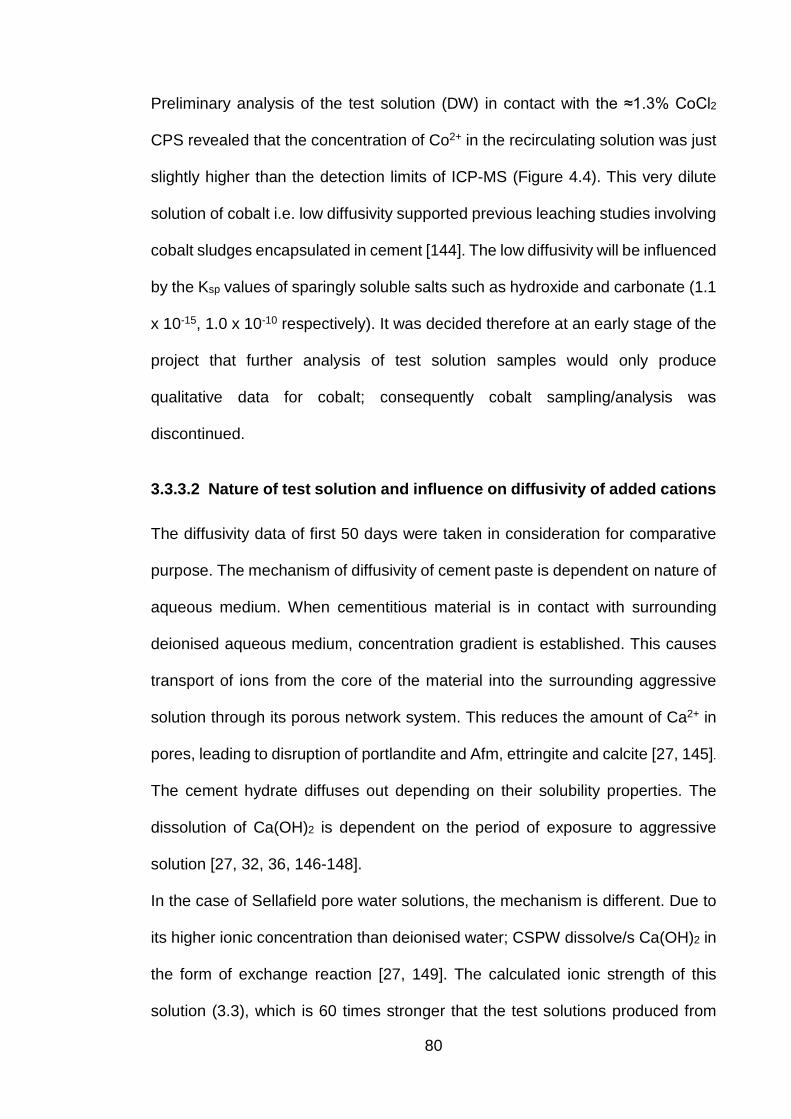
80
Preliminary analysis of the test solution (DW) in contact with the ≈1.3% CoCl2
CPS revealed that the concentration of Co2+ in the recirculating solution was just
slightly higher than the detection limits of ICP-MS (Figure 4.4). This very dilute
solution of cobalt i.e. low diffusivity supported previous leaching studies involving
cobalt sludges encapsulated in cement [144]. The low diffusivity will be influenced
by the Ksp values of sparingly soluble salts such as hydroxide and carbonate (1.1
x 10-15, 1.0 x 10⁻¹⁰ respectively). It was decided therefore at an early stage of the
project that further analysis of test solution samples would only produce
qualitative data for cobalt; consequently cobalt sampling/analysis was
discontinued.
3.3.3.2 Nature of test solution and influence on diffusivity of added cations
The diffusivity data of first 50 days were taken in consideration for comparative
purpose. The mechanism of diffusivity of cement paste is dependent on nature of
aqueous medium. When cementitious material is in contact with surrounding
deionised aqueous medium, concentration gradient is established. This causes
transport of ions from the core of the material into the surrounding aggressive
solution through its porous network system. This reduces the amount of Ca2+ in
pores, leading to disruption of portlandite and Afm, ettringite and calcite [27, 145].
The cement hydrate diffuses out depending on their solubility properties. The
dissolution of Ca(OH)2 is dependent on the period of exposure to aggressive
solution [27, 32, 36, 146-148].
In the case of Sellafield pore water solutions, the mechanism is different. Due to
its higher ionic concentration than deionised water; CSPW dissolve/s Ca(OH)2 in
the form of exchange reaction [27, 149]. The calculated ionic strength of this
solution (3.3), which is 60 times stronger that the test solutions produced from
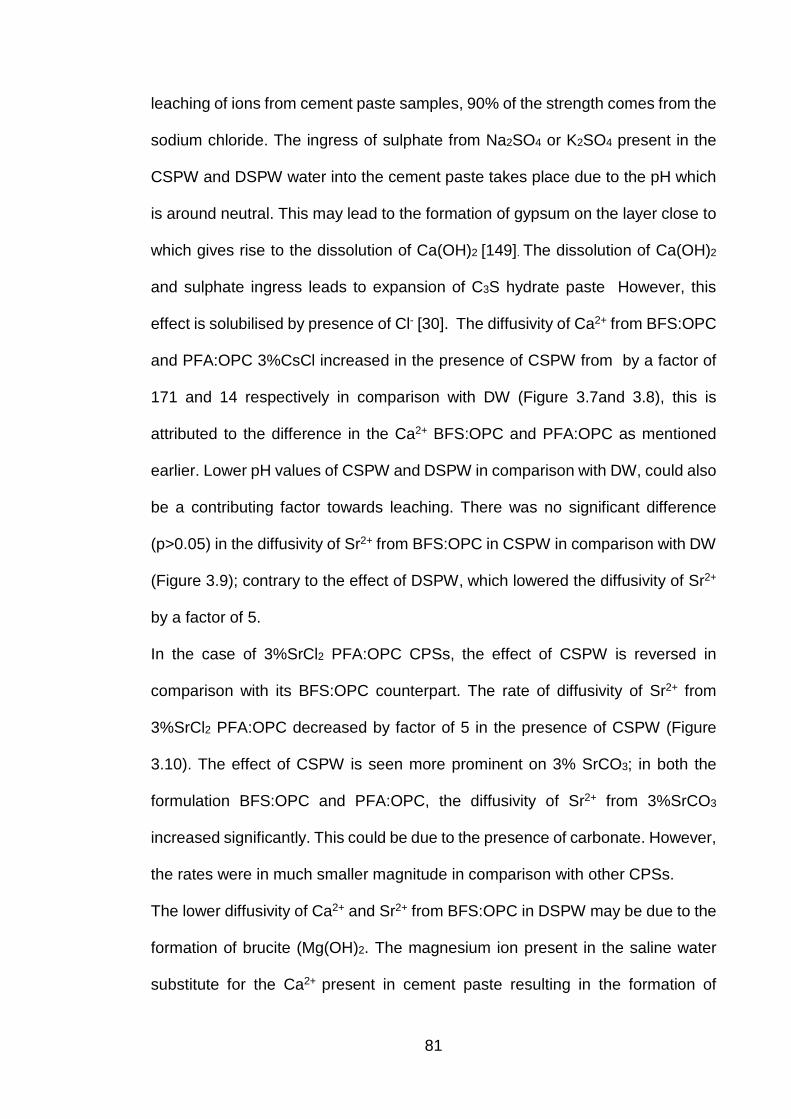
81
leaching of ions from cement paste samples, 90% of the strength comes from the
sodium chloride. The ingress of sulphate from Na2SO4 or K2SO4 present in the
CSPW and DSPW water into the cement paste takes place due to the pH which
is around neutral. This may lead to the formation of gypsum on the layer close to
which gives rise to the dissolution of Ca(OH)2 [149]. The dissolution of Ca(OH)2
and sulphate ingress leads to expansion of C3S hydrate paste However, this
effect is solubilised by presence of Cl- [30]. The diffusivity of Ca2+ from BFS:OPC
and PFA:OPC 3%CsCl increased in the presence of CSPW from by a factor of
171 and 14 respectively in comparison with DW (Figure 3.7and 3.8), this is
attributed to the difference in the Ca2+ BFS:OPC and PFA:OPC as mentioned
earlier. Lower pH values of CSPW and DSPW in comparison with DW, could also
be a contributing factor towards leaching. There was no significant difference
(p>0.05) in the diffusivity of Sr2+ from BFS:OPC in CSPW in comparison with DW
(Figure 3.9); contrary to the effect of DSPW, which lowered the diffusivity of Sr2+
by a factor of 5.
In the case of 3%SrCl2 PFA:OPC CPSs, the effect of CSPW is reversed in
comparison with its BFS:OPC counterpart. The rate of diffusivity of Sr2+ from
3%SrCl2 PFA:OPC decreased by factor of 5 in the presence of CSPW (Figure
3.10). The effect of CSPW is seen more prominent on 3% SrCO3; in both the
formulation BFS:OPC and PFA:OPC, the diffusivity of Sr2+ from 3%SrCO3
increased significantly. This could be due to the presence of carbonate. However,
the rates were in much smaller magnitude in comparison with other CPSs.
The lower diffusivity of Ca2+ and Sr2+ from BFS:OPC in DSPW may be due to the
formation of brucite (Mg(OH)2. The magnesium ion present in the saline water
substitute for the Ca2+ present in cement paste resulting in the formation of

82
magnesium hydroxide, known as brucite which precipitates in the pores of the
cement paste.
MgSO4 (aq) + Ca(OH)2 → CaSO4 . 2H2O + Mg(OH)2
This brucite forms the protective surface layer which obstructs the further action
of ions present in the aqueous medium. The pH values (9 -10) in the DSPW from
3% SrCl2 were favourable for the formation of brucite. These results are
comparable with Heikola’s work [40]. Similar effect is noticed in other research
where the diffusivity of the added cations was lowered in synthetic sea water [28].
In the case of Cs+, the increase in the ionic concentration of the test solution has
shown a positive correlation with the rate of diffusivity of Cs+ (Figure 3.11). The
diffusivity of Cs+ increased by a factor of 1.7 and 2.5 in the presence of DSPW
and CSPW respectively in comparison with DW. However, no such diffusivity
patterns were observed in the case of PFA:OPC 3% CsCl experiment (Figure
3.12). There was no significant difference (p>0.05) in the diffusivity of Cs+ from
DW and CSPW.
The diffusivity of weaker concentration of cation CPSs i.e. 0.3% Sr2+ and Cs+
showed lower rates of diffusivity in comparison with their 3% counterpart.
However, the rates of diffusivity of the added cations were similar to the diffusivity
of cations from control CPS. This suggests that the mineralogical transformations
in conjunction with physical (porosity, pore size etc.), concentration of cations,
test solutions (aqueous environment) and chemical factors (release of Ca(OH)2 ,
pH etc.) have influenced the diffusivity of ions from the cement paste samples.

83
Figure 3.7 Comparative average rate of diffusivity of calcium from BFS: OPC
CPSs in DW, DSPW, CSPW and JISS.
Figure 3.8 Comparative average rate of diffusivity of calcium from PFA: OPC
CPSs in DW, CSPW and JISS.
DW DSPW CSPW JISS Control 5.66 0.32 194 8≈3% SrCl2 45 11 233 60≈3% CsCl 0.99 6.7 170 32
≈3% SrCO3 1.26 7.88 50 18
0
50
100
150
200
250
Ave
rage
rate
of d
iffus
ivity
(µg/
cm2 /d
ay)
DW CSPW JISS Control 1.45 14 2.51≈3% SrCl2 242 116 200≈3% CsCl 1.92 25.98 4.42
≈3% SrCO3 0.93 15.97 1.12
0
50
100
150
200
250
300
Ave
rage
rate
of d
iffus
ivity
(µg/
cm2 /d
ay)

84
Figure 3.9 Comparative average rate of diffusivity of strontium from 3% SrCl2 and
3% SrCO3 BFS:OPC CPSs in DW, DSPW, CSPW and JISS.
Figure 3.10 Comparative average rate of diffusivity of strontium from 3% SrCl2
and 3% SrCO3 PFA:OPC CPSs in DW, CSPW and JISS.
DW DSPW CSPW JISS≈3% SrCl2 35 7 43 19
≈3% SrCO3 0.05 0.05 2.58 0.82
0
5
10
15
20
25
30
35
40
45
Ave
rage
rate
of d
iffus
ivity
(µg/
cm2 /d
ay)
DW CSPW JISS≈3% SrCl2 171 35 128
≈3% SrCO3 0.04 1.45 0.04
0
20
40
60
80
100
120
140
160
180
Ave
rage
rate
of d
iffus
ivity
(µg/
cm2 /d
ay)
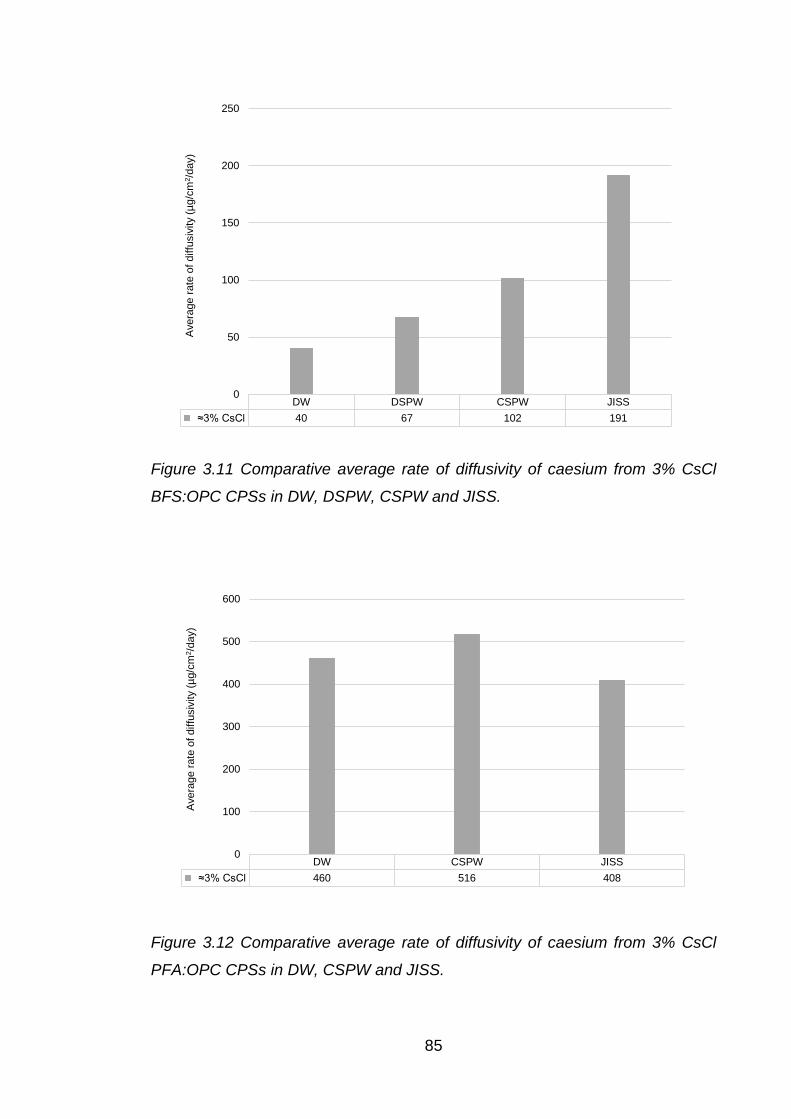
85
Figure 3.11 Comparative average rate of diffusivity of caesium from 3% CsCl
BFS:OPC CPSs in DW, DSPW, CSPW and JISS.
Figure 3.12 Comparative average rate of diffusivity of caesium from 3% CsCl
PFA:OPC CPSs in DW, CSPW and JISS.
DW DSPW CSPW JISS≈3% CsCl 40 67 102 191
0
50
100
150
200
250
Ave
rage
rate
of d
iffus
ivity
(µg/
cm2 /d
ay)
DW CSPW JISS≈3% CsCl 460 516 408
0
100
200
300
400
500
600
Ave
rage
rate
of d
iffus
ivity
(µg/
cm2 /d
ay)
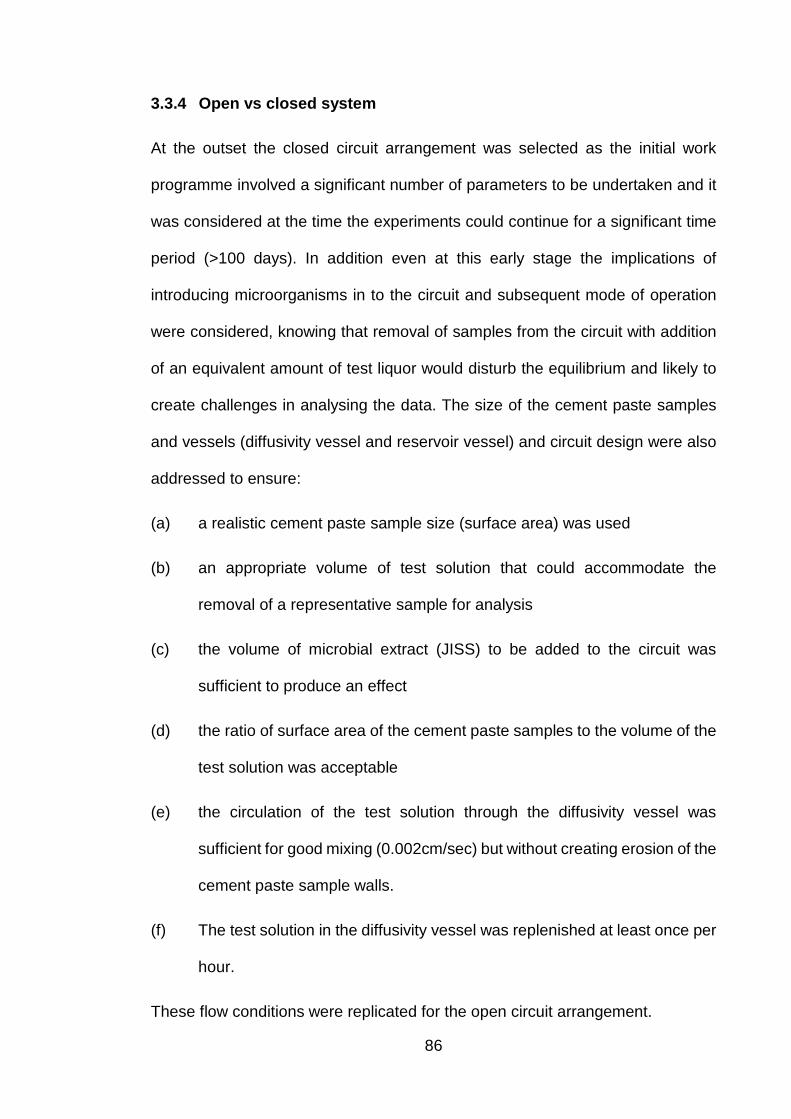
86
3.3.4 Open vs closed system
At the outset the closed circuit arrangement was selected as the initial work
programme involved a significant number of parameters to be undertaken and it
was considered at the time the experiments could continue for a significant time
period (>100 days). In addition even at this early stage the implications of
introducing microorganisms in to the circuit and subsequent mode of operation
were considered, knowing that removal of samples from the circuit with addition
of an equivalent amount of test liquor would disturb the equilibrium and likely to
create challenges in analysing the data. The size of the cement paste samples
and vessels (diffusivity vessel and reservoir vessel) and circuit design were also
addressed to ensure:
(a) a realistic cement paste sample size (surface area) was used
(b) an appropriate volume of test solution that could accommodate the
removal of a representative sample for analysis
(c) the volume of microbial extract (JISS) to be added to the circuit was
sufficient to produce an effect
(d) the ratio of surface area of the cement paste samples to the volume of the
test solution was acceptable
(e) the circulation of the test solution through the diffusivity vessel was
sufficient for good mixing (0.002cm/sec) but without creating erosion of the
cement paste sample walls.
(f) The test solution in the diffusivity vessel was replenished at least once per
hour.
These flow conditions were replicated for the open circuit arrangement.
87
The design of open circuit arrangement was such that the data produced could
be as comparable as possible with the closed circuit experiments. This required:
(a) the same size of cement paste samples
(b) a similar flowrate of test solution
but this open arrangement would have a significantly different surface area to
volume ratio for final test solution volume.
The logistics of accommodating nearly 50 litres/week of test solution for each
open circuit experiment in the laboratory for about 30 to 40 days was a significant
factor. This volume of solution influenced the decision to use tap water, but the
data would be comparable with the closed circuit experiment using tap water
results.
The concentrations of ions in the test solutions from the closed and open circuit
experiments were significantly different; the closed circuit as seen from the results
section had on three or four perturbations due to some of the cations/anions
reaching their solubility limits, but with a new equilibrium when fresh test solution
was added to the circuit. Solubility limits were not a factor in the open circuit, as
the concentration of ions were significantly lower but the total quantity of ions
leached were significantly higher and consequently the total quantities of ions
leached were far greater (Table 3.10 and 3.11).
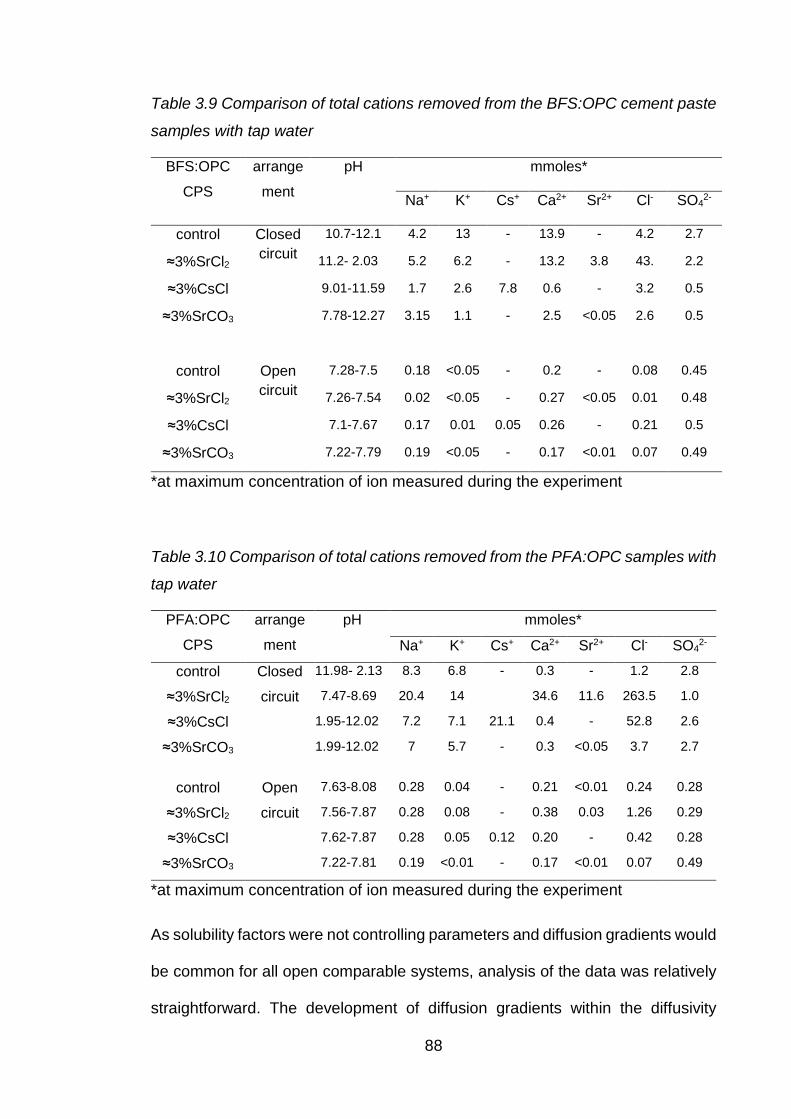
88
Table 3.9 Comparison of total cations removed from the BFS:OPC cement paste
samples with tap water
BFS:OPC
CPS
arrange
ment
pH mmoles*
Na+ K+ Cs+ Ca2+ Sr2+ Cl- SO42-
control Closed circuit
10.7-12.1 4.2 13 - 13.9 - 4.2 2.7
≈3%SrCl2 11.2- 2.03 5.2 6.2 - 13.2 3.8 43. 2.2
≈3%CsCl 9.01-11.59 1.7 2.6 7.8 0.6 - 3.2 0.5
≈3%SrCO3 7.78-12.27 3.15 1.1 - 2.5 <0.05 2.6 0.5
control Open circuit
7.28-7.5 0.18 <0.05 - 0.2 - 0.08 0.45
≈3%SrCl2 7.26-7.54 0.02 <0.05 - 0.27 <0.05 0.01 0.48
≈3%CsCl 7.1-7.67 0.17 0.01 0.05 0.26 - 0.21 0.5
≈3%SrCO3 7.22-7.79 0.19 <0.05 - 0.17 <0.01 0.07 0.49
*at maximum concentration of ion measured during the experiment
Table 3.10 Comparison of total cations removed from the PFA:OPC samples with
tap water
PFA:OPC
CPS
arrange
ment
pH mmoles*
Na+ K+ Cs+ Ca2+ Sr2+ Cl- SO42-
control Closed
circuit
11.98- 2.13 8.3 6.8 - 0.3 - 1.2 2.8
≈3%SrCl2 7.47-8.69 20.4 14 34.6 11.6 263.5 1.0
≈3%CsCl 1.95-12.02 7.2 7.1 21.1 0.4 - 52.8 2.6
≈3%SrCO3 1.99-12.02 7 5.7 - 0.3 <0.05 3.7 2.7
control Open
circuit
7.63-8.08 0.28 0.04 - 0.21 <0.01 0.24 0.28
≈3%SrCl2 7.56-7.87 0.28 0.08 - 0.38 0.03 1.26 0.29
≈3%CsCl 7.62-7.87 0.28 0.05 0.12 0.20 - 0.42 0.28
≈3%SrCO3 7.22-7.81 0.19 <0.01 - 0.17 <0.01 0.07 0.49
*at maximum concentration of ion measured during the experiment
As solubility factors were not controlling parameters and diffusion gradients would
be common for all open comparable systems, analysis of the data was relatively
straightforward. The development of diffusion gradients within the diffusivity

89
vessel for the closed circuit between the CPS surface and test solution at the
interface were worthy of consideration as this could give rise to the re-sorption of
cations, particularly the alkali metals (Na+, K+ and Cs+) onto mineral sites in the
cement paste sample. This is discussed in more detail in a following section.
The ultimate consideration in the design of the experiments was to simulate the
likely interaction of ground water with a wastes in a GDF. It was considered that
a more ebb and flow arrangement would occur in preference to a continuous flow
through. The closed circuit arrangement with removal of saturated solution and
addition of fresh test solution would best resemble the former and more than likely
produce more realistic data of value to the nuclear industry.
The experimental conditions/arrangements used in this work provide worst case
and best (real) case scenarios when considering mobility of radionuclides from a
GDF. The worst case scenario is for the open circuit when solution equilibria are
unlike to be achieved thus allowing for near continuous diffusion of ions from the
cement paste into the flowing water. With a closed circuit arrangement (real case
scenario) various equilibria (Ksp) will be established which will impinge on the
solubility of sparingly soluble compounds such as calcium hydroxide, carbonate,
sulphate as well as some of these salts of strontium and magnesium. At this time
of reporting this diffusion data it is not possible to give a more precise prediction
as the flow of water into/through a GDF will be governed by numerous factors not
least time.
90
3.4 Chemistry and interaction of anions
3.4.1 Chloride interaction
If the concrete is made up with seawater or other saline waters or as used in our
case incorporated chloride salt in the makeup water, the resulting concrete will
have a comparatively low chloride content. Any chloride in the mixture generally
enters the AFm (ferro-aluminate) phase with 60% of the chloride bound to the
cement paste as mono-chloro-aluminate and the remainder dissolved in the pore
water [53, 54]. At comparatively high chloride concentrations, other salts such as
3CaO.CaCl2.15H2O, can form [129] . When chloride is combined with the AFm
phase, the resulting compound is known as Friedel's salt (4CaO.Al2O3.(Cl, OH)10)
which is stable at higher pH and above 40 °C. Below 20°C, the tri-chloride
complex (AFt) is formed [150].
3.4.2 Internal sulphate attack
The diffusion of internal sulphate has received less attention. Internal sulphate
arises from oxidation of sulphide to sulphate present in the additives [54, 151-
153]. Most of the research has concentrated on the degradation of cementitious
material by external sulphate attack [154, 155]. This internal sulphate may react
with free portlandite to give gypsum
Ca(OH)2 + MSO4 = CaSO4 + M(OH)2
where M may be a monovalent or bivalent cation
Alternatively, sulphate may react with the hydrated calcium aluminates to form
calcium sulpho-aluminate followed by sparingly soluble ettringite. The gypsum
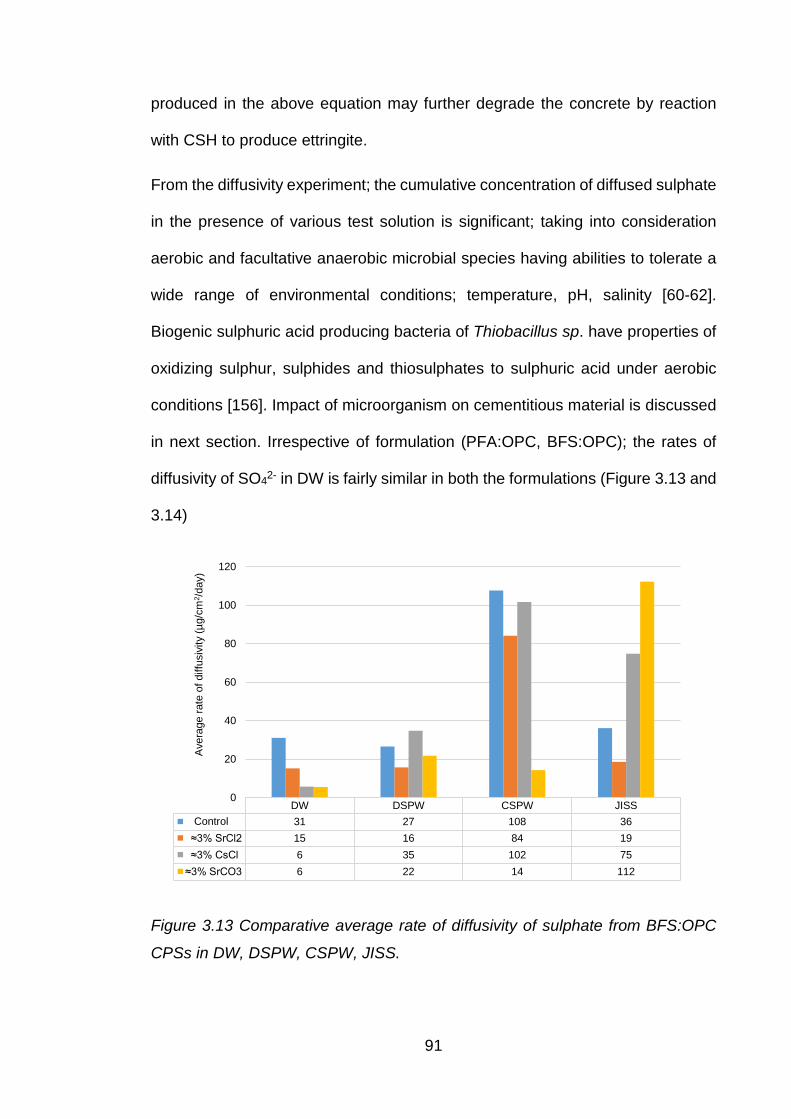
91
produced in the above equation may further degrade the concrete by reaction
with CSH to produce ettringite.
From the diffusivity experiment; the cumulative concentration of diffused sulphate
in the presence of various test solution is significant; taking into consideration
aerobic and facultative anaerobic microbial species having abilities to tolerate a
wide range of environmental conditions; temperature, pH, salinity [60-62].
Biogenic sulphuric acid producing bacteria of Thiobacillus sp. have properties of
oxidizing sulphur, sulphides and thiosulphates to sulphuric acid under aerobic
conditions [156]. Impact of microorganism on cementitious material is discussed
in next section. Irrespective of formulation (PFA:OPC, BFS:OPC); the rates of
diffusivity of SO42- in DW is fairly similar in both the formulations (Figure 3.13 and
3.14)
Figure 3.13 Comparative average rate of diffusivity of sulphate from BFS:OPC
CPSs in DW, DSPW, CSPW, JISS.
DW DSPW CSPW JISS Control 31 27 108 36≈3% SrCl2 15 16 84 19≈3% CsCl 6 35 102 75
≈3% SrCO3 6 22 14 112
0
20
40
60
80
100
120
Ave
rage
rate
of d
iffus
ivity
(µg/
cm2 /d
ay)
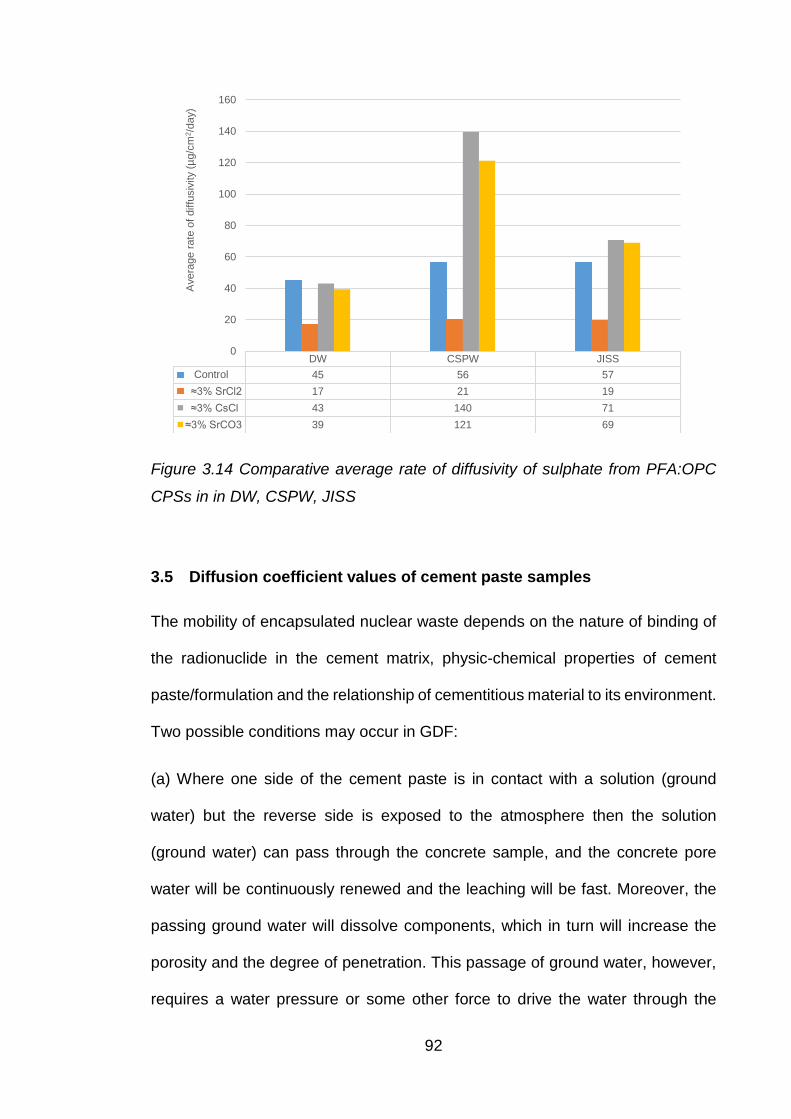
92
Figure 3.14 Comparative average rate of diffusivity of sulphate from PFA:OPC
CPSs in in DW, CSPW, JISS
3.5 Diffusion coefficient values of cement paste samples
The mobility of encapsulated nuclear waste depends on the nature of binding of
the radionuclide in the cement matrix, physic-chemical properties of cement
paste/formulation and the relationship of cementitious material to its environment.
Two possible conditions may occur in GDF:
(a) Where one side of the cement paste is in contact with a solution (ground
water) but the reverse side is exposed to the atmosphere then the solution
(ground water) can pass through the concrete sample, and the concrete pore
water will be continuously renewed and the leaching will be fast. Moreover, the
passing ground water will dissolve components, which in turn will increase the
porosity and the degree of penetration. This passage of ground water, however,
requires a water pressure or some other force to drive the water through the
DW CSPW JISS Control 45 56 57≈3% SrCl2 17 21 19≈3% CsCl 43 140 71
≈3% SrCO3 39 121 69
0
20
40
60
80
100
120
140
160
Ave
rage
rate
of d
iffus
ivity
(µg/
cm2 /d
ay)

93
concrete [39]. The flow of water may reduce due to autogenous healing [157].
However, it is not clear whether the condition in a repository will be suitable for
crack healing; especially if the cement is extensively modified with slag or fuel
ash [158]. As concrete is porous there is a relationship between porosity,
thickness, pressure and transmissivity of concrete. Flow in capillary pores in
saturated concrete follows Darcy´s law for laminar flow through a porous medium
[159] .
On the other hand, (b) when cement paste is completely submerged then the
pressure will be equalised and no water will penetrate the cement paste.
Dissolution will then be controlled by diffusion through the surface of the concrete.
The driving force for diffusion controlled leaching will be the concentrations
difference between the pore solution and the external water
The calculated diffusion coefficient values from the expression mentioned in
section 2.11 are shown in Table 3.12 (BFS:OPC) and Table 3.13 (PFA:OPC).

94
Table 3.11 Diffusion coefficient values (De) from BFS:OPC CPS
The values in “[ ]” are the time in days for the ion to reach its maximum concentration.
Time period(days) Na+ K+ Cs+ Ca2+ Sr2+ Cl- SO4
2-
BFS:OPC DW 7 10.7 – 12.1 1.22 x 10⁻⁴ 4.34 x 10⁻⁵ 5.37 x 10⁻⁹ 2.29 x 10⁻⁵
Control 201 6.74 x 10⁻⁷ 1.8 x 10⁻⁵ 6.82 x 10⁻¹⁰ 1.57 x 10⁻⁷
At max conc. 9 x 10⁻⁵ 2.02 x 10⁻⁴ 7.29 x 10⁻⁸ 8.83 x 10⁻⁴ 1.63 x 10⁻⁵
[21] [112] [126] [21] [21]
≈3% SrCl2 7 11.2 – 12.03 1.59 x 10⁻⁴ 1.55 x 10⁻⁴ 2.15 x 10⁻⁷ 2.38 x 10⁻⁶ 2.53 x 10⁻⁴ 4.44 x 10⁻⁶
201 5.49 x 10⁻⁷ 7.71 x 10⁻⁷ 5.25 x 10⁻⁹ 3.5 x 10⁻⁸ 1.38 x 10⁻⁶ 5.76 x 10⁻⁸
At max conc. 2.78 x 10⁻⁶ 1.19 x 10⁻⁴
[21] [70] ≈3% CsCl 7 9.01 – 11.59 5.25 x 10⁻⁶ 1.24 x 10⁻⁵ 1.95 x 10⁻⁵ 5.39 x 10⁻¹⁰ 1.96 x 10⁻⁵ 1.25 x 10⁻⁶
207 1.26 x 10⁻⁶ 2.56 x 10⁻⁶ 6.58 x 10⁻⁵ 6.02 x 10⁻⁹ 6.92 x 10⁻⁵ 9.94 x 10⁻¹⁰
At max conc. 1.06 x 10⁻⁵ 7.33 x 10⁻⁶
[192] [35]combine At max conc. 10.64 – 12.59 1.49 x 10⁻⁵ 9.33 x 10⁻⁷ 1.17 x 10⁻³
[35] [35] [35]
Control JISS At max conc. 10.73 – 11.2 1.99 x 10⁻⁵ 4.25 x 10⁻⁶ 3.92 x 10⁻⁹ 1.81 x 10⁻⁵ 1.66 x 10⁻⁵
[35] [35] [35] [42] [28]
≈3% SrCl2 Tap water At max conc. 7.86 – 8.05 1.67 x 10⁻⁴ 3.09 x 10⁻⁵ 8.61 x 10⁻⁷ 4.29 x 10⁻⁵ 4.81 x 10⁻⁵ 5.07 x 10⁻⁶
(closed system) [7] [14] [7] [7] [7] [14]
Control Tap water 4 7.28 6.51 x 10⁻³ 3.44 x 10⁻⁵ 3.0 x 10⁻⁶ 5.08 x 10⁻⁹ 3.75 x 10⁻¹ 4.28 x10⁻²
≈3% SrCl2 open 4 7.26 7.55 x 10⁻³ 3.63 x 10⁻⁵ 5.22 x 10⁻⁶ 5.93 x 10⁻⁷ 3.88 x 10⁻⁵ 2.00 x 10⁻²
≈3% CsCl 4 7.1 5.48 x 10⁻³ 1.15 x 10⁻⁴ 4.52 x 10⁻⁴ 3.11 x 10⁻⁶ 5.83 x 10⁻³ 2.3 x 10⁻²
Calculated De values (cm2/day)CPS Test solution pH value

95
Table 3.12 Diffusion coefficient values (De) from PFA:OPC CPS
The values in “[ ]” are the time in days for the ion to reach its maximum concentration
Time perioddays Na+ K+ Cs+ Ca2+ Sr2+ Cl- SO4
2-
PFA/OPC DW 7 11.98 – 12.13 1.35 x 10⁻⁴ 1.01 x 10⁻⁴ 8.01 x 10⁻⁷ 4.10 x 10⁻⁹ 1.5 x 10⁻⁴
Control 49 1.73 x 10⁻⁵ 1.00 x 10⁻⁵ 1.14 x 10⁻⁷ 5.25 x 10⁻¹⁰ 2.37 x 10⁻⁵
≈3% SrCl2 7 7.47 – 8.69 1.00 x 10⁻³ 5.26 x 10⁻⁴ 1.05 x 10⁻⁴ 5.58 x 10⁻⁵ 7.98 x10⁻⁴ 2.4 x 10⁻⁵
49 7.04 x 10⁻⁵ 3.16 x 10⁻⁵ 6.45 x 10⁻⁶ 3.64 x 10⁻⁶ 5.64 x 10⁻³ 2.15 x 10⁻⁶
≈3% CsCl 7 11.95 – 12.02 7.62 x 10⁻⁵ 5.02 x 10⁻⁵ 1.56 x 10⁻³ 1.26 x 10⁻⁸ 9.22 x 10⁻³ 1.43 x 10⁻⁴
49 1.43 x 10⁻⁵ 6.8 x 10⁻⁶ 1.35 x 10⁻⁴ 1.33 x 10⁻⁹ 1.18 x 10⁻³ 7.86 x 10⁻⁶
Control JISS At max conc. 12.11 – 12.27 5.30 x 10⁻⁵ 2.65 x 10⁻⁵ 3.64 x 10⁻⁹ 5.35 x 10⁻⁴ 6.05 x 10⁻⁵
[21] [21] [35] [35] [35]
Control Tap water (open) 4 8.08 6.70 x 10⁻³ 1.94 x 10⁻⁴ 1.8 x 10⁻⁴ 9.7 x 10⁻⁷ Not quoted 1.44 x 10⁻²
≈3% SrCl2 4 7.87 8.09 x 10⁻³ 7.45 x 10⁻⁴ 5.32 x 10⁻⁴ 2.38 x 10⁻⁵ 2.85 x 10⁻² 2.0 x 10⁻²
≈3% CsCl 4 7.1 1.33 x 10⁻⁴ 2.99 x 10⁻⁴ 2.65 x 10⁻³ 1.5 x 10⁻⁴ 3.35 x 10⁻² 1.75 x 10⁻²
Calculated De values (cm2/day)CPS pH valueTest solution

96
As can be seen from the generated data (Table 3.12 and 3.13), the calculated
diffusion coefficient values (De) changes depending on the experiment. The
diffusion of Sr2+ in closed circuit was 2.38 x10⁻⁶ cm2/day (3% SrCl2 BFS:OPC)
compared to open circuit (tap water) 5.93 x10⁻⁷ cm2/day. However, there was no
significant difference observed in the diffusion of Sr2+ from PFA:OPC. The
diffusion of Sr2+ from 3% SrCl2 PFA:OPC in DW experiment were measured as
5.58 x10⁻⁵ cm2/day in comparison with open circuit tap water 2.38 x10⁻⁵ cm2/day.
Similar comparison was observed for Cs+; 1.06 x10⁻⁵ cm2/day (3% CsCl
BFS:OPC DW) compared to 4.52 x10⁻⁴ cm2/day in open circuit (tap water). The
diffusion values of Cs+ were found to remain fairly constant with time period 1.95
x10-6 cm2/day (7 days ) and 6.8 x10⁻⁵ cm2/day (207 days), contrary to 3% SrCl2
2.38 x10⁻⁶ cm2/day (7 days ) and 3.5 x10⁻⁸ cm2/day (201 days). Similar changes
were observed in PFA:OPC.
This could be attributed to various factors as mentioned earlier. The dissolution
of cement paste samples occurring in stagnant water (closed circuit) can reach
equilibrium resulting in a saturated solution; the leaching process and the
dissolution of these substance depend on their solubility products. Secondly, the
concentrations of ions in the test solutions from the closed and open circuit
experiments was significantly different. The difference in the diffusion coefficient
value is due to some of the cations/anions reaching their solubility limits, but with
a new equilibrium when fresh test solution was added to the closed circuit, which
is also reflected on the diffusivities of soluble cations (Na+ and K+) and
comparable with pH values. Solubility limits were not a factor in the open circuit
and hence the difference in is noticed. Thus it can be deduced that the diffusion
of the cations from encapsulated waste will depend on its properties,
97
environmental aqueous conditions (stagnant or mobile) and the type of
formulation (BFS:OPC/PFA:OPC). The diffusion coefficients values calculated
from the experimental data, produced from both the open and closed experiments
are in good agreement with previously published data [160-162]. The conversion
of cm2/day to cm2/sec corresponds to the literature diffusion coefficient value of
respective ions. These values also support the experimental conditions used to
measure the basic data can affect to some degree the final calculated diffusivity
value. In our case this is not surprising as for the closed system experiments
solubility equilibrium would be achieved relatively early in the experiment (around
50 days) and therefore would be expected to affect the diffusion of appropriate
cations such as Cs+ and Sr2+ from the pore water into the test solution. As with
previously published work our diffusivity values also demonstrate that chloride
and group I cations diffuse faster than other anions such as sulphate and cations
e.g. calcium and strontium.
3.6 Depth of dissolution/leaching
There have been number of models developed to simulate the leaching and
migration of encapsulated cations/radionuclides. Few of such models have used
Fick’s law of diffusion which is based on diffusion co-efficient, rate of diffusion
and concentration of ions [139, 163, 164]. However, most models have failed to
give a true picture of a possible depth to which diffusion of each cation occurred
with respect to the amount present originally in the cement paste sample.
In our studies, this was determined using shrinking core model. According to
shrinking core model, in a leaching process, the removal/dissolution of
cations/solid materials leads to a diameter of unleached core that shrinks with
time as leaching/dissolution proceeds with time.
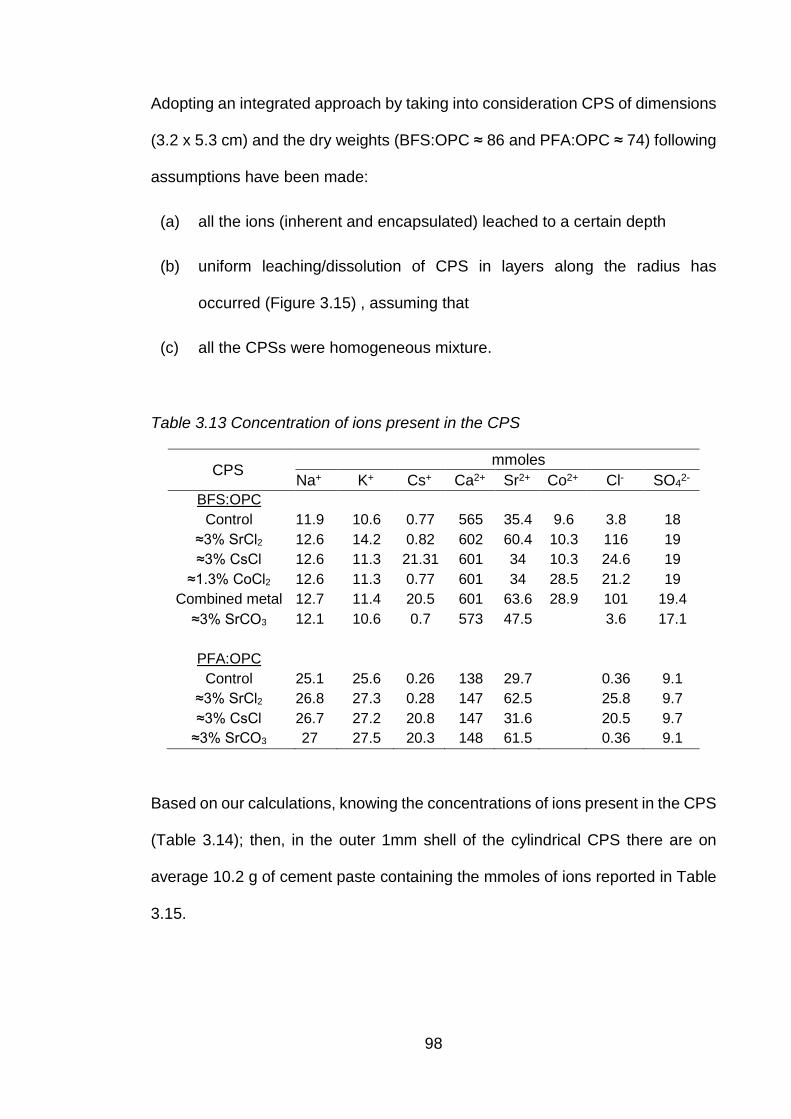
98
Adopting an integrated approach by taking into consideration CPS of dimensions
(3.2 x 5.3 cm) and the dry weights (BFS:OPC ≈ 86 and PFA:OPC ≈ 74) following
assumptions have been made:
(a) all the ions (inherent and encapsulated) leached to a certain depth
(b) uniform leaching/dissolution of CPS in layers along the radius has
occurred (Figure 3.15) , assuming that
(c) all the CPSs were homogeneous mixture.
Table 3.13 Concentration of ions present in the CPS
CPS mmoles
Na+ K+ Cs+ Ca2+ Sr2+ Co2+ Cl- SO42- BFS:OPC
Control 11.9 10.6 0.77 565 35.4 9.6 3.8 18 ≈3% SrCl2 12.6 14.2 0.82 602 60.4 10.3 116 19 ≈3% CsCl 12.6 11.3 21.31 601 34 10.3 24.6 19
≈1.3% CoCl2 12.6 11.3 0.77 601 34 28.5 21.2 19 Combined metal 12.7 11.4 20.5 601 63.6 28.9 101 19.4
≈3% SrCO3 12.1 10.6 0.7 573 47.5 3.6 17.1
PFA:OPC Control 25.1 25.6 0.26 138 29.7 0.36 9.1
≈3% SrCl2 26.8 27.3 0.28 147 62.5 25.8 9.7 ≈3% CsCl 26.7 27.2 20.8 147 31.6 20.5 9.7
≈3% SrCO3 27 27.5 20.3 148 61.5 0.36 9.1
Based on our calculations, knowing the concentrations of ions present in the CPS
(Table 3.14); then, in the outer 1mm shell of the cylindrical CPS there are on
average 10.2 g of cement paste containing the mmoles of ions reported in Table
3.15.
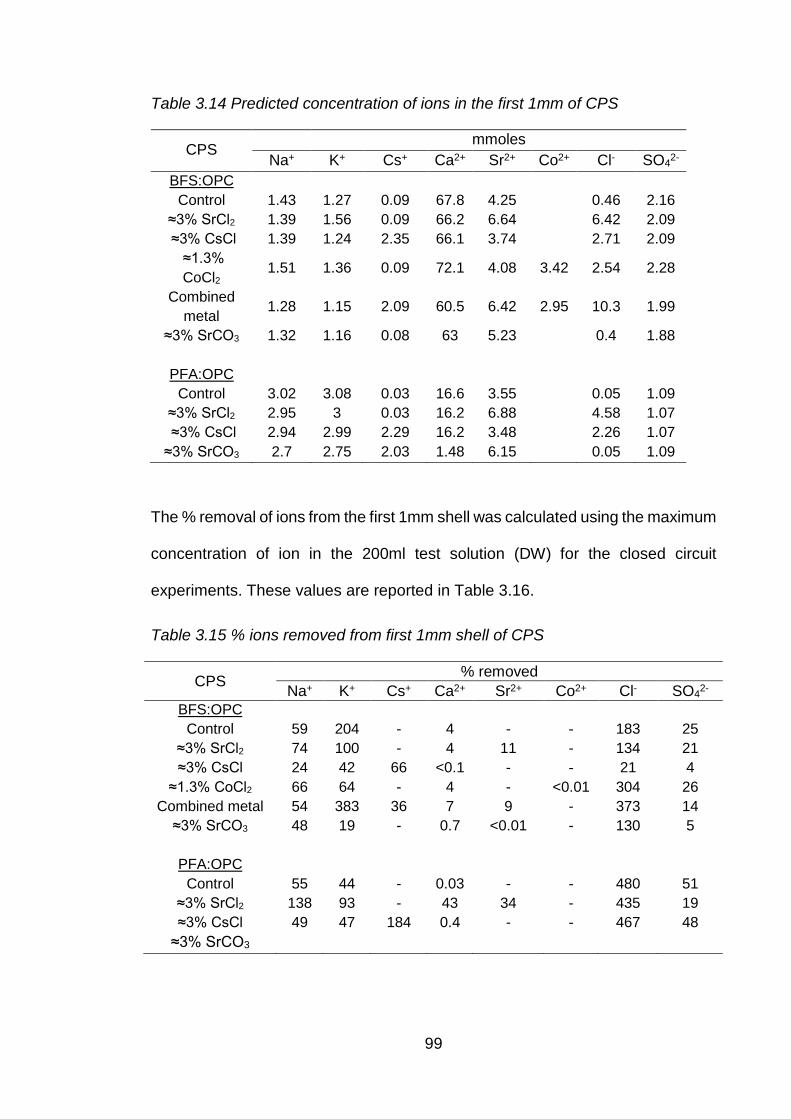
99
Table 3.14 Predicted concentration of ions in the first 1mm of CPS
CPS mmoles
Na+ K+ Cs+ Ca2+ Sr2+ Co2+ Cl- SO42- BFS:OPC
Control 1.43 1.27 0.09 67.8 4.25 0.46 2.16 ≈3% SrCl2 1.39 1.56 0.09 66.2 6.64 6.42 2.09 ≈3% CsCl 1.39 1.24 2.35 66.1 3.74 2.71 2.09
≈1.3% CoCl2
1.51 1.36 0.09 72.1 4.08 3.42 2.54 2.28
Combined metal 1.28 1.15 2.09 60.5 6.42 2.95 10.3 1.99
≈3% SrCO3 1.32 1.16 0.08 63 5.23 0.4 1.88
PFA:OPC Control 3.02 3.08 0.03 16.6 3.55 0.05 1.09
≈3% SrCl2 2.95 3 0.03 16.2 6.88 4.58 1.07 ≈3% CsCl 2.94 2.99 2.29 16.2 3.48 2.26 1.07 ≈3% SrCO3 2.7 2.75 2.03 1.48 6.15 0.05 1.09
The % removal of ions from the first 1mm shell was calculated using the maximum
concentration of ion in the 200ml test solution (DW) for the closed circuit
experiments. These values are reported in Table 3.16.
Table 3.15 % ions removed from first 1mm shell of CPS
CPS % removed Na+ K+ Cs+ Ca2+ Sr2+ Co2+ Cl- SO42-
BFS:OPC Control 59 204 - 4 - - 183 25
≈3% SrCl2 74 100 - 4 11 - 134 21 ≈3% CsCl 24 42 66 <0.1 - - 21 4
≈1.3% CoCl2 66 64 - 4 - <0.01 304 26 Combined metal 54 383 36 7 9 - 373 14
≈3% SrCO3 48 19 - 0.7 <0.01 - 130 5
PFA:OPC Control 55 44 - 0.03 - - 480 51
≈3% SrCl2 138 93 - 43 34 - 435 19 ≈3% CsCl 49 47 184 0.4 - - 467 48
≈3% SrCO3

100
The values in Table 3.16 shows that some of the ions have diffused out over 2
mm of depth for example Na+ and K+, which is most soluble ion in the pore
solution; K+ has diffused out over 4 mm from combined metal CPS, which could
be attributed to chloride. Calcium being the most abundant cation in the CPS has
shown the % release comparatively lesser than the rest of the cations. The %
release of encapsulated cations (as chloride salt), Sr2+ and Cs+ from PFA:OPC is
significantly higher than the BFS:OPC, with Cs+ diffusing out over 2 mm from ≈3%
CsCl PFA:OPC, which is comparable with Cl- % removal values indicating that
BFS:OPC formulation may slow down the diffusivity of these cation in comparison
with PFA:OPC formulation. However, the diffusivity of Sr2+ when added as
insoluble carbonate salt, is confined to the surface of few micron thickness. Cl- is
the most diffusible anion which has diffused out over 5 mm from control and 3%
CsCl PFA:OPC CPS. This is attributed to the fact that Cl- complexes that may
have formed with Ca2+, Sr2+ and Cs+, are soluble in comparison with sulphate
complexes, hence higher percentage of removal/depth of dissolution. An
interesting feature is, the largest difference between BFS:OPC and PFA:OPC is
the Ca2+ content; the fact that Sr2+ replaces Ca2+ in the cement paste mixture,
above data shows a direct correlation between depth of Sr2+ diffusivity and total
amount of Ca2+ present in the CPS. Depending on the type of formulation
(BFS:OPC, PFA:OPC); the depth of Sr2+ diffusion was significantly higher in 3%
SrCl2 PFA:OPC having 147 mmoles of Ca2+ compared to its BFS counterpart
having 602 mmoles of Ca2+. The effect of mass action can be noticed in control
CPS; the depth of diffusion of Ca2+ is smaller in PFA:OPC compared to BFS:OPC
control CPS.
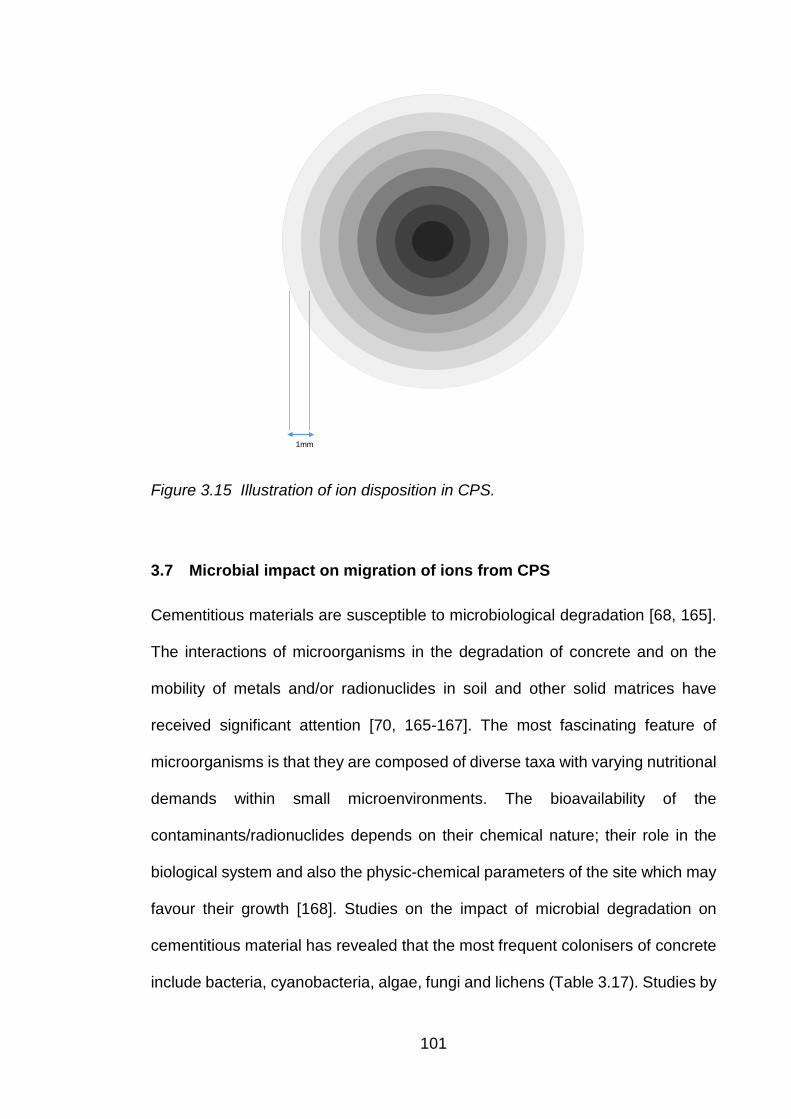
101
Figure 3.15 Illustration of ion disposition in CPS.
3.7 Microbial impact on migration of ions from CPS
Cementitious materials are susceptible to microbiological degradation [68, 165].
The interactions of microorganisms in the degradation of concrete and on the
mobility of metals and/or radionuclides in soil and other solid matrices have
received significant attention [70, 165-167]. The most fascinating feature of
microorganisms is that they are composed of diverse taxa with varying nutritional
demands within small microenvironments. The bioavailability of the
contaminants/radionuclides depends on their chemical nature; their role in the
biological system and also the physic-chemical parameters of the site which may
favour their growth [168]. Studies on the impact of microbial degradation on
cementitious material has revealed that the most frequent colonisers of concrete
include bacteria, cyanobacteria, algae, fungi and lichens (Table 3.17). Studies by
1mm
102
BNFL scientists demonstrated that sulphur-oxidising bacteria (SOB) could
degrade concrete structures by up to 8mm/year. Two of the supervisors (Eccles
and Morton) involved with this project patented this work [77]. SOB were shown
to mobilise radionuclides from contaminated soil, the pore water eventually
achieving a pH less than 1.0 [169]. Microorganisms have the ability to grow over
a wide range of pH, under elevated hydrostatic pressures, in highly alkaline
conditions, in nutrient–starved conditions and at radiation levels that would be
lethal to humans [170] . Throughout nature various elemental cycles including
carbon, nitrogen, sulphur and oxygen occur simultaneously. In GDF the
availability of waste matrices, canisters, over packs, buffers and backfills, etc.,
can be potential nutrient and energy sources for microorganism [171].
Microorganisms can form biofilms which induce corrosion of metal surfaces to
which they are attached [172]. However, direct anaerobic corrosion of concrete
is not known, although anaerobic degradation of organic acids and their impact
on concrete could be a significant factor [173] under aerobic conditions.
Additionally, microbial gas generation [174] may lead to further microbial
transformation. This could lead to an increase in radionuclide mobility and may,
in time, impact on the far-field system with a pathway into the food-chain and/or
other receptors.
The experiments in the present research were designed to simulate an actual
GDF scenario where the microbial population will be influenced by environmental
conditions such as availability of nutrients and energy for their growth and
metabolism [70]. It is very likely that GDF will remain aerobic for few years in
post-closure period. Our experiments were carried out using minimum growth
media, and no additional growth media were added to the test solution. The viable

103
population of bacteria and fungi present in test solution (JISS) had only nutrients
and carbon source present in the circulating system available to them. The
colonisation of the cementitious material begins with those organisms that are
able to cope with the highly alkaline conditions. This primary colonisation alter the
micro-environment and create a new organism for colonisation [168]. Most of the
cations present in cement paste samples will directly or indirectly support the
growth and metabolism of the fungal species. Some of these cations are Na+,
Mg2+, Ca2+, Mn4+, and Fe3+ [175]. Bacterial cells have high tolerance to these
metals in biological functions compared to those without biological significance.
These metals either serve as a functional metal ion in metabolic
process/enzymatic reactions, or support the structural development of the cell
envelope. Bacteria can cope with high concentrations of metal ions depending on
the external condition [176].
Microorganisms treat contaminants in two ways; (i) immobilisation and (ii)
mobilisation; the former reduces their bioavailability, whereas the latter increases
their potential toxicity by increasing their bioavailability and transfer; which in turn
depends on the chemical nature and biological function or biochemical
significance of the metallic species. Several key microbial processes are involved
in the mobilisation and immobilisation of metal compounds by one or more
mechanisms which are presented in Table 3.18 . These processes depend on
the environmental and physic-chemical conditions, e.g. pH, water/moisture,
inorganic and organic molecules, compounds, colloids and particulates present.

104
Table 3.16 Microorganisms involved in the biodegradation of concrete [69].
Concrete degrading organisms
Bacteria
Thiobacillus intermedius [177, 178]
Thiobacillus neapolitanus [178, 179]
Thiobacillus novellus [178, 179]
Thiobacillus thioparus [178, 179]
Acidithiobacillus thiooxidans [178-181]
Thiomonas perometablis[181]
Fungi
Alternaria sp [182]
Cladosporium cladosporioides [182]
Epicoccum nigrum [182] Fusarium sp [177, 182]
Mucor sp [182]
Penicillium oxalicum [182]
Pestalotiopsis maculans [182]
Trichoderma asperellum [182]
Aspergillus niger [183]
Alternaria alternate [184]
Exophiala sp.[184]
Coniosporium uncinatum [184]
Algae
Chaetomorpha antennina [185]
Ulva fasciata [185]
Lichens
Acarospora cervina [186] Candelariella ssp [186]

105
Table 3.17 The major mechanisms of microbial metal interaction [175, 187]
Mobilisation Immobilisation
1. Enzymatic oxidation UO2 + 2Fe3+ → UO2
2 + Fe2+
Autotrophic leaching, e.g.Thiobaccillus ferroxidans, T. thiooxidans.
4Fe2+ + O2 + 4H+ → 4Fe3+ + 2H2O
1. Precipitation e.g.Sulphate-reducing bacteria strictly anaerobic bacteria
2. Enzymatic reduction facultative and obligate anaerobic microorganisms
UO22+ → UO2
Fe3+ → Fe2+ Mn4+ → Mn2+
2. Biosorption
e.g. extracellular polymeric substances (EPS), metal binding proteins.
3. Complexation Metal + ligand →metal complex Citric acid, tricarboxylic acid released during microbial degradation
3. Bioaccumulation
Transport phenomena involving ion pump, ion channel, endocytosis, complex permeation, and lipid permeation
3.7.1 Mobilisation of metal ions
Mobilisation of metals from a substrate is through autotrophic and heterotrophic
leaching, chelation by microbial metabolite by the action of siderophores and by
methylation. The majority of biologically mediated leaching of metal ions take
place as a result of autotrophic metabolism which is carried out by
chemolithotrophic acidophilic bacteria such as Thiobacillus ferrooxidans and T.
Thioxidans, which obtain energy from oxidation of ferrous iron or reduced sulphur
compounds. The end products of autotrophic leaching releases Fe (III) or H2SO4.
The organisms involved in enzymatic reduction are heterotrophic anaerobes, few
of them are facultative and oxygen may also be respired. The reduction of Fe (III)
and Mn (III) to Fe (II) and Mn (II) respectively, may also release the metals

106
attached to their respective oxides [188-190]. This process may also be
enhanced by presence of humic substances [175, 191]. Microbial degradation
also releases various organic acids which have been found to have metal
complexation ability. Several studies have shown that citric and oxalic acid are
commonly released in the surrounding environment by fungal hyphae that form
stable complexes with various metals [192]. The soil fungus Aspergillus niger has
shown the ability to solubilise a wide range of insoluble metal compounds,
including phosphate, sulphide and mineral ores [193]. This fungus produces
organic acids and acidifies the surrounding medium irrespective of presence of
metal compounds. Studies indicated that, altering the concentrations of Nitrogen,
Phosphorous or pH can enhance the production of organic acids [193]. In
manganese deficient growth media; 600 mM of citric acid is produced by A niger,
another example of fungal leaching is that mediated by Penicillium
simplicissimum [66]. This fungus, isolated from a contaminated site was shown
to leach Zn2+ from insoluble ZnO contained in industrial filter dust, by producing
citric acid (7100 mM) [194]. Citric acid derived from a fungal strain of P
simplicissimum has shown a much greater ability to leach Al3+ than pure citric
acid [61]. In an iron deficient medium; microorganisms produce specific iron
chelators known as siderophores. These compounds possess catecholate,
phenolate or hydroxamate as their binding groups. Most fungi possess
intracellular siderophores as iron storage compounds [195]. Over the past few
years many siderophore or siderophore-like compounds have been identified
from various biological systems [196]. Although siderophores are primarily
selective for Fe(III); studies have shown that they can also complex other metals
and radionuclides [197].
107
3.7.2 Immobilisation of metal ions
Immobilisation of toxic metals and radionuclides by microorganisms is achieved
by biosorption to cell wall, exctracellular polysaccharides (EPS), and intracellular
bioaccumulation/precipitation around cell wall [175]. Immobilisation processes
have received considerable attention due to their potential in detoxification of
toxic waste [198]. The accumulation of metals by bacterial cells takes place in
two broad processes (i) passive adsorption which is independent of metabolism
and (ii) active adsorption which is dependent on element-specific transport
system and is metabolism dependant [168]. In the majority of cases, the passive
adsorption plays an important role in metal accumulation due to the scarcity of
nutrients. Active adsorption requires energy. However, passive adsorption is
faster than active [61, 199]. Bacteria can cope with high concentration of metal
ion depending on the external condition [175]. Biosorption by cell walls, involves
EPS and proteins. Many such exopolymers serve as a source of polyanions
which can interact with cationic metal/radionuclide species, under natural
conditions [200]. In the case of fungi, chitin, phenolic polymers and melanins
possess potential metal-binding sites for radionuclides [201]. Precipitation can
take place as a result of release of sulfide due to sulfate reduction by sulpfate-
reducing bacteria (SRB). Most metal sulfides formed are insoluble and the
solubility product of these metal sulfides is in the range of 4.65 X 10⁻¹⁴ (Mn) to
6.44X 10-53 (Hg). Reference studies have shown that extreme reducing
conditions created by SRB can also reduce uranium (VI) [202].
In the present research, genus level identification of bacteria showed the
presence of Actinomyces spp, which readily colonises concrete structures
leading to formation of a biofilm [68]. This biofilm can trap other particulate

108
material making the concrete surface susceptible for degradation [177]. Presence
of Cladosporium spp.; the most frequently detected fungal species on damp or
water-damaged building materials [203], were isolated from all the test solutions
except the control CPS. There have been several studies on the melanin
containing dark-pigmented Cladosporium cladosporioides, which is
predominantly present in soil, showed accumulation of radionuclides, especially
137Cs [204]. Fungal species isolated from within and around the Chernobyl
nuclear reactor detected presence of several species of Cladosporium [67, 200].
The colonisation of cementitious materials by fungi is dependent on pH which
normally takes place once the pH has dropped sufficiently depending on the
availability of nutrients [189, 200]. In the present study the colonisation of fungi
occurred in the later stages of the experiment indicating that these heterotrophs
are late colonisers of cementitious materials which might be using the organic
remnants of primary colonisers as a carbon source. The pH values of JISS is
comparable with the presence of viable bacterial count in the circulating system
(Table 3.19 and 3.20). The circulating system with viable population of bacteria
were measured having lower pH values. Bacteria have ability to acidify or
neutralise the cytoplasm depending on the external environmental conditions, to
maintain the optimal function and their structural integrity [205].
Table 3.18 Summary table showing pH values and microbial analysis of JISS
from BFS:OPC JISS experiment
*None recorded
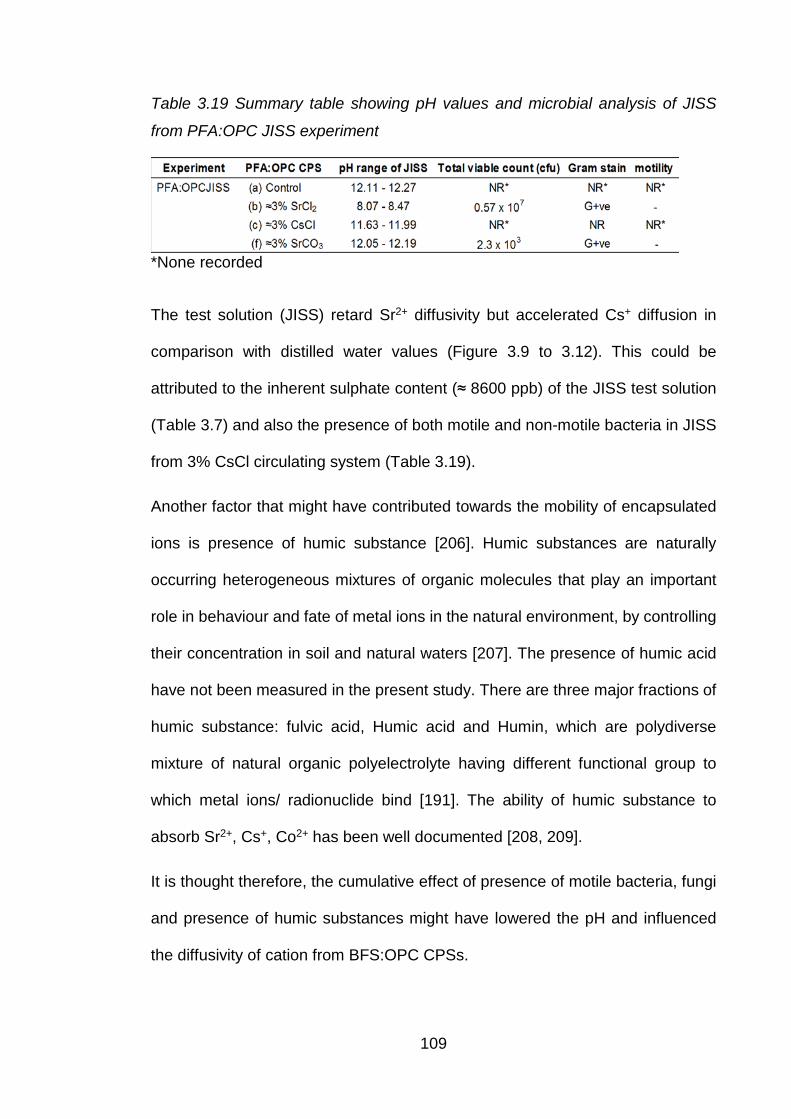
109
Table 3.19 Summary table showing pH values and microbial analysis of JISS
from PFA:OPC JISS experiment
*None recorded The test solution (JISS) retard Sr2+ diffusivity but accelerated Cs+ diffusion in
comparison with distilled water values (Figure 3.9 to 3.12). This could be
attributed to the inherent sulphate content (≈ 8600 ppb) of the JISS test solution
(Table 3.7) and also the presence of both motile and non-motile bacteria in JISS
from 3% CsCl circulating system (Table 3.19).
Another factor that might have contributed towards the mobility of encapsulated
ions is presence of humic substance [206]. Humic substances are naturally
occurring heterogeneous mixtures of organic molecules that play an important
role in behaviour and fate of metal ions in the natural environment, by controlling
their concentration in soil and natural waters [207]. The presence of humic acid
have not been measured in the present study. There are three major fractions of
humic substance: fulvic acid, Humic acid and Humin, which are polydiverse
mixture of natural organic polyelectrolyte having different functional group to
which metal ions/ radionuclide bind [191]. The ability of humic substance to
absorb Sr2+, Cs+, Co2+ has been well documented [208, 209].
It is thought therefore, the cumulative effect of presence of motile bacteria, fungi
and presence of humic substances might have lowered the pH and influenced
the diffusivity of cation from BFS:OPC CPSs.

Chapter 4: Diffusivity from BFS:OPC CPSs with distilled water as a test solution
110
4.1 Aims of study
This chapter aims to evaluate the influence of concentration and nature of cation
on their diffusivity when encapsulated in BFS:OPC in contact with distilled water.
4.2 Introduction
In this chapter, a series of diffusivity experiments have been carried out on non-
aged CPSs to evaluate the diffusivity of caesium and cobalt when added to
BFS:OPC formulation as their chlorides and for strontium when added as chloride
and carbonate. Strontium carbonate was selected to determine the influence of
a water insoluble compound on diffusivity of the cation. In case of aged CPS
diffusivity experiment, samples were allowed to cure for 240 days in the
laboratory atmosphere. Diffusivity studies on these 8 month old samples were
carried out to compare the rates with that of non-aged samples’ in order to have
a better understanding of the encapsulated waste that has been standing in an
interim store and/or in a GDF over a long period of time prior to closure period.
Diffusivity studies were also carried on CPSs encapsulated with ≈0.3% Cs and
Sr chloride and Sr carbonate salts to demonstrate the influence of cation and
anion concentration on the diffusivity of the encapsulated cation. The
experimental conditions were kept identical in all the diffusivity circulation
experiments. A total of six sets of diffusivity experiments (Table 4.1) were carried
out using distilled water and two sets using tap water as a test solution for
comparative purposes; tap water was selected for the ‘open’ diffusivity
experiments. The logistics of accommodating nearly 50 litres/week of test
solution for each open circuit experiment in the laboratory for about 30 to 40 days
was a logistic significant factor. This volume of solution influenced the decision to
use tap water. Each experiment consisted of one to five sets of closed circulating
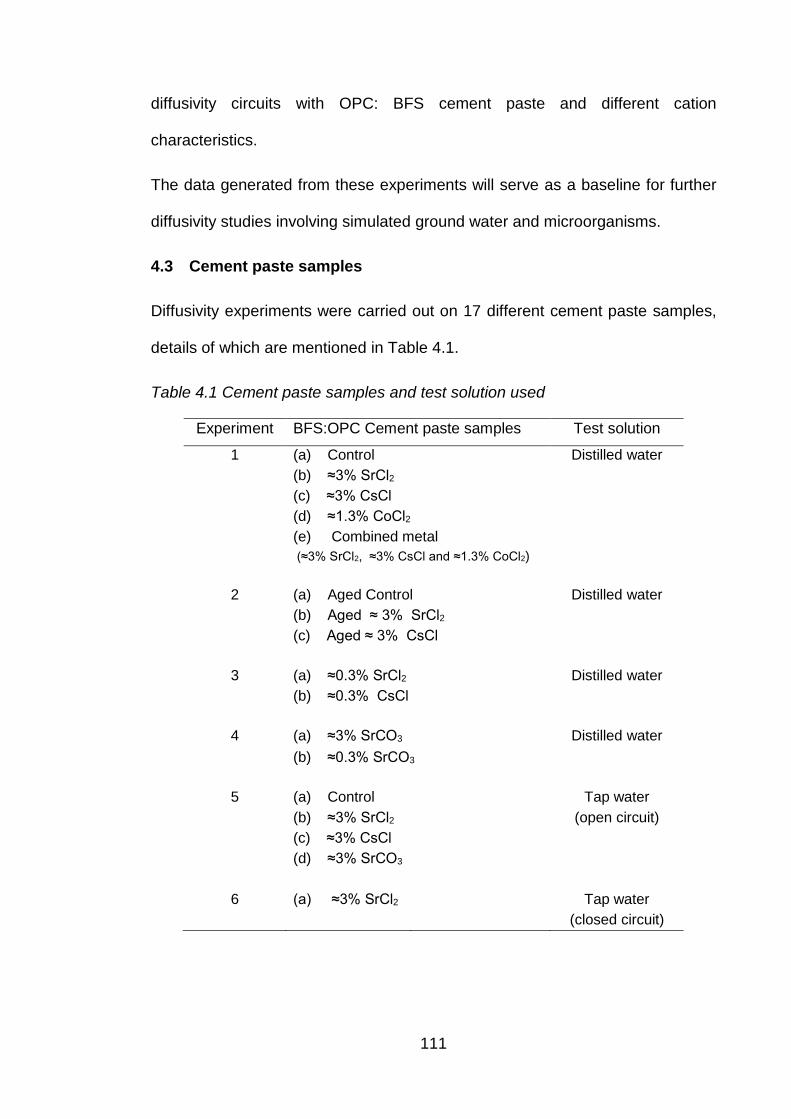
111
diffusivity circuits with OPC: BFS cement paste and different cation
characteristics.
The data generated from these experiments will serve as a baseline for further
diffusivity studies involving simulated ground water and microorganisms.
4.3 Cement paste samples
Diffusivity experiments were carried out on 17 different cement paste samples,
details of which are mentioned in Table 4.1.
Table 4.1 Cement paste samples and test solution used
Experiment BFS:OPC Cement paste samples Test solution
1 (a) Control Distilled water (b) ≈3% SrCl2 (c) ≈3% CsCl (d) ≈1.3% CoCl2 (e) Combined metal (≈3% SrCl2, ≈3% CsCl and ≈1.3% CoCl2)
2 (a) Aged Control Distilled water (b) Aged ≈ 3% SrCl2 (c) Aged ≈ 3% CsCl
3 (a) ≈0.3% SrCl2 Distilled water (b) ≈0.3% CsCl
4 (a) ≈3% SrCO3 Distilled water (b) ≈0.3% SrCO3
5 (a) Control Tap water (b) ≈3% SrCl2 (open circuit) (c) ≈3% CsCl
(d) ≈3% SrCO3
6 (a) ≈3% SrCl2 Tap water (closed circuit)
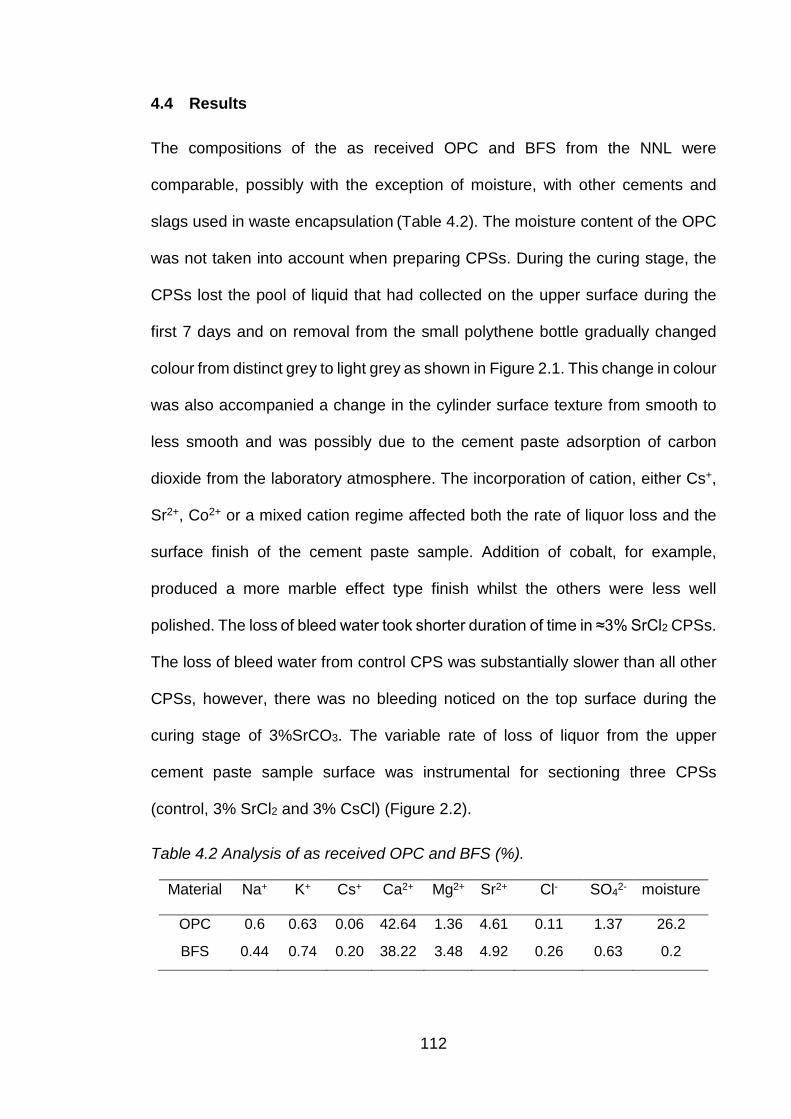
112
4.4 Results
The compositions of the as received OPC and BFS from the NNL were
comparable, possibly with the exception of moisture, with other cements and
slags used in waste encapsulation (Table 4.2). The moisture content of the OPC
was not taken into account when preparing CPSs. During the curing stage, the
CPSs lost the pool of liquid that had collected on the upper surface during the
first 7 days and on removal from the small polythene bottle gradually changed
colour from distinct grey to light grey as shown in Figure 2.1. This change in colour
was also accompanied a change in the cylinder surface texture from smooth to
less smooth and was possibly due to the cement paste adsorption of carbon
dioxide from the laboratory atmosphere. The incorporation of cation, either Cs+,
Sr2+, Co2+ or a mixed cation regime affected both the rate of liquor loss and the
surface finish of the cement paste sample. Addition of cobalt, for example,
produced a more marble effect type finish whilst the others were less well
polished. The loss of bleed water took shorter duration of time in ≈3% SrCl2 CPSs.
The loss of bleed water from control CPS was substantially slower than all other
CPSs, however, there was no bleeding noticed on the top surface during the
curing stage of 3%SrCO3. The variable rate of loss of liquor from the upper
cement paste sample surface was instrumental for sectioning three CPSs
(control, 3% SrCl2 and 3% CsCl) (Figure 2.2).
Table 4.2 Analysis of as received OPC and BFS (%).
Material Na+ K+ Cs+ Ca2+ Mg2+ Sr2+ Cl- SO42- moisture
OPC 0.6 0.63 0.06 42.64 1.36 4.61 0.11 1.37 26.2
BFS 0.44 0.74 0.20 38.22 3.48 4.92 0.26 0.63 0.2
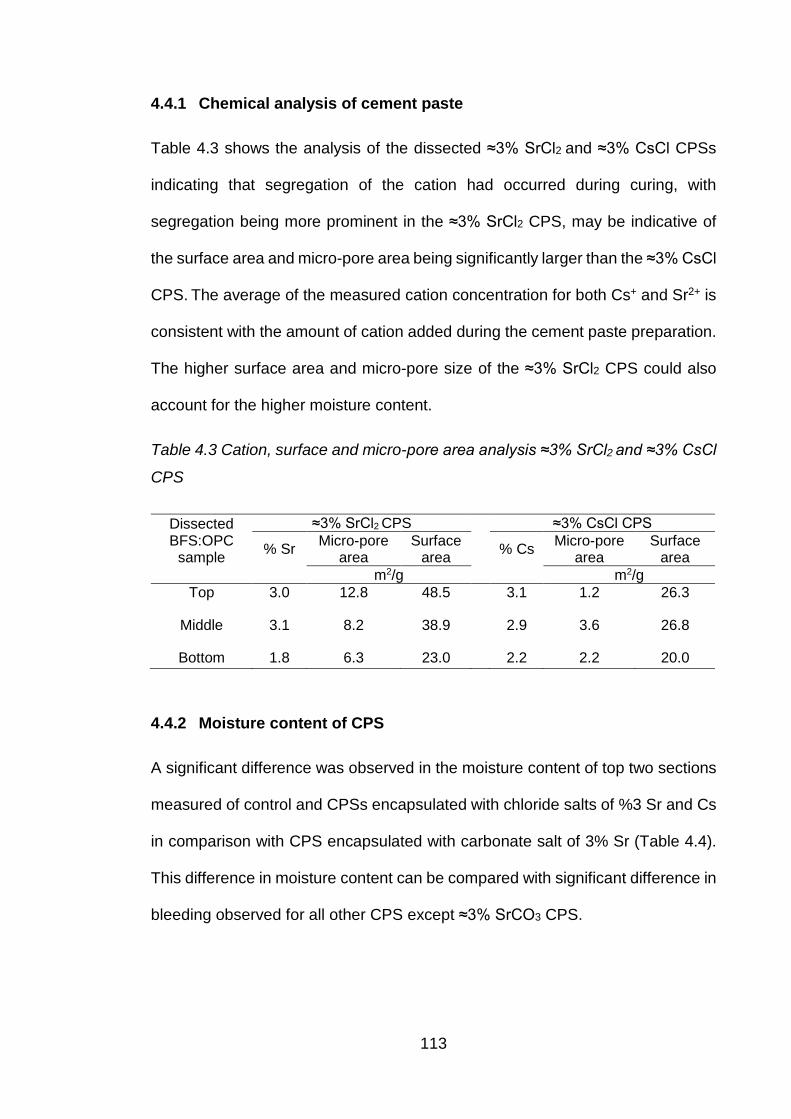
113
4.4.1 Chemical analysis of cement paste
Table 4.3 shows the analysis of the dissected ≈3% SrCl2 and ≈3% CsCl CPSs
indicating that segregation of the cation had occurred during curing, with
segregation being more prominent in the ≈3% SrCl2 CPS, may be indicative of
the surface area and micro-pore area being significantly larger than the ≈3% CsCl
CPS. The average of the measured cation concentration for both Cs+ and Sr2+ is
consistent with the amount of cation added during the cement paste preparation.
The higher surface area and micro-pore size of the ≈3% SrCl2 CPS could also
account for the higher moisture content.
Table 4.3 Cation, surface and micro-pore area analysis ≈3% SrCl2 and ≈3% CsCl
CPS
4.4.2 Moisture content of CPS
A significant difference was observed in the moisture content of top two sections
measured of control and CPSs encapsulated with chloride salts of %3 Sr and Cs
in comparison with CPS encapsulated with carbonate salt of 3% Sr (Table 4.4).
This difference in moisture content can be compared with significant difference in
bleeding observed for all other CPS except ≈3% SrCO3 CPS.
Dissected BFS:OPC
sample
≈3% SrCl2 CPS ≈3% CsCl CPS
% Sr Micro-pore area
Surface area % Cs Micro-pore
area Surface
area m2/g m2/g
Top 3.0 12.8 48.5 3.1 1.2 26.3
Middle 3.1 8.2 38.9 2.9 3.6 26.8
Bottom 1.8 6.3 23.0 2.2 2.2 20.0

114
Table 4.4 % moisture content of BFS:OPC CPS
Control ≈3% SrCl2
≈3% CsCl
≈1.3% CoCl2
combined metal
≈3% SrCO3
Top 16.6 26.6 21 20.1 27.3 5.9
Middle 13.4 22.5 22.7 23.6 17.9 5.2
Bottom 12.1 19 15.2 19.5 16.8 5.1
4.4.3 Average micropore and surface area micropore area analysis of
cement paste sample measured by BET method
The average micropore and surface area results of all the CPSs are shown in
Table 4.5. The values of micropore area of the CPSs prior to the diffusivity
experiments were in the range of 1.0 – 9.10 m2/g. The micropore area of the
CPSs containing strontium chloride were higher compared with the other CPSs.
Cement paste containing cobalt chloride had the lowest micro-pore area. Surface
area of the CPSs were in the range of 11.6 – 42.9 m2/g. The surface area of
control and ≈3% SrCl2 CPS were higher than Cs contaminated CPSs.

115
Table 4.5 Average micropore and surface area of cement paste samples
measured by BET method prior to diffusivity experiments
CPS Micropore area
Surface area
(m2/g) Control 5.2 42.9
≈ 3% SrCl2 9.1 36.8
≈ 3% CsCl 2.3 24.4
≈ 1.3% CoCl2 1.0 20.0
combined metal 7.3 36.6
Aged control 4.4 31.8
Aged ≈ 3% SrCl2 8.5 22.3
Aged ≈ 3% CsCl 1.4 13.1
≈ 0.3% CsCl 3.1 19.2
≈ 0.3% SrCl2 4.2 19.2
≈ 0.3% SrCO3 5.3 22.0
≈ 3% SrCO3 4.8 23.0
Control (open circuit) 2.7 24.2
≈ 3% SrCl2 (open circuit) 5.42 22.8
≈ 3% CsCl (open circuit) 1.3 11.6
≈ 3% SrCO3 (open circuit) 2.7 21.2
3% SrCl2 (tap water) 5.44 22.6
4.4.4 Test solution analysis
4.4.4.1 pH values
The pH values of the test solutions after the first few days of the diffusivity
experiments increased from about 7.0 (natural pH value of de-ionised water) to 9
- 13, except in the case of test solutions with strontium carbonate samples; this
increase is not unexpected as calcium salts will gradually diffuse from the cement.
After about 70 days the pH values for the Cs chloride and Sr carbonate
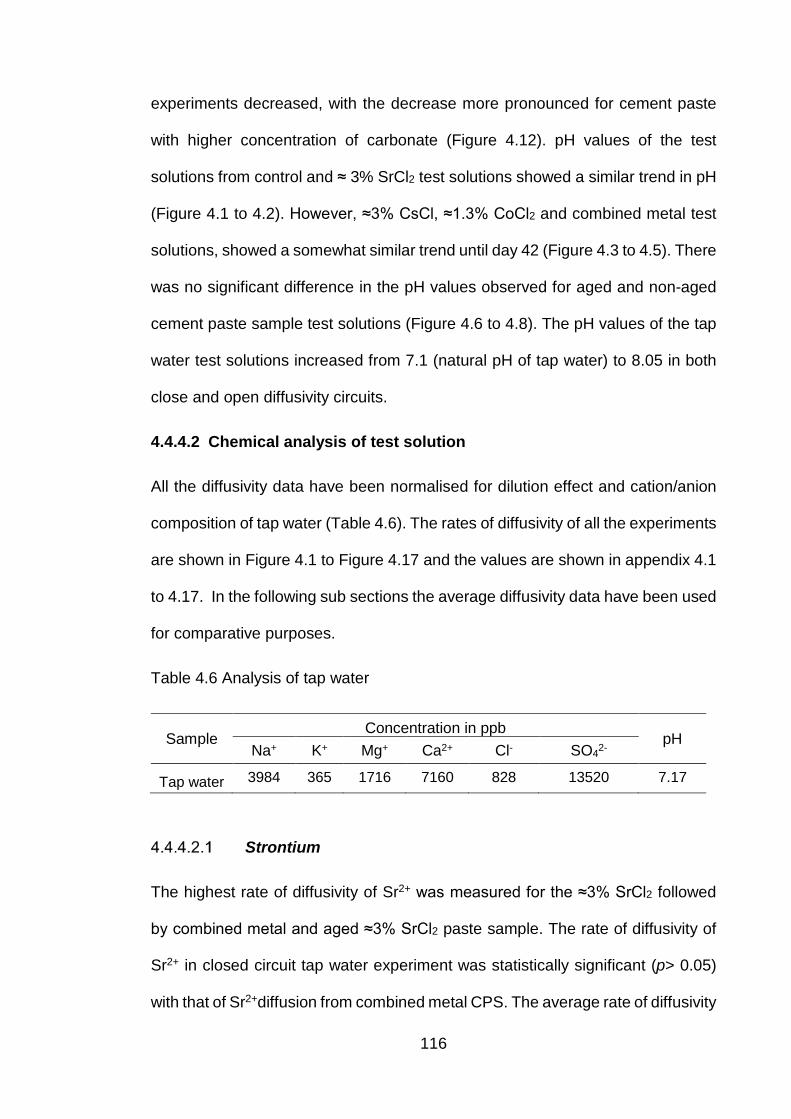
116
experiments decreased, with the decrease more pronounced for cement paste
with higher concentration of carbonate (Figure 4.12). pH values of the test
solutions from control and ≈ 3% SrCl2 test solutions showed a similar trend in pH
(Figure 4.1 to 4.2). However, ≈3% CsCl, ≈1.3% CoCl2 and combined metal test
solutions, showed a somewhat similar trend until day 42 (Figure 4.3 to 4.5). There
was no significant difference in the pH values observed for aged and non-aged
cement paste sample test solutions (Figure 4.6 to 4.8). The pH values of the tap
water test solutions increased from 7.1 (natural pH of tap water) to 8.05 in both
close and open diffusivity circuits.
4.4.4.2 Chemical analysis of test solution
All the diffusivity data have been normalised for dilution effect and cation/anion
composition of tap water (Table 4.6). The rates of diffusivity of all the experiments
are shown in Figure 4.1 to Figure 4.17 and the values are shown in appendix 4.1
to 4.17. In the following sub sections the average diffusivity data have been used
for comparative purposes.
Table 4.6 Analysis of tap water
Sample Concentration in ppb
pH Na+ K+ Mg+ Ca2+ Cl- SO42-
Tap water 3984 365 1716 7160 828 13520 7.17
Strontium
The highest rate of diffusivity of Sr2+ was measured for the ≈3% SrCl2 followed
by combined metal and aged ≈3% SrCl2 paste sample. The rate of diffusivity of
Sr2+ in closed circuit tap water experiment was statistically significant (p> 0.05)
with that of Sr2+diffusion from combined metal CPS. The average rate of diffusivity
117
from aged ≈3% SrCl2 (6.5 µg/cm2/day) CPS was half the average rate of diffusivity
of Sr from non-aged ≈3% SrCl2 CPS (14 µg/cm2/day). Strontium from ≈3% SrCO3
CPS (0.026 µg/cm2/day) diffused out at significantly slower in comparison with
≈3% SrCl2 CPS (6.5 µg/cm2/day). However, the rates of diffusivity of Sr2+ from
≈3% SrCO3 and ≈ 0.3% SrCO3 showed a similar trend in diffusivity and were
similar to the rates of diffusivity of Sr2+ from control sample. The average rates
of diffusivity of Sr2+ from ≈0.3% SrCl2 (0.26 µg/cm2/day) was 76 times lower than
its 3% counterpart. The results obtained from open circuit diffusivity experiment
confirmed the trend of Sr2+ diffusivity found in the closed circuit diffusivity
experiments. Strontium from ≈3% SrCl2 paste sample diffused out faster than the
Sr2+ from ≈3% SrCO3 CPS.
Caesium
The rate of diffusivity of Cs+ from non-aged ≈3% CsCl CPS was faster and
significantly similar (p>0.05) to the Cs+ diffusivity from combined metal CPS. The
average rate of diffusivity of Cs+ from aged ≈3% CsCl CPS (8.4 µg/cm2/day) was
measured 2.6 times lower than the average rate of diffusivity of Cs+ from non-
aged ≈3% CsCl CPS (22 µg/cm2/day). Caesium from ≈0.3% CsCl CPS (1.5
µg/cm2/day) diffused out ≈12 times slower than the rate of diffusivity of Cs+ from
≈3% CsCl CPS (17.8 µg/cm2/day). This confirms that the rate of diffusivity
depends on the concentration of the cation added to the cement paste sample.
The diffusivity rate of Cs+ was found to be 2 to 6 times higher than Sr2+ from all
the CPSs.

118
Cobalt
The rate of diffusivity of Co2+ from ≈1.3% CoCl2 was found lowest of all the cations
from CPS. The sequence of diffusivities of the added cation were shown as Cs+
> Sr2+> Co2+ from individual CPS as well as from combined metal CPS.
Calcium
The diffusivity of Ca2+ from ≈3% SrCl2 and ≈1.3% CoCl2 CPS was similar (p>0.05)
and measured as 5 times higher than the control CPS. Calcium from combined
metal CPS (14 µg/cm2/day) and aged ≈3% SrCl2 CPS (15 µg/cm2/day) diffused
out at the similar rate; was measured 3 times higher than the rate of diffusivity of
Ca2+ from non-aged control CPS (5 µg/cm2/day). The average rate of diffusivity
of Ca2+ from ≈3% CsCl CPS (0.4 µg/cm2/day) was 12 times lower than the non-
aged control CPS (5 µg/cm2/day) and was found to be lowest of all the samples.
However, the diffusion of Ca2+ from aged ≈3% CsCl CPS (8 µg/cm2/day) was
found to be 20 times higher than non- aged ≈3% CsCl CPS (0.4 µg/cm2/day) and
≈6 times higher from 0.3% CsCl (3.2 µg/cm2/day) compared to non-aged ≈3%
CsCl (17.8 µg/cm2/day for 105 days). The average rate of diffusivity of Ca2+ from
≈0.3% SrCl2 (6.1 µg/cm2/day) was measured 4.5 times lower than the average
rate of diffusivity of Ca2+ from its 3% counterpart (27.5 µg/cm2/day for 105 days).
Calcium from ≈3% SrCO3 CPS diffused out at faster rate in comparison with
≈0.3% SrCO3 CPS. The diffusion of Ca2+ from the CPS in the open circuit
experiment showed the similar pattern of diffusivity in comparison with close
circuit experiment with higher rate of Ca2+ diffusivity from ≈3% SrCl2 (1.9
µg/cm2/day) compared to ≈3% CsCl CPS (0.8 µg/cm2/day). However, the rate of
diffusivity of Ca2+ from ≈3% SrCO3 (0.01 µg/cm2/day) was found to be lowest in
contrast with closed circuit experiment.
119
There was no significant difference (p>0.05) observed between the Ca2+
diffusivity from ≈3% SrCl2 in DW (65 µg/cm2/day) and in closed circuit tap water
(50.8 µg/cm2/day).
Sodium
The rates of diffusivity of Na+ from non-aged control, ≈1.3% CoCl2 and ≈3% SrCl2
CPSs were fairly in similar range (3.8 – 4.8 µg/cm2/day). The lowest rate of
diffusivity was seen in the test solution of ≈3% CsCl CPS (1.3 µg/cm2/day) and
combined metal CPS (1.1 µg/cm2/day). Sodium diffused out at higher rate from
≈0.3% SrCl2 and ≈0.3% CsCl CPSs. Sodium from ≈3% CsCl CPS (1.2
µg/cm2/day) diffused out 7 times slower in comparison with ≈0.3% CsCl CPS (8.8
µg/cm2/day). However, there was no significant difference (p>0.05) in the rate of
diffusivity of Na+ observed between ≈3% SrCl2 and ≈0.3% SrCl2 CPS. In the case
of aged sample, the average rate of diffusivity of Na+ from ≈3% CsCl CPS (2.7
µg/cm2/day) was two times higher than non-aged ≈3% CsCl CPS (1.3
µg/cm2/day). However, sodium from aged and non-aged ≈3% SrCl2 CPS diffused
at relatively similar rates (p>0.05). The rate of diffusivity of Na+ from ≈3% SrCO3
and ≈0.3% SrCO3 CPS showed a similar trend of diffusivity (p>0.05). There was
no significant difference in the diffusivity of Na+ observed in open circuit
experiment from all the CPSs. The rate of diffusivity of Na+ from ≈3% SrCl2 CPS
in DW and close tap water experiment was found to be similar (p>0.05).
Chloride
Chloride from combined cation CPS diffused (270 µg/cm2/day) out higher than
the rest of the CPSs. This is attributed to the concentration effect, the
concentration of Cl- in combined metal CPS (101 mmoles) was higher than all

120
other CPS, however, significantly similar to Cl- concentration from ≈3% SrCl2
(58.3 mmoles) (Table 4.7). The diffusivity of Cl- from strontium encapsulated
CPSs was higher than caesium encapsulated CPSs. The average rate chloride
diffusivity from aged ≈3% CsCl (19 µg/cm2/day) was measured ≈4 times higher
than non-aged ≈3% CsCl CPS. The rate of diffusivity of Cl- from ≈3% CoCl2 (60
µg/cm2/day), non- aged ≈3% SrCl2 (57 µg/cm2/day), and aged ≈3% SrCl2 (63
µg/cm2/day), was found to be in similar range having similar trend of diffusivity.
Chloride from ≈0.3% SrCl2 (24 µg/cm2/day) diffused out 3.5 times slower than the
diffusivity of Cl- from their ≈3% SrCl2 (82.7µg/cm2/day). The results obtained from
open circuit diffusivity experiment are in agreement with the closed circuit
diffusivity. The average rate of diffusivity of Cl- from control (3 µg/cm2/day) and ≈
3% SrCO3 (3 µg/cm2/day) was found to be lowest and significantly similar,
indicating that the Cl- diffusion is due to added cation chloride. The average rate
of diffusivity of Cl- from ≈3% SrCl2 in closed circuit tap water (468 µg/cm2/day)
was 3 times higher than average rate of diffusivity of Cl- from ≈3% SrCl2 CPS
(153.5 µg/cm2/day) in DW.
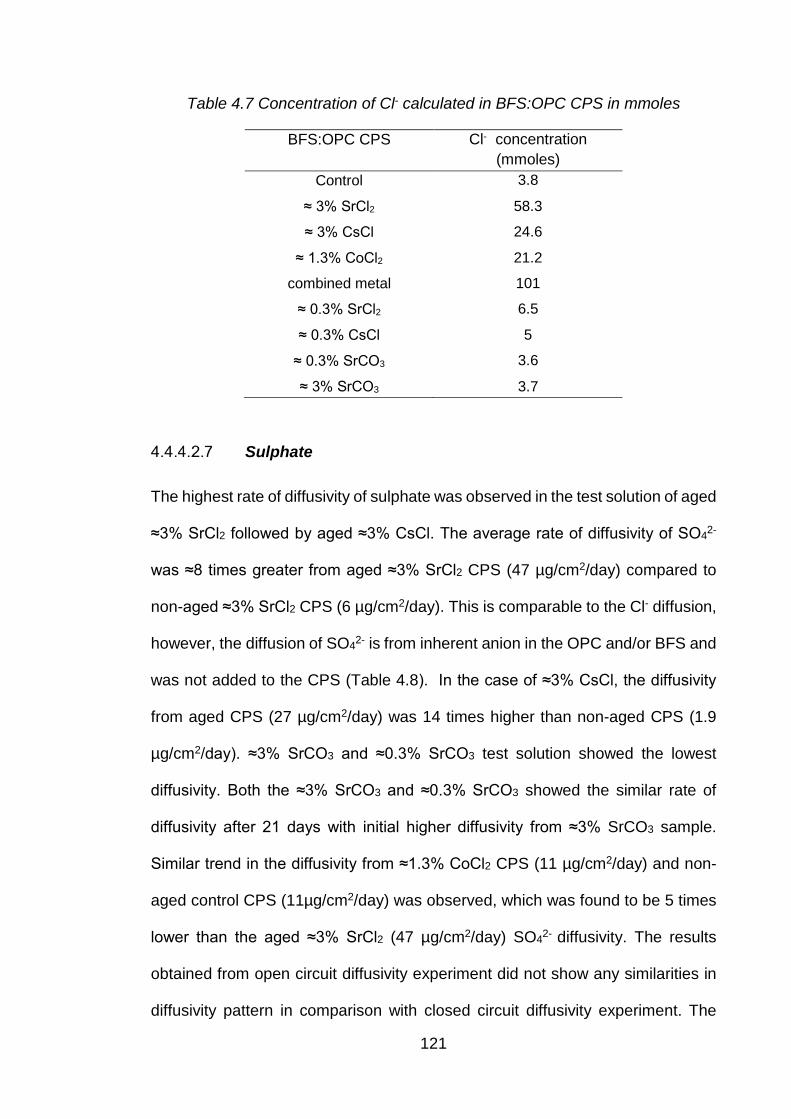
121
Table 4.7 Concentration of Cl- calculated in BFS:OPC CPS in mmoles
BFS:OPC CPS Cl- concentration (mmoles)
Control 3.8
≈ 3% SrCl2 58.3
≈ 3% CsCl 24.6
≈ 1.3% CoCl2 21.2
combined metal 101
≈ 0.3% SrCl2 6.5
≈ 0.3% CsCl 5
≈ 0.3% SrCO3 3.6
≈ 3% SrCO3 3.7
Sulphate
The highest rate of diffusivity of sulphate was observed in the test solution of aged
≈3% SrCl2 followed by aged ≈3% CsCl. The average rate of diffusivity of SO42-
was ≈8 times greater from aged ≈3% SrCl2 CPS (47 µg/cm2/day) compared to
non-aged ≈3% SrCl2 CPS (6 µg/cm2/day). This is comparable to the Cl- diffusion,
however, the diffusion of SO42- is from inherent anion in the OPC and/or BFS and
was not added to the CPS (Table 4.8). In the case of ≈3% CsCl, the diffusivity
from aged CPS (27 µg/cm2/day) was 14 times higher than non-aged CPS (1.9
µg/cm2/day). ≈3% SrCO3 and ≈0.3% SrCO3 test solution showed the lowest
diffusivity. Both the ≈3% SrCO3 and ≈0.3% SrCO3 showed the similar rate of
diffusivity after 21 days with initial higher diffusivity from ≈3% SrCO3 sample.
Similar trend in the diffusivity from ≈1.3% CoCl2 CPS (11 µg/cm2/day) and non-
aged control CPS (11µg/cm2/day) was observed, which was found to be 5 times
lower than the aged ≈3% SrCl2 (47 µg/cm2/day) SO42- diffusivity. The results
obtained from open circuit diffusivity experiment did not show any similarities in
diffusivity pattern in comparison with closed circuit diffusivity experiment. The
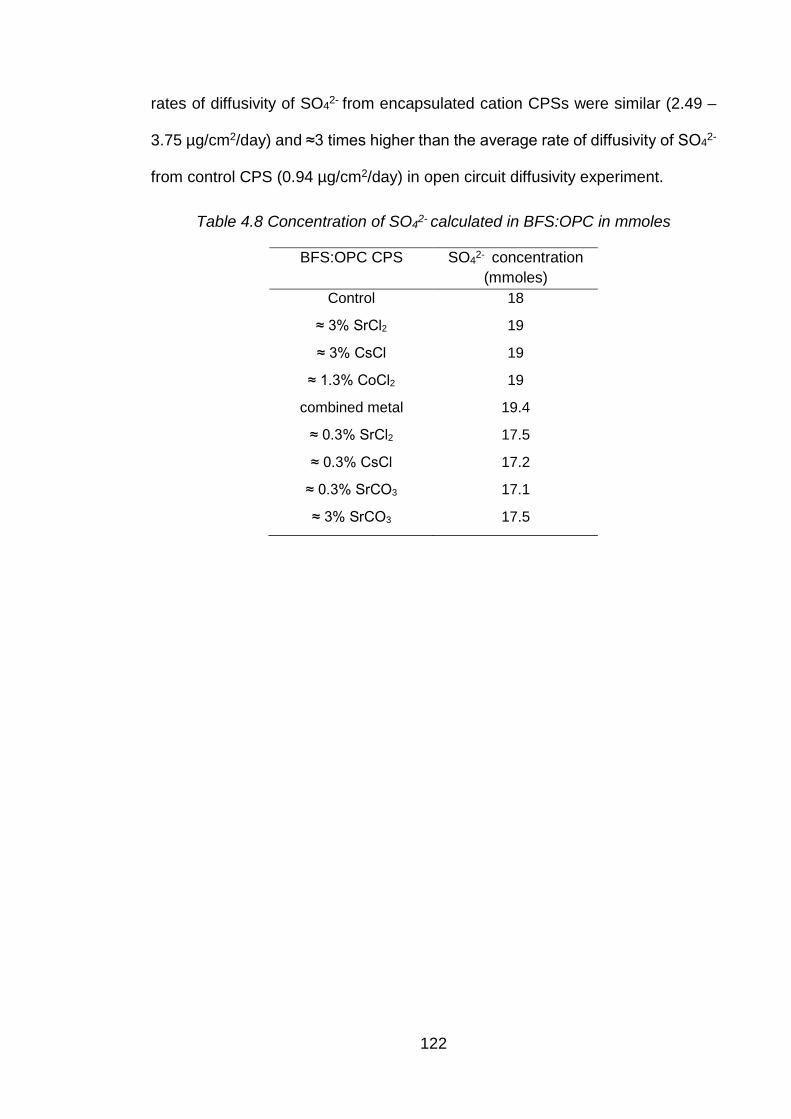
122
rates of diffusivity of SO42- from encapsulated cation CPSs were similar (2.49 –
3.75 µg/cm2/day) and ≈3 times higher than the average rate of diffusivity of SO42-
from control CPS (0.94 µg/cm2/day) in open circuit diffusivity experiment.
Table 4.8 Concentration of SO42- calculated in BFS:OPC in mmoles
BFS:OPC CPS SO42- concentration (mmoles)
Control 18
≈ 3% SrCl2 19
≈ 3% CsCl 19
≈ 1.3% CoCl2 19
combined metal 19.4
≈ 0.3% SrCl2 17.5
≈ 0.3% CsCl 17.2
≈ 0.3% SrCO3 17.1
≈ 3% SrCO3 17.5

123
4.5 Conclusions
1 The make-up water composition affected the segregation of
inherent/added cations in the cement paste samples.
2 Initial pH values for all samples except ≈3% SrCO3 were in the range 9 to
13; the addition of strontium carbonate could be akin to adsorption of CO2
i.e. carbonation.
3 The rate of decrease in the pH value could be a function of the cement
chemistry occurring within the paste sample.
4 The rate of carbonation was insufficient to affect pH trends, but in some
cases was sufficient to affect rate of diffusivity.
5 Strontium when added as a soluble salt to the make-up water influences
the rate of diffusivity.
6 The concentration of the added salt to the make-up water also affects
diffusivity.
7 The addition of cation salts to the make-up water affected the rate of
diffusion of calcium ions from the cement paste samples and may not be
influenced by the concentration of added salt.
8 Diffusivity of chloride ions from the cement paste samples is dependent on
the concentration of chloride in the make-up water.
9 Aging of the cement paste samples influenced the diffusivity rate of
sulphate.
10 More dilute make-up water i.e. ≈0.3% cation concentration had a greater
effect on diffusivity of sodium than more concentrated make-up water.

124
11 Aging of the cement paste sample had little effect on sodium diffusivity.
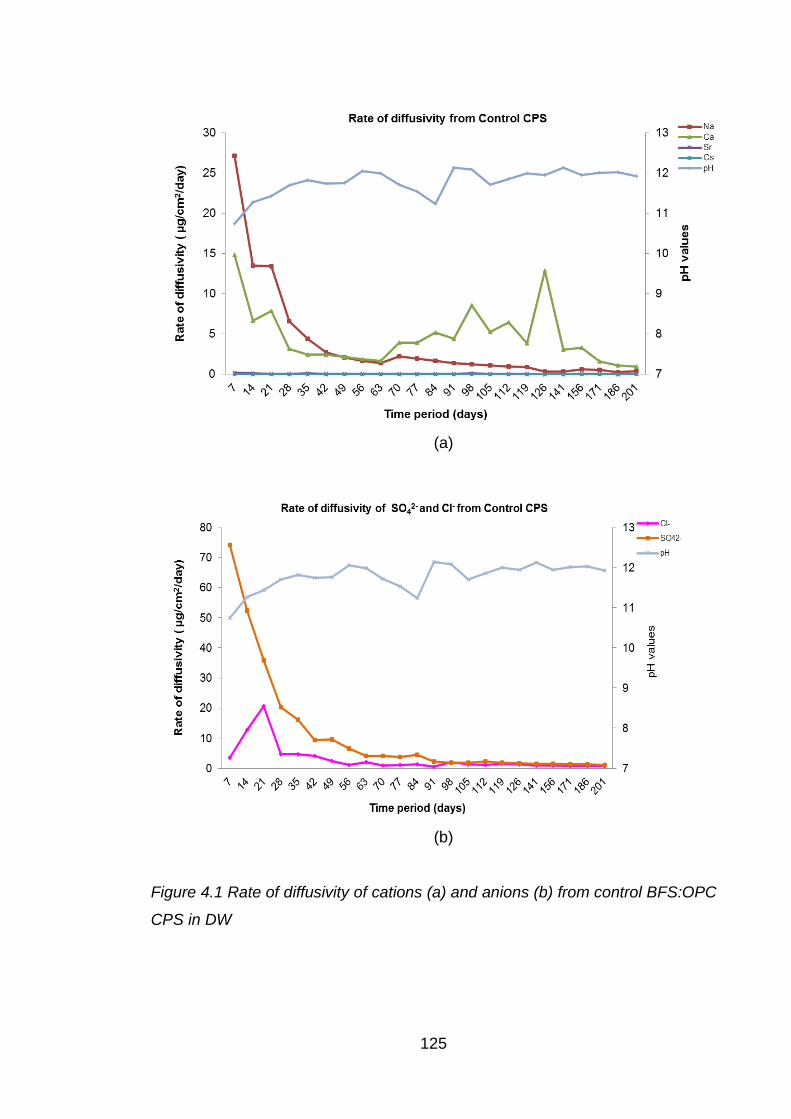
125
(a)
(b)
Figure 4.1 Rate of diffusivity of cations (a) and anions (b) from control BFS:OPC
CPS in DW

126
(a)
(b)
Figure 4.2 Rate of diffusivity of cations (a) anions (b) from ≈3% SrCl2 BFS:OPC
CPS in DW

127
(a)
(b)
Figure 4.3 Rate of diffusivity of cations (a) and anions (b) from ≈3% CsCl
BFS:OPC CPS in DW

128
(a)
(b)

129
(c)
Figure 4.4 Rate of diffusivity of cations (a) Co2+ (b) and anions (c) from ≈1.27 %
CoCl2 BFS:OPC CPS in DW
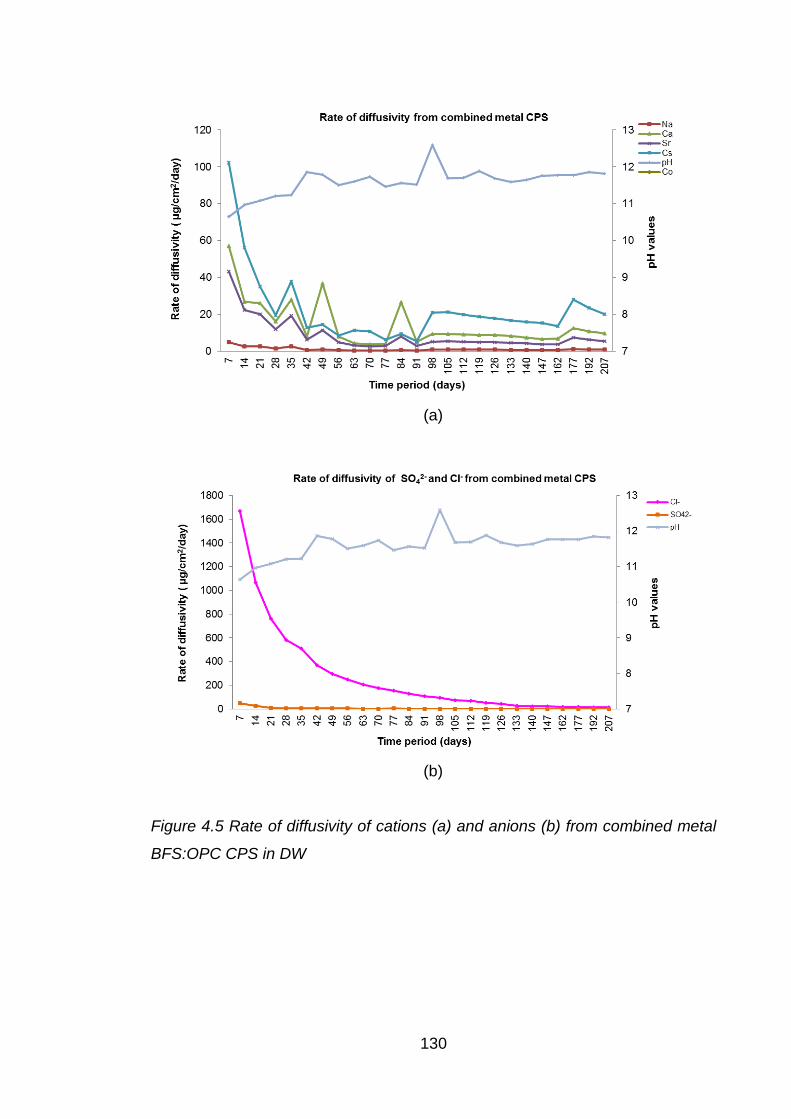
130
(a)
(b)
Figure 4.5 Rate of diffusivity of cations (a) and anions (b) from combined metal
BFS:OPC CPS in DW

131
(a)
(b)
Figure 4.6 Rate of diffusivity of cations (a) and anions (b) from aged control
BFS:OPC CPS in DW
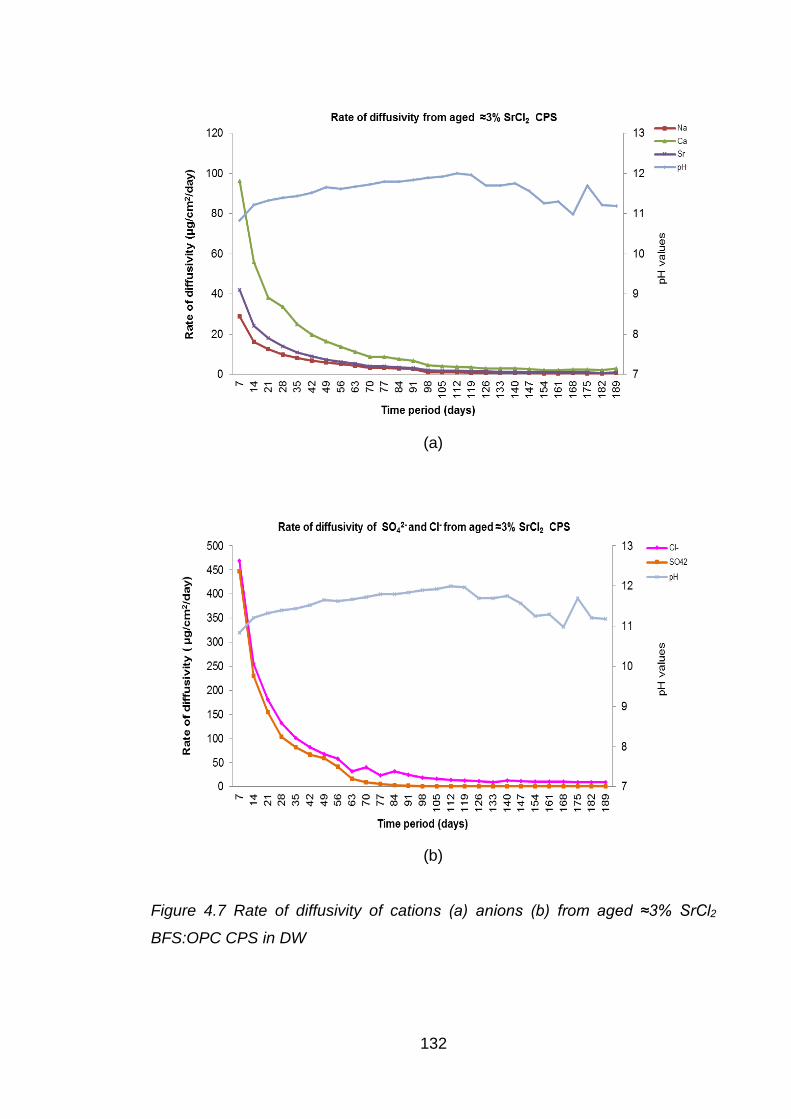
132
(a)
(b)
Figure 4.7 Rate of diffusivity of cations (a) anions (b) from aged ≈3% SrCl2
BFS:OPC CPS in DW
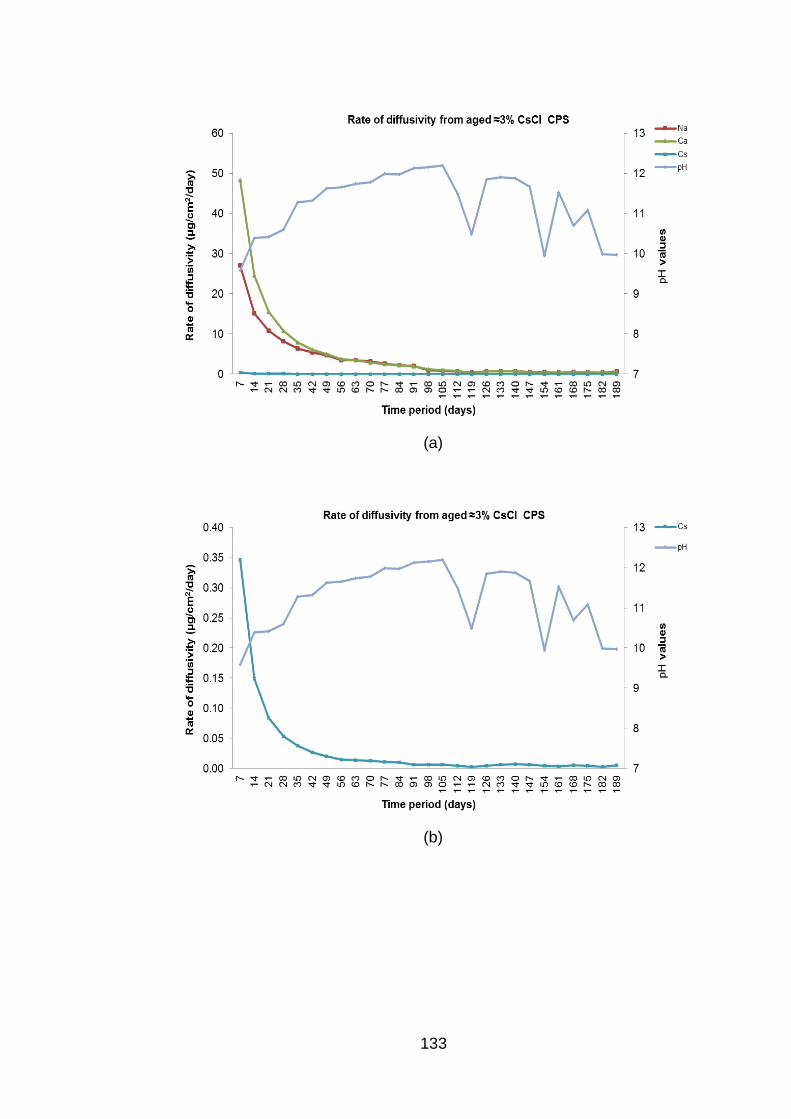
133
(a)
(b)

134
(c)
Figure 4.8 Rate of diffusivity of cations (a) Cs+ (b) and anions (c) from aged ≈3%
CsCl2 BFS:OPC CPS in DW
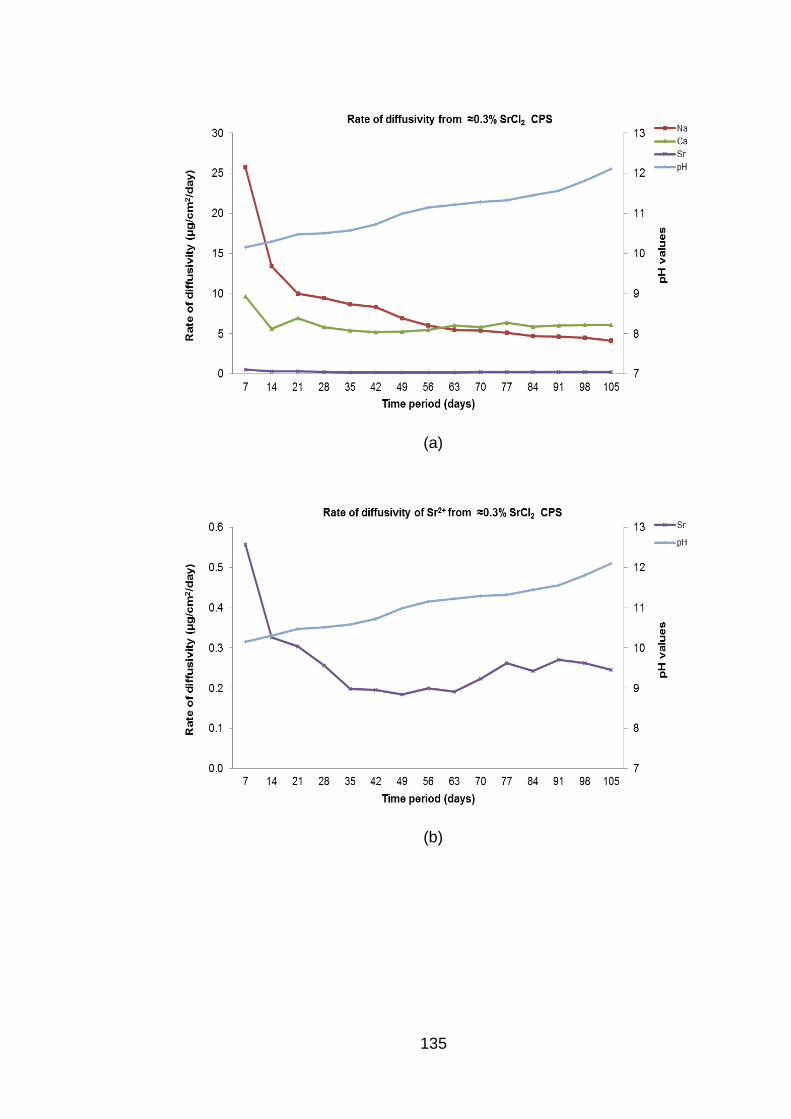
135
(a)
(b)
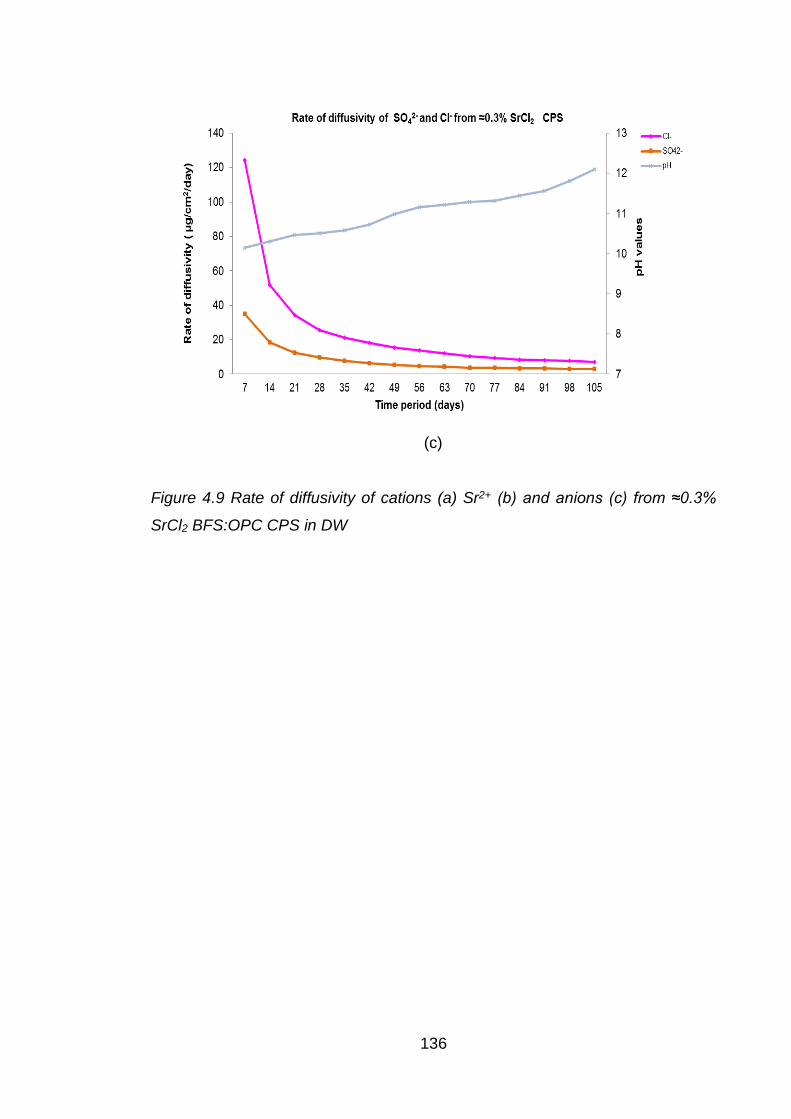
136
(c)
Figure 4.9 Rate of diffusivity of cations (a) Sr2+ (b) and anions (c) from ≈0.3%
SrCl2 BFS:OPC CPS in DW
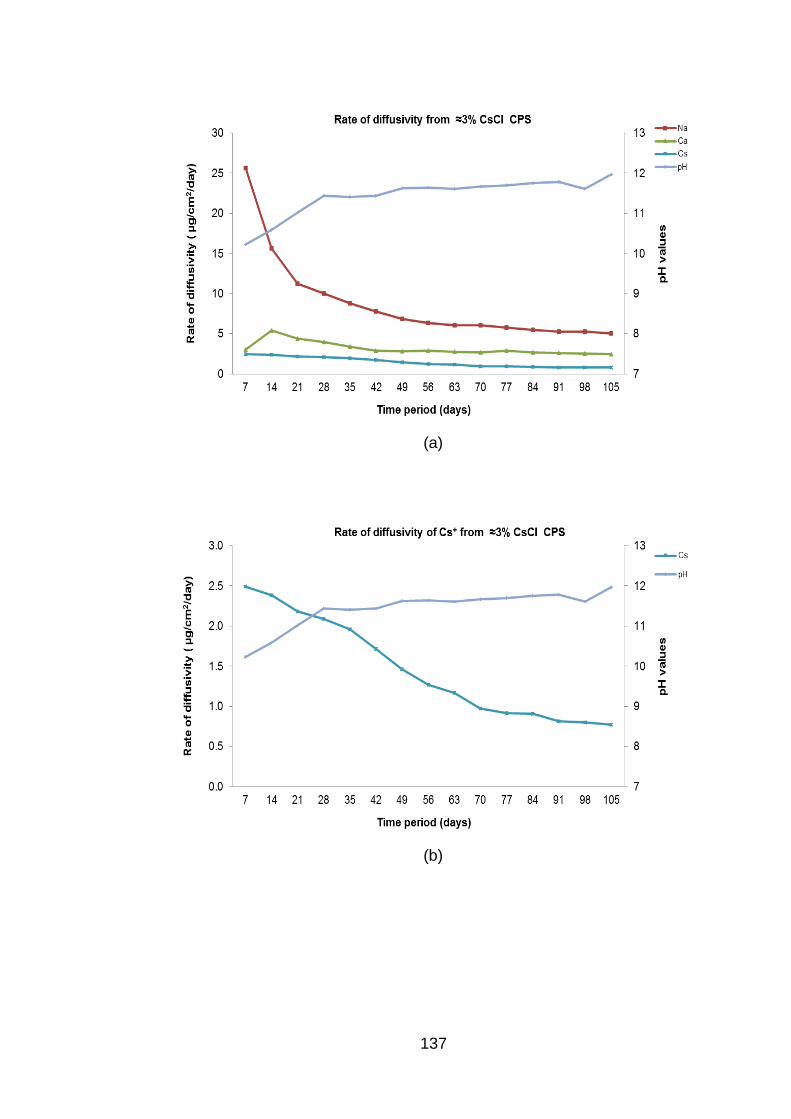
137
(a)
(b)
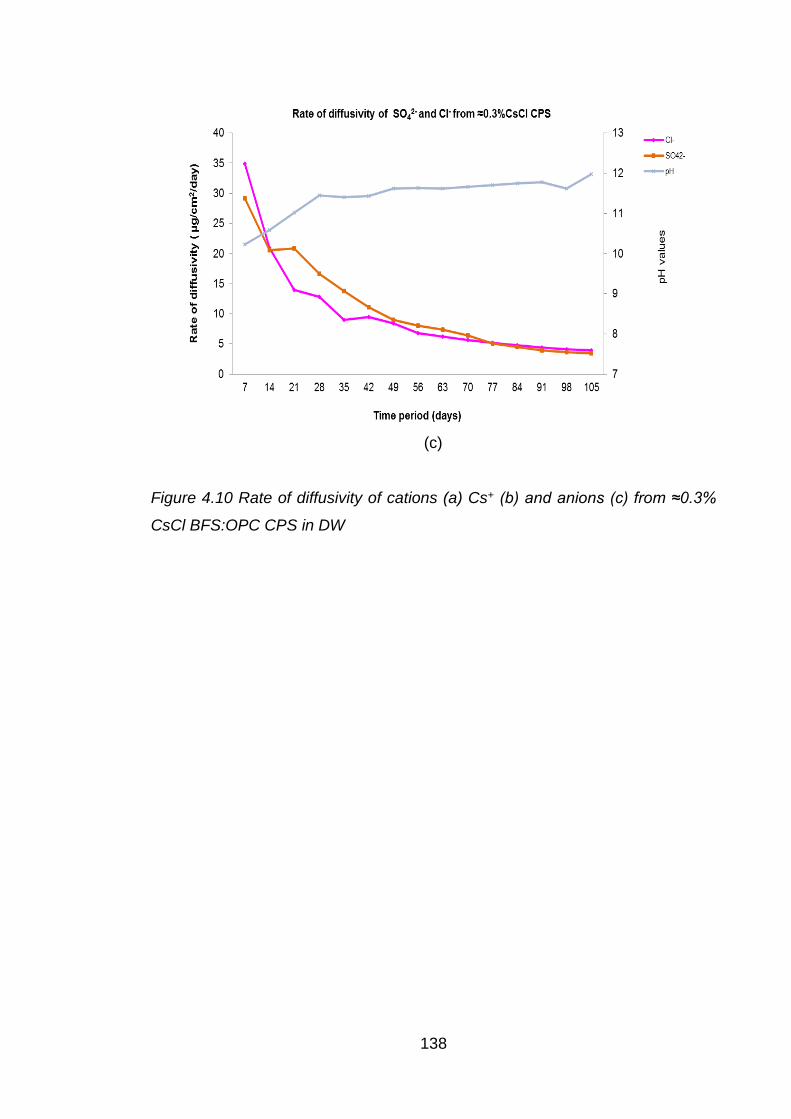
138
(c)
Figure 4.10 Rate of diffusivity of cations (a) Cs+ (b) and anions (c) from ≈0.3%
CsCl BFS:OPC CPS in DW

139
(a)
(b)
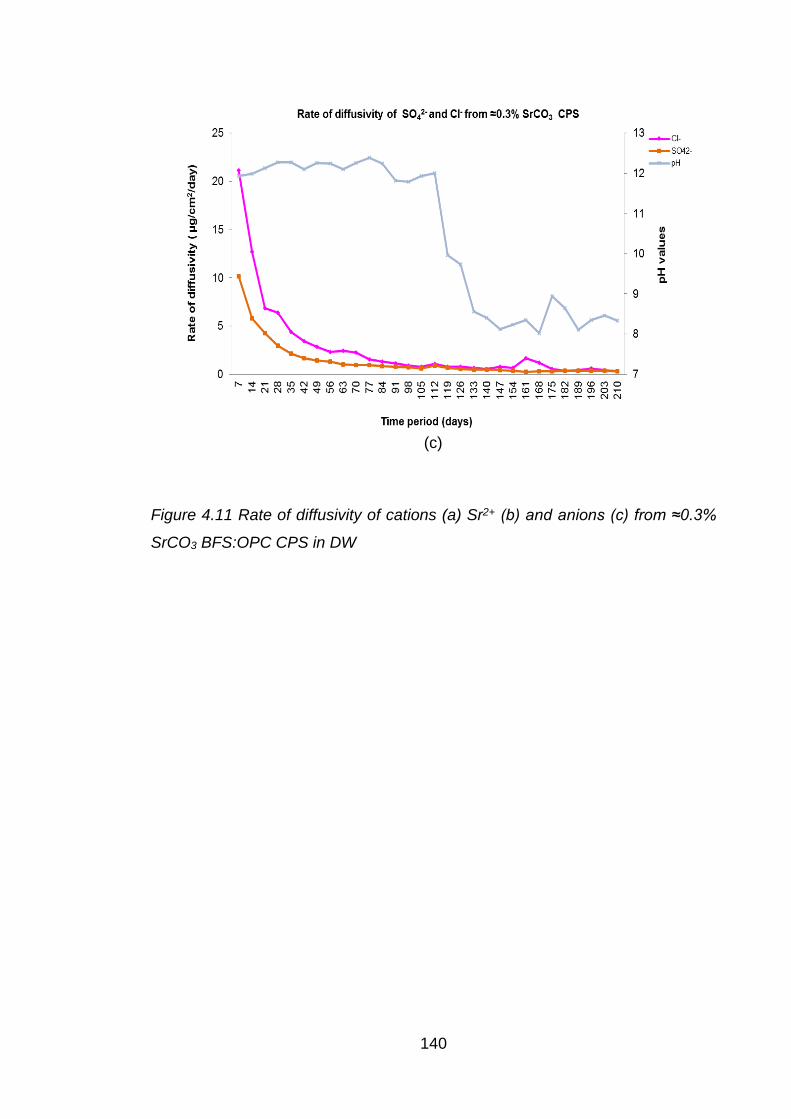
140
(c)
Figure 4.11 Rate of diffusivity of cations (a) Sr2+ (b) and anions (c) from ≈0.3%
SrCO3 BFS:OPC CPS in DW

141
(a)
(b)
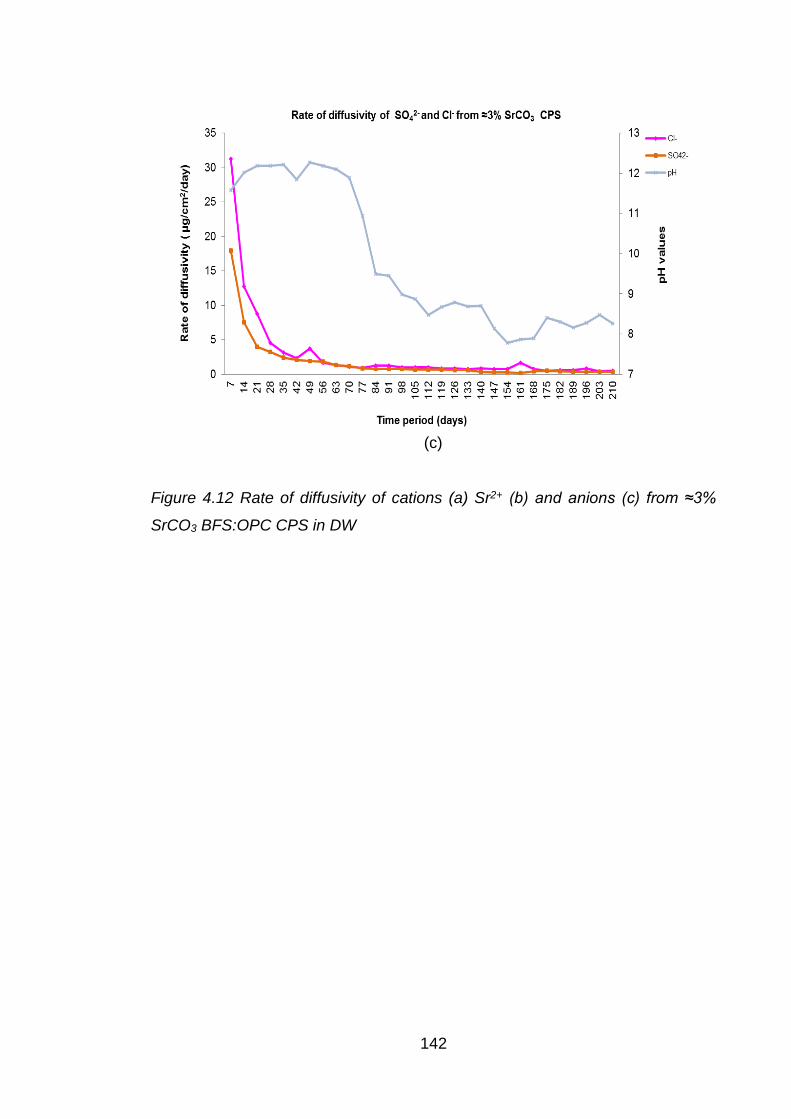
142
(c)
Figure 4.12 Rate of diffusivity of cations (a) Sr2+ (b) and anions (c) from ≈3%
SrCO3 BFS:OPC CPS in DW

143
(a)
(b)
Figure 4.13 Rate of diffusivity of cations (a) and anions (b) from control BFS:OPC
CPS in tap water (open circuit)
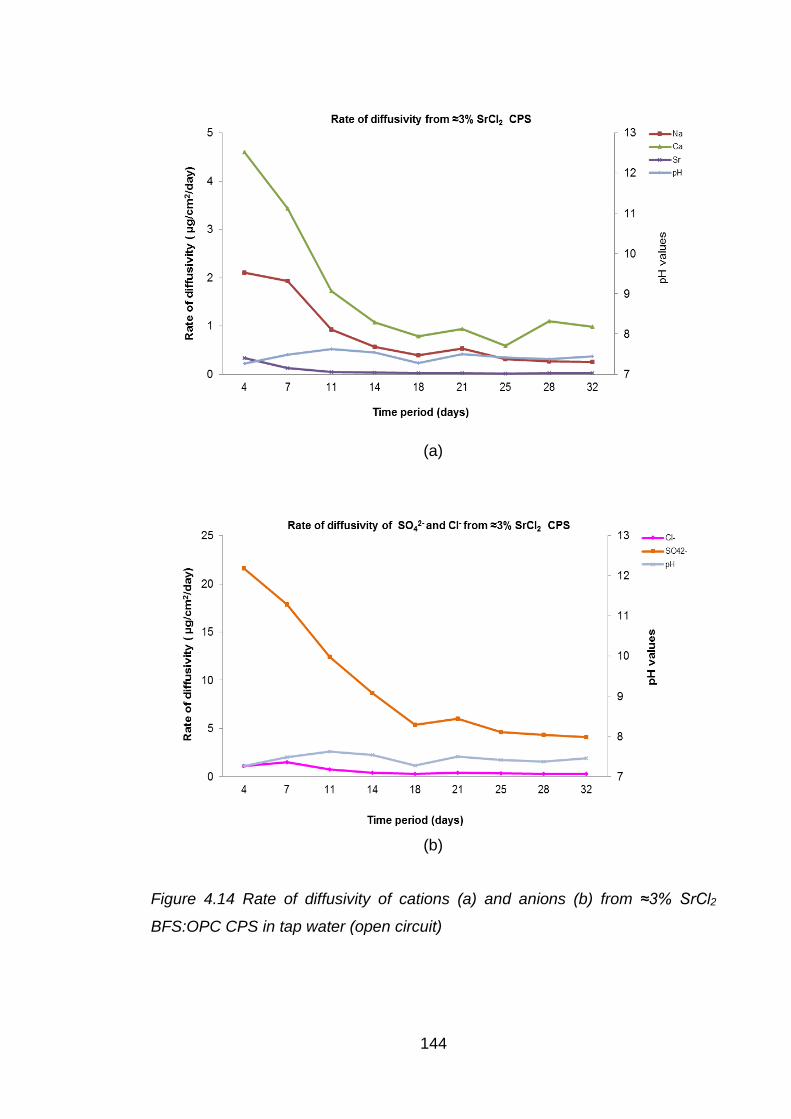
144
(a)
(b)
Figure 4.14 Rate of diffusivity of cations (a) and anions (b) from ≈3% SrCl2
BFS:OPC CPS in tap water (open circuit)

145
(a)
(b)
Figure 4.15 Rate of diffusivity of cations (a) and anions (b) from ≈3% CsCl
BFS:OPC CPS in tap water (open circuit)
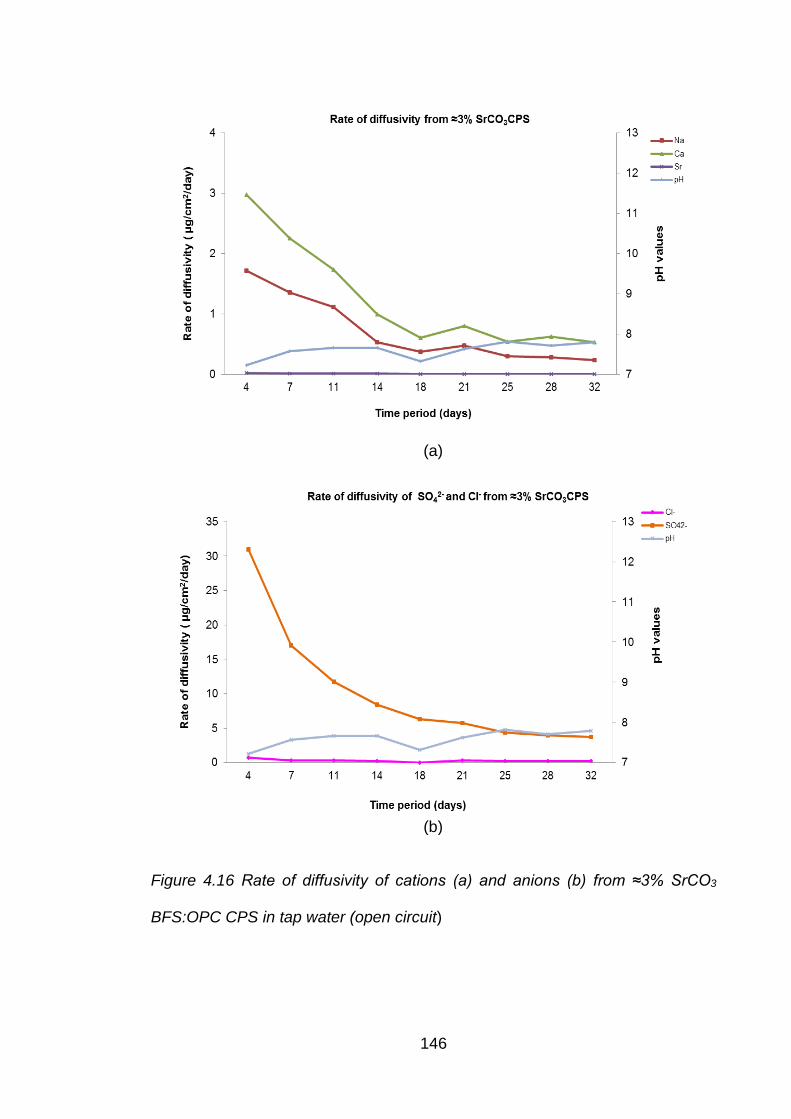
146
(a)
(b)
Figure 4.16 Rate of diffusivity of cations (a) and anions (b) from ≈3% SrCO3
BFS:OPC CPS in tap water (open circuit)

147
(a)
(b)
Figure 4.17 Rate of diffusivity of cations (a) and anions (b) from ≈3% SrCl2
BFS:OPC CPS in tap water (closed circuit)

Chapter 5: Diffusivity from PFA:OPC CPSs with distilled water as a test solution

148
5.1 Aims of study
To evaluate the influence of concentration and nature of encapsulated cations in
(PFA:OPC) formulations on their diffusivity when in contact with distilled water.
5.2 Introduction
Pulverised fuel ash (PFA) is another additive which is often used in formation of
cement paste in nuclear waste encapsulation [210]. In this chapter, a series of
closed and open circuit diffusivity experiments (section 2.4) have been carried
out on PFA:OPC CPSs encapsulating caesium when added as chloride salt and
strontium when added as chloride and carbonate salt (Table 5.1). The main
purpose for carrying out these experiments was to confirm that the diffusivity of
the encapsulated cations is dependent on their concentration and also to
compare the rate of diffusivity between and BFS: OPC cement paste samples.
The preparation of PFA: OPC CPSs and the formulation were kept identical with
that of BFS:OPC CPS preparation (Table 2.1). Dynamic diffusivity tests were
initiated 90 days after curing the PFA:OPC cement paste samples in the
laboratory atmosphere. The experimental set-up consisted of two sets of
diffusivity experiments with distilled water (Table 5.1) and one set consisted of
tap water as a test solution for comparative purposes. Tap water was selected
for the ‘open’ diffusivity experiments. Each experiment consisted of two to four
sets of closed circulating diffusivity circuits with PFA:OPC cement paste and
different cation characteristics.
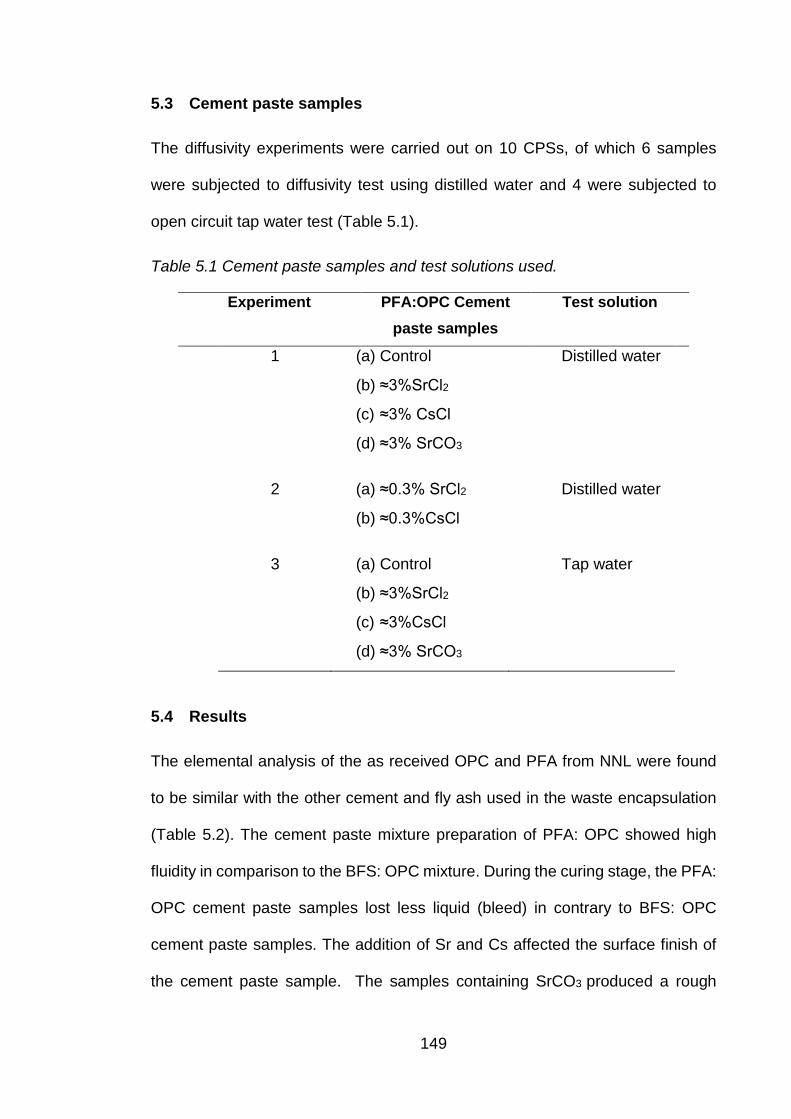
149
5.3 Cement paste samples
The diffusivity experiments were carried out on 10 CPSs, of which 6 samples
were subjected to diffusivity test using distilled water and 4 were subjected to
open circuit tap water test (Table 5.1).
Table 5.1 Cement paste samples and test solutions used.
Experiment PFA:OPC Cement paste samples
Test solution
1 (a) Control
(b) ≈3%SrCl2
(c) ≈3% CsCl
(d) ≈3% SrCO3
Distilled water
2 (a) ≈0.3% SrCl2
(b) ≈0.3%CsCl
Distilled water
3 (a) Control
(b) ≈3%SrCl2
(c) ≈3%CsCl
(d) ≈3% SrCO3
Tap water
5.4 Results
The elemental analysis of the as received OPC and PFA from NNL were found
to be similar with the other cement and fly ash used in the waste encapsulation
(Table 5.2). The cement paste mixture preparation of PFA: OPC showed high
fluidity in comparison to the BFS: OPC mixture. During the curing stage, the PFA:
OPC cement paste samples lost less liquid (bleed) in contrary to BFS: OPC
cement paste samples. The addition of Sr and Cs affected the surface finish of
the cement paste sample. The samples containing SrCO3 produced a rough

150
finish compared to the samples containing SrCl2. Both the control and samples
containing CsCl produced similar finish, which was less rough than the Sr
containing cement paste samples.
Table 5.2 Analysis of as received OPC and PFA (%).
Material Na+ K+ Cs+ Ca2+ Mg2+ Sr2+ Cl- SO42- moisture
OPC 0.6 0.63 0.06 42.64 1.36 4.61 0.11 1.37 26.2
PFA 1.10 2.00 0.06 1.30 0.89 4.50 not quoted
not quoted
0.1
5.4.1 Chemical analysis of cement paste sample
As previously reported, the chemical analysis of the dissected BFS: OPC CPSs
showed segregation of the cation; although the average of the measured cation
concentrations was approximately the same as the amount of cation added
during the cement paste preparation. It is more than likely that the segregation
will take place even in PFA:OPC cement paste samples, this may be inferred
from the micro-pore and surface area values reported in Table 5.4. Based on this
assumption it was decided that chemical analysis of PFA:OPC cement paste
samples were not warranted as diffusivity rates could be similar from the
cylindrical sample for all three sections i.e. top, middle and bottom i.e. the
variation in concentration was not that significant.
5.4.2 Moisture content of CPS
The moisture content of PFA:OPC CPSs were in the range of 3.9 -7.8%. (Table
5.3). There was no significant difference in the moisture content of top, middle
and bottom section, contrary to BFS:OPC CPSs.
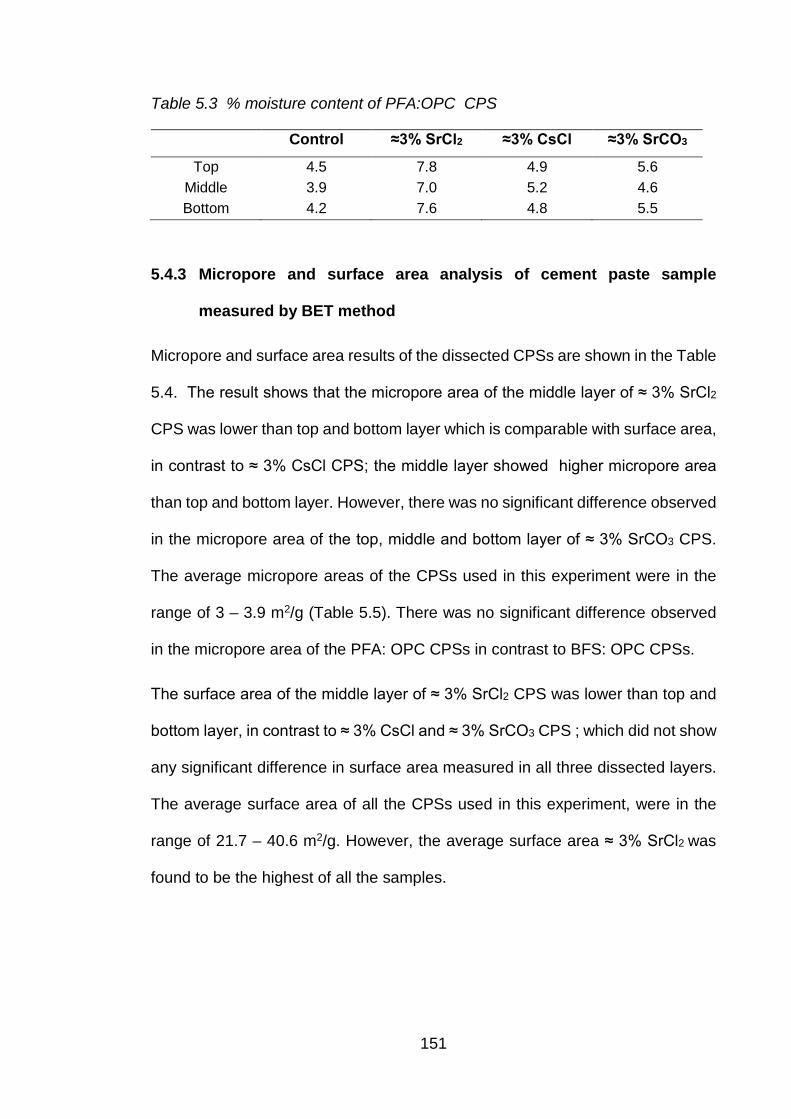
151
Table 5.3 % moisture content of PFA:OPC CPS
Control ≈3% SrCl2 ≈3% CsCl ≈3% SrCO3
Top 4.5 7.8 4.9 5.6 Middle 3.9 7.0 5.2 4.6 Bottom 4.2 7.6 4.8 5.5
5.4.3 Micropore and surface area analysis of cement paste sample
measured by BET method
Micropore and surface area results of the dissected CPSs are shown in the Table
5.4. The result shows that the micropore area of the middle layer of ≈ 3% SrCl2
CPS was lower than top and bottom layer which is comparable with surface area,
in contrast to ≈ 3% CsCl CPS; the middle layer showed higher micropore area
than top and bottom layer. However, there was no significant difference observed
in the micropore area of the top, middle and bottom layer of ≈ 3% SrCO3 CPS.
The average micropore areas of the CPSs used in this experiment were in the
range of 3 – 3.9 m2/g (Table 5.5). There was no significant difference observed
in the micropore area of the PFA: OPC CPSs in contrast to BFS: OPC CPSs.
The surface area of the middle layer of ≈ 3% SrCl2 CPS was lower than top and
bottom layer, in contrast to ≈ 3% CsCl and ≈ 3% SrCO3 CPS ; which did not show
any significant difference in surface area measured in all three dissected layers.
The average surface area of all the CPSs used in this experiment, were in the
range of 21.7 – 40.6 m2/g. However, the average surface area ≈ 3% SrCl2 was
found to be the highest of all the samples.

152
Table 5.4 Micropore and surface area analysis of dissected PFA:OPC cement
paste samples measured by BET method
Dissected PFA:OPC
CPS
≈ 3% SrCl2 CPS 3% SrCO3 CPS ≈ 3% CsCl CPS
Micro-pore area
Surface area Micro-pore
area Surface
area Micro-pore area
Surface area
m2/g m2/g m2/g Top 3.4 43.8 3.8 22.9 3.0 28.6
Middle 2.2 33.9 3.5 24.5 4.2 27.2
Bottom 3.5 44.1 4.0 24.1 3.5 26.4
Table 5.5 Average micropore and surface area of PFA:OPC cement paste
samples measured by BET method
Sample Micropore area Surface area
m2/g
Control 3.9 22.7
≈3% SrCl2 3.0 40.6 ≈3% CsCl 3.6 27.4
≈3% SrCO3 3.7 23.8
≈0.3% SrCl2 3.7 22.2
≈0.3% CsCl2 3.2 21.7
5.4.4 Test solution analysis
5.4.4.1 pH values
The pH values of the test solutions increased from 7.0 to 12.13 (Figure 5.1 to
Figure 5.10) for the closed circuit distilled water experiments. Lower pH values
were found in the test solutions with ≈3% SrCl2. This could be due to the
dissociation of SrCl2 to Sr(OH)2 and HCl. The HCl formed could be responsible
for the lower pH values of test solutions from ≈3% SrCl2. The pH values from all
the test solutions of open circuit experiments were found to in similar range and
there was no significant difference found among the test solutions.

153
5.4.4.2 Chemical analysis of test solution
The rates of diffusivity of all the experiments are shown in Figure 5.1 to Figure
5.10. All the diffusivity data have been normalised for comparative purposes. In
the following sub sections the average diffusivity data have been used for
comparative purposes. The rate of diffusivity values of each CPS are given in
appendix 5.1 to 5.10.
Strontium
A significant higher rate of diffusivity of Sr2+ was measured for the ≈3% SrCl2 (134
µg/cm2/day) followed by ≈0.3% SrCl2 (10 µg/cm2/day) and ≈3% SrCO3 CPSs
(0.29 µg/cm2/day) in the closed circuit experiments. Similar trend in diffusivity
pattern was observed in open circuit diffusivity experiment; Sr2+ from ≈3% SrCl2
diffused out at considerable faster rate than from ≈3% SrCO3 CPS. The rate of
diffusivity of Sr2+ from ≈3% SrCl2 PFA: OPC CPS (134 µg/cm2/day) was
measured ≈4 times faster than ≈3% SrCl2 BFS: OPC CPS (35 µg/cm2/day). This
demonstrates that the diffusivity of Sr2+ and other cations is dependent upon its
concentration and cement additive used in the cement paste formulation.
Caesium
The rate of diffusivity of Cs+ from ≈3% CsCl CPS was higher than the rest of the
Cs CPS. Caesium from ≈0.3% CsCl CPS (21 µg/cm2/day) diffused out 17 times
slower than the rate of diffusivity Cs+ from ≈3% CsCl CPS (363 µg/cm2/day).
Approximately similar difference in the rate of diffusivity in BFS: OPC was
measured. The rate of diffusivity of Cs+ was found to be 2-3 times higher than
Sr2+ in both PFA: OPC and BFS: OPC CPS.
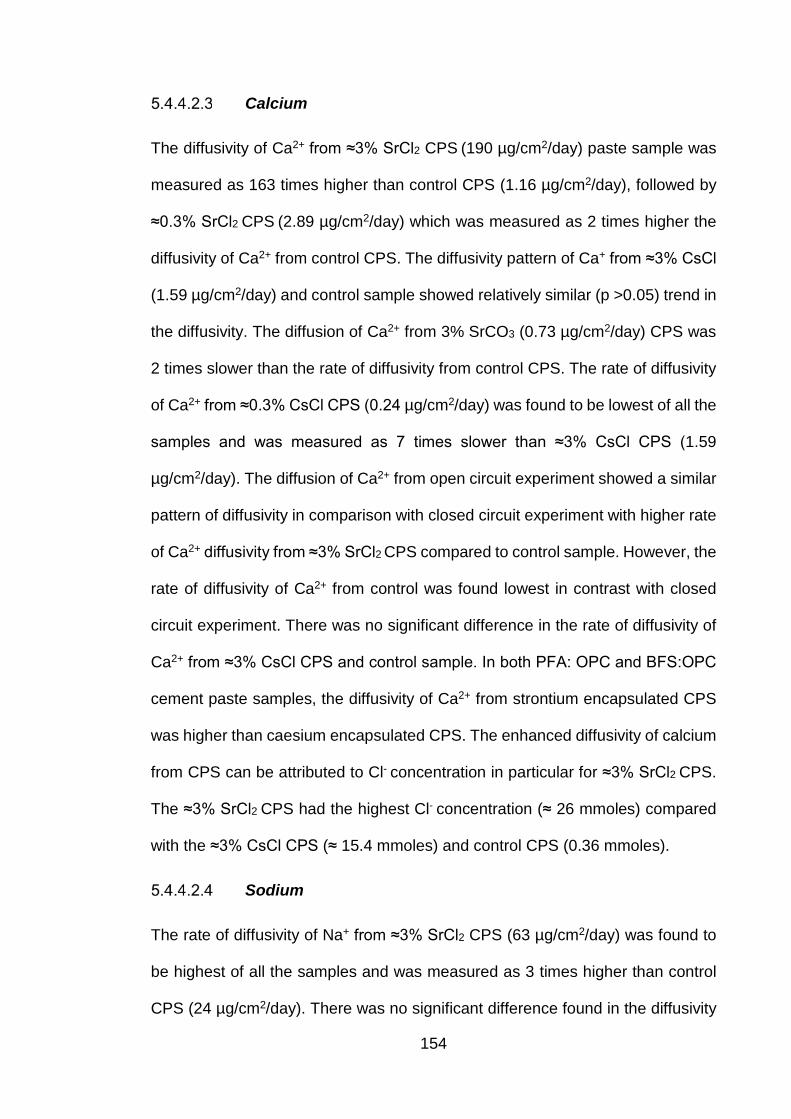
154
Calcium
The diffusivity of Ca2+ from ≈3% SrCl2 CPS (190 µg/cm2/day) paste sample was
measured as 163 times higher than control CPS (1.16 µg/cm2/day), followed by
≈0.3% SrCl2 CPS (2.89 µg/cm2/day) which was measured as 2 times higher the
diffusivity of Ca2+ from control CPS. The diffusivity pattern of Ca+ from ≈3% CsCl
(1.59 µg/cm2/day) and control sample showed relatively similar (p >0.05) trend in
the diffusivity. The diffusion of Ca2+ from 3% SrCO3 (0.73 µg/cm2/day) CPS was
2 times slower than the rate of diffusivity from control CPS. The rate of diffusivity
of Ca2+ from ≈0.3% CsCl CPS (0.24 µg/cm2/day) was found to be lowest of all the
samples and was measured as 7 times slower than ≈3% CsCl CPS (1.59
µg/cm2/day). The diffusion of Ca2+ from open circuit experiment showed a similar
pattern of diffusivity in comparison with closed circuit experiment with higher rate
of Ca2+ diffusivity from ≈3% SrCl2 CPS compared to control sample. However, the
rate of diffusivity of Ca2+ from control was found lowest in contrast with closed
circuit experiment. There was no significant difference in the rate of diffusivity of
Ca2+ from ≈3% CsCl CPS and control sample. In both PFA: OPC and BFS:OPC
cement paste samples, the diffusivity of Ca2+ from strontium encapsulated CPS
was higher than caesium encapsulated CPS. The enhanced diffusivity of calcium
from CPS can be attributed to Cl- concentration in particular for ≈3% SrCl2 CPS.
The ≈3% SrCl2 CPS had the highest Cl- concentration (≈ 26 mmoles) compared
with the ≈3% CsCl CPS (≈ 15.4 mmoles) and control CPS (0.36 mmoles).
Sodium
The rate of diffusivity of Na+ from ≈3% SrCl2 CPS (63 µg/cm2/day) was found to
be highest of all the samples and was measured as 3 times higher than control
CPS (24 µg/cm2/day). There was no significant difference found in the diffusivity
155
of Na+ from ≈0.3% SrCl2 (22 µg/cm2/day), ≈0.3% CsCl (21 µg/cm2/day), ≈3%
CsCl (21 µg/cm2/day) and ≈3% SrCO3 CPS (20 µg/cm2/day). The data obtained
from open circuit experiment, showed highest diffusivity of sodium from ≈3%
SrCl2 CPS. However there was no significant difference in the diffusivity pattern
of Na+ found in ≈3% SrCO3, ≈3% CsCl CPS, and control sample. The diffusivity
of Na+ in BFS: OPC showed different sequence in comparison with PFA: OPC.
Chloride
The sequence of diffusivity of Cl- in our study was: ≈3% SrCl2> ≈3% CsCl > ≈0.3%
SrCl2>≈0.3% CsCl >≈3% SrCO3 >Control. This could be due to the concentration
effect, the concentration of Cl- in ≈3% SrCl2 (25.8 mmoles) was higher than all
other CPS (Table 5.6). Chloride from ≈3% SrCl2 CPS (1303 µg/cm2/day) diffused
out at higher rate than rest of the CPSs and was measured 268 times higher than
control CPS (4.9µg/cm2/day). However, Cl- from ≈3% CsCl CPS (243 µg/cm2/day)
was measured 50 times higher than the rate of diffusivity of Cl- from control CPS.
The rate of diffusivity of Cl- from closed circuit experiment showed a similar
sequence of diffusivity in comparison with open circuit experiment with higher rate
of Cl- diffusivity from ≈3% SrCl2 compared to control sample. Chloride from
strontium encapsulated cement paste sample was higher than caesium
encapsulated cement paste sample in both PFA: OPC and BFS:OPC CPSs.
These studies demonstrate that Cl- is the most mobile of all anions and confirms
previous published data [102, 103].
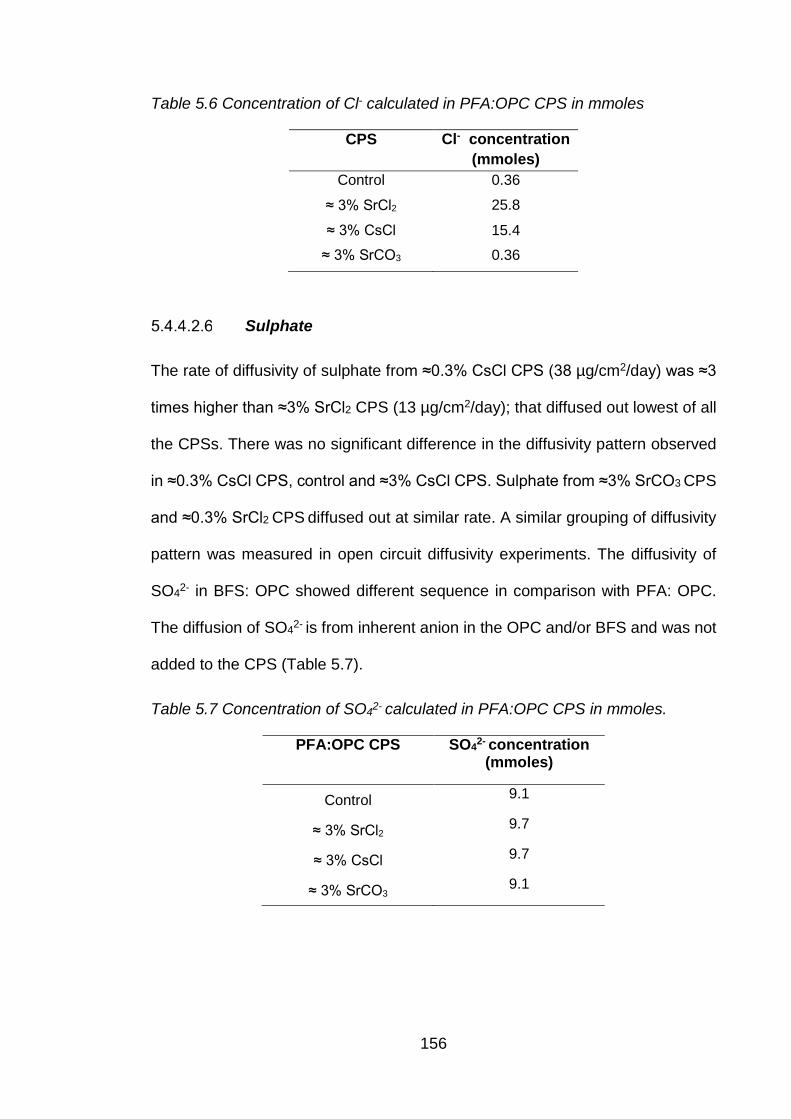
156
Table 5.6 Concentration of Cl- calculated in PFA:OPC CPS in mmoles
CPS Cl- concentration (mmoles)
Control 0.36
≈ 3% SrCl2 25.8
≈ 3% CsCl 15.4
≈ 3% SrCO3 0.36
Sulphate
The rate of diffusivity of sulphate from ≈0.3% CsCl CPS (38 µg/cm2/day) was ≈3
times higher than ≈3% SrCl2 CPS (13 µg/cm2/day); that diffused out lowest of all
the CPSs. There was no significant difference in the diffusivity pattern observed
in ≈0.3% CsCl CPS, control and ≈3% CsCl CPS. Sulphate from ≈3% SrCO3 CPS
and ≈0.3% SrCl2 CPS diffused out at similar rate. A similar grouping of diffusivity
pattern was measured in open circuit diffusivity experiments. The diffusivity of
SO42- in BFS: OPC showed different sequence in comparison with PFA: OPC.
The diffusion of SO42- is from inherent anion in the OPC and/or BFS and was not
added to the CPS (Table 5.7).
Table 5.7 Concentration of SO42- calculated in PFA:OPC CPS in mmoles.
PFA:OPC CPS SO42- concentration (mmoles)
Control 9.1
≈ 3% SrCl2 9.7
≈ 3% CsCl 9.7
≈ 3% SrCO3 9.1
157
5.5 Conclusions
1 The composition of make-up water affects both the bleed water volume and
physical characteristics of the cement paste samples.
2 The micropore area values for all PFA:OPC CPSs were similar and not
significantly different from BFS:OPC CPSs of the same formulation. ≈ 3%
strontium chloride contaminated samples had greater surface area values
but were not significantly different to other contaminated strontium cement
pastes.
3 The initial pH range was consistent for most samples and slightly lower than
the BFS:OPC values. These lower pH values could be a consequence of
the much lower calcium content of PFA:OPC CPSs.
4 Strontium concentration of the make-up water and the nature of the added
strontium salt influences the cation diffusivity.
5 Similarly to conclusion 4, caesium concentration influences its diffusivity,
but more importantly diffuses more quickly than other cations, respective of
cement formulation.
6 Both caesium and strontium influence calcium diffusion when compared
with the corresponding control CPS. This is not surprising for strontium as
it will be a good surrogate for calcium and hence take part in some of the
hydrates produced during curing. Caesium has a lower impact on calcium
diffusivity.
7 Strontium appeared to have the greater influence on chloride diffusivity but
this could be largely dependent on the mass of the anion in the PFA: OPC
CPS compared with other CPSs.

158
8 The diffusivity of sulphate was influenced by the nature of the cation added
to the make-up water. Strontium had the greatest effect on lowering the
diffusion primarily due to the formation of sparingly soluble strontium
sulphate.
9 Strontium influenced sodium diffusivity.
10 The diffusivity of Sr2+ and other cations is dependent upon its concentration
and cement additive used in the cement paste formulation.
11 Cl- is the most mobile of all anions.
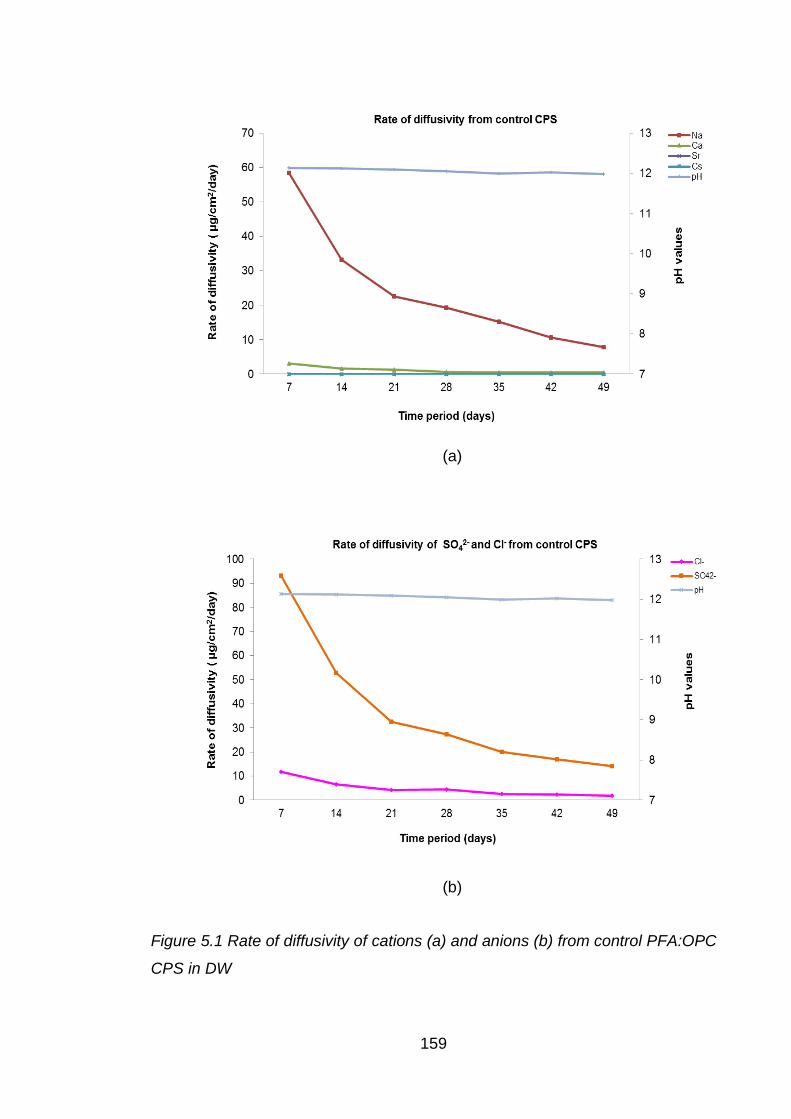
159
(a)
(b)
Figure 5.1 Rate of diffusivity of cations (a) and anions (b) from control PFA:OPC
CPS in DW
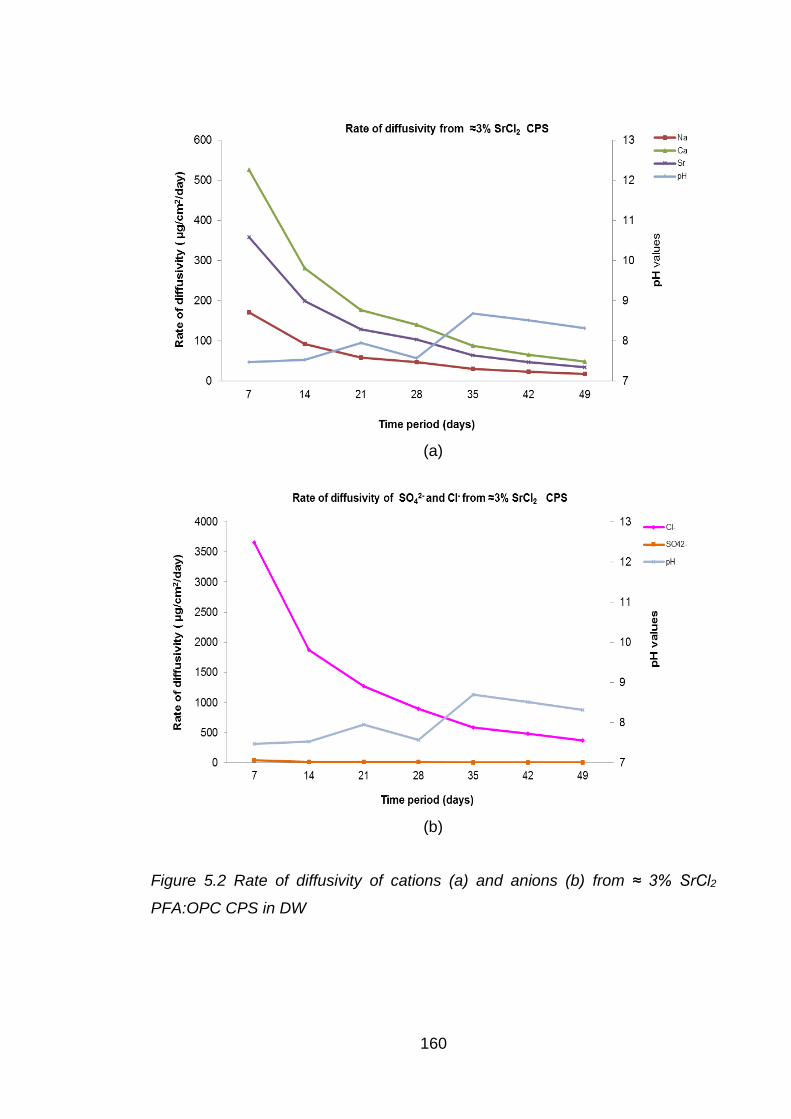
160
(a)
(b)
Figure 5.2 Rate of diffusivity of cations (a) and anions (b) from ≈ 3% SrCl2
PFA:OPC CPS in DW

161
(a)
(b)
Figure 5.3 Rate of diffusivity of cations (a) and anions (b) from ≈ 3% CsCl
PFA:OPC CPS in DW
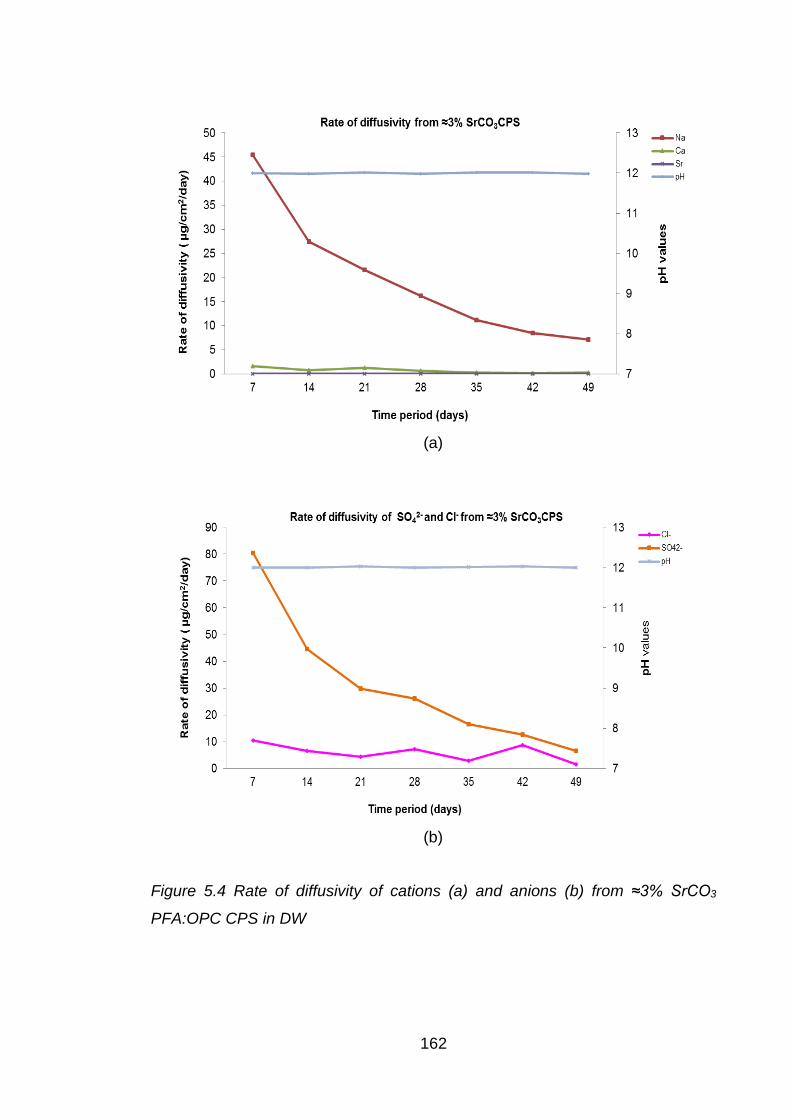
162
(a)
(b)
Figure 5.4 Rate of diffusivity of cations (a) and anions (b) from ≈3% SrCO3
PFA:OPC CPS in DW
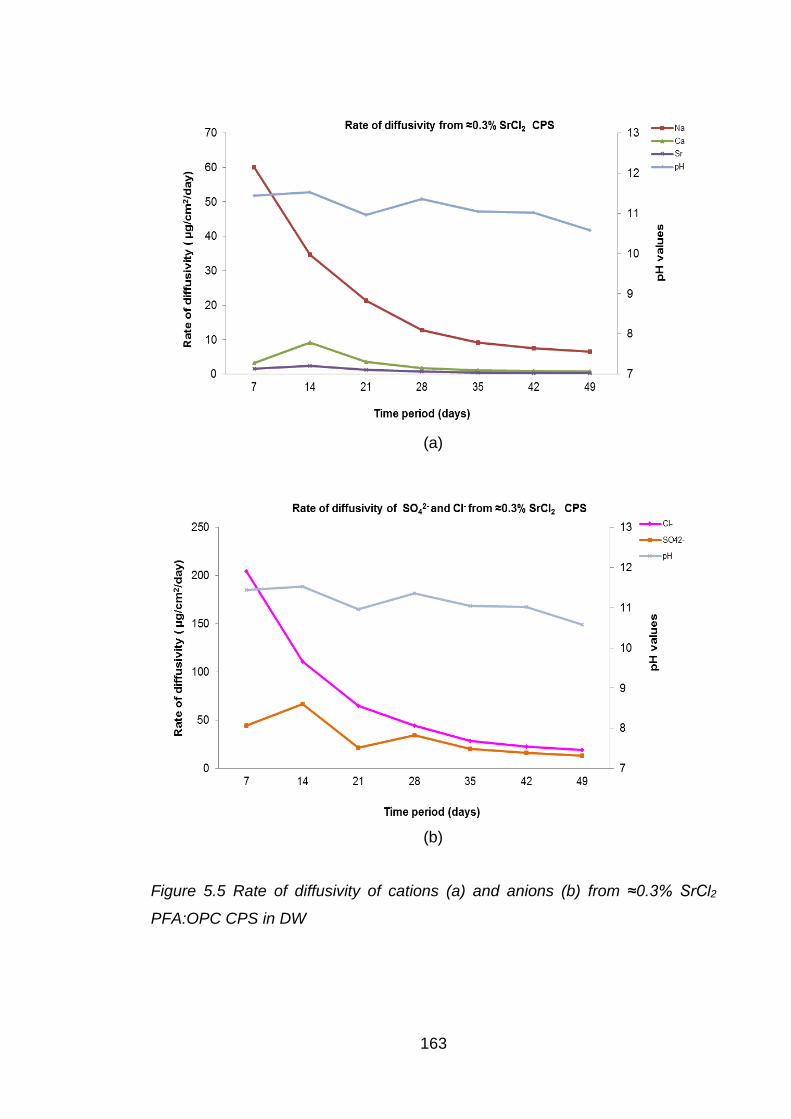
163
(a)
(b)
Figure 5.5 Rate of diffusivity of cations (a) and anions (b) from ≈0.3% SrCl2
PFA:OPC CPS in DW

164
(a)
(b)
Figure 5.6 Rate of diffusivity of cations (a) and anions (b) from ≈0.3% CsCl PFA:OPC CPS in DW
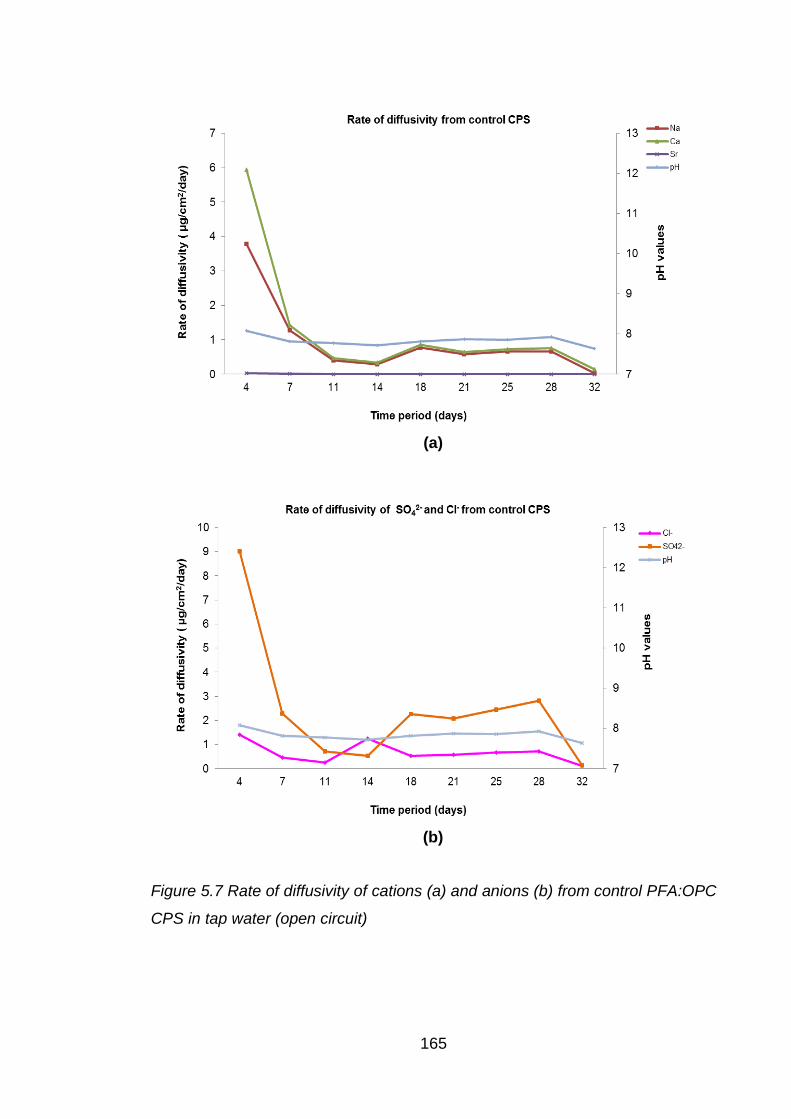
165
(a)
(b)
Figure 5.7 Rate of diffusivity of cations (a) and anions (b) from control PFA:OPC
CPS in tap water (open circuit)

166
(a)
(b)
Figure 5.8 Rate of diffusivity of cations (a) and anions (b) from ≈3% SrCl2
PFA:OPC CPS in tap water (open circuit)
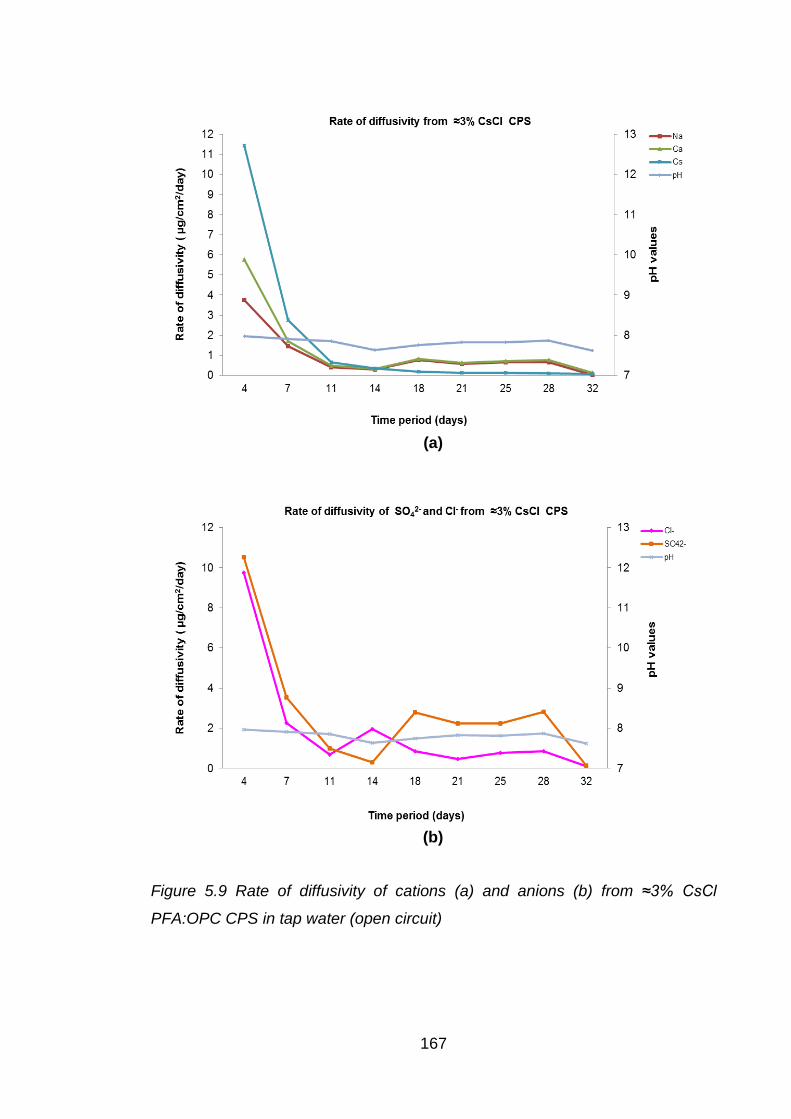
167
(a)
(b)
Figure 5.9 Rate of diffusivity of cations (a) and anions (b) from ≈3% CsCl
PFA:OPC CPS in tap water (open circuit)

168
(a)
(b)
Figure 5.10 Rate of diffusivity of cations (a) and anions (b) from ≈3% SrCO3
PFA:OPC CPS in tap water (open circuit)

Chapter 6: Diffusivity from BFS:OPC CPSs with Sellafield pore water as a test solution

169
6.1 Aims of study
The aim of this chapter is to evaluate the influence of simulated ground pore
water, nature of cation and their concentration on the diffusivity of cations when
encapsulated in BFS: OPC.
6.2 Introduction
The present study investigates the effect of simulated ground water on the
diffusivity of encapsulated waste when under simulated Geological Disposal
Facility (GDF) conditions. The stability of the cementitious waste was assessed
by subjecting the encapsulated CPSs under closed circuit diffusivity experiments
using Sellafield pore water as test solution. Two simulated groundwater solutions,
concentrated Sellafield pore water (CSPW) and diluted Sellafield pore water
(DSPW) (Table 6.1), were used as test solution in experiment 1 and experiment
2 respectively (Table 6.2). The simulated pore waters were prepared in
accordance with compositions reported by King et al. [65].
Table 6.1 Nominal composition of the test solution used [65]
Parameter salts used Units
Concentrated Diluted Sellafield pore
water Sellafield pore
water (CSPW) (DSPW)
Sellafield Sellafield BH3, DET1 BH9B, SPFT3
pH pH 6.8 6.8 Na+ NaCl mg/L 71600 19.3 K+ KCl mg/L 327 1.47
Mg2+ MgCl2 mg/L 696 13 Ca2+ CaCl2 mg/L 300 40.7
SiO44- - mg/L 2.67 5.24
Cl- NaCl/MgCl2 mg/L 108000 14.5 SO4
2- Na2SO4 mg/L 4910 4.01
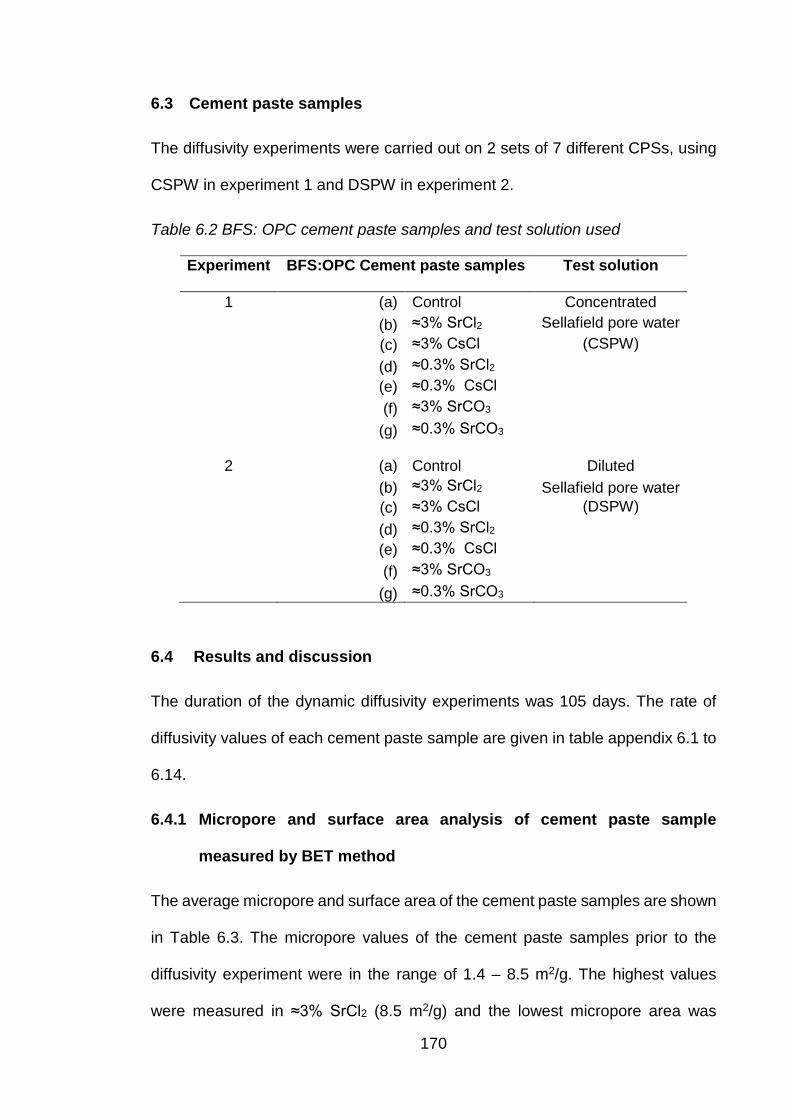
170
6.3 Cement paste samples
The diffusivity experiments were carried out on 2 sets of 7 different CPSs, using
CSPW in experiment 1 and DSPW in experiment 2.
Table 6.2 BFS: OPC cement paste samples and test solution used
Experiment BFS:OPC Cement paste samples Test solution
1 (a) Control Concentrated (b) ≈3% SrCl2 Sellafield pore water (c) ≈3% CsCl (CSPW) (d) ≈0.3% SrCl2 (e) ≈0.3% CsCl (f) ≈3% SrCO3 (g) ≈0.3% SrCO3
2 (a) Control Diluted (b) ≈3% SrCl2 Sellafield pore water (c) ≈3% CsCl (DSPW) (d) ≈0.3% SrCl2 (e) ≈0.3% CsCl (f) ≈3% SrCO3 (g) ≈0.3% SrCO3
6.4 Results and discussion
The duration of the dynamic diffusivity experiments was 105 days. The rate of
diffusivity values of each cement paste sample are given in table appendix 6.1 to
6.14.
6.4.1 Micropore and surface area analysis of cement paste sample
measured by BET method
The average micropore and surface area of the cement paste samples are shown
in Table 6.3. The micropore values of the cement paste samples prior to the
diffusivity experiment were in the range of 1.4 – 8.5 m2/g. The highest values
were measured in ≈3% SrCl2 (8.5 m2/g) and the lowest micropore area was

171
observed in ≈3% CsCl (1.4 m2/g). However, the micropore area of control, ≈3%
SrCl2, ≈0.3% CsCl, ≈3% SrCO3, ≈0.3% SrCO3 was fairly in similar range (3.1- 4.8
m2/g).
The average surface areas of the cement paste sample were measured in the
range of 13.1 – 31.8 m2/g. The highest surface area was measured in control
CPS (31.8 m2/g), whereas the lowest values were measured in ≈3% CsCl (13.1
m2/g). Both the micropore and surface area of ≈3% CsCl CPS were found to be
lowest than for all other CPS.
Table 6.3 Average micropore and surface area of cement paste samples
measured by BET method
CPS Average micropore area
Average surface area
m2/g Control 4.4 31.8
≈3% SrCl2 8.5 22.3 ≈3% CsCl 1.4 13.1
≈0.3% SrCl2 3.1 19.2 ≈0.3% CsCl 4.2 19.2 ≈3% SrCO3 5.3 22
≈0.3% SrCO3 4.8 23
6.4.2 Test solution analysis
6.4.2.1 pH values
The pH values of the CSPW test solutions after few days of the diffusivity
experiments increased from 6.8 (natural pH of CSPW) to 7.41-11.35. The lowest
pH values were recorded in the test solutions of ≈3% SrCl2 and ≈ 3% CsCl CPS
(Figure 6.1 and 6.5). Highest range in pH values with increasing trend was
measured in the CSPW from ≈ 0.3% counterpart and CPSs with carbonate.
172
The simulated pore waters have no or little inherent buffering capacity and
therefore will change significantly with the duration of the experiments. This was
more evident for the DSPW. The pH values in the DSPW for all the CPS excluding
≈3% SrCl2 and ≈ 3% CsCl showed higher pH values and were fairly close to the
pH values measured in the DW experiment.
6.4.2.2 Chemical analysis of test solution
The rates of diffusivity of the cations and anions are presented in Figure 6.1 to
Figure 6.14. All the diffusivity data have been normalised for dilution effect and
cation/anion composition of CSPW. The average rate of diffusivity data of 105
days from DW BFS: OPC experiment have been utilised for comparative purpose.
Strontium
The diffusivity of Sr2+ from CSPW and DSPW experiments showed similar trend
in the diffusivity i.e. ≈3% SrCl2> ≈0.3% SrCl2 > ≈3% SrCO3 > ≈0.3% SrCO3. The
diffusivity of Sr2+ was found to be slowest of all cations within individual CPS
except in case of CSPW for ≈ 3% SrCl2 CPS. The difference in the diffusion of
Sr2+ between two experiments is notable. The average rate of diffusivity of Sr2+
in CSPW from ≈3% SrCl2 CPS (25 µg/cm2/day), ≈0.3% SrCl2 CPS (3 µg/cm2/day),
≈3% SrCO3 CPS (1 µg/cm2/day) and ≈0.3% SrCO3 CPS (0.3 µg/cm2/day) was 6,
10, 71 and 16 times higher than the rate of diffusivity of Sr in DSPW from ≈3%
SrCl2 CPS (4.3 µg/cm2/day), ≈0.3% SrCl2 CPS (0.27 µg/cm2/day), ≈3% SrCO3
CPS (0.032 µg/cm2/day) and ≈0.3% SrCO3 CPS (0.018 µg/cm2/day) respectively.
The dependence of Sr2+ diffusivity on the type of aqueous solution, concentration
and nature of Sr2+ added to cement paste mixture is explained in the previous
chapter, section 3.3.

173
Caesium
Caesium diffused out at faster rate from ≈3% CsCl CPS than ≈0.3% CsCl CPS in
both the experiments. The diffusivity of Cs+ from ≈3% CsCl CPS (840 µg/cm2/day)
and ≈0.3% CsCl CPS (77 µg/cm2/day) in CSPW experiment was ≈ 45 times faster
than the diffusivity of Cs+ from ≈3% CsCl CPS (19 µg/cm2/day) and ≈0.3% CsCl
CPS (1.72 µg/cm2/day) CPSs in DSPW experiment. This could be due to the pH
effect. The pH range of CSPW for 3% and 0.3% CsCl CPS was in the range of
7.18 – 9.05. However, the pH range measured in DSPW for 3% and 0.3% CsCl
CPS was in the range of 7.7 -12.01. In comparison with DW diffusivity data; Cs+
in CSPW diffused out 32 and 53 times faster for ≈3% CsCl and ≈0.3% CsCl CPS
respectively. This suggests that the encapsulated metal ion may have faster
diffusivity rate when subjected to a leaching process with higher ionic strength
test solution with pH values in the range of 7 - 9.
Calcium
Calcium diffused out at faster rate from ≈3% SrCl2 CPS in both the DSPW and
CSPW test solutions. In CSPW, Ca+ from ≈3% contaminated CPSs diffused out
faster in comparison with ≈0.3% contaminated CPSs. The sequence of diffusivity
of Ca+ observed in CSPW test solution was ≈3% SrCl2> control > ≈3% CsCl >
≈3% SrCO3> ≈0.3% SrCl2 > ≈0.3% CsCl > ≈0.3% SrCO3.
Contrary to CSPW, the results of DSPW showed the sequence of diffusivity as
≈3% SrCl2> ≈0.3% SrCl2 >≈3% SrCO3> ≈3% CsCl > ≈0.3% CsCl > ≈0.3%
SrCO3>control. The diffusivity of Ca+ from ≈0.3% CsCl was faster compared to
all the CPS in DSPW. Calcium from control in DSPW diffused out slowest of all
the CPS.

174
The average rate of diffusivity of Ca+ in CSPW experiment was higher than DW
and DSPW experiment. There was no significant difference in the rate of
diffusivity between DW and DSPW from all the 0.3% CPSs. However, the
average rate of diffusivity of Ca+ from ≈3% CsCl CPS (4.3 µg/cm2/day) and ≈3%
SrCO3 CPS (4.7 µg/cm2/day) was ≈7 times higher compared to DW experiment
(≈3% CsCl CPS (0.6 µg/cm2/day); ≈3% SrCO3 CPS (0.8 µg/cm2/day).
Sodium
Sodium diffused out at fairly similar and higher rate from control, ≈3% SrCl2, and
≈3% CsCl CPS compared to ≈0.3% SrCl2, ≈0.3% CsCl, ≈0.3% SrCO3 and ≈3%
SrCO3 in CSPW experiment. This could be due to higher concentration of Na in
200 ml CSPW i.e. 623 mmoles compared to the maximum Na+ can diffuse at its
highest concentration i.e. 23 mmoles from CPS. The rate of diffusivity of sodium
from all the CPSs in DSPW was significantly similar except from ≈3% SrCO3.
In comparison with DW experiment, the diffusivity of sodium from all the CPSs in
CSPW was considerably higher than the DW and DSPW.
Chloride
The difference in the rate of diffusivity of the anion between the two experiments
was observed. The diffusivity of Cl- from all the CPSs in CPSW showed a
significant similar rate of diffusivity. The CSPW test solution contains much more
Cl- ion than the DSPW (Table 6.1). It is highly unlikely that the concentration of
diffused Cl- can be measured. The concentration of Cl- present in 200 ml CPSW
is 609 mmoles, which is significantly higher than the maximum concentration of
Cl- could be leached out i.e. 60 mmoles. There could be back diffusion of Cl- due
to reverse concentration gradient.
175
In case of DSPW, Cl- from ≈3% SrCl2 CPS (177 µg/cm2/day) diffused out at faster
rate followed by ≈3% CsCl CPS (154 µg/cm2/day), ≈0.3% SrCl2 CPS (26
µg/cm2/day) and ≈0.3% SrCl2 CPS (26 µg/cm2/day). There was no significant
difference observed in the diffusivity Cl- between ≈3% CsCl CPS (13 µg/cm2/day),
control CPS (12 µg/cm2/day) ≈3% SrCO3 CPS (9 µg/cm2/day) and ≈0.3% SrCO3
CPS (8 µg/cm2/day).
In comparison with DW experiment, the average rate of diffusivity of Cl- from ≈3%
CsCl CPS (154 µg/cm2/day) in DSPW was ≈23 times higher than the average
rate of diffusivity in DW (7 µg/cm2/day). Contrary to its 0.3% counterpart; the
average rate of diffusivity in DSPW was 1.8 times lower in comparison with DW
diffusivity.
In case of ≈3% SrCl2, the average rate of diffusivity was ≈2 times higher in DSPW
(177 µg/cm2/day) in comparison with DW diffusivity (83 µg/cm2/day). However,
the average rate of diffusivity was measured 9 times higher from its 0.3%
counterpart in DSPW (26 µg/cm2/day) in comparison with DW (2.9 µg/cm2/day).
Sulphate
The rate of diffusivity of SO42- was faster from ≈0.3% SrCO3 CPS compared to all
the CPSs in the CSPW. There was no significant difference in the rate of
diffusivity of SO42- from ≈3% CsCl, ≈3% SrCl2, and ≈0.3% CsCl and control CPS.
The concentration of SO42- in CSPW was twice as high as in the CPSs, which
may have created inverse concentration gradient in favour of test solution. In
DSPW experiment, the diffusivity of SO42- from ≈3% CsCl was faster compared
to all the CPSs in the DSPW. There was no significant difference observed in the
rate of diffusivity of SO42- from ≈3% SrCl2, ≈ 0.3% SrCO3, ≈0.3% CsCl and control
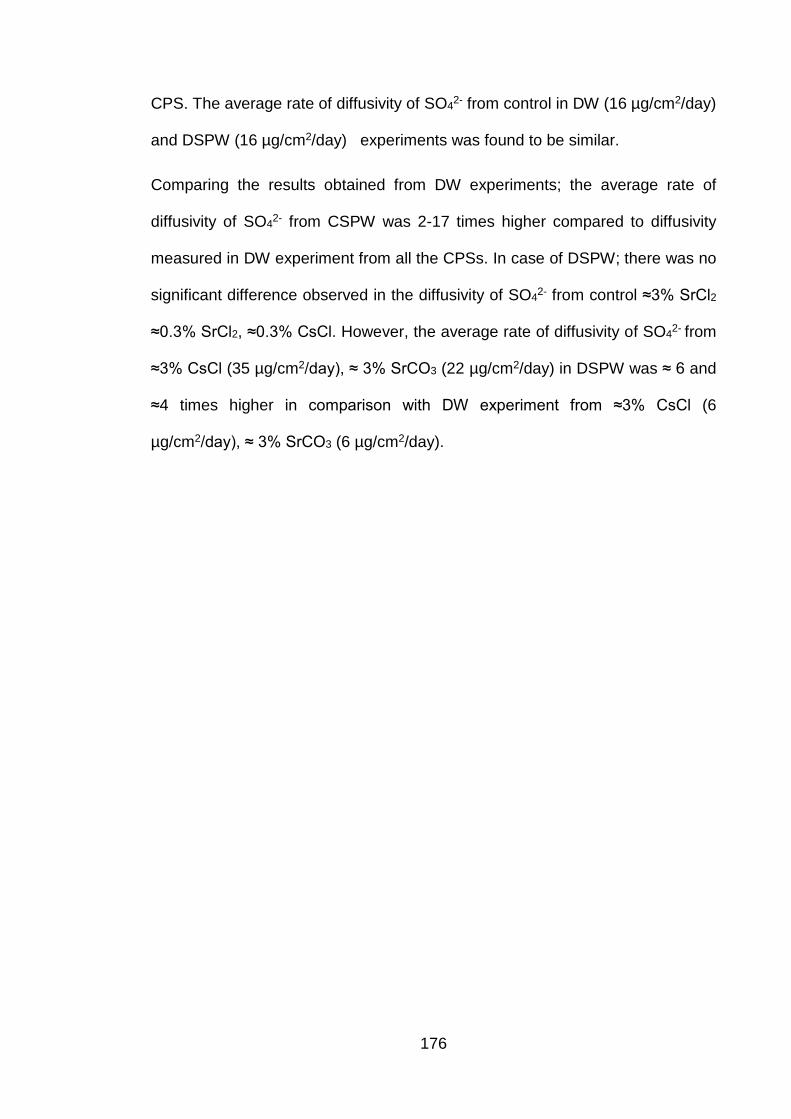
176
CPS. The average rate of diffusivity of SO42- from control in DW (16 µg/cm2/day)
and DSPW (16 µg/cm2/day) experiments was found to be similar.
Comparing the results obtained from DW experiments; the average rate of
diffusivity of SO42- from CSPW was 2-17 times higher compared to diffusivity
measured in DW experiment from all the CPSs. In case of DSPW; there was no
significant difference observed in the diffusivity of SO42- from control ≈3% SrCl2
≈0.3% SrCl2, ≈0.3% CsCl. However, the average rate of diffusivity of SO42- from
≈3% CsCl (35 µg/cm2/day), ≈ 3% SrCO3 (22 µg/cm2/day) in DSPW was ≈ 6 and
≈4 times higher in comparison with DW experiment from ≈3% CsCl (6
µg/cm2/day), ≈ 3% SrCO3 (6 µg/cm2/day).

177
6.5 Conclusions
1 Although the ionic strength of the CSPW was significantly higher than other
test solution (≈3 compared with ≈0.1), it had little or no effect on pH values;
however for the DSPW the values decreased slightly by one unit.
2 Strontium diffusivity depends on concentration and nature of strontium salt
added to the make-up water.
3 The concentration of cations and anions in the test solution influenced
strontium diffusivity. A similar situation was observed for caesium diffusion.
4 Calcium diffusion was affected by both nature of the cation added to make-
up water and its concentration. This effect was less marked for caesium
contaminated CPSs.
5 These test solutions had the least impact on chloride diffusivity, but this
could be attributed to the high concentration of chloride in the test solution
in particular for CSPW.
6 The diffusivity of sulphate was hindered by the presence of strontium.
7 The changes in the rate of sulphate diffusivity could be attributed to the
changing chemistry of hydrates and pore water compositions with time.
8 The impact of cement paste and test solution composition had little influence
of sodium diffusion.

178
(a)
(b)
Figure 6.1 Rate of diffusivity of cations (a) and anions (b) from control BFS:OPC
CPS in CSPW

179
(a)
(b)
Figure 6.2 Rate of diffusivity of cations (a) and anions (b) from control BFS:OPC
CPS in DSPW
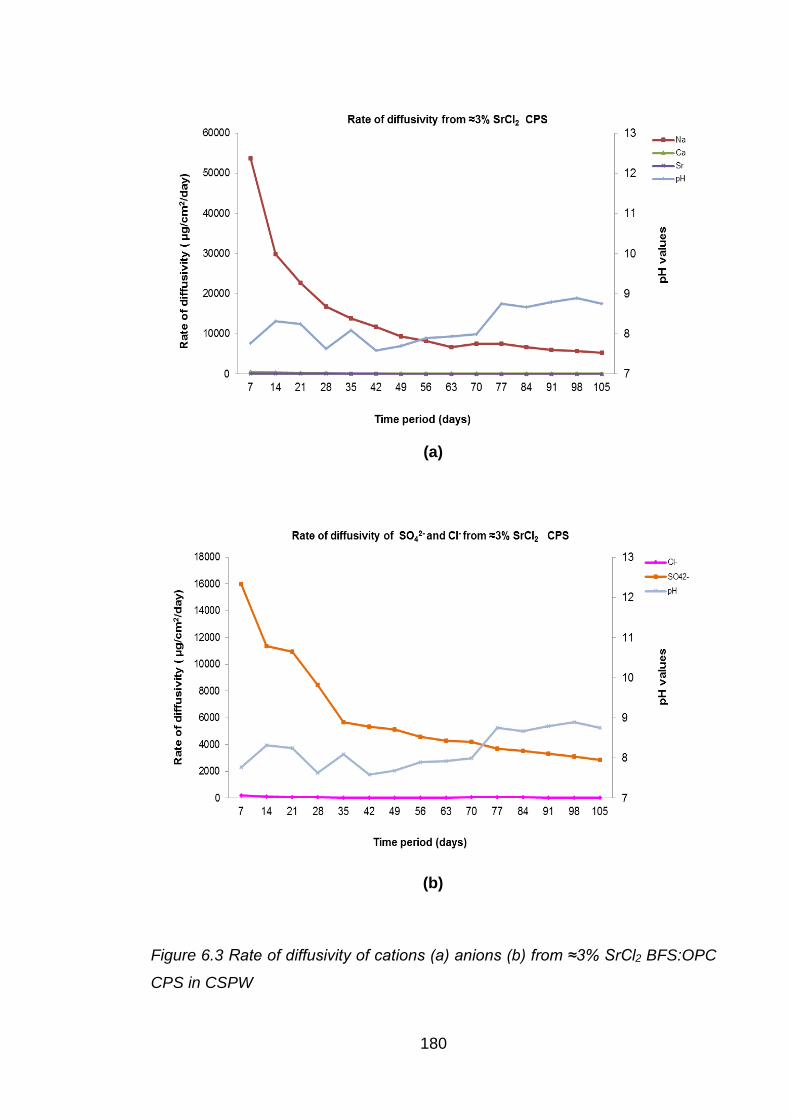
180
(a)
(b)
Figure 6.3 Rate of diffusivity of cations (a) anions (b) from ≈3% SrCl2 BFS:OPC
CPS in CSPW

181
(a)
(b)
Figure 6.4 Rate of diffusivity of cations (a) anions (b) from ≈3% SrCl2 BFS:OPC
CPS in DSPW
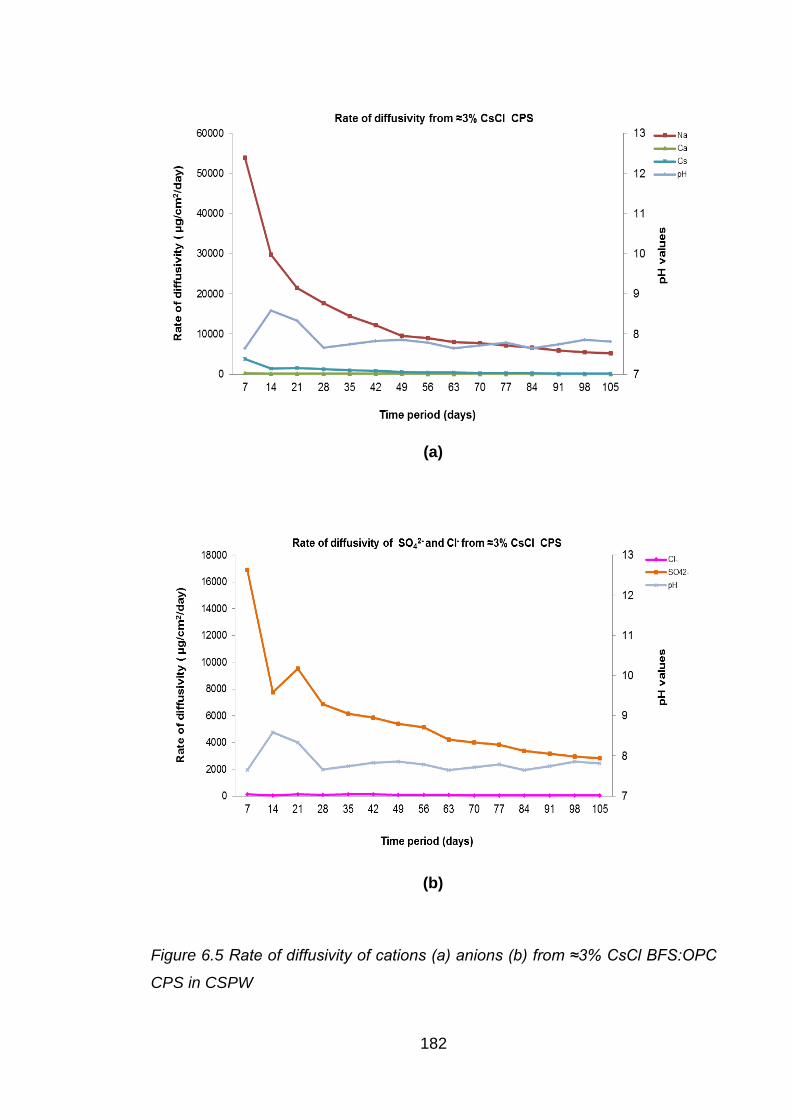
182
(a)
(b)
Figure 6.5 Rate of diffusivity of cations (a) anions (b) from ≈3% CsCl BFS:OPC
CPS in CSPW

183
(a)
(b)
Figure 6.6 Rate of diffusivity of cations (a) anions (b) from ≈3% CsCl BFS:OPC
CPS in DSPW

184
(a)
(b)
Figure 6.7 Rate of diffusivity of cations (a) anions (b) from ≈3% SrCO3 BFS:OPC
CPS in CSPW

185
(a)
Figure 6.8 Rate of diffusivity of cations (a) anions (b) from ≈3% SrCO3 BFS:OPC
CPS in DSPW

186
(a)
(b)
Figure 6.9 Rate of diffusivity of cations (a) anions (b) from ≈0.3% SrCl2 BFS:OPC
CPS in CSPW

187
(a)
(b)
Figure 6.10 Rate of diffusivity of cations (a) anions (b) from ≈0.3% SrCl2
BFS:OPC CPS in DSPW

188
(a)
(b)
Figure 6.11 Rate of diffusivity of cations (a) anions (b) from ≈0.3% CsCl BFS:OPC
CPS in CSPW
189
(a)
(b)
Figure 6.12 Rate of diffusivity of cations (a) anions (b) from ≈0.3% CsCl BFS:OPC
CPS in DSPW
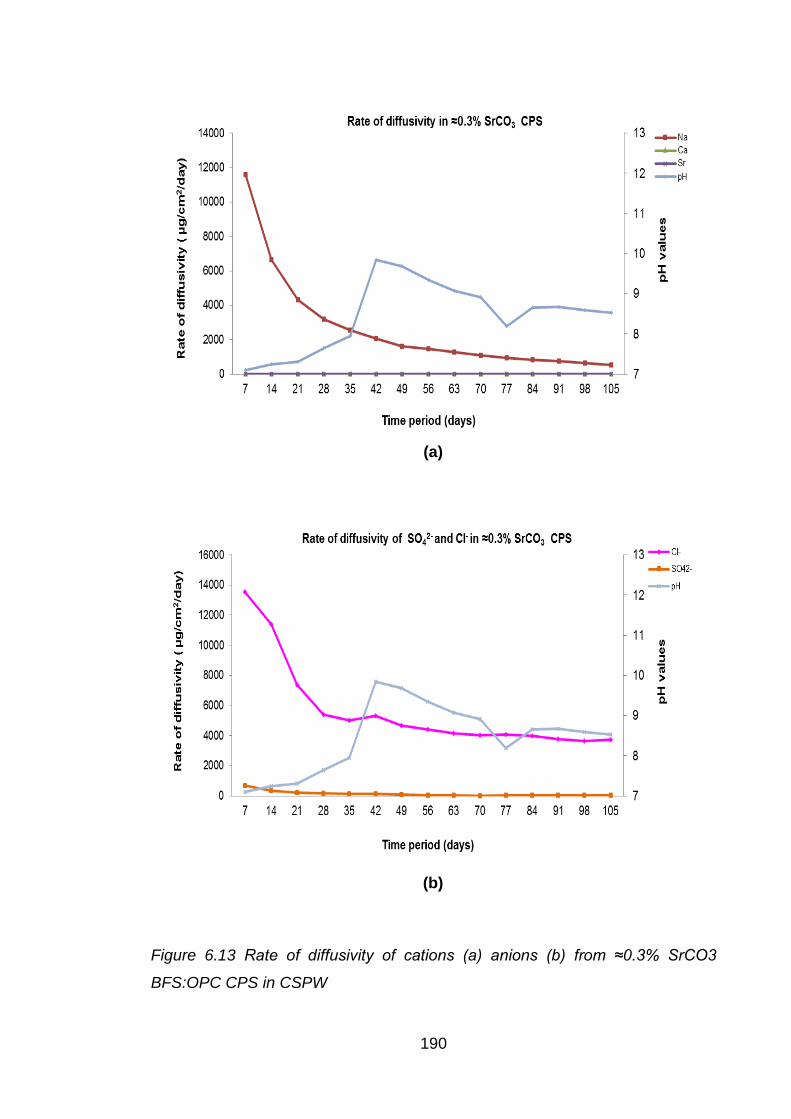
190
(a)
(b)
Figure 6.13 Rate of diffusivity of cations (a) anions (b) from ≈0.3% SrCO3
BFS:OPC CPS in CSPW
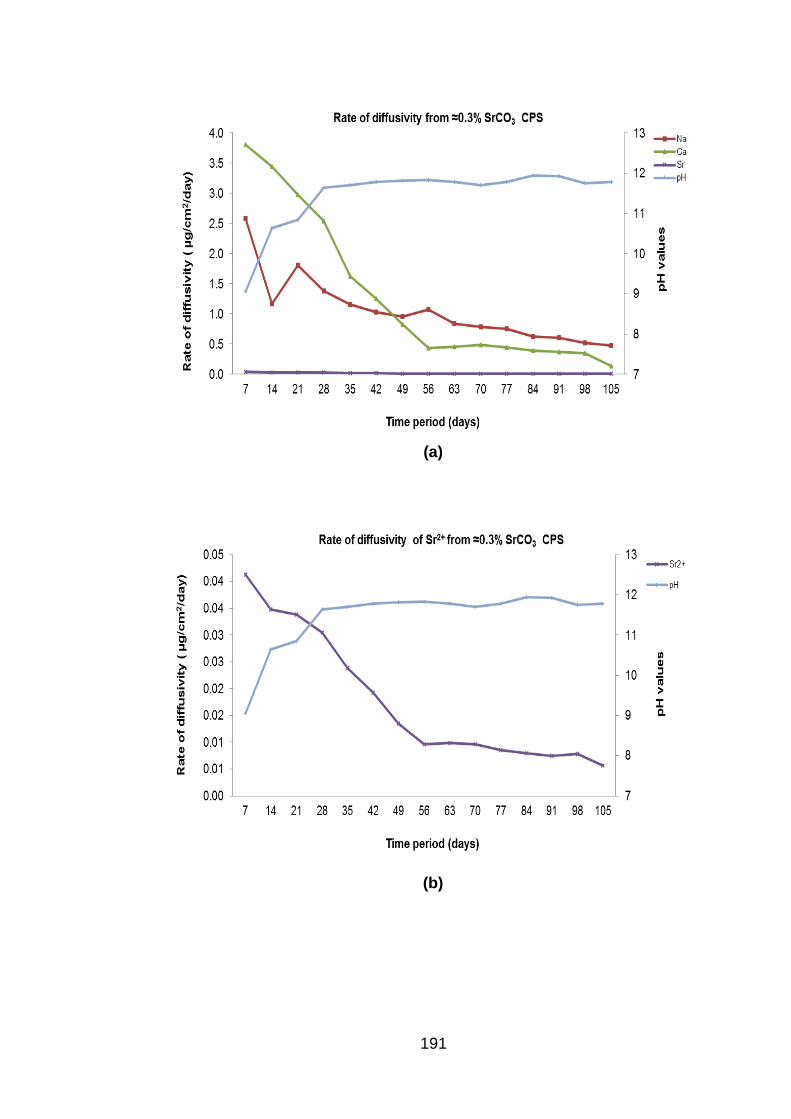
191
(a)
(b)
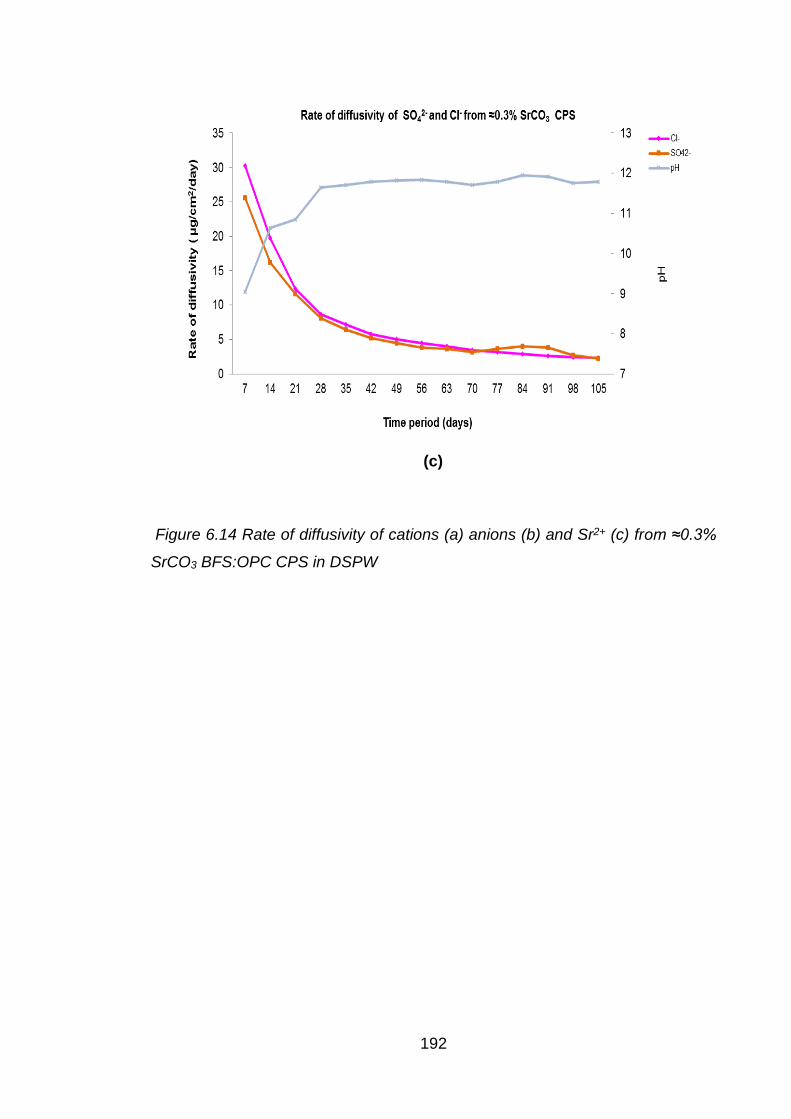
192
(c)
Figure 6.14 Rate of diffusivity of cations (a) anions (b) and Sr2+ (c) from ≈0.3%
SrCO3 BFS:OPC CPS in DSPW

Chapter 7: Diffusivity from PFA: OPC CPSs with Sellafield pore water as a test solution
193
7.1 Aims of study
To evaluate the influence of simulated ground water, nature of cations and their
concentration on the diffusivity of cations when encapsulated in PFA: OPC.
7.2 Introduction
This chapter addresses diffusivity experiments involving PFA: OPC CPSs with
simulated ground water to compare the rates of diffusivity with that of BFS: OPC
ground water diffusivity data (chapter 6). The diffusivity studies with concentrated
Sellafield pore water (CSPW) (composition reported in Table 6.2) were carried
out on PFA: OPC CPSs that had been cured for 90 days. The experimental setup
consisted of four sets of closed circuit diffusivity experiments with PFA:OPC
CPSs with different cation characteristics (Table 7.1). Diffusivity studies on PFA
CPS with DSPW were not carried out because of time constraints and DSPW
diffusivity from BFS: OPC was closer to the diffusivity of DW BFS: OPC diffusivity.
The DSPW diffusivity of BFS: OPC was measured to be in similar range of
diffusivity rate as measured in DW BFS: OPC experiments. It is more than likely
that the similar diffusivity pattern with DSPW and DW will take place even in PFA:
OPC CPSs.
194
7.3 Cement paste samples
The diffusivity experiments were carried out on 4 different CPSs using CSPW.
Table 7.1 PFA: OPC cement paste samples and test solutions used
Experiment PFA:OPC cement paste samples Test solution
1 (a) Control Concentrated
(b) ≈3% SrCl2 Sellafield pore water
(c) ≈3% CsCl (CSPW)
(f) ≈3% SrCO3
7.4 Results
The duration of the dynamic diffusivity experiments (closed system) was 35 days.
The rates of diffusivity values of each CPS are given in Appendix 7.1 to 7.4.
7.4.1 Micropore and surface area analysis of cement paste sample
The average micropore areas of the PFA: OPC CPSs used in this experiment
were in the similar range 3 – 3.9 m2/g (Table 7.2). There was no significant
difference observed in the micropore area of the PFA: OPC CPSs. The average
surface area of all the CPSs used in this experiment, were in the range of 21.7 –
40.6 m2/g. However, only the average surface area ≈ 3% SrCl2 was found to be
the highest of all the samples.

195
Table 7.2 Average micropore and surface area of PFA: OPC cement paste
samples measured by BET method
CPS Micropore area Surface area m2/g
Control 3.9 22.7
≈3% SrCl2 3.0 40.6 ≈3% CsCl 3.6 27.4
≈3% SrCO3 3.7 23.8 ≈0.3% SrCl2 3.7 22.2 ≈0.3% CsCl2 3.2 21.7
7.4.2 Test solution analysis
7.4.2.1 pH values
The pH values of the CSPW test solution increased from 6.8 (natural pH of
CSPW) to 7.41 -11.35 after few days of the diffusivity experiments. The lowest
values were recorded in the test solution of ≈3% SrCl2 (7.41-7.54) (Figure 7.2)
which were fairly close to the pH values measured in the CSPW from control CPS
until day 28 (7.69-7.80) (Figure 7.1) and increased thereafter to day 35 (9.10).
Highest pH values were recorded in CSPW from ≈3% CsCl and ≈3% SrCO3 (8.14-
11.35). In both the CSPW test solutions from ≈3% CsCl and ≈3% SrCO3; pH
values showed a gradual increase in pH from day 14 to day 35. (Figure 7.3 to
7.4)
7.4.2.2 Chemical analysis of test solution
The rates of diffusivity of the cations and anions are presented in Figure 7.2 to
7.4. All the diffusivity data have been normalised for dilution effect and
cation/anion composition of CSPW. The average rate of diffusivity data at 35 days
from CSPW BFS: OPC experiment have been utilised for comparative purpose.
196
Strontium
The average rate of diffusivity of Sr2+ in CSPW from ≈3% SrCl2 (35 µg/cm2/day)
was 24 times higher than ≈3% SrCO3 (1.5 µg/cm2/day). However, the average
rate of diffusivity from Sr2+ contaminated BFS: OPC CPS (≈3% SrCl2=53, ≈3%
SrCO3= 3 µg/cm2/day) was ≈ 2 times higher than PFA: OPC CPS at fairly similar
pH range in case of ≈3% SrCl2. Comparing the results from DW with CSPW PFA:
OPC diffusivity experiments; the average rate of diffusivity of Sr2+ from ≈3% SrCl2
(171 µg/cm2/day) was measured 5 times higher than the average rate of diffusivity
of Sr2+ from ≈3% SrCl2 (35 µg/cm2/day) respectively. However, the pH range of
DW was higher (7.47 – 8.69) in comparison with CPSW (7.41 – 7.54).
Caesium
Caesium diffusivity rate from PFA: OPC ≈3% CsCl CPS in CSPW was slower in
comparison with BFS: OPC ≈3% CsCl CPS. The average rate of diffusivity of Cs+
from BFS: OPC ≈3% CsCl CPS (1811 µg/cm2/day) was 3.5 times higher than the
average rate of diffusivity of Cs+ from PFA: OPC ≈3% CsCl (516 µg/cm2/day).
However, the pH of CPSW from BFS: OPC ≈3% CsCl CPS was measured in the
rage of 7.66 -8.59 compared to PFA: OPC CPS ≈3% CsCl which was in the range
of 8.14 – 10.56. There was no significant difference observed in the rate of
diffusivity between CSPW and DW diffusivity experiments (p>0.05).
Calcium
Calcium from ≈3% SrCl2 diffused out at faster rate compared to the other CPS in
CSPW. The sequence of diffusivity of Ca2+ observed in CSPW was ≈3% SrCl2 >
197
≈3% CsCl > ≈3% SrCO3 > control. The average rate of diffusivity of Ca2+ from
≈3% SrCl2 (116 µg/cm2/day) at pH (7.41-7.54), was ≈8 times higher than the
average rate of diffusivity of Ca2+ from control (14 µg/cm2/day) at pH (7.69 -9.10).
However, there was no significant difference in the diffusivity of Ca2+ from ≈3%
CsCl and ≈3% SrCO3 and control CPS (p>0.05). Comparing the results of BFS:
OPC with PFA: OPC in CSPW, the rate of diffusivity of Ca2+ from PFA: OPC
CPSs was considerably lower than the rate of diffusivity of Ca2+ from BFS: OPC
CPSs. This is due to the difference in Ca2+ content of BFS:OPC and PFA:OPC
CPS. However, faster diffusivity of Ca2+ was also observed from ≈3% SrCl2 in
CSPW from BFS: OPC and in DW from PFA: OPC CPSs.
Sodium
The diffusivity of Na+ in CSPW from all the PFA: OPC CPSs did not show any
significant difference. Sodium diffused out at fairly similar rate. This is due to
higher concentration of Na+ in CSPW test solution compared to maximum
quantity of Na+ could diffuse out as explained in previous chapter 6. However,
the average rate of diffusivity of Na+ from all the PFA: OPC CPSs was
considerably lower than BFS: OPC CPSs.
Chloride
The rate of diffusivity of Cl- from all PFA: OPC CPSs in CSPW were in a fairly
similar range (8729- 12431 µg/cm2/day). Similar observations were noted in the
case of CSPW BFS: OPC CPS experiments (4007- 6166 µg/cm2/day). This is
due to similar reason as sodium in test solution.

198
Sulphate
The rate of diffusivity of SO42- from ≈3% CsCl and ≈3% SrCO3 was similar
(p>0.05) and higher compared to the rate of diffusivity of SO42- from control and
≈3% SrCl2. The average rate of diffusivity of ≈3% SrCl2 (21 µg/cm2/day) was 3-7
times lower than all the CPSs (56 - 140 µg/cm2/day) in CSPW. Similar sequence
of diffusivity was observed in DW PFA: OPC diffusivity experiment. The average
rate of diffusivity of SO42- from ≈3% SrCl2 (17 µg/cm2/day) was 2.5 times lower
than all the CPSs (39-45 µg/cm2/day) in DW experiment. Contrary to PFA: OPC
CSPW diffusivity, the average rate of diffusivity of BFS: OPC ≈3% SrCO3 (16
µg/cm2/day) was 6-8 time lower than all the CPSs (99-129 µg/cm2/day) in CSPW
experiments. A notable lower range of pH values (7.41 – 8.69) was observed in
the test solutions with lowest diffusivity of SO42- compared to all the test solutions
which were measured to be on higher side.

199
7.5 Conclusions
1 In general the pH values were lower primarily due to the ionic strength of
the make-up water hindering diffusion of calcium ions, concentration of
calcium of the cement paste but again with both pore water and hydrate
composition changing with time, pH values were influenced accordingly.
2 Strontium diffusivity was dependent on the cation concentration of the
make-up water and the nature of the salt used. The composition of the
cement paste had a slight impact with BFS:OPC CPS favouring a more
rapid diffusion. Similar trends were observed for caesium paste samples.
3 Calcium concentration and the surrogate behaviour of strontium influenced
its leachability.
4 Sodium diffusivity was relatively similar for most experimental conditions.
5 Chloride concentration of the CSPW overshadowed any real effect of added
chloride as cation salt and/or the inert chloride in the CPSs.
6 The formation of sparing soluble sulphate salts affected sulphate diffusion.

200
(a)
(b)
Figure 7.1 Rate of diffusivity of cations (a) and anions (b) from control PFA: OPC
CPS in CSPW
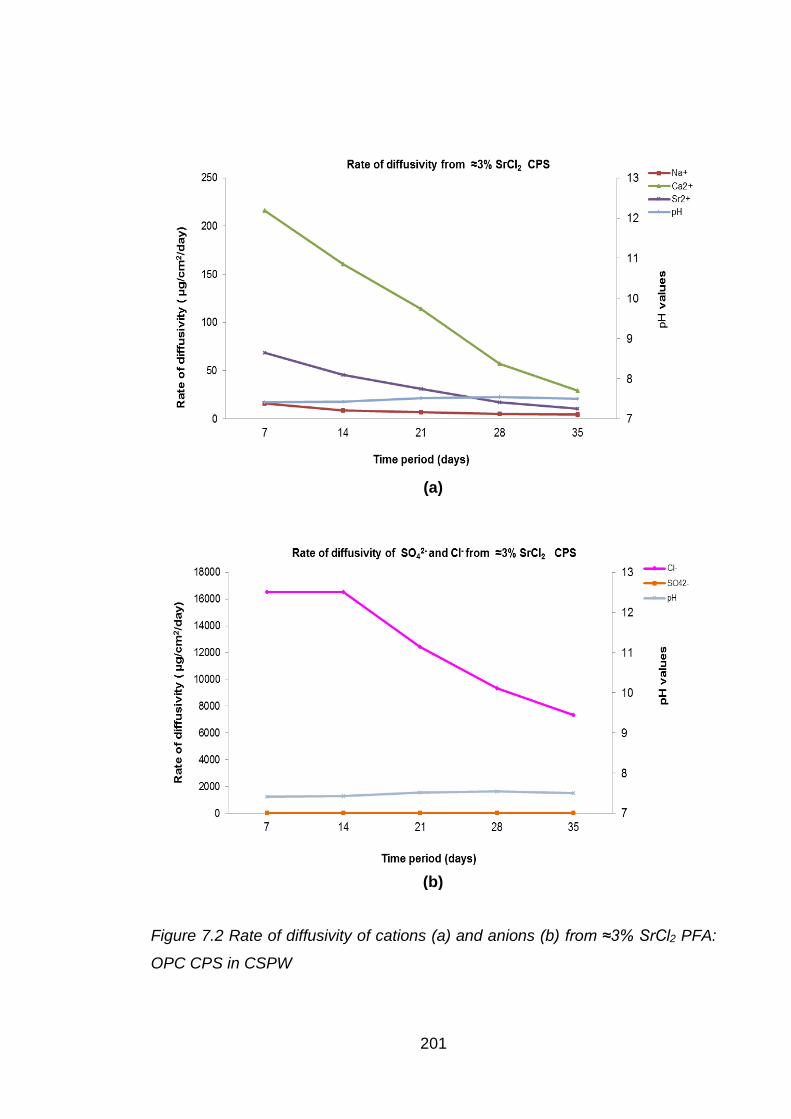
201
(a)
(b)
Figure 7.2 Rate of diffusivity of cations (a) and anions (b) from ≈3% SrCl2 PFA:
OPC CPS in CSPW

202
(a)
(b)
Figure 7.3 Rate of diffusivity of cations (a) and anions (b) from ≈3% CsCl PFA:
OPC CPS in CSPW
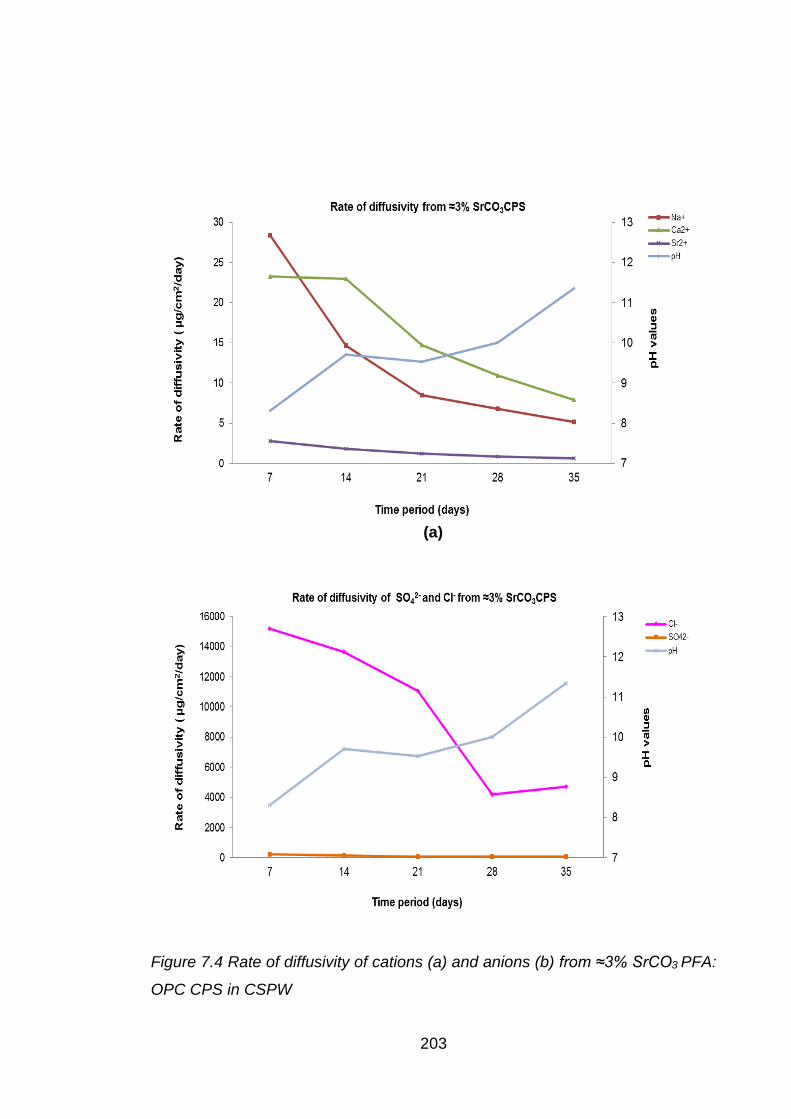
203
(a)
Figure 7.4 Rate of diffusivity of cations (a) and anions (b) from ≈3% SrCO3 PFA:
OPC CPS in CSPW

Chapter 8: Diffusivity from BFS:OPC CPSs with John Innes soil solution as a test solution

204
8.1 Aims of study
To evaluate the influence of microorganisms present in the John Innes soil
solution (JISS) on diffusivity of cations when encapsulated in BFS: OPC and to
compare the data from other diffusivity experiments.
8.2 Introduction
The present study investigated microbial influenced diffusivity of encapsulated
simulated waste when replicating conditions pertinent to GDF under aerobic
condition. The stability of the cementitious waste was assessed by subjecting the
encapsulated cement paste samples in closed circuit diffusivity experiments
using a test solution (JISS) containing microorganisms extracted from John Innes
No 3 soil. The JISS was prepared according to the protocol mentioned in section
2.5. John Innes compost is a set of four formulae for growing medium, developed
at the former John Innes Horticultural Institution (JIHI) in the 1930s. The formulae
contain loam, peat, sand or grit, and fertiliser in varying ratios for specific
purposes. John Innes Potting Compost No.3 is a richer mixture for final re-potting
of gross feeding vegetable plants and for mature foliage plants and shrubs in
interior planters or outdoor containers [124]. It was selected on the advice of Prof
G Morton, Principal Microbiologist (UCLan) [211] as this soil formula would
provide a typical microbial population that could reside in the vicinity of a GDF
site in the UK. It was also sufficiently rich in nutrients to sustain growth of
microorganisms in the JISS extract.
8.3 Cement paste samples
Diffusivity experiments were carried out on 4 different BFS:OPC CPSs, details of
which are mentioned in Table 8.1

205
Table 8.1 BFS:OPC cement paste samples and test solution used
Experiment BFS:OPC CPS Test solution
1
(a) Control John Innes soil (b) ≈3% SrCl2 solution (JISS) (c) ≈3% CsCl (f) ≈3% SrCO3
8.4 Results and discussion
The duration of dynamic diffusivity experiments (closed system) was 49 days.
The rate of diffusivity values of each cement paste sample are given in appendix
8.1 to 8.4.
8.5 Micropore and surface area analysis of CPS measured by BET method
The average micropore and surface area results of the cement paste samples
are shown in Table 8.2. The average values (top, middle and bottom) of
micropore area of the CPSs prior to the JISS diffusivity experiments were in the
range of 1.3 – 5.4 m2/g. The highest micropore area was measured with ≈3%
SrCl2 CPS. There was no significant difference in the micropore area of control
and ≈3% SrCO3. The cement paste sample containing ≈3% CsCl had the lowest
micro-pore area.
The average values (top, middle and bottom) of surface area of the CPSs were
in the range of 11.6 – 24.2 m2/g. The surface area of ≈3% SrCl2, control and ≈3%
SrCO3 CPS were in fairly similar range (21.2 – 24.2 m2/g). However, the average
surface area of ≈3% CsCl (11.6 m2/g) CPS was found to be lowest of all the
CPSs.

206
Table 8.2 Average micropore and surface area of cement paste samples
measured by BET method
CPS Micropore area
Surface area
(m2/g) Control 2.7 24.2
≈ 3% SrCl2 5.4 22.8 ≈ 3% CsCl 1.3 11.6
≈ 3% SrCO3 2.7 21.2
8.5.1 Test solution analysis
8.5.1.1 pH values
The pH values of JISS from control CPS after first few days of diffusivity increased
from 7.21 (natural pH value of JISS) to 10.73 – 11.2. (Figure 8.1). However, the
pH values of JISS from contaminated CPSs (≈ 3% SrCl2, ≈3% CsCl, and ≈ 3%
SrCO3) were measured in the range of 6.77 – 8.09 (Figure 8.2 to 8.4). The lowest
pH value (6.77) was measured in JISS from ≈3% CsCl on day 14.
8.5.1.2 Chemical analysis of test solutions
All the diffusivity data have been normalised for dilution effect and cation/anion
composition of JISS (Table 8.3). The diffusivity data of first 49 days from
BFS:OPC DW experiment have been utilised to validate the effect of JISS on
rates of diffusivity. The rates of diffusivity of cations and anions are presented in
Figure 8.1 to 8.4.
Table 8.3 Analysis of JISS
Sample Concentration in ppb pH Na+ Mg2+ K+ Ca2+ Fe3+ Cl- SO42-
JISS 1541 1009 3576 29 442 62 8588 7.21
207
Strontium
The average rate of diffusivity of Sr2+ (19 µg/cm2/day) in JISS from ≈ 3% SrCl2 at
pH 7.29 – 8.09 was ≈2 times lower than the average rate of diffusivity of Sr2+ (35
µg/cm2/day) in DW from ≈ 3% SrCl2 at pH 11.19 – 12.03 However, the effect of
JISS was more pronounced in ≈ 3% SrCO3. There was a ≈16 fold increase in the
average rate of diffusivity of Sr2+ from ≈ 3% SrCO3 in JISS (0.82 µg/cm2/day) at
pH 7.53 – 7.93 in comparison with DW (0.052 µg/cm2/day) ay pH 11.57 – 12.27.
Caesium
The effect of JISS on the diffusivity of added cation was more prominent in case
of ≈3% CsCl in comparison with ≈ 3% SrCl2 CPS. The average rate of diffusivity
of Cs+ in JISS (191 µg/cm2/day) was ≈ 4.7 times higher than the average rate of
diffusivity in DW (41 µg/cm2/day). However, the pH range of JISS from ≈3% CsCl
was lower (6.77 – 7.8) compared to DW from ≈3% CsCl CPS (10.4 – 11.57).
Calcium
Calcium from ≈ 3% SrCl2 CPS diffused out at faster rate compared to all the other
CPSs. The average rate of diffusivity of Ca2+ from ≈ 3% SrCO3 (18 µg/cm2/day)
was 3 times lower than the average rate of diffusivity of Ca2+ from ≈ 3% SrCl2 (60
µg/cm2/day). The lowest diffusivity of Ca2+ was measured in control CPS. It is
interesting to note that the pH values in JISS from control CPS were higher (10.73
– 11.2) in comparison with JISS from contaminated CPSs (6.77 – 8.09).
Comparing the results from DW BFS:OPC with JISS BFS:OPC diffusivity
experiments; the average rate of diffusivity of Ca2+ from ≈3% CsCl (0.99
µg/cm2/day) at pH (11.19 – 12.03) was measured 32 times lower than the
average rate of diffusivity of Ca2+ from ≈3% CsCl (32 µg/cm2/day) at pH (6.77 –
208
7.87) respectively. Similarly, the average rate of diffusivity of Ca2+ from ≈ 3%
SrCO3 (1.26 µg/cm2/day) was measured 14.5 times lower than the average rate
of diffusivity of Ca2+ from ≈3% CsCl (18.3 µg/cm2/day) respectively. However, the
difference was less prominent in case of ≈ 3% SrCl2, and control CPS.
Sodium
Sodium from ≈ 3% SrCl2 CPS diffused out at highest rate compared to all the
other CPSs in JISS diffusivity experiment. The sequence of diffusivity shown by
sodium was ≈ 3% SrCl2 > ≈3% CsCl > ≈ 3% SrCO3 > control. There was no
significant difference (p>0.05) observed in the rate of diffusivity of Na+ between
control and ≈ 3% SrCO3 CPS; however, the pH range of JISS from control was
higher (10.73 – 11.2) compared to ≈ 3% SrCO3 (7.53 – 7.93). The average rate
of diffusivity of Na+ from ≈3% CsCl (9.9 µg/cm2/day) in JISS was ≈4 times higher
than the average rate of diffusivity of Na+ from ≈3% CsCl (2.8 µg/cm2/day) in DW.
However there was no significance difference in the rate of diffusivity of Na+
between JISS and DW from ≈3% SrCl2 (p>0.05), ≈3% SrCO3 (p>0.05) and control
(p>0.05).
Chloride
The highest rate of diffusivity was measured from ≈3% SrCl2 CPS, followed by
≈3% CsCl, ≈3% SrCO3 and control. The average rate of diffusivity of Cl- from
control (4.2 µg/cm2/day) was 65 times lower than the average rate of diffusivity of
Cl- from ≈3% SrCl2 (270 µg/cm2/day). There was no significance difference
(p>0.05) between the rate of diffusivity of Cl- from ≈3% SrCO3 and control CPS.
In comparison with DW diffusivity experiment, the average rate of diffusivity of Cl-
from ≈3% SrCl2, in JISS (270 µg/cm2/day) was approximately twice as high as
measured in DW (142 µg/cm2/day). The effect of JISS on diffusivity of Cl- was
209
more prominent in case of ≈3% CsCl in comparison with DW. The average rate
of diffusivity of Cl- from ≈3% CsCl (206 µg/cm2/day) in JISS was ≈ 17 times higher
than the average rate of diffusivity of Cl- from ≈3% CsCl (12.4 µg/cm2/day) in DW.
However, Cl- from ≈3% SrCO3 (5 µg/cm2/day) and control (4.17 µg/cm2/day)
diffused out two times lower in JISS than in DW (9.5 and 8, respectively).
Sulphate
The sequence of diffusivity of SO42- shown in JISS was ≈3% SrCO3 > ≈3% CsCl
> control > ≈3% SrCl2. Sulphate from ≈3% SrCO3 diffused out at highest rate
compared to all the other CPS in JISS diffusivity experiment. The average rate of
diffusivity of SO42- from ≈3% SrCO3 (112 µg/cm2/day) was 6 times higher than the
average rate of diffusivity of SO42- from ≈3% SrCl2 (20 µg/cm2/day). Sulphate from
≈3% CsCl (75 µg/cm2/day) diffused out 1.5 times lower in comparison with ≈3%
SrCO3 (112 µg/cm2/day). Comparing the results from DW BFS:OPC with JISS
BFS:OPC diffusivity experiments; the average rate of diffusivity of SO42- from ≈3%
SrCO3 (6 µg/cm2/day) was 20 times lower than the average rate of diffusivity of
SO42- from ≈3% SrCO3 (112 µg/cm2/day); 13 times lower in DW (6 µg/cm2/day)
compared to JISS (75 µg/cm2/day) from ≈3% CsCl. However, there was no
significant difference in the rate of diffusivity observed between DW and JISS
from ≈3% SrCl2 (p>0.05) and control CPS (p>0.05).
8.5.2 Microbial community profile
All methods employed in this section were carried out as described in section 2.6
to 2.9
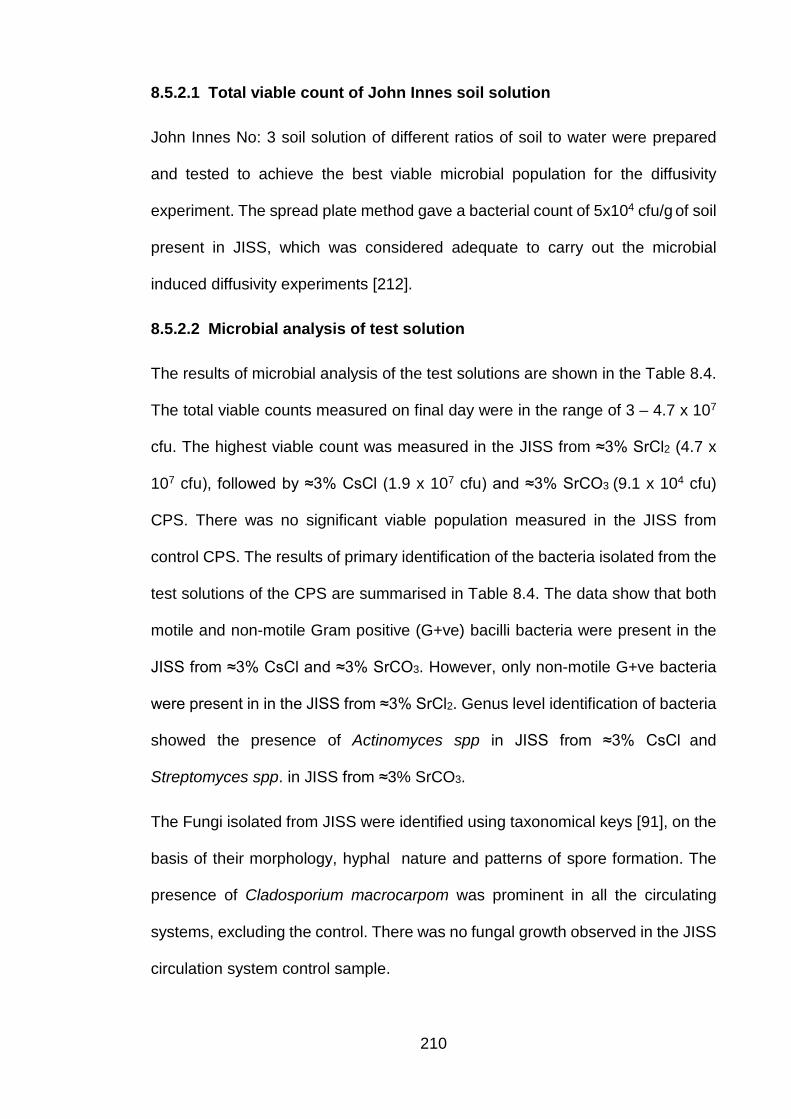
210
8.5.2.1 Total viable count of John Innes soil solution
John Innes No: 3 soil solution of different ratios of soil to water were prepared
and tested to achieve the best viable microbial population for the diffusivity
experiment. The spread plate method gave a bacterial count of 5x10⁴ cfu/g of soil
present in JISS, which was considered adequate to carry out the microbial
induced diffusivity experiments [212].
8.5.2.2 Microbial analysis of test solution
The results of microbial analysis of the test solutions are shown in the Table 8.4.
The total viable counts measured on final day were in the range of 3 – 4.7 x 10⁷
cfu. The highest viable count was measured in the JISS from ≈3% SrCl2 (4.7 x
107 cfu), followed by ≈3% CsCl (1.9 x 10⁷ cfu) and ≈3% SrCO3 (9.1 x 10⁴ cfu)
CPS. There was no significant viable population measured in the JISS from
control CPS. The results of primary identification of the bacteria isolated from the
test solutions of the CPS are summarised in Table 8.4. The data show that both
motile and non-motile Gram positive (G+ve) bacilli bacteria were present in the
JISS from ≈3% CsCl and ≈3% SrCO3. However, only non-motile G+ve bacteria
were present in in the JISS from ≈3% SrCl2. Genus level identification of bacteria
showed the presence of Actinomyces spp in JISS from ≈3% CsCl and
Streptomyces spp. in JISS from ≈3% SrCO3.
The Fungi isolated from JISS were identified using taxonomical keys [91], on the
basis of their morphology, hyphal nature and patterns of spore formation. The
presence of Cladosporium macrocarpom was prominent in all the circulating
systems, excluding the control. There was no fungal growth observed in the JISS
circulation system control sample.

211
Table 8.4 Summary table showing total viable count measured in JISS.
Experiment BFS:OPC CPS Total viable count (cfu) 1 (a) Control 3 (b) ≈3% SrCl2 4.7 x 10⁷ (c) ≈3% CsCl 1.9 x 10⁷ (f) ≈3% SrCO3 9.1 x 10⁴
Table 8.5 Summary table showing bacteria isolated from JISS
Experiment BFS:OPC PS Primary identification test
Gram stain motility 1 (a) Control NR* NR* (b) ≈3% SrCl2 G+ve - (c) ≈3% CsCl G+ve + - (f) ≈3% SrCO3 G+ve + -
*none recorded

212
8.6 Conclusion
1. Make-up water salts e.g. strontium; caesium chlorides had a significant
impact on the JISS test solution pH in comparison with the control cement
paste sample.
2. Test solution composition (JISS extract) retard strontium diffusivity but
accelerated caesium diffusion in comparison with distilled water values.
3. Although the calcium diffusivity values were affected by the added cation to
the make-up water the values for strontium were marginal but more
exaggerated for caesium.
4. Strontium had the greatest impact on the rate of sodium diffusion.
5. At the lower pH values of JISS test solution leaching at the solid cement
surface in addition to diffusion through pore water may be a contributory
factor.
6. Caesium or strontium has a similar effect on the average rate of chloride
diffusivity.
7. Strontium carbonate enhanced the diffusivity of sulphate ions.
8. Growth of microorganisms in control CPS was negligible in comparison to
contaminated CPSs.
9. The concentrations of Sr2+ and Cs+ in the JISS influenced the growth of
microorganisms (≈ 3 x10⁷ cfu).
10. There was a far greater amount of ions (Sr2+ and Cs+) in the JISS from 3%
SrCl2 and 3% CsCl CPS, in comparison from ≈3% SrCO3 CPSs which has
contributed to the lesser growth of microorganism (≈105 cfu).

213
(a)
(b)
Figure 8.1 Rate of diffusivity of cations (a) and anions (b) from control CPS in
JISS
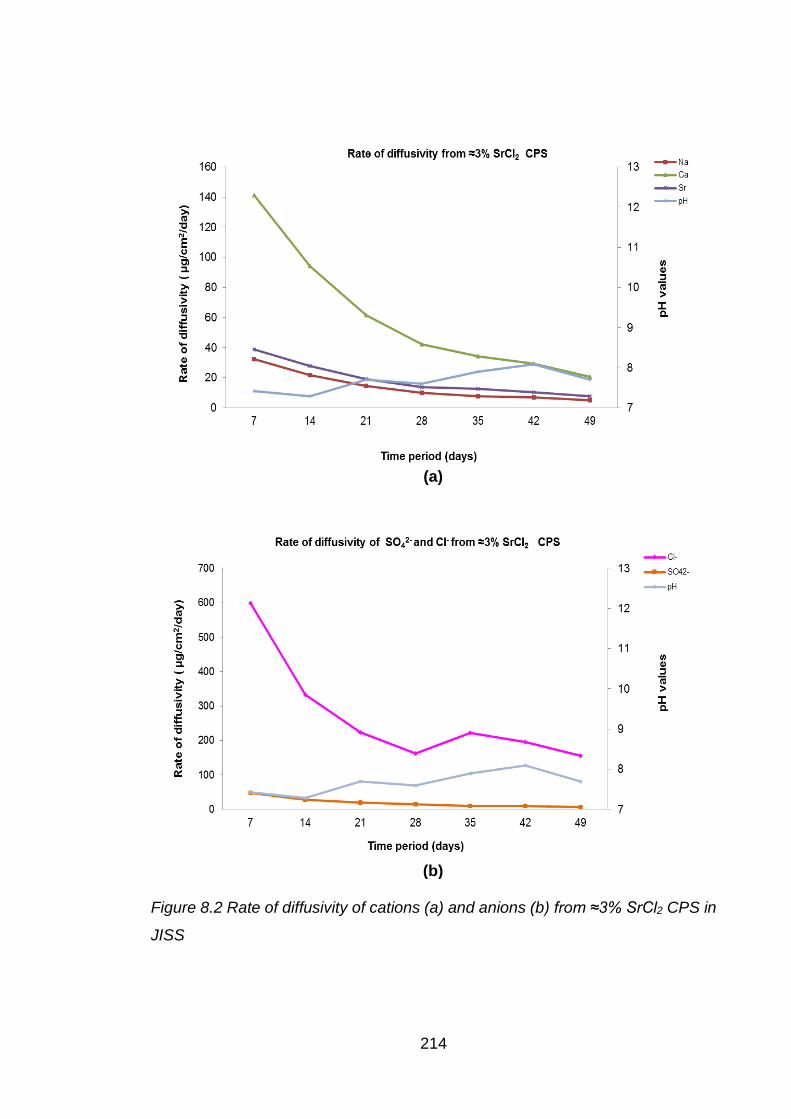
214
(a)
(b)
Figure 8.2 Rate of diffusivity of cations (a) and anions (b) from ≈3% SrCl2 CPS in
JISS
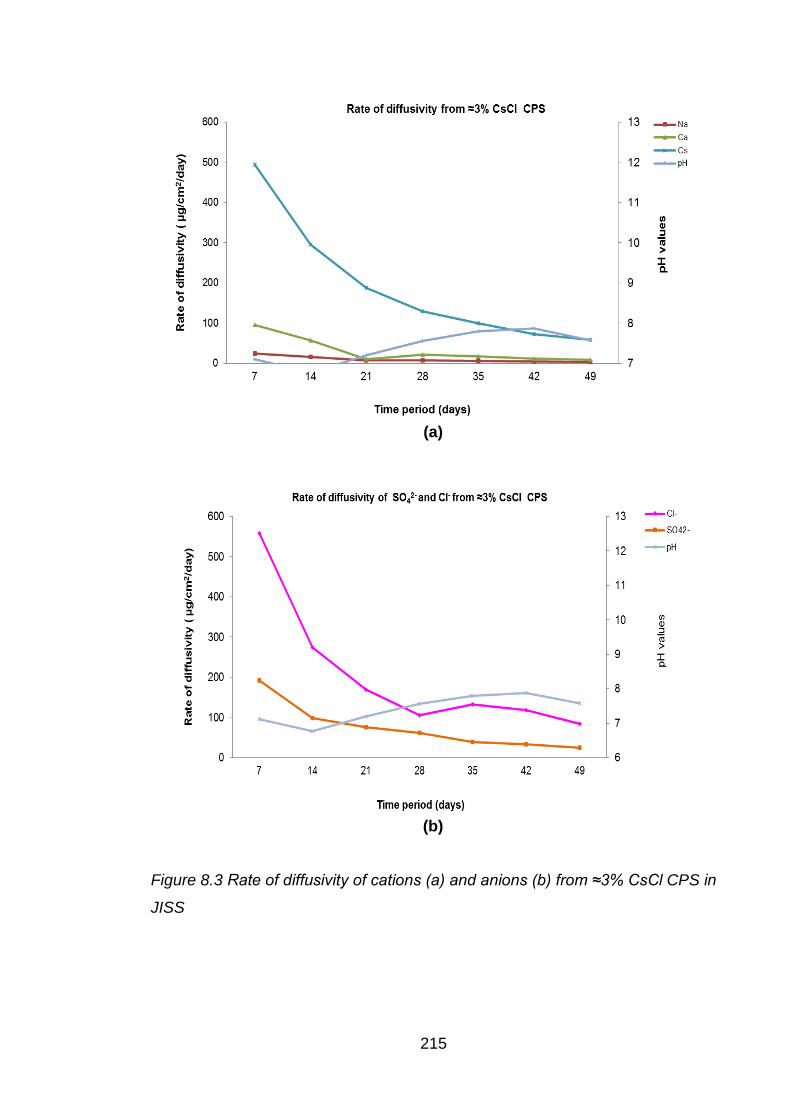
215
(a)
(b)
Figure 8.3 Rate of diffusivity of cations (a) and anions (b) from ≈3% CsCl CPS in
JISS
216
(a)
(b)
Figure 8.4 Rate of diffusivity of cations (a) and anions (b) from ≈3% SrCO3 CPS
in JISS

Chapter 9: Diffusivity from PFA:OPC CPSs with John Innes soil solution as a test solution
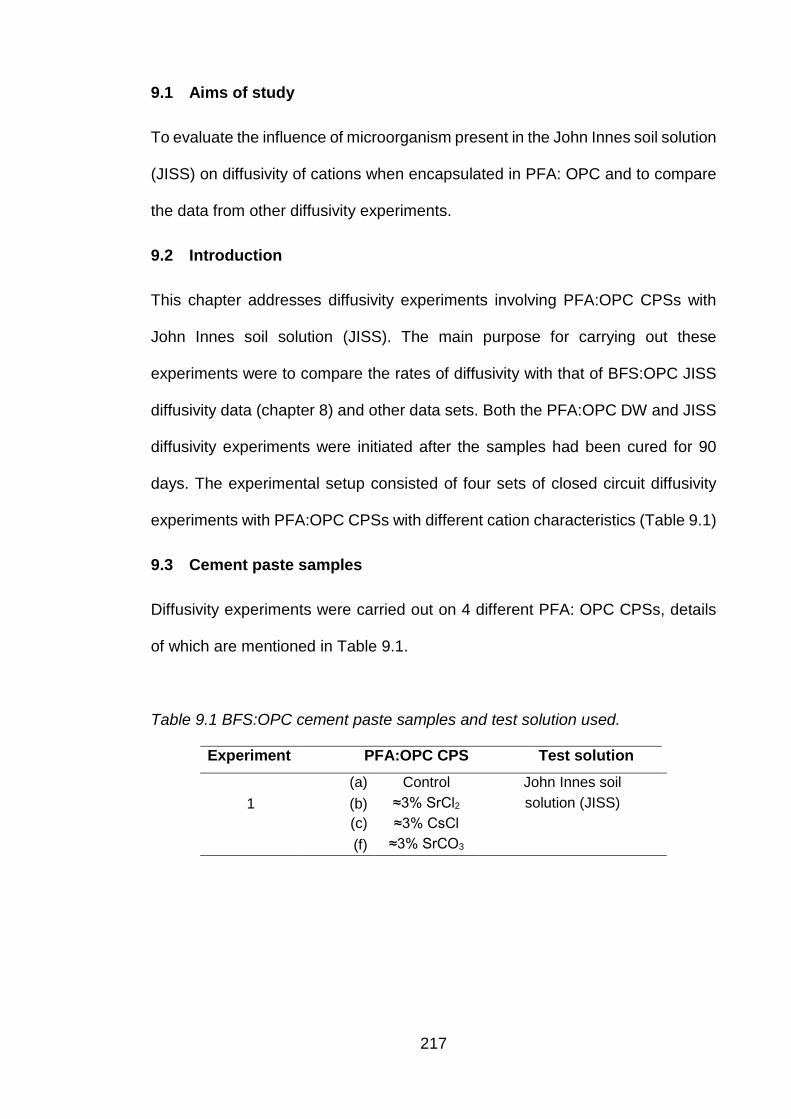
217
9.1 Aims of study
To evaluate the influence of microorganism present in the John Innes soil solution
(JISS) on diffusivity of cations when encapsulated in PFA: OPC and to compare
the data from other diffusivity experiments.
9.2 Introduction
This chapter addresses diffusivity experiments involving PFA:OPC CPSs with
John Innes soil solution (JISS). The main purpose for carrying out these
experiments were to compare the rates of diffusivity with that of BFS:OPC JISS
diffusivity data (chapter 8) and other data sets. Both the PFA:OPC DW and JISS
diffusivity experiments were initiated after the samples had been cured for 90
days. The experimental setup consisted of four sets of closed circuit diffusivity
experiments with PFA:OPC CPSs with different cation characteristics (Table 9.1)
9.3 Cement paste samples
Diffusivity experiments were carried out on 4 different PFA: OPC CPSs, details
of which are mentioned in Table 9.1.
Table 9.1 BFS:OPC cement paste samples and test solution used.
Experiment PFA:OPC CPS Test solution
1
(a) Control John Innes soil (b) ≈3% SrCl2 solution (JISS) (c) ≈3% CsCl (f) ≈3% SrCO3

218
9.4 Result and discussion
The closed circuit dynamic diffusivity experiments were carried out for 49 days.
The rate of diffusivity values of each cement paste sample are given in appendix
9.1 to 9.4.
9.4.1 Micropore area and surface area analysis of CPS
The average micropore and surface area results of the dissected CPSs are
shown in the Table 9.2. The average micropore area of the CPSs prior to the
diffusivity experiments were in the range of 3 – 3.9 m2/g. The highest micropore
area was measured in control CPS. There was no significant difference observed
in the micropore area of ≈ 3% CsCl and ≈3% SrCO3 CPS. The CPS containing ≈
3% SrCl2 had the lowest micropore area compared to all the other CPSs in the
present experiment.
The average surface area of cement paste samples were in the range of 22.7 –
40.6 m2/g. The average surface area ≈ 3% SrCl2 was found to highest of all the
CPSs. The lowest surface area was measured in control CPS.
Table 9.2 Average micropore and surface area of cement paste samples
measured by BET method
Sample Micropore area Surface area m2/g
Control 3.9 22.7 ≈3% SrCl2 3 40.6 ≈3% CsCl 3.6 27.4
≈3% SrCO3 3.7 23.8
219
9.5 Test solution analysis
9.5.1 pH values
The pH values of JISS after the first few days of the diffusivity experiment
increased from 7.21 (natural pH of JISS) to 8.07 - 12.27 (Figure 9.2 to 9.5). Lower
pH values (8.07- 8.47) were measured in the JISS from ≈3% SrCl2. The pH values
of JISS from control and ≈ 3% SrCO3 CPSs were found to be in similar range.
Similar trend of pH values were observed in case of PFA: OPC DW diffusivity
experiments. There was no significant difference in the trend of pH values
observed in PFA: OPC JISS and DW diffusivity experiments contrary to BFS:
OPC JISS and DW diffusivity comparative studies.
9.5.2 Chemical analysis of test solution
All the diffusivity data have been normalised for comparative purpose. The
diffusivity data from PFA: OPC DW experiment have been utilised to validate the
effect of JISS on rates of diffusivity of PFA: OPC CPSs. The rates of diffusivity
of cations and anions are presented in Figure 9.2 to 9.5.
Strontium
The average rate of diffusivity of Sr2+ in JISS from ≈ 3% SrCl2 (103 µg/cm2/day)
was considerably higher than the average rate of diffusivity of Sr2+ from ≈ 3%
SrCO3 (0.032 µg/cm2/day). However, there was no significant difference (p>0.05)
measured in the rate of diffusivity between JISS and DW diffusivity experiment.
The average rate of diffusivities of Sr2+ from ≈ 3% SrCl2 CPS (103 µg/cm2/day)
and ≈ 3% SrCO3 (0.032 µg/cm2/day) in JISS were in fairly similar range with that
of DW diffusivity (≈ 3% SrCl2 (134 µg/cm2/day), ≈ 3% SrCO3 (0.036 µg/cm2/day)
in similar range of pH values. Comparing the results from JISS BFS: OPC with

220
JISS PFA: OPC diffusivity experiments; the average rate of diffusivity of Sr2+ was
measured 5.5 times lower from ≈ 3% SrCl2 (18.6 µg/cm2/day) and 25 times higher
from 3% SrCO3 (0.82µg/cm2/day) than the average rate of diffusivity of Sr2+ from
≈ 3% SrCl2 (103 µg/cm2/day) and ≈ 3% SrCO3 (0.032 µg/cm2/day) respectively.
However, the pH values of JISS from ≈ 3% SrCO3 PFA: OPC CPS were in the
range of 11.99 – 12.19 compared to JISS from ≈ 3% SrCO3 BFS: OPC CPS,
which were measured in the range of 7.53 – 7.93.
Caesium
There was no significant difference (p>0.05) observed in the rate of diffusivity
between JISS and DW diffusivity experiments. The average rate of diffusivity of
Cs+ from ≈ 3% CsCl (310 µg/cm2/day) in JISS was similar with DW diffusivity of
Cs+ from ≈ 3% CsCl (363 µg/cm2/day) at similar range of pH values. In
comparison with JISS BFS:OPC diffusivity results; the average rate of diffusivity
of Cs from PFA:OPC ≈ 3% CsCl (310 µg/cm2/day) in JISS was 1.6 times higher
than the BFS:OPC diffusivity (191 µg/cm2/day). However, the pH values of JISS
from ≈ 3% CsCl PFA: OPC CPS were in the range of 11.63 – 11.98 compared to
JISS from ≈ 3% CsCl BFS: OPC CPS, which were in the range of 6.77 – 7.87.
Calcium
Calcium from ≈ 3% SrCl2 CPS diffused out at faster rate compared to all the other
CPSs in JISS diffusivity experiments. In comparison with control (2.1 µg/cm2/day)
CPS; the average rate of diffusivity of Ca from ≈ 3% SrCl2 (158 µg/cm2/day) was
76 times higher and 1.6 times higher than ≈ 3% CsCl (3.2 µg/cm2/day) CPS.
Calcium from ≈ 3% SrCO3 diffused out at slower rate compared to all the other
CPS. The average rate of diffusivity of Ca from ≈3% CsCl (3.2 µg/cm2/day) and
control (2.1 µg/cm2/day) in JISS was ≈2 times higher than the average rate of

221
diffusivity of Ca2+ in DW ((≈3% CsCl (1.6 µg/cm2/day) and control (1.2
µg/cm2/day)) respectively. However there was no significant difference in the rate
of diffusivity of Ca2+ between JISS and DW from ≈3% SrCl2 (p>0.05) and ≈3%
SrCO3 (p>0.05). Comparing the results of BFS: OPC with PFA: OPC in JISS, the
rate of diffusivity of Ca2+ from PFA: OPC CPSs was considerably lower than the
rate of diffusivity of Ca2+ from all the BFS: OPC CPSs excluding ≈3% SrCl2. The
average rate of diffusivity of Ca from PFA: OPC ≈3% SrCl2 (158 µg/cm2/day) in
JISS was 2.6 times higher than the BFS: OPC diffusivity (60 µg/cm2/day) at
similar range of pH values, although the concentration of Ca2+ in BFS:OPC CPSs
(565 -602 mmoles) is higher than PFA:OPC CPS (138 - 148 mmoles).
Sodium
The average rate of diffusivity of Na+ from ≈3% SrCl2 (49 µg/cm2/day) CPS was
found to be highest of all the samples and was measured as ≈2 times higher than
control (22 µg/cm2/day) CPS. However, there was no significant difference found
in the diffusivity of Na+ from control (22 µg/cm2/day), ≈3% CsCl (18 µg/cm2/day)
and ≈3% SrCO3 (24 µg/cm2/day) cps. The average rates of diffusivity of Na+
from all the CPSs in JISS was relatively similar with DW diffusivity of Na+ from all
the CPSs. Comparing the results of BFS: OPC with PFA:OPC in JISS, the rate
of diffusivity of Na+ from PFA:OPC CPSs was ≈3 times higher than the rate of
diffusivity of Na+ from all the BFS:OPC CPSs. This could be due to the
concentration of Na+ present in PFA:OPC CPSs (25.1 -27 mmoles) in comparison
with BFS:OPC CPSs (11.9 – 12.7 mmoles)
Chloride
The highest rate of diffusivity was measured from ≈3% SrCl2, followed by ≈3%
CsCl, control and ≈3% SrCO3. The average rate of diffusivity of Cl- from ≈3%
222
SrCl2 (1405 µg/cm2/day) was 4 times higher than the average rate of diffusivity of
Cl- from ≈3% CsCl (352 µg/cm2/day). There was no significance difference
(p>0.05) between the rate of diffusivity of Cl- from ≈3% SrCO3 and control CPS.
The rates of diffusivity of Cl- from all the CPSs in JISS were similar with DW
diffusivity rates of Cl- from all the CPSs. In comparison with BFS: OPC JISS
diffusivity experiment, the rate of diffusivity of Cl- from PFA:OPC CPSs were ≈2
times higher the rate of diffusivity of Cl- from all the BFS:OPC CPSs excluding
≈3% SrCl2; which was 5.2 times higher than the BFS: OPC diffusivity (270
µg/cm2/day) at fairly similar range of pH values.
Sulphate
The average rate of diffusivity of SO42- form control (46 µg/cm2/day), ≈3% CsCl
(53 µg/cm2/day) and ≈3% SrCO3 (46 µg/cm2/day) was similar and ≈ 3.5 higher
than the average rate of diffusivity of SO42- from ≈3% SrCl2 CPS. A similar
grouping of diffusivity pattern was measured in PFA: OPC DW diffusivity
experiments (Figure 9.1). Comparing the results from DW PFA: OPC with JISS
PFA: OPC diffusivity experiments; the average rate of diffusivity of SO42- from
≈3% CsCl (34 µg/cm2/day) and ≈3% SrCO3 (31 µg/cm2/day) was measured ≈ 1.7
times lower than the average rate of diffusivity of SO42- from ≈3% CsCl (53
µg/cm2/day) and ≈3% SrCO3 (54 µg/cm2/day) respectively. However, there was
no significant difference in the rate of diffusivity of SO42- between JISS and DW
from control (p>0.05) and ≈3% SrCl2 (p>0.05). BFS:OPC JISS SO42- diffusivity
rates of all the CPS were relatively similar to PFA:OPC JISS diffusivity rates,
except in case of ≈3% SrCO3; which was twice as high compared to PFA:OPC.
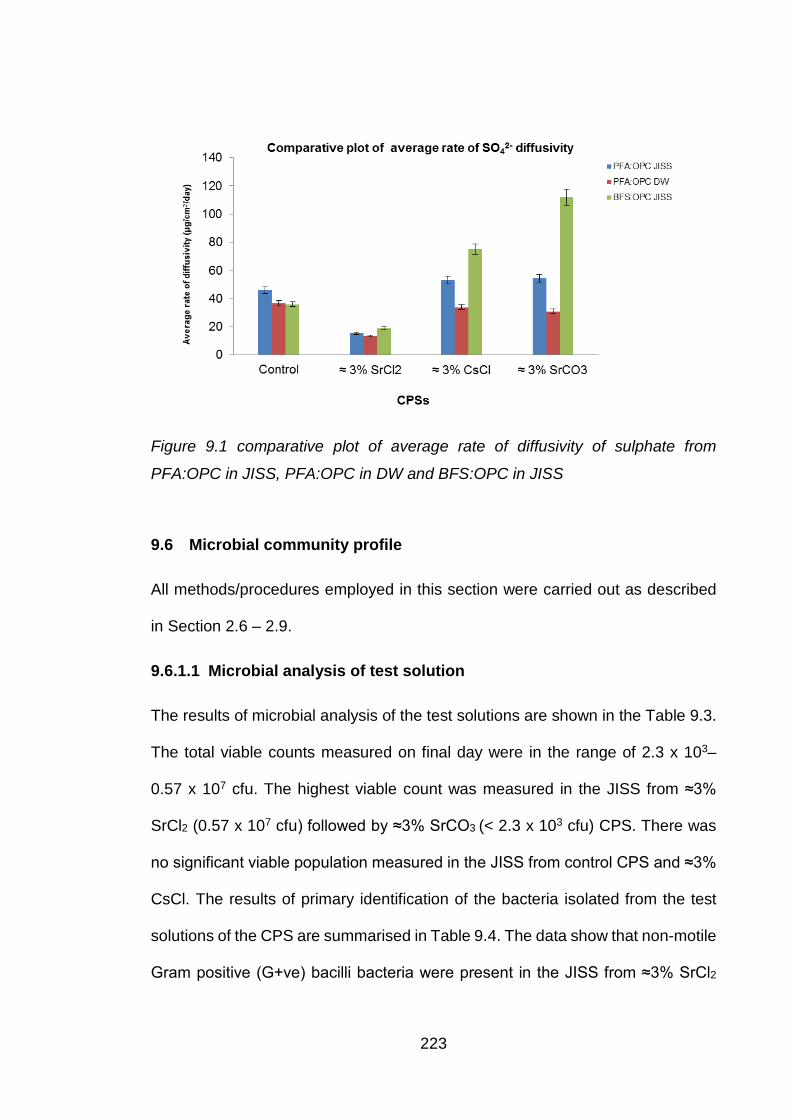
223
Figure 9.1 comparative plot of average rate of diffusivity of sulphate from
PFA:OPC in JISS, PFA:OPC in DW and BFS:OPC in JISS
9.6 Microbial community profile
All methods/procedures employed in this section were carried out as described
in Section 2.6 – 2.9.
9.6.1.1 Microbial analysis of test solution
The results of microbial analysis of the test solutions are shown in the Table 9.3.
The total viable counts measured on final day were in the range of 2.3 x 10³–
0.57 x 10⁷ cfu. The highest viable count was measured in the JISS from ≈3%
SrCl2 (0.57 x 10⁷ cfu) followed by ≈3% SrCO3 (< 2.3 x 10³ cfu) CPS. There was
no significant viable population measured in the JISS from control CPS and ≈3%
CsCl. The results of primary identification of the bacteria isolated from the test
solutions of the CPS are summarised in Table 9.4. The data show that non-motile
Gram positive (G+ve) bacilli bacteria were present in the JISS from ≈3% SrCl2
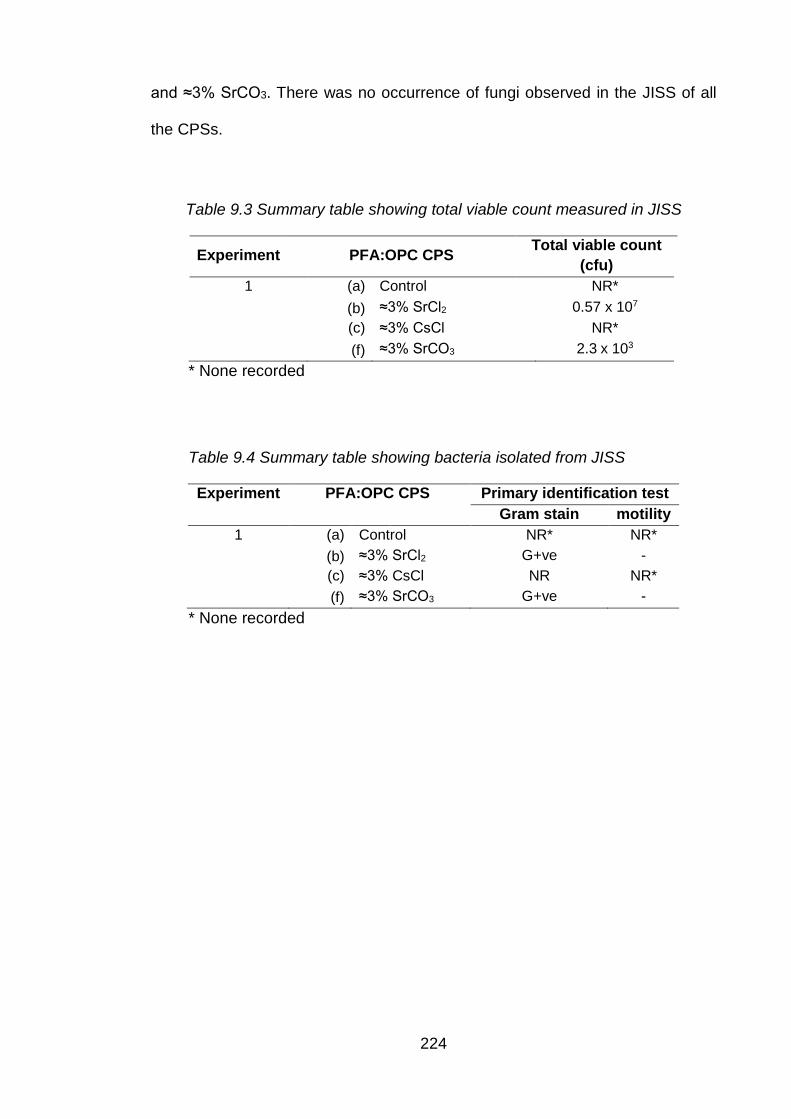
224
and ≈3% SrCO3. There was no occurrence of fungi observed in the JISS of all
the CPSs.
Table 9.3 Summary table showing total viable count measured in JISS
Experiment PFA:OPC CPS Total viable count (cfu)
1 (a) Control NR* (b) ≈3% SrCl2 0.57 x 10⁷ (c) ≈3% CsCl NR* (f) ≈3% SrCO3 2.3 x 10³
* None recorded
Table 9.4 Summary table showing bacteria isolated from JISS
Experiment PFA:OPC CPS Primary identification test Gram stain motility 1 (a) Control NR* NR* (b) ≈3% SrCl2 G+ve - (c) ≈3% CsCl NR NR* (f) ≈3% SrCO3 G+ve -
* None recorded

225
9.7 Conclusions
1 Strontium chloride ‘buffered’ the pH value of the initial test solution to around
8.5 compared with the control, caesium chloride and strontium carbonate
cement paste samples pH values were nearer to 12.
2 Comparative trends for strontium chloride and strontium carbonate cement
paste samples with JISS and DW were similar.
3 The cement paste formulation influenced the strontium diffusion rate.
4 Caesium diffused quicker from PFA:OPC CPS than the BFS:OPC counter-
part, but pH values differed significantly.
5 Strontium added as chloride enhances calcium diffusion unlike caesium that
had a marginal effect on calcium diffusion.
6 Calcium diffusion is greater from BFS:OPC than PFA:OPC CPS which could
be attributed to the higher concentration of calcium in the cement paste
sample.
7 Although strontium chloride influenced sodium diffusion, the impact on the
rates was comparatively small.
8 Diffusivity from strontium chloride cement pastes were the highest, which
could be attributed to the higher chloride of the cement paste.
9 Diffusion rates of sulphate from all PFA cement paste samples were small
in comparison with diffusion rates for BFS:OPC CPSs.
10 The encapsulated 3% CsCl caused Na+ and K+ to leach out at very early
stage in the experiment resulting in the lack of or poor growth of
microorganisms in PFA:OPC CPSs.
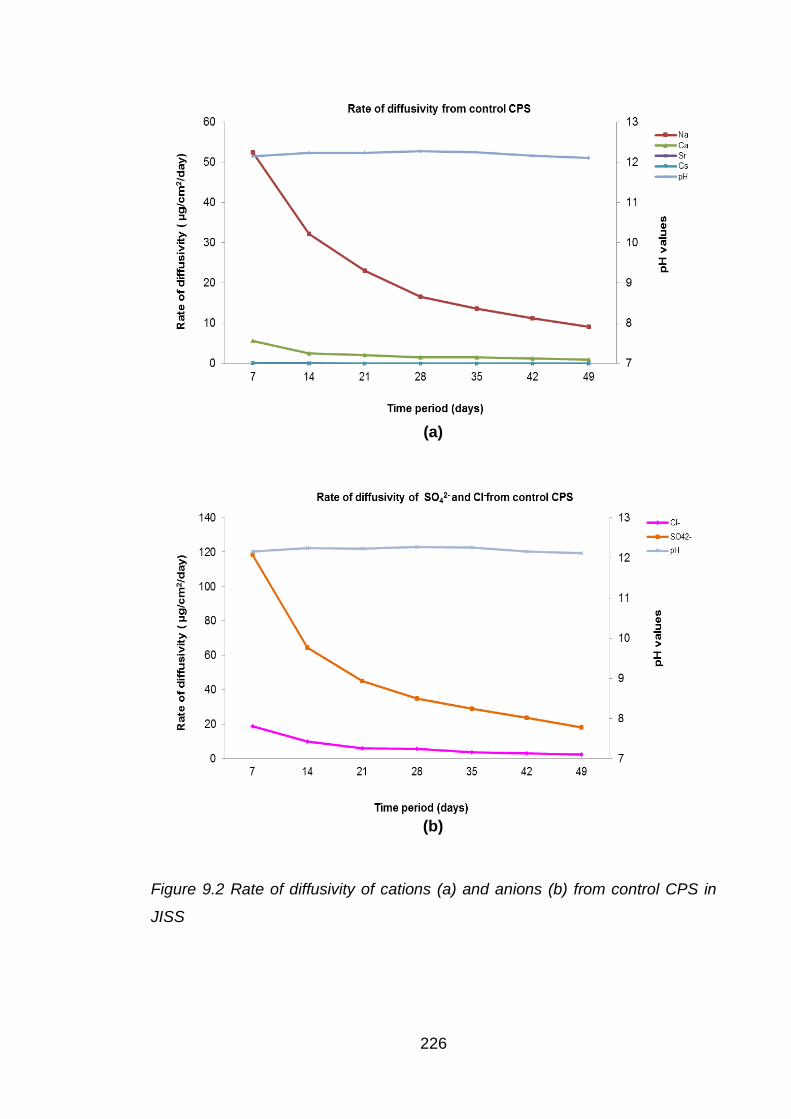
226
(a)
(b)
Figure 9.2 Rate of diffusivity of cations (a) and anions (b) from control CPS in
JISS
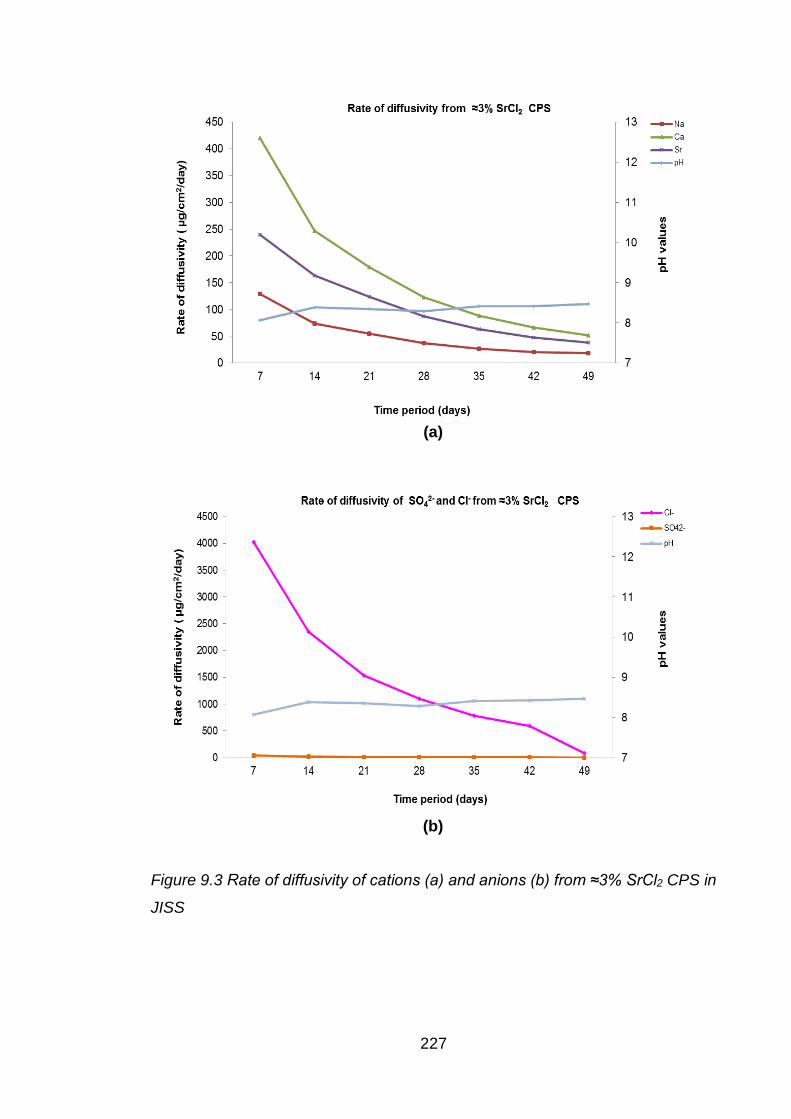
227
(a)
(b)
Figure 9.3 Rate of diffusivity of cations (a) and anions (b) from ≈3% SrCl2 CPS in
JISS
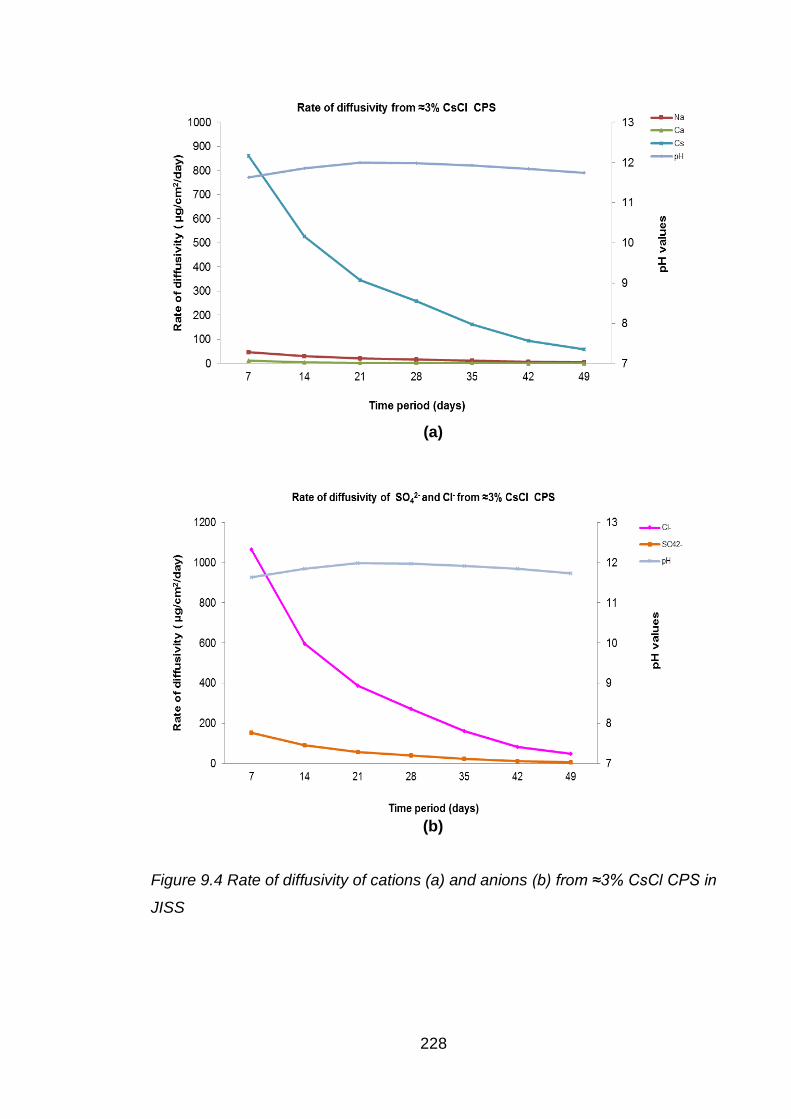
228
(a)
(b)
Figure 9.4 Rate of diffusivity of cations (a) and anions (b) from ≈3% CsCl CPS in
JISS
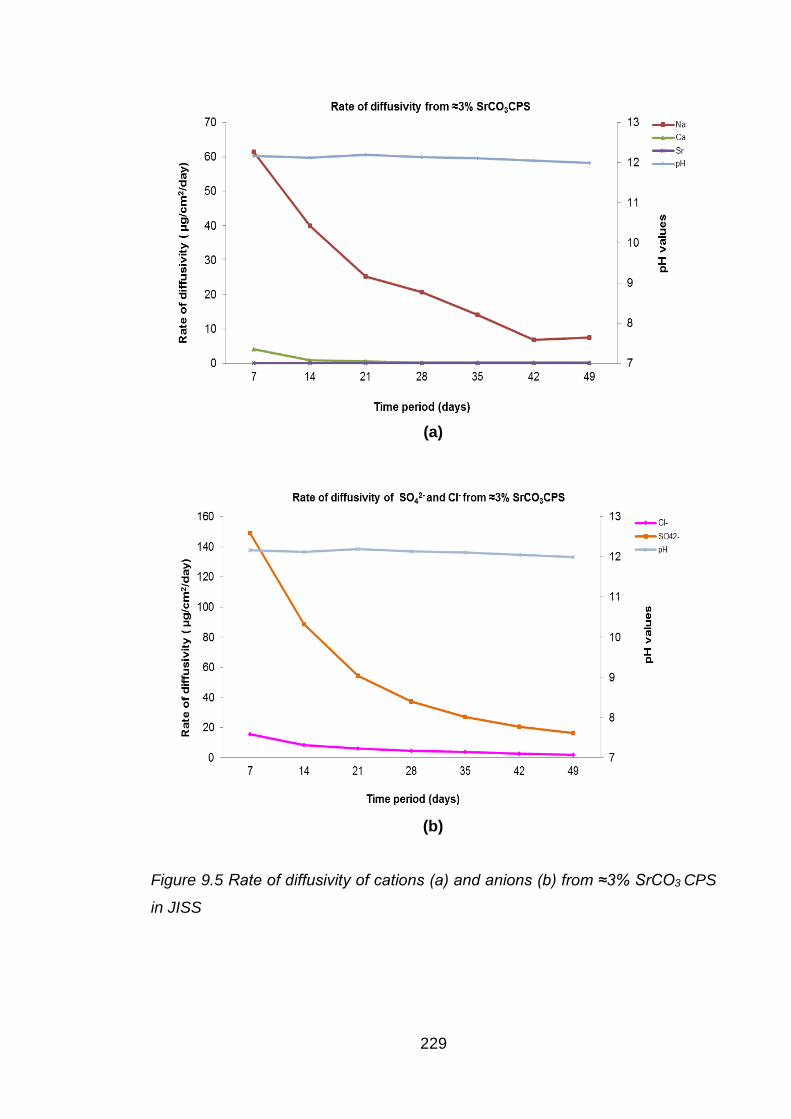
229
(a)
(b)
Figure 9.5 Rate of diffusivity of cations (a) and anions (b) from ≈3% SrCO3 CPS
in JISS

Chapter 10: Conclusions
230
10.1 Generic conclusion
The main aim of this project was to evaluate the diffusivity of strontium, caesium
and cobalt when added as inactive forms to OPC:BFS and PFA:OPC cement
composition. Additional aims were to investigate the effects physic-chemical
parameters on the diffusivity of cement paste samples. This work significantly
contributes to the knowledge of factors influencing the diffusivity of encapsulated
cations i.e. composition of cement paste (BFS:OPC and PFA:OPC), hydration of
cement, added salt to the makeup water, pore water chemistry and, nature of
leachant/aqueous solution and its condition (stagnant or mobile). The aims of
these studies have therefore been achieved and the following conclusions have
been drawn on at least one occasion in chapters 4 to 9 and can therefore be
regarded as generic.
1. The make-up water composition affected the segregation of inherent/added
cations in the cement paste samples and also both the bleed water volume
and physical characteristics of the cement paste samples.
2. Strontium when added as a soluble salt to the make-up water influences the
rate of diffusivity. The composition of the cement paste had a slight impact
with PFA:OPC favouring a more rapid diffusion. Similar trends were
observed for caesium paste samples.
3. The diffusivity of Sr2+ and other cations is dependent upon its concentration
and cement additive used in the cement paste formulation.
4. The concentration of the added salt to the make-up water also affects
diffusivity.
5. Diffusivity of chloride ions from the cement paste sample is dependent on
the concentration of chloride in the make-up water.
231
6. Both caesium and strontium influence calcium diffusion when compared
with the corresponding control CPS. This is not surprising for strontium as
it will be a good surrogate for calcium and hence take part in some of the
hydrates produced during curing. Caesium has a lower impact on calcium
diffusivity.
7. The diffusivity of sulphate was influenced by the nature of the cation added
to the make-up water. Strontium had the greatest effect on lowering the
diffusion primarily due to the formation of sparingly soluble strontium
sulphate.
8. Calcium diffusion was affected by both nature of the cation added to make-
up water and its concentration. This effect was less marked for caesium
contaminated CPSs. Calcium diffusion is greater from BFS:OPC CPS than
PFA:OPC which could be attributed to the higher concentration of calcium
in the cement paste sample.
9. In general, the pH values were lowered primarily due to the ionic strength
of the make-up water hindering diffusion of calcium ions, concentration of
calcium of the cement paste but again with both pore water and hydrate
composition changing with time pH values were influenced accordingly.
10. The JISS test solution composition retard strontium diffusivity but
accelerated caesium diffusion in comparison with distilled water values, this
retardation could be due to the inherent sulphate content (≈8600 ppb) of the
JISS test solution.
11. Growth of microorganisms in control CPS was negligible in comparison to
contaminated CPSs.
12. The concentrations of Sr2+ and Cs+ in the JISS influenced the growth of
microorganisms (≈ 3 x10⁷ cfu).

232
13. There was a far greater amount of ions (Sr2+ and Cs+) in the JISS from ≈3%
SrCl2 and ≈3% CsCl BFS:OPC CPSs, in comparison from ≈3% SrCO3 CPSs
which has contributed to the lesser growth of microorganism (≈105 cfu).
14. The encapsulated 3% CsCl causes Na+ and K+ to leach out at very early
stage in the experiment resulting in the lack of or poor growth of
microorganisms in PFA:OPC CPSs.
15. The cumulative effect of presence of motile bacteria, fungi and presence of
humic substances might have lowered the pH and influenced the diffusivity
of cation from BFS:OPC CPSs.
16. Diffusion rates of sulphate from all PFA cement paste samples were small
in comparison with diffusion rates for BFS:OPC CPSs.
Controlling the compositions of the make-up water and cement paste can be
made to influence the diffusivity of strontium ions. Cement pastes with a high
sulphate content will also retard the diffusivity. No conditions/additives studied in
these experiments were able to control caesium diffusion.
10.2 Implication of findings to nuclear industry
In most leach experiments cement paste samples are contacted with a solution
(normally distilled water) for a period of time, usually 20 days; the samples are
removed and contacted with fresh distilled water for a further period. All
subsequent solutions (DW) are analysed for the appropriate target. This
approach unlike ours ensures that:
(a) the sample approximates a semi-infinite medium, which in practise means
that no material is leached out of locations farthest away from the exposed
surfaces
233
(b) the concentration gradients at the surface of the cement sample and leach
solution are virtually zero i.e. zero boundary concentration
(c) the solubilities of leached ions control diffusivity and leaching
(d) re-adsorption of ions is low.
It is unlikely however that this scenario will replicate ground water seepage into
an underground nuclear repository and subsequently come in to contact with
encapsulated wastes. The scheme i.e. closed circuit recirculation adopted in this
research would be more fitting of the real situation i.e. stagnation followed by
percolation and therefore diffusivity of ions will be greatly influenced by the test
solution chemistry and composition. In all other aspects our experimental
arrangement confers with ANSI/ANS 16.1 standard [213], namely:
(a) the cations were well mixed in the cement formulation prior to leaching
(b) the cement surface is continuously exposed to the test solution
(c) temperature is kept relatively constant
(d) the cement formulation is homogeneous (this may not be the case for
SrCO3 contaminated cement formulations)
10.2.1 Diffusion of ions from encapsulated waste
In cement paste, the diffusive transport of ions takes place in the micropores as
long as they maintain a continuous pathway. The rather large ratio of micropore
diameter to the diameter of the hydrated ions such as cations, chloride etc.
encountered in cement paste allows for a continuum description of diffusive
transport of ions through the saturated pores. The leaching process consists of
physic-chemical phenomena in which diffusion plays a crucial role. Fick’s law
alone is not always sufficient for a reasonable full description of the fundamental

234
processes involved in the kinetics of leaching. Factors that have an important
effect on the elution process are:
a. the heterogeneity of the cement paste sample including the pore structure
and the changes that take place when calcium hydroxide is lost to the test
solution
b. physic-chemical mechanisms through which the retention properties of the
cement sample might be impaired under the prolonged contact with test
solution.
It is known that for sparingly soluble salts, strontium carbonate is a good example
in our case, a low rate of salt dissolution in the embedding hydrophobic matrix
leads to completely different release kinetics.
The depth of dissolution studies in this research indicated that the diffusivity of
Sr2+ when added as carbonate salt revealed diffusion of few micron from the
surface of the CPS. Reference studies have shown that addition of calcium
carbonate serves two functions; one as an active participant in the hydration
process of cement paste, affecting the amount of free calcium hydroxide, and
AFm and AFt phases [44]. The sulphate ions that are released from AFm in the
course of carbonation reacts with water and Ca(OH)2 leading to formation of
ettringite. This ettrigite formation increases the molar volume of the solids present
in paste enhancing the space-filling of paste, resulting in reduction of porosity and
permeability of hardened cement pastes [44]. Encapsulation of cations as
carbonate salt may lower the diffusivity of some cations; however, may not be the
case for caesium. Caesium carbonate is very soluble in comparison with
sparingly soluble strontium carbonate. Therefore, lowered diffusivity of caesium
when added as carbonate salt will have to be due to reduced porosity of hardened

235
cement paste and not due to any changes in the binding mechanism of Cs+ when
added as carbonate salt. Caesium is highly soluble in alkaline pore water of
cement paste sample along with the other inherent soluble cations Na+, K+. Based
on the solubility, cations/radionuclides encapsulated in cement paste fall under
two categories; the ones which are soluble in alkaline pore water of hardened
cement paste such as caesium and Iodine, whereas insoluble cations include
nickel and cobalt which remain immobilised as long as the pH of the pore water
remains alkaline. Data generated from ≈1.3% CoCl2 BFS:OPC CPS showed
correlation of test solution pH values and cumulative concentration of Co2+
leached in the test solution. However, the fact that Sr2+ replaces Ca2+ in the
cement paste mixture, our studies have shown direct correlation between
diffusivity of Sr2+ and total amount of Ca2+ present in the CPS; depending on the
type of formulation (BFS:OPC, PFA:OPC). The rate of diffusivity and the depth of
cation diffusion was significantly higher in ≈3% SrCl2 PFA:OPC having 147
mmoles of Ca2+ compared to its BFS counterpart having 602 mmoles of Ca2+.
Thus it can be deduced that maintaining Ca:Sr cations ratio play an important
role for encapsulation of Sr2+. This also indicates that the PFA:OPC formulation
may not be suitable for Sr2+ encapsulation due to lower wt% of calcium present
in PFA (1.30) in comparison with BFS (38.22). The percentage of Ca2+ in PFA
can be increased by incorporation of calcium chloride in PFA:OPC mixture to
improve the binding capacity of Sr2+ in PFA:OPC hardened cement paste.
Calcium chloride has been used as an accelerator for hydration of calcium
silicates (C3S) for many decades in cement industry [214]. Calcium chloride has
been shown to increase the resistance to the weathering of the cementitious
material and faster cure rate than plain concrete [16]. Studies have shown that
the final concrete set time is reduced by two-thirds upon addition of two per cent
236
calcium chloride to cement paste mix [52]. A wealth of information is available on
the usage of CaCl2 in cement paste mixtures [52, 214, 215].
10.2.2 Diffusion of caesium ions from cement matrix
The faster diffusivity of Cs+ in our studies (calculated De = 1.06 x 10⁻⁵ cm2/day),
which increases with increase in ionic concentration of leach/test solution
(DSPW, CSPW) may have potential impact on environment taking into
consideration its transport from near to far-field and subsequent accumulation in
food web originating from microorganisms. Attention towards the fate and
accumulation of radiocaesium deepened since the Chernobyl nuclear accident,
1986; which indicated a high potential of bioavailability and mobility of 137Cs and
134Cs [67, 216, 217]. The accumulation and the levels of radiocaesium in the soils,
waters and living species in the UK since May 1986, after the Chernobyl accident
have been well documented [217]. A number of studies have been performed to
measure its concentration in abiotic (soil, sediment, water) and biotic systems of
terrestrial and aquatic ecosystem. These studies revealed that the accumulation
of radioacaesium in biosphere depends on number of factors, few of which
reported, include its mineral content of the solid substrate and the abundance of
monovalent cations [217]. The partitioning of Cs+ between abiotic (i.e. soils,
sediments, water) and biotic components of terrestrial and aquatic ecosystems is
complex and dependent on a number of factors, e.g. inorganic mineral content of
the solid substrates and the abundance of monovalent cations. Reference
studies have shown that Cs+ has equal or greater affinity for transport in
comparison with K+ in some organisms which is greatly influenced by the
presence of external K+, NH4+, and Na+[216]. Cs+ is monovalent and most
electropositive metal having high water solubility than other radioisotopes. It is

237
also a weak Lewis acid having lower tendency to form complex with ligands,
however, this facilitates bioaccumulation of Cs+ via intracellular monovalent
transport system located in the plasma membrane of an organism. This transport
is accompanied by stoichiometric exchange for intracellular K+ [216].
Radiocaesium remains active in the biosphere for many years owing to the
relative longer half-life of 137Cs (≈30years). The challenges of Caesium radio-
isotopes is now a major concern for the clean-up the FUKUSHIMA Daiichi nuclear
plant site. Although more locally distributed in comparison to Chernobyl it is never
the less a major nuclear waste commitment requiring a final waste disposal
outcome.
There have been several attempts to improve the immobilisation of highly soluble
Cs+ in cement paste. One of such attempt showed that incorporation of 20% by
weight densified silica fumes (DSF) in cement paste mixture (w/c= 0.45) greatly
improved the immobilisation of Cs+. The incorporation of DSF to cement paste
mixture forms a DSF agglomerates which absorbs Cs+, thus reducing its
leachability. Furthermore, this work also indicated that during the pozzolanic
reaction, a hydrated rim develops around the agglomerate that acts as an
additional diffusion barrier for the Cs+, resulting in an increased efficiency of Cs+
immobilization [31]. DSF is an agglomerated raw silica fume, which has larger
particle diameter than raw silica fume (0.1 µm). Silica fume is considered as very
effective pozzolanic material due to its extreme fineness and high silica content.
Silica fumes are used in cement mixture according to the ASTM standard ASTM
C1240 [218]. During hydration process, amorphous silica reacts with Ca(OH)2 to
form additional CSH gel which has lower Ca:Si ratio compared to CSH originating
238
from the hydration of cement [219]. Research evidence indicate that the Cs+
retention increases with decrease in Ca:Si ratio [31, 220, 221]
10.2.3 Impact of microorganisms
The depth of dissolution studies and rates of diffusivity have shown that highest
diffusivity of Na+ and K+ from the test solutions of contaminated CPS (3% SrCl2,
3% CsCl and 3% SrCO3 ), in the presence of viable communities in the circulating
system, in comparison with control CPS where no viable communities were
reported; such correlation have not been reported previously. Most studies have
been carried out on cement pastes either encapsulated with cation/radionuclides
or added to microbial media to investigate the viable communities. Although such
studies have isolated the group of concrete colonising microorganism, however
failed to represent the actual GDF scenario. In our studies, the colonisation and
subsequent influence on the diffusivity of cations from CPS was carried out using
filtered soil compost (John Innes No.3) solution, no additional growth media was
added to the JISS solution. This may represents the actual GDF scenario in a
condition where seepage of water will take place. As indicated by Humphreys
[70], the GDF will have indigenous population of microorganism which may be in
active or dormant form raises a concern about the durability of immobilised waste.
Although the maximum care will be taken to prevent the mobilisation of
cations/radionuclides from the cement paste, the interaction of encapsulated
cations/radionuclides and microorganism either in mobile or stationary aqueous
media will certainly affect the encapsulated wasteform primarily by lowering the
pH as indicated from our studies, ultimately affecting the integrity of CSH leading
to the dissolution of solidified waste.

Chapter 11: Future Work

239
The work reported in this thesis has made a significant contribution to the
understanding of the challenges of encapsulating nuclear wastes with OPC
formulations. The work as demonstrated, in particular, that few if any conditions
influence (retard) the diffusivity of the Cs cation. Consequently further work is
required to address this major challenge, the areas worthy of further investigation
are:
1 Pore water; this plays a crucial role in the migration of ions from cement
paste into surrounding environments. Expression of this liquor from
cement paste samples during the various stages of experiments to
demonstrate the time dependence of ion migration would be extremely
valuable. It would also confirm the success or otherwise of the
effectiveness of additives to OPC (replacing BFS or PFA for example) in
reducing the diffusivity of caesium cation. Monitoring the composition of
this water would also identify if for example chloride ion plays a key role in
conveying caesium into this environment.
2 Waste form; caesium wastes will largely be in the form of sludges, solids
or loaded ion exchange resins/absorbers. Understanding how caesium
could be released from these wastes will be important to the success of
achieving the objective of reduced diffusivity. With loaded ion exchange
resins then diffusion from these will be largely dependent on the pore water
chemistry, i.e. capable of initially leaching the cation from the functional
site. This could well be a slow process influenced by external
considerations such as the flow of ground water over/around the
encapsulated waste.

240
3 Other additives to OPC; BFS and PFA are the most common additive to
OPC mixture for encapsulation purposes, however although they may
achieve many of the properties required of encapsulation such as low cost,
contribute to cement’s physical attributes e.g. strength, durability, heat
resistant etc. they enhance OPC’s caesium retention properties very little.
Silica fume and other materials are being considered largely from the
physical property aspects but this interest needs to be extended to the
chemical behaviour of radionuclide retention.
4 Make-up water; both its composition and volume to cement affects
diffusivity. Generally restricted w/c (≈0.3 to ≈0.7) is used. As this make-up
water influences pore water evaluating lower water make-up ratios may be
of value. Addition of low cost chemicals may be worthy of consideration
such as sodium hydroxide that would disturbed the pH changes that occur
with curing, would this be advantageous? Equally to complement 3 above
incorporating pore blockers into the cement paste recipe should have
some impact on diffusional processes.
5 Radio-tracers; We chose not to use radio-tracers for a variety of reasons
not least the number of experiments underway at any one time would have
imposed a major challenge for the small radio-lab at UCLan. Incorporating
radio-tracers could have provided a wealthy of addition information such
as the progression of ions from cement paste into pore water, the potential
for back diffusion from the test solution into the cement paste sample and
influence inherent cations on added cations; caesium is a good example
as OPC and some additives have low caesium content.
6 Experimental arrangement; The closed circuit experiments provided
some interesting challenges, not least accounting for dilution effects on

241
adding fresh test solution after samples (20ml) had been withdrawn.
Without this protocol then studying the influence of microorganisms on the
diffusivity of ions would have been compromised. For non-microbial work
smaller samples could have been removed but then a direct comparison
may have been difficult. The open circuit experiments overcame many of
these difficulties but the logistics of accommodated more than a few
experiments in a laboratory would have been a challenge. The closed
circuit arrangement we believe is likely to replicate what happens in and
around a GDF with ground water flow. The diffusivity values calculated
from our experimental data may be more difficult to replicate and other
arrangements, dual cell type may provide this consistency. The major
drawback with our experimental arrangement was not being able to study
the influence of temperature on the diffusional processes.
7 Other analysis; due to time and work load constraints analytical
techniques such as TGA, NMR, FT-IR etc. were not employed. It is
appreciated that these techniques would have provide other additional
information that would have shed light on how pore water interacts with
cement paste, formation of cement paste hydrates and their changing
phase etc.
8 Modelling; although our diffusion coefficients are similar to previously
published values, the experimental arrangements that were used to collect
this data were different. Modelling diffusivity that incorporates make-up
water, various and different additives including pore deformers, coupled
with external near field conditions that replicate both flowing and stagnant
ground water could provide some added value to radioactive waste
cement encapsulation.
242
Many if not all of the above suggestions are likely to be considered when the final
disposal form of Cs+ loaded ION-SIV being used in the clean-up of the
FUKUSHIMA Daiichi nuclear plant site. This material is being used to remove
caesium from ground water that has entered the damaged reactor building.
Currently the loaded ION-SIV is being stored on site awaiting a decision on how
best to reach the final waste management end point. OPC type encapsulation is
likely to be one consideration.
243
References
1. Krauskopf, K., Radioactive waste disposal and geology. Vol. 1. 2013, New York Springer Science & Business Media.
2. World Nuclear Association. The Nuclear Fuel Cycle. 2015 [cited 2015 May]; Available from: http://www.world-nuclear.org/info/Nuclear-Fuel-Cycle/Introduction/Nuclear-Fuel-Cycle-Overview/.
3. World Nuclear Association. Nuclear Power in the United Kingdom. 2015 [cited 2015 May]; Available from: http://www.world-nuclear.org/info/Country-Profiles/Countries-T-Z/United-Kingdom/.
4. Ojovan, M.I. and W.E. Lee, An introduction to nuclear waste immobilisation. Second ed. 2014: Elsevier, UK.
5. Abu-Khader, M.M., Recent advances in nuclear power: A review. Progress in Nuclear Energy, 2009. 51(2): p. 225-235.
6. MacKenzie, A.B., Environmental radioactivity: experience from the 20th century — trends and issues for the 21st century. Science of The Total Environment, 2000. 249(1–3): p. 313-329.
7. Atomic Energy Regulatory Board, Classification of radioactive waste. 2011, Atomic Energy Regulatory Board, Mumbai (India).
8. World Nuclear Association. Waste Management: Overview. 2012; Available from: http://www.world-nuclear.org/info/Nuclear-Fuel-Cycle/Nuclear-Wastes/Waste-Management-Overview/.
9. NDA. The 2013 Inventory: Nuclear Decommisioning Authority. 2013 [cited 2015 January]; Available from: https://www.nda.gov.uk/ukinventory/the-2013-inventory/2013-uk-data/.
10. Alexander, W.R. and L. McKinley, Deep geological disposal of radioactive waste. Vol. 9. 2011: Elsevier.
244
11. Miller B, Tooley J, and G. Thomson. Storage and Disposal of ILW and HLW in the UK: Implications for Copeland. A REPORT FOR COPELAND BOROUGH COUNCIL 2006; Available from: http://www.copelandbc.gov.uk/sites/default/files/attachments/CIS/pdf/180107_nwg8a.pdf.
12. McKinney, J. and S. Barlow, Graphite waste treatment and disposal—A UK perspective on the current opportunities and issues. 2010, IAEA-TECDOC-1647, International Atomic Energy Agency, Vienna, Austria.
13. Nirex, viability of a phased geological repository concept for the long-term management of the UK’s radioactive waste. Nirex report N/122, 2005.
14. Glasser, F.P., Application of inorganic cements to the conditioning and immobilisation of radioactive wastes. Handbook of Advanced Radioactive Waste Conditioning Technologies, Woodhead, Oxford, 2011: p. 67-135.
15. Duxson, P., et al., The role of inorganic polymer technology in the development of ‘green concrete’. Cement and Concrete Research, 2007. 37(12): p. 1590-1597.
16. Neville, A.M., Properties of concrete. Vol. Fourth edition. 2003: Harlow : Longman Group
17. British Geological Survey. Cement: Mineral Planning Factsheet. 2005 [cited 2013 November]; Available from: https://www.bgs.ac.uk/downloads/start.cfm?id=1353.
18. Borges., P.H.R., et al., Carbonation of CH and C–S–H in composite cement pastes containing high amounts of BFS. Cement and Concrete Research, 2010. 40(2): p. 284-292.
19. Harris, A.W., An assessment of the pH buffering provided by the Nirex reference vault backfill within a radioactive waste repository. Nirex Report NSS, 1998. 323: p. 1998.
20. Malhotra, V.M., Durability of concrete incorporating high-volume of low-calcium (ASTM Class F) fly ash. Cement and Concrete Composites, 1990. 12(4): p. 271-277.
21. Wang, X.-Y. and H.-S. Lee, A model for predicting the carbonation depth of concrete containing low-calcium fly ash. Construction and Building Materials, 2009. 23(2): p. 725-733.

245
22. Papadakis, V.G., Effect of fly ash on Portland cement systems: Part I. Low-calcium fly ash. Cement and Concrete Research, 1999. 29(11): p. 1727-1736.
23. Pavía, S. and E. Condren, Study of the durability of OPC versus GGBS concrete on exposure to silage effluent. Journal of Materials in Civil Engineering, 2008. 20(4): p. 313-320.
24. Bogue, R.H., The chemistry of Portland cement. Soil Science, 1955. 79(4): p. 322.
25. Joshi, R.C. and R.P. Lohita, Fly ash in concrete: production, properties and uses. 1997: CRC Press.
26. Faucon, P., et al., Long-term behaviour of cement pastes used for nuclear waste disposal: review of physico-chemical mechanisms of water degradation. Cement and Concrete Research, 1998. 28(6): p. 847-857.
27. Glasser, F.P., J. Marchand, and E. Samson, Durability of concrete—degradation phenomena involving detrimental chemical reactions. Cement and Concrete Research, 2008. 38(2): p. 226-246.
28. Abou-Mesalam, M.M., Leaching behavior of some radionuclides from cement matrix incorporating exhausted polymeric resins. Journal of Radioanalytical and Nuclear Chemistry, 2002. 251(1): p. 123-128.
29. Akers, D.W., N.C. Kraft, and J.W. Mandler, Release of radionuclides and chelating agents from cement-solidified decontamination low-level radioactive waste collected from the Peach Bottom Atomic Power Station Unit 3, in Other Information: PBD: Mar 1994. 1994. p. Medium: ED; Size: 129 p.
30. Alexander, M., A. Bertron, and N. De Belie, Performance of Cement-based Materials in Aggressive Aqueous Environments. 2013: Springer.
31. Bar-Nes, G., et al., The mechanism of cesium immobilization in densified silica-fume blended cement pastes. Cement and Concrete Research, 2008. 38(5): p. 667-674.
32. Carde, C., R. François, and J.-M. Torrenti, Leaching of both calcium hydroxide and CSH from cement paste: Modeling the mechanical behavior. Cement and concrete research, 1996. 26(8): p. 1257-1268.
246
33. Fuhrmann, M., et al. The effects of temperature on the leaching behavior of cement waste forms: The cement/sodium sulfate system. in MRS Proceedings. 1989.
34. Aviam, O., et al., Accelerated biodegradation of cement by sulfur-oxidizing bacteria as a bioassay for evaluating immobilization of low-level radioactive waste. Applied and environmental microbiology, 2004. 70(10): p. 6031-6036.
35. Bertos, M.F., et al., Investigation of accelerated carbonation for the stabilisation of MSW incinerator ashes and the sequestration of CO2. Green Chemistry, 2004. 6(8): p. 428-436.
36. Saito, H. and A. Deguchi, Leaching tests on different mortars using accelerated electrochemical method. Cement and Concrete Research, 2000. 30(11): p. 1815-1825.
37. Hidalgo, A., C. Andrade, and C. Alonso, An accelerated leaching test to evaluate the long term behaviour of concrete in waste disposal. L’Industria Italiana del Cemento, 2001. 766: p. 498-507.
38. Hermansson, H.-P. and S. Eriksson, Corrosion of the copper canister in the repository environment. SKI Report, 1999. 99: p. 52.
39. Ekström, T., Leaching of concrete: experiments and modelling, in Report TVBM 3090. 2001.
40. Heikola, T., Dynamic leach testing of low-and medium-pH injection grouts to be used in deep repositories: cementitious materials in deep geological repositories. Working Reports - Posiva, 2008.
41. Fick, A., V. On liquid diffusion. The London, Edinburgh, and Dublin Philosophical Magazine and Journal of Science, 1855. 10(63): p. 30-39.
42. Cau Dit Coumes, C., et al., Formulating a low-alkalinity, high-resistance and low-heat concrete for radioactive waste repositories. Cement and Concrete Research, 2006. 36(12): p. 2152-2163.
43. Miller, W., et al., Geological disposal of radioactive wastes and natural analogues. Vol. 2. 2000: Elsevier.

247
44. Matschei, T., B. Lothenbach, and F.P. Glasser, The role of calcium carbonate in cement hydration. Cement and Concrete Research, 2007. 37(4): p. 551-558.
45. Richardson, M.G., Carbonation of reinforced concrete: Its causes and management. 1988, Dublin, London and New York: CITIS LTD.
46. Silva, C.A., et al., Carbonation-Related Microstructural Changesin Long-Term Durability Concrete. Materials Research, 2002. 5(3): p. 287-293.
47. Hills, C.D., R.E.H. Sweeney, and N.R. Buenfeld, Microstructural study of carbonated cement-solidified synthetic heavy metal waste. Waste Management, 1999. 19(5): p. 325-331.
48. Lange, L.C., C.D. Hills, and A.B. Poole, Preliminary investigation into the effects of carbonation on cement-solidified hazardous wastes. Environmental science & technology, 1995. 30(1): p. 25-30.
49. Walton, J.C., et al., Role of Carbonation in Transient Leaching of Cementitious Wasteforms. Environmental Science & Technology, 1997. 31(8): p. 2345-2349.
50. Sanchez, F., et al., Leaching of inorganic contaminants from cement-based waste materials as a result of carbonation during intermittent wetting. Waste Management, 2002. 22(2): p. 249-260.
51. Hill, J., et al., The effect of sodium chloride on the dissolution of calcium silicate hydrate gels. Waste Management, 2006. 26(7): p. 758-768.
52. Kishar, E.A., et al., Effect of calcium chloride on the hydration characteristics of ground clay bricks cement pastes. Beni-Suef University Journal of Basic and Applied Sciences, 2013. 2(1): p. 20-30.
53. Lagerblad, B. and J. Trägårdh, Conceptual model for concrete long time degradation in a deep nuclear waste repository. 1994, Svensk Kärnbränslehantering AB: Swedish Cement and Concrete Research Institute.
54. Gascoyne, M., Influence of grout and cement on groundwater composition. 2002, POSIVA Working Report: Helsinki

248
55. Holgersson, S., et al., Effects of gluco-isosaccharinate on Cs, Ni, Pm and Th sorption onto, and diffusion into cement. Radiochimca Acta, 1998. 82(Supplement): p. 393-398.
56. Wolfaardt, G.M. and D.R. Korber, Near-field Microbiological Considerations Relevant to a Deep Geological Repository for used Nuclear Fuel–State of Science Review. Report NWMO TR-2012-02. Nuclear Waste Management Organization, Toronto, 2012.
57. Pedersen, K., Microbial processes in radioactive waste disposal. 2000, Svensk Kärnbränslehantering AB/Swedish Nuclear Fuel and Waste Management Company.
58. Grant W G, et al., The survival of micro-organisms in a deep cementitious repository under alkaline, high temperature conditions. AEA Technology Report, 2001. AEAT/R/ENV/0227.
59. Sand, W. and E. Bock, Biodeterioration of mineral materials by microorganisms—biogenic sulfuric and nitric acid corrosion of concrete and natural stone. Geomicrobiology Journal, 1991. 9(2-3): p. 129-138.
60. Sand, W., Microbial mechanisms of deterioration of inorganic substrates—A general mechanistic overview. International Biodeterioration & Biodegradation, 1997. 40(2–4): p. 183-190.
61. Gadd, G.M., Microbial influence on metal mobility and application for bioremediation. Geoderma, 2004. 122(2–4): p. 109-119.
62. Kieft, T.L. and T.J. Phelps, Life in the slow lane: activities of microorganisms in the subsurface. The microbiology of the terrestrial deep subsurface, 1997: p. 137-163.
63. Olmstead, W. and H. Hamlin, Converting portions of the Los Angeles outfall sewer into a septic tank. Eng News, 1900. 44(19): p. 317-318.
64. Kappler, U., et al., Sulfite: Cytochrome c Oxidoreductase fromThiobacillus novellus purification, characterization, and molecular biology of a heterodimeric member of the sulfite oxidase family. Journal of Biological Chemistry, 2000. 275(18): p. 13202-13212.
65. King, F., P. Humphreys, and R. Metcalfe, A Review of the Information Available to Assess the Risk of Microbiologically Influenced Corrosion in Waste Packages. 2011, Quintessa Ltd, Henley-on-Thames, UK.

249
66. Gadd, G.M., Fungal Production of Citric and Oxalic Acid: Importance in Metal Speciation, Physiology and Biogeochemical Processes, in Advances in Microbial Physiology, R.K. Poole, Editor. 1999, Academic Press. p. 47-92.
67. Zhdanova, N.N., et al., Fungi from Chernobyl: mycobiota of the inner regions of the containment structures of the damaged nuclear reactor. Mycological Research, 2000. 104(12): p. 1421-1426.
68. Gaylarde, C.C. and L.G. Morton, Deteriogenic biofilms on buildings and their control: a review. Biofouling, 1999. 14(1): p. 59-74.
69. Wei, S., et al., Microbiologically induced deterioration of concrete: a review. Brazilian Journal of Microbiology, 2014(AHEAD): p. 0-0.
70. Humphreys, P., J. West, and R. Metcalfe, Microbial effects on repository performance. Quintessa contractors report prepared for the Nuclear Decommissioning Authority (Radioactive Waste Management Directorate), Harwell, Didcot, Oxfordshire, UK, 2010.
71. Santo Domingo, J.W., et al., Microbiology of spent nuclear fuel storage basins. Current microbiology, 1998. 37(6): p. 387-394.
72. Diosi, G., et al., Corrosion influenced by biofilms during wet nuclear waste storage. International biodeterioration & biodegradation, 2003. 51(2): p. 151-156.
73. Chicote, E., et al., Biofouling on the walls of a spent nuclear fuel pool with radioactive ultrapure water. Biofouling, 2004. 20(1): p. 35-42.
74. Tanji, Y., et al., Structural analysis of a biofilm which enhances carbon steel corrosion in nutritionally poor aquatic environments. Journal of bioscience and bioengineering, 1999. 88(5): p. 551-556.
75. Sarró, M.I., et al., Biofouling on austenitic stainless steels in spent nuclear fuel pools. Materials and Corrosion, 2003. 54(7): p. 535-540.
76. Busscher, H.J. and H.C. van der Mei, Microbial adhesion in flow displacement systems. Clinical microbiology reviews, 2006. 19(1): p. 127-141.
77. Eccles, H., Process for the treatment of contaminated material. U.S. Patent No. 5,840,191, 1999.

250
78. OlSiwbiillOn, O.F., An assessment of the important radionuclides in nuclear waste. 1985.
79. Evans, N.D.M., Binding mechanisms of radionuclides to cement. Cement and Concrete Research, 2008. 38(4): p. 543-553.
80. Atkins, M. and F.P. Glasser, Application of Portland cement-based materials to radioactive waste immobilization. Waste Management, 1992. 12(2): p. 105-131.
81. Bonen, D. and S.L. Sarkar. Environmental attack on concrete. in Proc 16th Eng Found Conf, Am Soc Civil Eng 1994. New York.
82. Noshita, K., T. Nishi, and M. Matsuda, Improved Sorption Ability for Radionuclides by Cementitious Materials. WM, 1998. 98: p. 1880-1886.
83. El-Kamash, A., A. El-Dakroury, and H. Aly, Leaching kinetics of 137 Cs and 60 Co radionuclides fixed in cement and cement-based materials. Cement and concrete research, 2002. 32(11): p. 1797-1803.
84. Colombo, P. and D. Dougherty, Leaching Mechanisms of Solidified Low-level Waste: The Literature Survey. 1985: Nuclear Waste Research Group, Department of Nuclear Energy, Brookhaven National Laboratory, Associated Universities.
85. Aggarwal, S., et al., Radionuclide concentration in cementitious pore-fluids extracted under high pressure. 2001, AEAT/R/ENV/0231.
86. Brunauer S, E.P.H.T.E., Adsorption of gases in multimolecular layers. Journal of the American Chemical Society, 1938. 60: p. 309-19.
87. Thomas, J.J., Jennings, H. M. and A. J.Allen The surface area of hardened cement paste as measured by various techniques. Concrete Science and Engineering, 1999. 1(1): p. 45 - 64.
88. Odler, I., The BET-specific surface area of hydrated Portland cement and related materials. Cement and Concrete Research, 2003. 33(12): p. 2049-2056.
89. Madigan, M.T., et al., Brock Biology of microorganisms, 12th edn. 2008: Pearson Benjamin Cummings, San Francisco, CA, USA.

251
90. Barrow, G. and R.K.A. Feltham, Cowan and Steel's manual for the identification of medical bacteria. 2004: Cambridge university press.
91. Bessey, E.A., Morphology and Taxonomy of Fungi. Soil Science. Vol. 71. 1951: London, Constable & Company Limited; Philadelphia,. 79.
92. Zar, J.H., Biostatistical analysis. 2nd. Prentice Hall USA, 1984.
93. Gutierrez, N., et al. Effects of carbonation on the long-term leaching performance of cementitious wasteforms. in Proc. 1996 HSRC/WERC Joint Conf. on the Environ. 1996. Albuquerque, New Mexico: Kansas State Univ., Manhattan, KS (United States).
94. Kinoshita, H., et al., Carbonation of composite cements with high mineral admixture content used for radioactive waste encapsulation. Minerals Engineering, 2014. 59: p. 107-114.
95. Chen, W., Hydration of slag cement: theory, modeling and application. Ph.D. Thesis,. 2006, University of Twente, The Netherlands.
96. Song, S., et al., Hydration of alkali-activated ground granulated blast furnace slag. Journal of Materials Science, 2000. 35(1): p. 249-257.
97. Provis, J.L., et al., X-ray microtomography shows pore structure and tortuosity in alkali-activated binders. Cement and Concrete Research, 2012. 42(6): p. 855-864.
98. Khokhar, I.A. Hydration of Cement. 2013 [cited 2015 January ]; Available from: http://www.slideshare.net/rizwansamor/hydration-of-cement.
99. Radwan, M. and H.S. El, Hydration characteristics of tetracalcium alumino-ferrite phase in the presence calcium carbonate. Ceramics-Silikaty, 2011. 55(4): p. 337-342.
100. Mohran, M.A.A.H. Cement Hydration. (n.d) [cited 2015 January]; Available from: http://www.mohran.com/wp-content/uploads/2014/10/Hydration-of-Portland-Cement.pdf.
101. Matschei, T., B. Lothenbach, and F.P. Glasser, The AFm phase in Portland cement. Cement and Concrete Research, 2007. 37(2): p. 118-130.
252
102. Theissing, E.M., P.V. Hest-Wardenier, and G. De Wind, The combining of sodium chloride and calcium chloride by a number of different hardened cement pastes. Cement and Concrete Research, 1978. 8(6): p. 683-691.
103. Arya, C., N.R. Buenfeld, and J.B. Newman, Factors influencing chloride-binding in concrete. Cement and Concrete Research, 1990. 20(2): p. 291-300.
104. Wan, X.-m., et al., Chloride content and pH value in the pore solution of concrete under carbonation. Journal of Zhejiang University SCIENCE A, 2013. 14(1): p. 71-78.
105. Lafhaj, Z., et al., Correlation between porosity, permeability and ultrasonic parameters of mortar with variable water/cement ratio and water content. Cement and Concrete Research, 2006. 36(4): p. 625-633.
106. Živica, V., Effects of the very low water/cement ratio. Construction and Building Materials, 2009. 23(12): p. 3579-3582.
107. Felekoğlu, B., S. Türkel, and B. Baradan, Effect of water/cement ratio on the fresh and hardened properties of self-compacting concrete. Building and Environment, 2007. 42(4): p. 1795-1802.
108. Prokopski, G. and B. Langier, Effect of water/cement ratio and silica fume addition on the fracture toughness and morphology of fractured surfaces of gravel concretes. Cement and concrete research, 2000. 30(9): p. 1427-1433.
109. Fujita, H., et al., Concentration and Molecular Weight of Superplasticizer Contained in Pore Solution Extracted from Hardened Cement Pastes. Journal of Advanced Concrete Technology, 2008. 6(3): p. 389-395.
110. Adjoudj, M.h., et al., Evaluation of rheological parameters of mortar containing various amounts of mineral addition with polycarboxylate superplasticizer. Construction and Building Materials, 2014. 70(0): p. 549-559.
111. Tasdemir, C., Combined effects of mineral admixtures and curing conditions on the sorptivity coefficient of concrete. Cement and Concrete Research, 2003. 33(10): p. 1637-1642.
112. Young, A.J., et al., Behaviour of radionuclides in the presence of superplasticiser. Advances in Cement Research, 2013. 25(1): p. 32-43.

253
113. McCulloch, C.E., et al., Cements in radioactive waste disposal: some mineralogical considerations. Mineralogical Magazine, 1985. 49(351): p. 211-221.
114. Gruyaert, E., et al., Investigation of the influence of blast-furnace slag on the resistance of concrete against organic acid or sulphate attack by means of accelerated degradation tests. Cement and Concrete Research, 2012. 42(1): p. 173-185.
115. Bordallo, H.N., L.P. Aldridge, and A. Desmedt, Water dynamics in hardened ordinary portland cement paste or concrete: From quasielastic neutron scattering. The Journal of Physical Chemistry B, 2006. 110(36): p. 17966-17976.
116. Jensen, O.M. and P.F. Hansen, Water-entrained cement-based materials: I. Principles and theoretical background. Cement and Concrete Research, 2001. 31(4): p. 647-654.
117. Milestone, N.B. and J.P. Gorce, Determining how water is held in composite cement binders. Journal of the Australian Ceramic Society, 2012. 48(2): p. 244-248.
118. Lothenbach, B. and F. Winnefeld, Thermodynamic modelling of the hydration of Portland cement. Cement and Concrete Research, 2006. 36(2): p. 209-226.
119. Bentz, D., et al., Drying/hydration in cement pastes during curing. Materials and Structures, 2001. 34(9): p. 557-565.
120. Ravindrarajah, R.S. Bleeding of fresh concrete containing cement supplementary materials. in 9th East Asia-Pacific Conference on Structural Engineering and Construction. 16-18 December, 2003. Bali, Indonesia, .
121. Persson, B., D.P. Bentz, and G. Fagerlund. Self-desiccation and its importance in concrete technology. in Proceedings of the fourth international research seminar, Gaithersburg, . 2005. Maryland, USA: Div Building Materials, LTH, Lund university.
122. Maltais, Y., E. Samson, and J. Marchand, Predicting the durability of Portland cement systems in aggressive environments—laboratory validation. Cement and Concrete Research, 2004. 34(9): p. 1579-1589.

254
123. Samson, E. and J. Marchand, Modeling the effect of temperature on ionic transport in cementitious materials. Cement and Concrete Research, 2007. 37(3): p. 455-468.
124. John Innes Manufacturers Association. About John Innes. (n.d) [cited 2014 June]; Available from: http://www.johninnes.info/about.htm.
125. Wolf-Gladrow, D.A., et al., Total alkalinity: The explicit conservative expression and its application to biogeochemical processes. Marine Chemistry, 2007. 106(1–2): p. 287-300.
126. Berner, U., Concentration limits in the cement based Swiss repository for long-lived, intermediate-level radioactive wastes (LMA). 1999, Paul Scherrer Inst., CH-5232 Villigen PSI (Switzerland).
127. Tits, J., et al., Strontium binding by calcium silicate hydrates. Journal of colloid and interface science, 2006. 300(1): p. 78-87.
128. Evans, N., Binding mechanisms of radionuclides to cement. Cement and concrete research, 2008. 38(4): p. 543-553.
129. Abotsi, G., D. Bostick, and D. Beck, Evaluation of interim and final waste forms for the newly generated liquid low-level waste flowsheet. 1996, Oak Ridge National Lab., TN (United States). Funding organisation: USDOE, Washington, DC (United States).
130. Zha, X., et al., Numerical modeling of supercritical carbonation process in cement-based materials. Cement and Concrete Research, 2015. 72(0): p. 10-20.
131. Johannesson, B. and P. Utgenannt, Microstructural changes caused by carbonation of cement mortar. Cement and concrete Research, 2001. 31(6): p. 925-931.
132. Song, H.-W. and S.-J. Kwon, Permeability characteristics of carbonated concrete considering capillary pore structure. Cement and Concrete Research, 2007. 37(6): p. 909-915.
133. Collins, F. and J. Sanjayan, Microcracking and strength development of alkali activated slag concrete. Cement and Concrete Composites, 2001. 23(4): p. 345-352.

255
134. Silva, A., R. Neves, and J. de Brito, Statistical modelling of carbonation in reinforced concrete. Cement and Concrete Composites, 2014. 50: p. 73-81.
135. Castellote, M., et al., Accelerated carbonation of cement pastes in situ monitored by neutron diffraction. Cement and concrete research, 2008. 38(12): p. 1365-1373.
136. Bertos, M.F., et al., A review of accelerated carbonation technology in the treatment of cement-based materials and sequestration of CO 2. Journal of Hazardous Materials, 2004. 112(3): p. 193-205.
137. Sanchez, F., et al., Leaching of inorganic contaminants from cement-based waste materials as a result of carbonation during intermittent wetting. Waste Management, 2002. 22(2): p. 249-260.
138. Bertos, M.F., et al., Investigation of accelerated carbonation for the stabilisation of MSW incinerator ashes and the sequestration of CO 2. Green Chemistry, 2004. 6(8): p. 428-436.
139. Shafique, M.S.B., et al., Influence of carbonation on leaching of cementitious wasteforms. Journal of Environmental Engineering, 1998. 124(5): p. 463-467.
140. Atkinson, A., K. Nelson, and T.M. Valentine, Leach test characterisation of cement-based nuclear waste forms. Nuclear and Chemical Waste Management, 1986. 6(3-4): p. 241-253.
141. Voglis, N., et al., Portland-limestone cements. Their properties and hydration compared to those of other composite cements. Cement and Concrete Composites, 2005. 27(2): p. 191-196.
142. Lothenbach, B., et al., Influence of limestone on the hydration of Portland cements. Cement and Concrete Research, 2008. 38(6): p. 848-860.
143. Rahman, R.A., D.Z. El Abidin, and H. Abou-Shady, Cesium binding and leaching from single and binary contaminant cement–bentonite matrices. Chemical Engineering Journal, 2014. 245: p. 276-287.
144. Mahoney, J.D. and A.D. Elaine. Radiochemical studies of the leaching of metal ions from sludge bearing concrete. in Third Conference On Advanced Pollution Control For The Metal Finishing Industry 1981. Orlando Hyatt House, Kissimmee, FL.

256
145. Faucon, P., et al., Behaviour of crystallised phases of Portland cement upon water attack. Materials and Structures, 1997. 30(8): p. 480-485.
146. Haga, K., et al., Effects of porosity on leaching of Ca from hardened ordinary Portland cement paste. Cement and Concrete Research, 2005. 35(9): p. 1764-1775.
147. Mainguy, M., et al., Modelling of leaching in pure cement paste and mortar. Cement and Concrete Research, 2000. 30(1): p. 83-90.
148. Kuhl, D., F. Bangert, and G. Meschke, Coupled chemo-mechanical deterioration of cementitious materials. Part I: Modeling. International Journal of Solids and Structures, 2004. 41(1): p. 15-40.
149. Holt, E., Durability of low-pH injection grout. A literature survey. 2008, Posiva Oy, Helsinki (Finland).
150. Goñi, S. and A. Guerrero, Accelerated carbonation of Friedel's salt in calcium aluminate cement paste. Cement and Concrete Research, 2003. 33(1): p. 21-26.
151. Ouyang, C., A. Nanni, and W.F. Chang, Internal and external sources of sulfate ions in Portland cement mortar: two types of chemical attack. Cement and Concrete Research, 1988. 18(5): p. 699-709.
152. Al-Amoudi, O.S.B., Attack on plain and blended cements exposed to aggressive sulfate environments. Cement and Concrete Composites, 2002. 24(3): p. 305-316.
153. Fu, Y., J. Ding, and J. Beaudoin, Expansion of portland cement mortar due to internal sulfate attack. Cement and Concrete Research, 1997. 27(9): p. 1299-1306.
154. Rozière, E., et al., Durability of concrete exposed to leaching and external sulphate attacks. Cement and Concrete Research, 2009. 39(12): p. 1188-1198.
155. Neville, A., The confused world of sulfate attack on concrete. Cement and Concrete Research, 2004. 34(8): p. 1275-1296.
156. Estokova, A., et al., Sulphur oxidizing bacteria as the causative factor of biocorrosion of concrete. Chem. Eng. Trans, 2011. 24: p. 1-6.

257
157. Li, V.C. and E.-H. Yang, Self healing in concrete materials, in Self Healing Materials. 2007, Springer. p. 161-193.
158. Guppy, R., Autogenous healing of cracks in concrete and its relevance to radwaste repositories. 1988, United Kingdom Nirex, Ltd.
159. Harr, M.E., Ground water and seepage, in The Civil Engineering Handbook, Second Edition, W.F. Chen and J.Y.R. Liew, Editors. 2002, CRC Press. p. 18.3 -18.26.
160. Samson, E., J. Marchand, and K. Snyder, Calculation of ionic diffusion coefficients on the basis of migration test results. Materials and Structures, 2003. 36(3): p. 156-165.
161. Ahmad, A. and A. Kumar, Chloride ion migration/diffusion through concrete and test methods. International Journal of Advanced Scientific and Technical Research, 2013. 6(3).
162. Johannesson, B., et al., Multi-species ionic diffusion in concrete with account to interaction between ions in the pore solution and the cement hydrates. Materials and structures, 2007. 40(7): p. 651-665.
163. Batchelor, B., Leach models: Theory and application. Journal of Hazardous Materials, 1990. 24(2–3): p. 255-266.
164. Park, J.-Y. and B. Batchelor, General chemical equilibrium model for stabilized/solidified wastes. Journal of environmental engineering, 2002. 128(7): p. 653-661.
165. Rogers, R., et al., Development of test methods for assessing microbial influenced degradation of cement-solidified radioactive and industrial waste. Cement and concrete research, 2003. 33(12): p. 2069-2076.
166. West, J.M. and I.G. Mckinley, Radioactive Waste Disposal, Geomicrobiology of. 2002: Wiley Online Library.
167. House, M. and W. Weiss, Review of Microbially Induced Corrosion and Comments on Needs Related to Testing Procedures. 2014.
168. Haferburg, G. and E. Kothe, Microbes and metals: interactions in the environment. Journal of basic microbiology, 2007. 47(6): p. 453-467.
258
169. Eccles, H., Personal communication with Prof Eccles. 2011.
170. Pedersen, K. and F. Karlsson, Investigations of subterranean microorganisms: their importance for performance assessment of radioactive waste disposal. 1995: SKB.
171. DEFRA, BERR, and D. ADMINISTRATIONS, Managing Radioactive Waste Safely: A Framework for Implementing Geological Disposal. Vol. cm 7386. 2008, The Stationery Office, London.
172. Horn, J.M., et al., Bacterial growth dynamics, limiting factors, and community diversity in a proposed geological nuclear waste repository environment. Geomicrobiology Journal, 2004. 21(4): p. 273-286.
173. Perfettini, J.V., E. Revertegat, and N. Langomazino, Evaluation of cement degradation induced by the metabolic products of two fungal strains. Experientia, 1991. 47(6): p. 527-533.
174. Molnár, M., et al., Study of gas generation in real L/ILW containers. Journal of radioanalytical and nuclear chemistry, 2010. 286(3): p. 745-750.
175. Gadd, G.M., Metals, minerals and microbes: geomicrobiology and bioremediation. Microbiology, 2010. 156(3): p. 609-643.
176. Silver, S. and T.K. Misra, Plasmid-mediated heavy metal resistances. Annual Reviews in Microbiology, 1988. 42(1): p. 717-743.
177. Giannantonio, D.J., et al., Effects of concrete properties and nutrients on fungal colonization and fouling. International Biodeterioration & Biodegradation, 2009. 63(3): p. 252-259.
178. Magniont, C., et al., A new test method to assess the bacterial deterioration of cementitious materials. Cement and Concrete Research, 2011. 41(4): p. 429-438.
179. Önal, M.M., Reinforcement of Beam by Using Carbon Fiber Reinforced Polymer in Concrete Buildings. Sci. Res. Essay, 2009. 4(10): p. 1136-1145.
180. Lahav, O., et al., Modeling hydrogen sulfide emission rates in gravity sewage collection systems. Journal of environmental engineering, 2004. 130(11): p. 1382-1389.

259
181. Vollertsen, J., et al., Corrosion of concrete sewers—The kinetics of hydrogen sulfide oxidation. Science of the total environment, 2008. 394(1): p. 162-170.
182. Ghafoori, N. and R. Mathis, Sulfate resistance of concrete pavers. Journal of materials in civil engineering, 1997. 9(1): p. 35-40.
183. Lajili, H., et al., Alteration of a cement matrix subjected to biolixiviation test. Materials and structures, 2008. 41(10): p. 1633-1645.
184. Warscheid, T. and J. Braams, Biodeterioration of stone: a review. International Biodeterioration & Biodegradation, 2000. 46(4): p. 343-368.
185. Setareh, M. and R. Javaherdashti, Evaluation of sessile microorganisms in pipelines and cooling towers of some Iranian industries. Journal of materials engineering and performance, 2006. 15(1): p. 5-8.
186. Edwards, K.J., et al., Geomicrobiology of pyrite (FeS2) dissolution: case study at Iron Mountain, California. Geomicrobiology Journal, 1999. 16(2): p. 155-179.
187. Gazsó, L.G., The key microbial processes in the removal of toxic metals and radionuclides from the environment. Central European Journal of Occupational and Environmental Medicine, 2001. 7(3/4): p. 178-185.
188. Bousserrhine, N., et al., Bacterial and chemical reductive dissolution of Mn-, Co-, Cr-, and Al-substituted goethites. Geomicrobiology journal, 1999. 16(3): p. 245-258.
189. Lloyd, J.R., Microbial reduction of metals and radionuclides. FEMS microbiology reviews, 2003. 27(2-3): p. 411-425.
190. Barkay, T. and J. Schaefer, Metal and radionuclide bioremediation: issues, considerations and potentials. Current opinion in microbiology, 2001. 4(3): p. 318-323.
191. Bryan, N.D., et al., The effects of humic substances on the transport of radionuclides: recent improvements in the prediction of behaviour and the understanding of mechanisms. Applied Geochemistry, 2012. 27(2): p. 378-389.

260
192. Gadd, G.M., Fungal production of citric and oxalic acid: importance in metal speciation, physiology and biogeochemical processes. Advances in microbial physiology, 1999. 41: p. 47-92.
193. Ramsay, L., J. Sayer, and G. Gadd, Stress responses of fungal colonies towards toxic metals. The Fungal Colony, 1999: p. 178-200.
194. Burgstaller, W., et al., Solubilization of zinc oxide from filter dust with Penicillium simplicissimum: bioreactor leaching and stoichiometry. Environmental science & technology, 1992. 26(2): p. 340-346.
195. Haas, H., Molecular genetics of fungal siderophore biosynthesis and uptake: the role of siderophores in iron uptake and storage. Applied Microbiology and Biotechnology, 2003. 62(4): p. 316-330.
196. Saha, R., et al., Microbial siderophores: a mini review. Journal of basic microbiology, 2013. 53(4): p. 303-317.
197. Birch, L. and R. Bachofen, Complexing agents from microorganisms. Experientia, 1990. 46(8): p. 827-834.
198. Lloyd, J.R. and D.R. Lovley, Microbial detoxification of metals and radionuclides. Current Opinion in Biotechnology, 2001. 12(3): p. 248-253.
199. Gadd, G.M., Heavy metal accumulation by bacteria and other microorganisms. Experientia, 1990. 46(8): p. 834-840.
200. Dighton, J., T. Tugay, and N. Zhdanova, Fungi and ionizing radiation from radionuclides. FEMS microbiology letters, 2008. 281(2): p. 109-120.
201. Gadd, G.M., Microbial Bioremediation of Metals and Radionuclides. Encyclopedia of Environmetrics, 2013.
202. Keith-Roach, M.J. and F.R. Livens, Microbial interactions with metals/radionuclides: the basis of bioremediation. Interactions of microorganisms with radionuclides, 2002: p. 179.
203. Pinheiro, S., M. Silva, and F. dos Santos Souza, The Influence of Biodeterioration on Concrete Durability. ACI Special Publication, 2005. 229.

261
204. Dighton, J., T. Tugay, and N. Zhdanova, Interactions of fungi and radionuclides in soil, in Microbiology of Extreme Soils. 2008, Springer. p. 333-355.
205. Padan, E., et al., Alkaline pH homeostasis in bacteria: new insights. Biochimica et biophysica acta (BBA)-biomembranes, 2005. 1717(2): p. 67-88.
206. Roger, G.M., et al., Effect of ionic condensation and interactions between humic substances on their mobility: An experimental and simulation study. Colloids and Surfaces A: Physicochemical and Engineering Aspects, 2013. 436: p. 408-416.
207. Ephraim, J.H. and B. Allard, Metal ion binding by humic substances. Modelling in Aquatic Chemistry, 1997: p. 207-244.
208. Shaban, I.S. and F. Macášek, Influence of humic substances on sorption of cesium and strontium on montmorillonite. Journal of radioanalytical and nuclear chemistry, 1998. 229(1): p. 73-78.
209. Dumat, C. and S. Staunton, Reduced adsorption of caesium on clay minerals caused by various humic substances. Journal of Environmental Radioactivity, 1999. 46(2): p. 187-200.
210. Rice, G., N. Miles, and S. Farris, Approaches to control the quality of cementitious PFA grouts for nuclear waste encapsulation. Powder Technology, 2007. 174(1–2): p. 56-59.
211. Morton, L.H.G., Personal communication with Prof Morton. 2012.
212. Somdee, T., et al., Degradation of [Dha(7)]MC-LR by a Microcystin Degrading Bacterium Isolated from Lake Rotoiti, New Zealand. ISRN Microbiology, 2013. 2013: p. 596429.
213. ANSI/ANS-16.1-2003, Measurement of the Leachability of Solidified Low-Level Radioactive Wastes by a Short-Term Test Procedure. American Nuclear Society, ANS, 2003. http://www.ans.org/.
214. Ramachandran, V.S., Calcium chloride in concrete. Mag Concr Res, 1977. 29: p. 1-216.
215. Bortoluzzi, E.A., et al., The Influence of Calcium Chloride on the Setting Time, Solubility, Disintegration, and pH of Mineral Trioxide Aggregate and
262
White Portland Cement with a Radiopacifier. Journal of Endodontics, 2009. 35(4): p. 550-554.
216. Avery, S.V., Caesium accumulation by microorganisms: uptake mechanisms, cation competition, compartmentalization and toxicity. Journal of industrial microbiology, 1995. 14(2): p. 76-84.
217. Chaplow, J.S., N.A. Beresford, and C.L. Barnett, Post Chernobyl surveys of radiocaesium in soil, vegetation, wildlife and fungi in Great Britain. Earth System Science Data Discussions, 2014. 7(2): p. 693-711.
218. ASTM C1240-14, Standard Specification for Silica Fume Used in Cementitious Mixtures. ASTM International, West Conshohocken, PA, 2014. www.astm.org.
219. V.S. Ramachandran, et al., Supplementary Cementing Materials and other additions. Handbook of Thermal Analysis of Construction Materials. 1987, USA: Noyes Publications. 300 - 302.
220. Bagosi, S. and L.J. Csetenyi, Caesium immobilisation in hydrated calcium-silicate-aluminate systems. Cement and concrete research, 1998. 28(12): p. 1753-1759.
221. Hong, S.-Y. and F.P. Glasser, Alkali binding in cement pastes: Part I. The C-S-H phase. Cement and Concrete Research, 1999. 29(12): p. 1893-1903.

263
Appendices

264
Appendix 2.1: summary of cement paste mixture proportions, CPS dimentions, cations concentration of BFS:OPC CPSs
OPC BFS Volume of cation soln added SG of cation soln
Cation soln composition
(g) (g) (mL) (g/cm3) (g/L) (g) (dia x h cm) (g/g)
control 300 900 440 (DI water) 1 - 83.7088 3.2 X 5 -≈3% SrCl2 400 1200 674.37 (590) 1.143 304.2 84.3944 3.2 X 5 0.094 [2.91%]≈3% CsCl 400 1200 639.56 (590) 1.084 126.27 87.2456 3.2 X 5.2 0.04 [3.01%]
≈1.27% CoCl2 400 1200 640 (600) 1..067 216.83 91.8604 3.2 X 5.6 [1.27%]***
mixed 400 1200 767 (590) 1.3 97.8814 3.2 X 5.7 0.11Sr Sr[2.66%]0.04 (Cs)[2.67%]
Co [1.12%]200 600 300 (DI water) ** (9.126 g)** 82.0506 3.2 X 5 0.01 [0.27%]
3.01gSr≈0.3% CsCl 200 600 300 (DI water) ** (3.788 g) ** 81.468 3.2 X 5.2 0.003 [0.27%]
2.98gCs200 600 300 (DI water) ** (50.486 g) ** 82.5966 3.2 X 5 0.046 [2.7%]
31.00g Sr≈0.3% SrCO3 200 600 300 (DI water) ** (5.0486 g)** 84.9904 3.2 X 5.3 0.005 [0.27%]
3.10g Sr** Required amount of salts (Sr2+ and Cs+) was added directly to DI water prior to the addition of OPC and BFS
*** The appropriate percentage of CoCl2 solution i.e 3% could not be achieved because of the solubility of cobalt chloride in the water
Cation concentration of CPSCPS weight CPS
dimensions
≈3% Sr CO3
≈0.3% SrCl2
304.2 (Sr) 126.27 (Cs) prepared in 5% CoCl2
cement paste mixture proportions
CPS
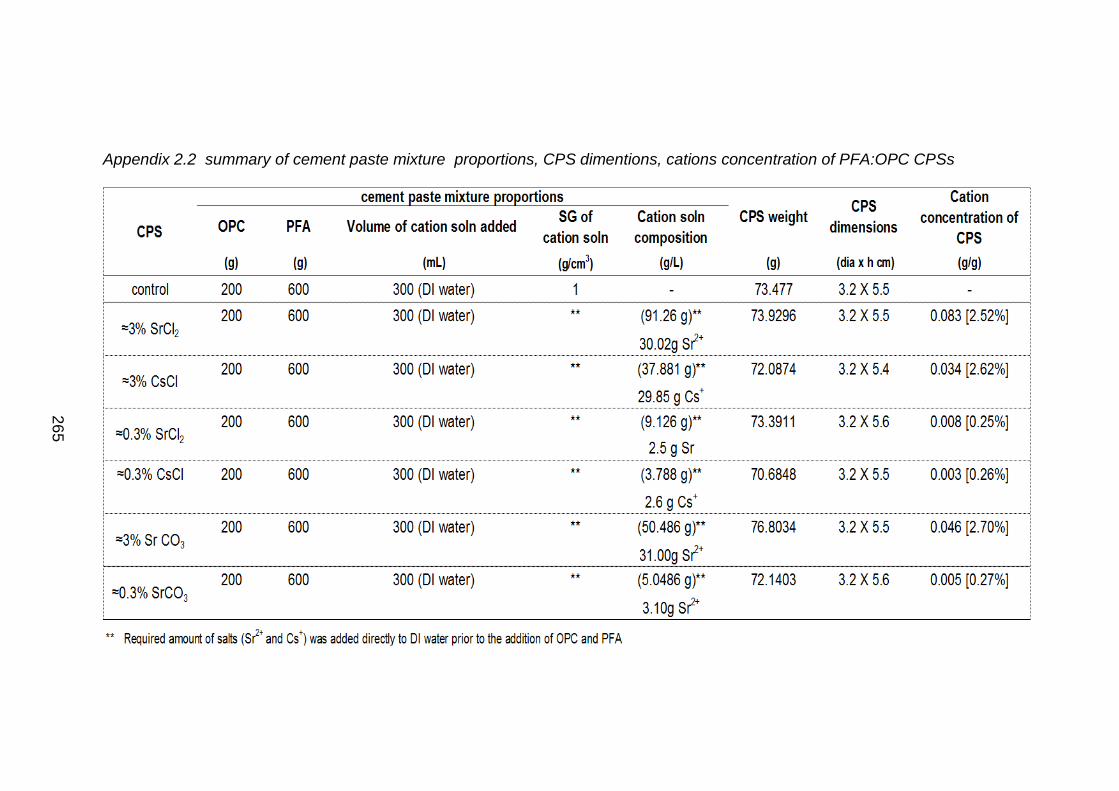
265
Appendix 2.2 summary of cement paste mixture proportions, CPS dimentions, cations concentration of PFA:OPC CPSs

266
Appendix 4.1 Rate of diffusivity from control BFS:OPC CPS in DW

267
Appendix 4.2 Rate of diffusivity from ≈3% SrCl2 BFS:OPC CPS in DW

268
Appendix 4.3 Rate of diffusivity from ≈3% CsCl BFS:OPC CPS in DW

269
Appendix 4.4 Rate of diffusivity from ≈1.27% CoCl2 BFS:OPC CPS in DW

270
Appendix 4.5 Rate of diffusivity from combined metal BFS:OPC CPS in DW

271
Appendix 4.6 Rate of diffusivity from aged control BFS:OPC CPS in DW
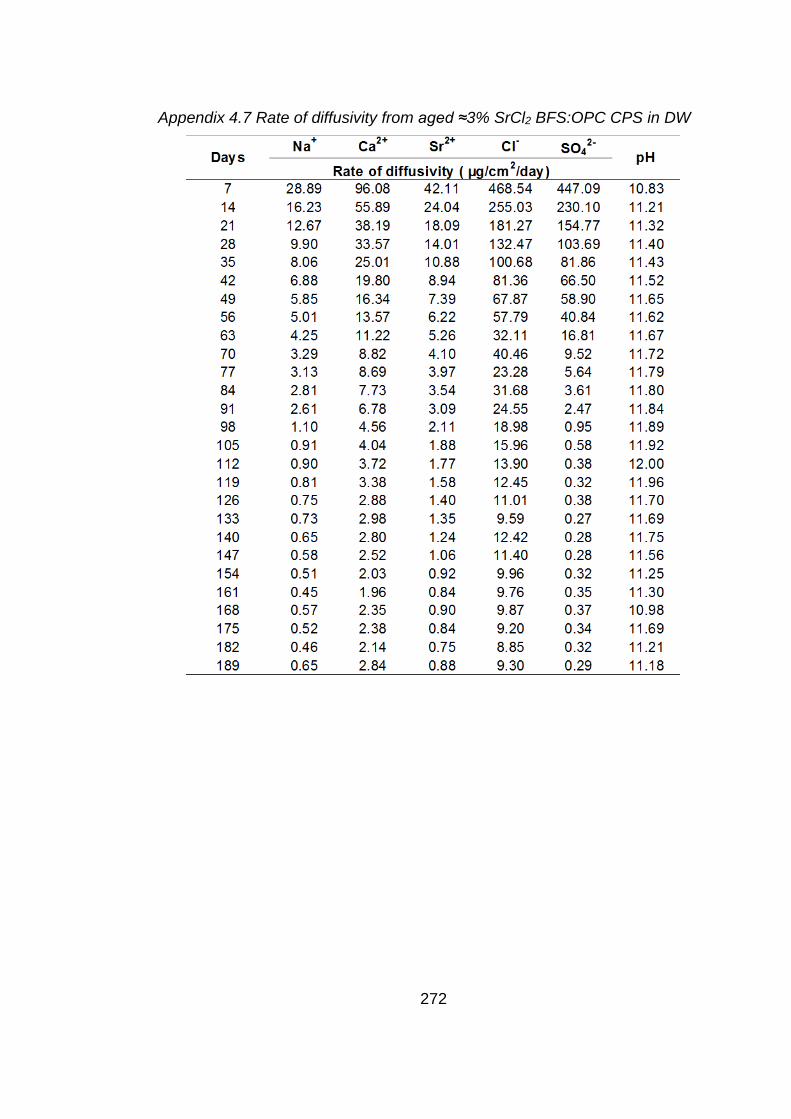
272
Appendix 4.7 Rate of diffusivity from aged ≈3% SrCl2 BFS:OPC CPS in DW
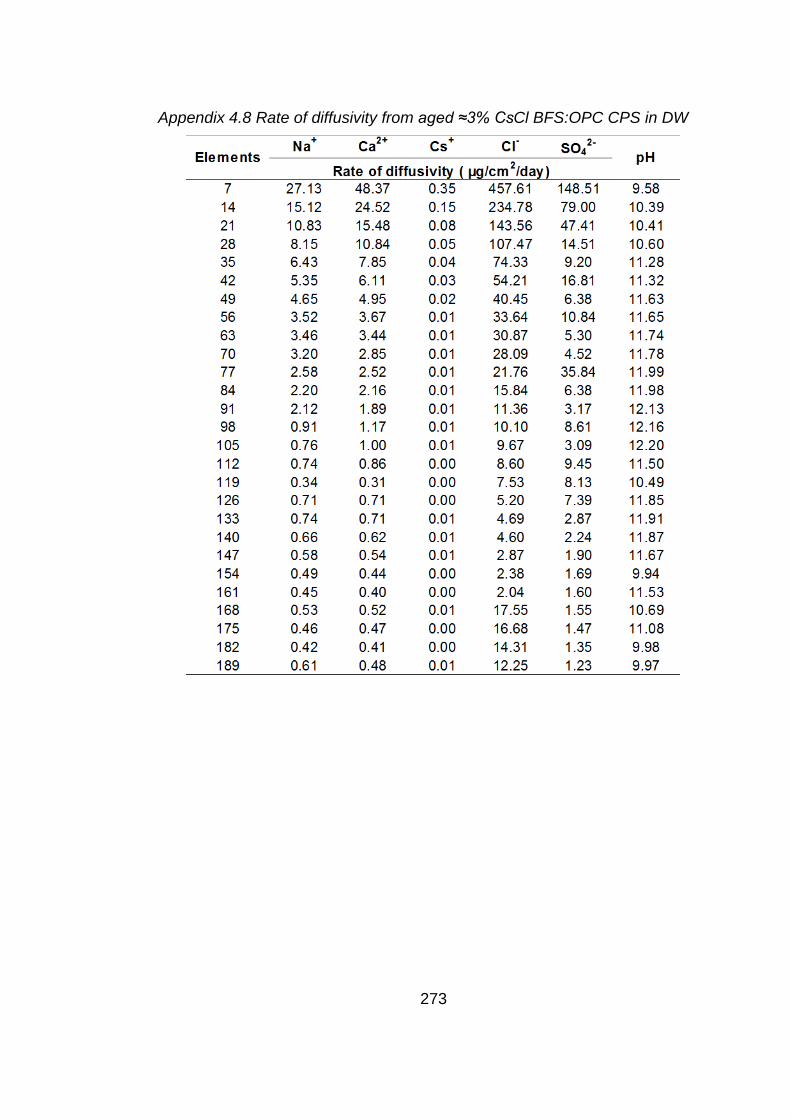
273
Appendix 4.8 Rate of diffusivity from aged ≈3% CsCl BFS:OPC CPS in DW

274
Appendix 4.9 Rate of diffusivity from aged ≈0.3% SrCl2 BFS:OPC CPS in DW
Appendix 4.10 Rate of diffusivity from aged ≈0.3% CsCl BFS:OPC CPS in DW

275
Appendix 4.11 Rate of diffusivity from ≈0.3% SrCO3 BFS:OPC CPS in DW

276
Appendix 4.12 Rate of diffusivity from ≈3% SrCO3 BFS:OPC CPS in DW
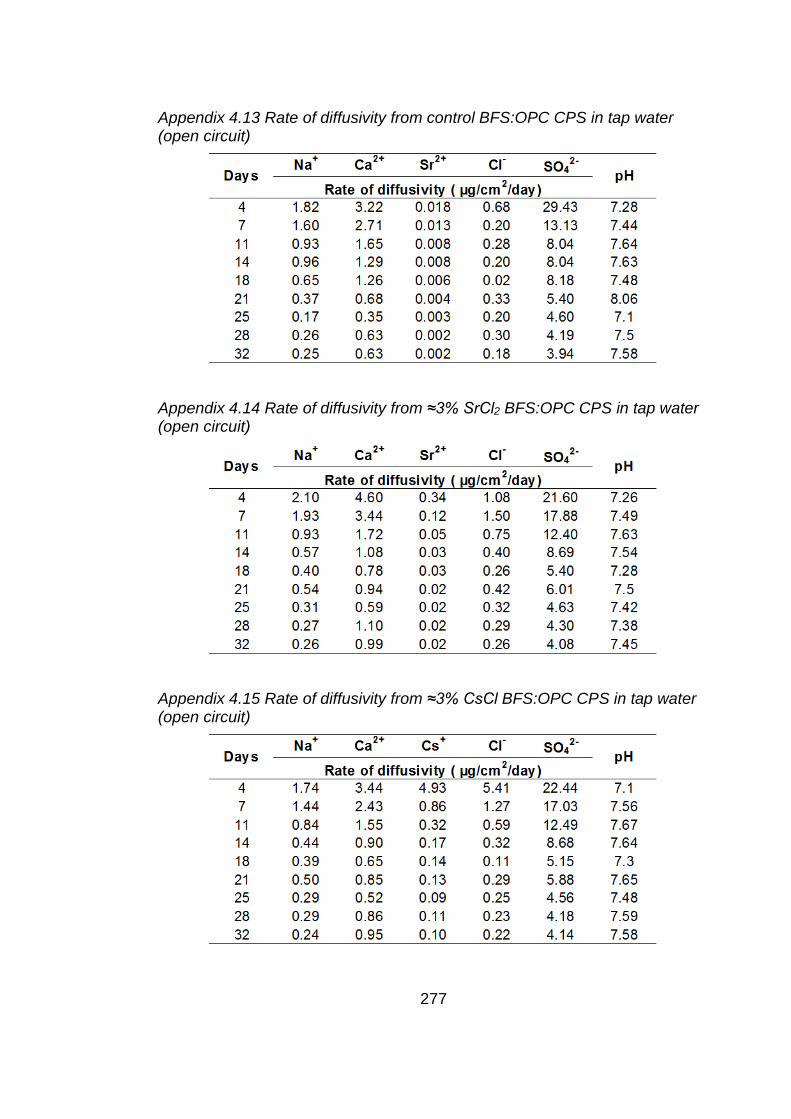
277
Appendix 4.13 Rate of diffusivity from control BFS:OPC CPS in tap water (open circuit)
Appendix 4.14 Rate of diffusivity from ≈3% SrCl2 BFS:OPC CPS in tap water (open circuit)
Appendix 4.15 Rate of diffusivity from ≈3% CsCl BFS:OPC CPS in tap water (open circuit)

278
Appendix 4.16 Rate of diffusivity from ≈3% SrCO3 BFS:OPC CPS in tap water (open circuit)
Appendix 4.17 Rate of diffusivity from ≈3% SrCl2 BFS:OPC CPS in tap water (closed circuit)
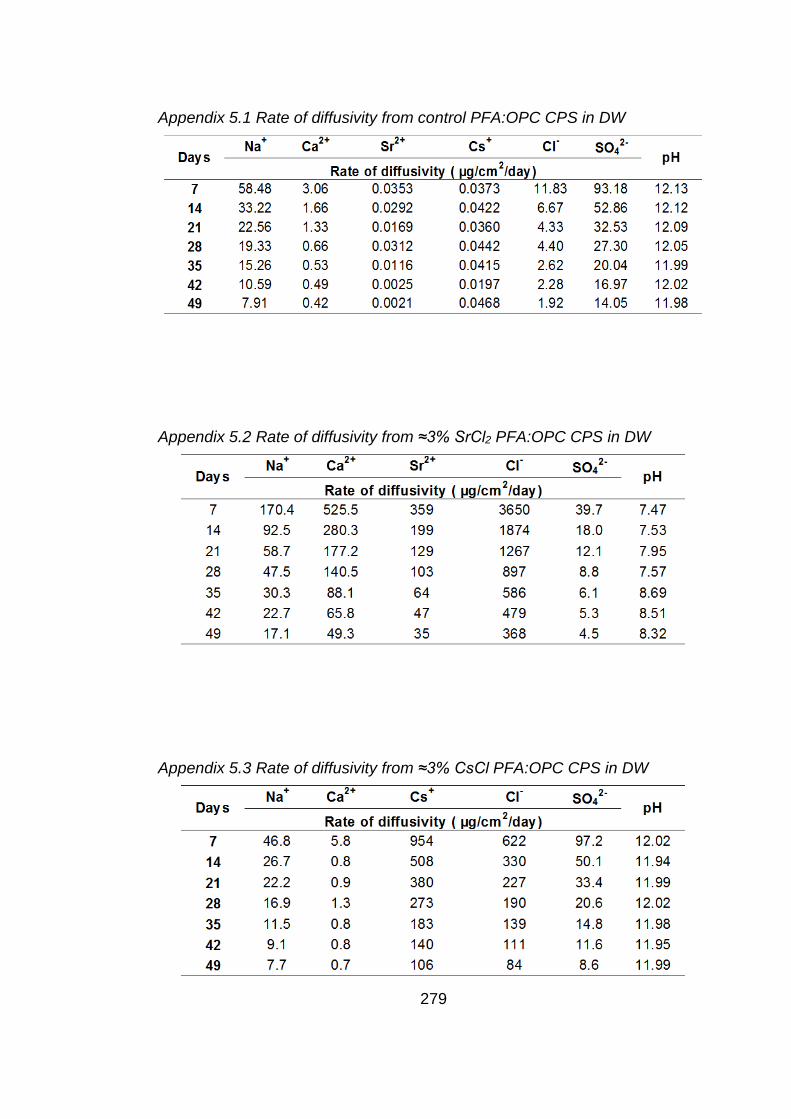
279
Appendix 5.1 Rate of diffusivity from control PFA:OPC CPS in DW
Appendix 5.2 Rate of diffusivity from ≈3% SrCl2 PFA:OPC CPS in DW
Appendix 5.3 Rate of diffusivity from ≈3% CsCl PFA:OPC CPS in DW

280
Appendix 5.4 Rate of diffusivity from ≈3% SrCO3 PFA:OPC CPS in DW
Appendix 5.5 Rate of diffusivity from ≈0.3% SrCl2 PFA:OPC CPS in DW
Appendix 5.6 Rate of diffusivity from ≈0.3% CsCl PFA:OPC CPS in DW

281
Appendix 5.7 Rate of diffusivity from control PFA:OPC CPS in tap water (open circuit)
Appendix 5.8 Rate of diffusivity from ≈3% SrCl2 PFA:OPC CPS in tap water (open circuit)

282
Appendix 5.9 Rate of diffusivity from ≈3% CsCl PFA:OPC CPS in tap water (open circuit)
Appendix 5.10 Rate of diffusivity from ≈3% SrCO3 PFA:OPC CPS in tap water (open circuit)

283
Appendix 6.1 Rate of diffusivity from control BFS:OPC CPS in CSPW
Appendix 6.2 Rate of diffusivity from control BFS:OPC CPS in DSPW
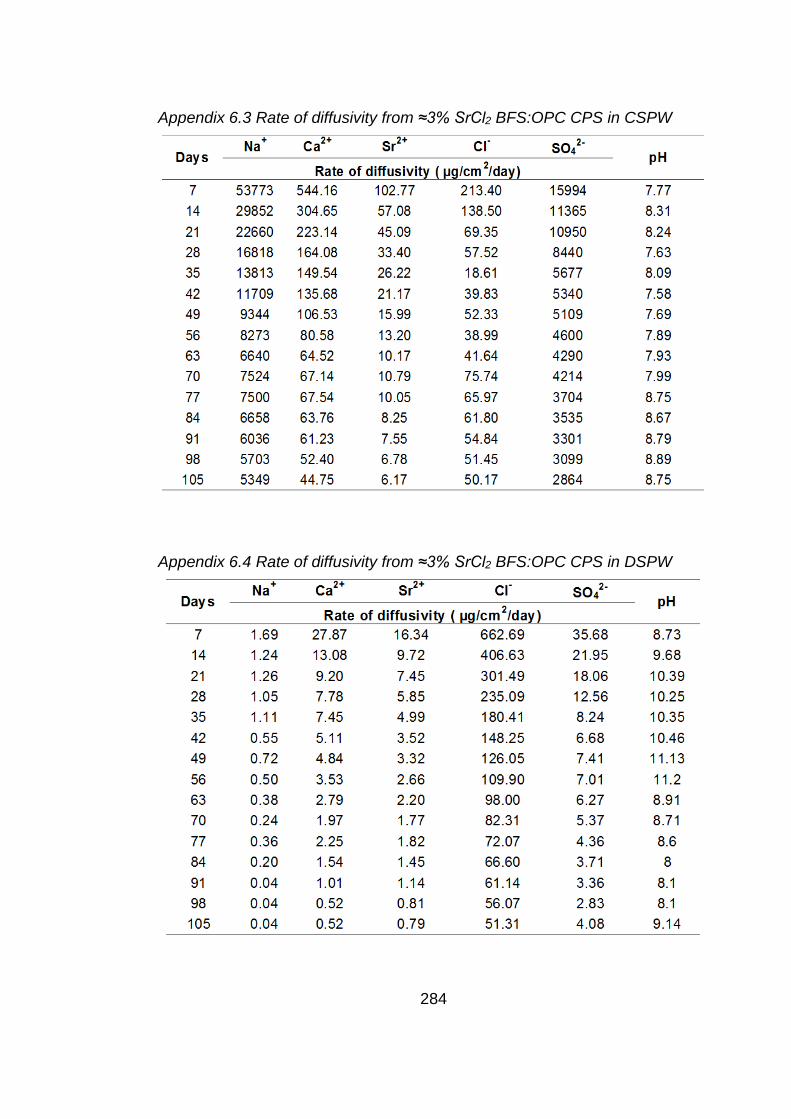
284
Appendix 6.3 Rate of diffusivity from ≈3% SrCl2 BFS:OPC CPS in CSPW
Appendix 6.4 Rate of diffusivity from ≈3% SrCl2 BFS:OPC CPS in DSPW
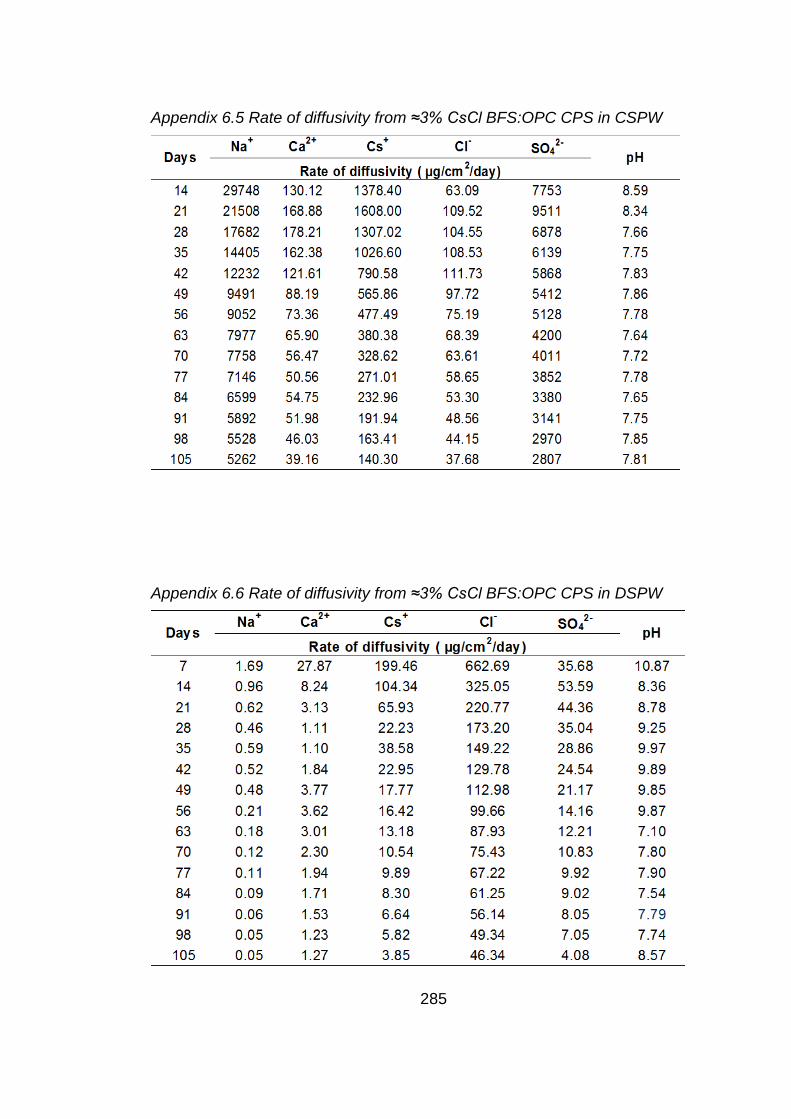
285
Appendix 6.5 Rate of diffusivity from ≈3% CsCl BFS:OPC CPS in CSPW
Appendix 6.6 Rate of diffusivity from ≈3% CsCl BFS:OPC CPS in DSPW

286
Appendix 6.7 Rate of diffusivity from ≈3% SrCO3 BFS:OPC CPS in CSPW
Appendix 6.8 Rate of diffusivity from ≈3% SrCO3 BFS:OPC CPS in DSPW

287
Appendix 6.9 Rate of diffusivity from ≈0.3% SrCl2 BFS:OPC CPS in CSPW
Appendix 6.10 Rate of diffusivity from ≈0.3% SrCl2 BFS:OPC CPS in DSPW
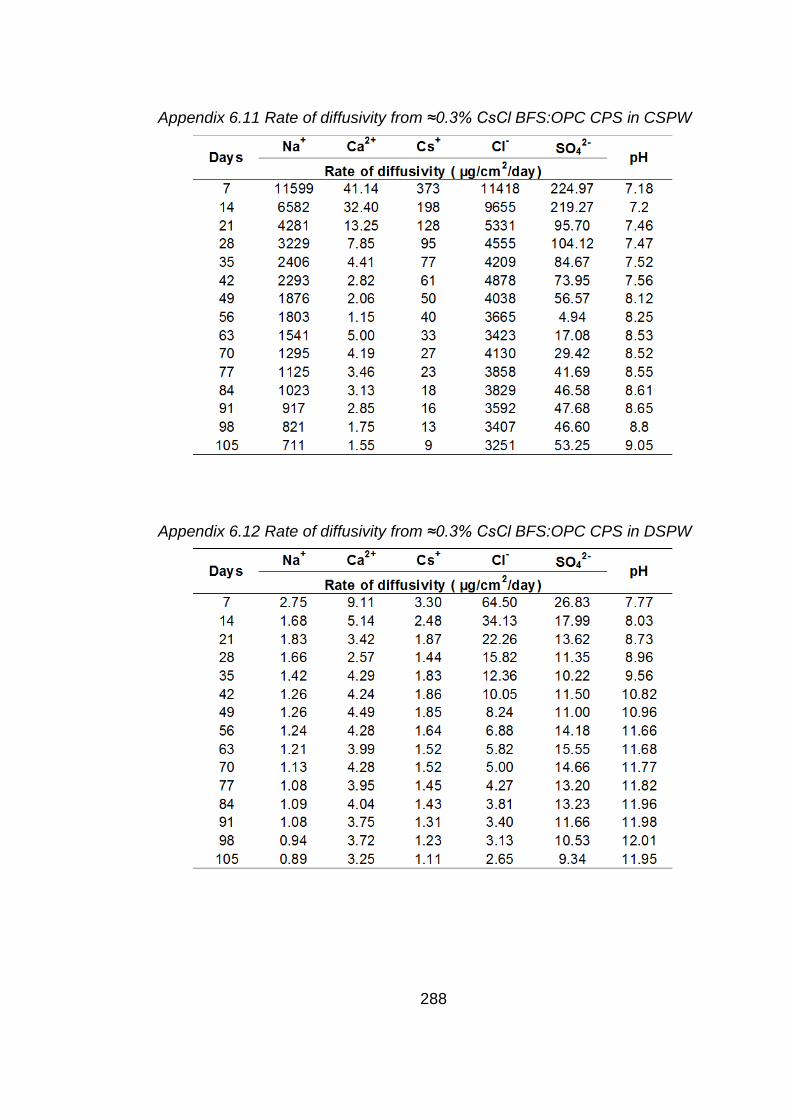
288
Appendix 6.11 Rate of diffusivity from ≈0.3% CsCl BFS:OPC CPS in CSPW
Appendix 6.12 Rate of diffusivity from ≈0.3% CsCl BFS:OPC CPS in DSPW
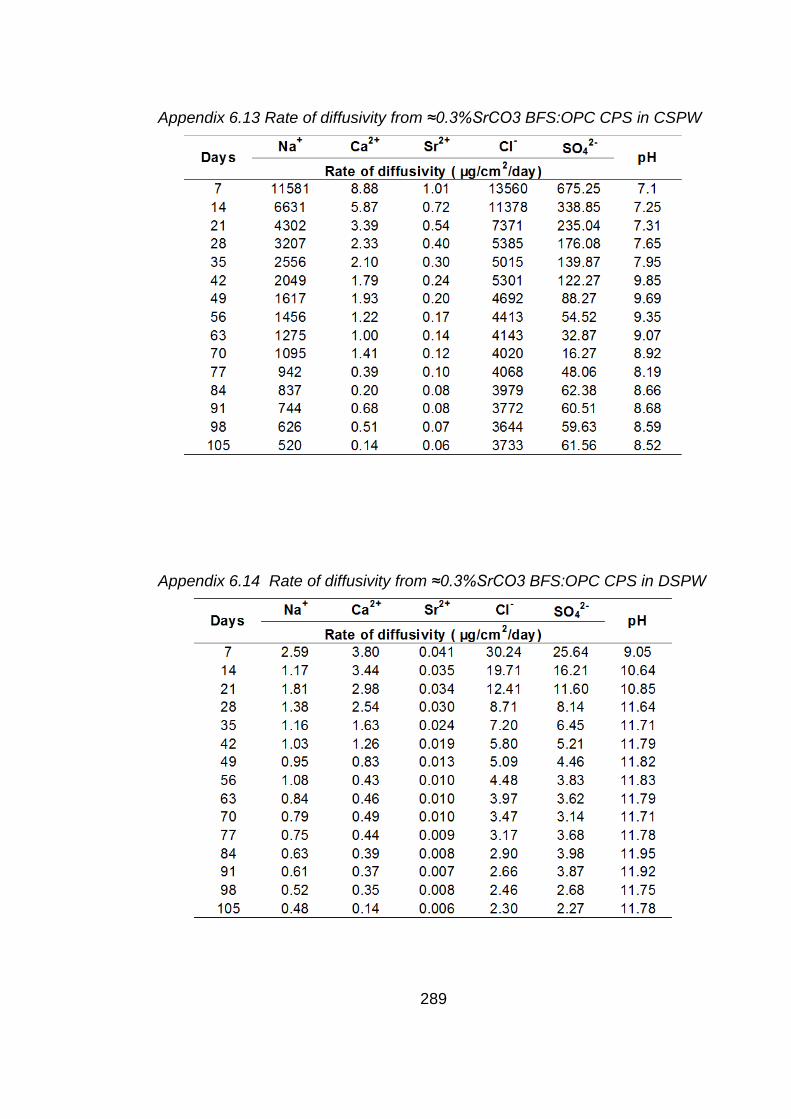
289
Appendix 6.13 Rate of diffusivity from ≈0.3%SrCO3 BFS:OPC CPS in CSPW
Appendix 6.14 Rate of diffusivity from ≈0.3%SrCO3 BFS:OPC CPS in DSPW
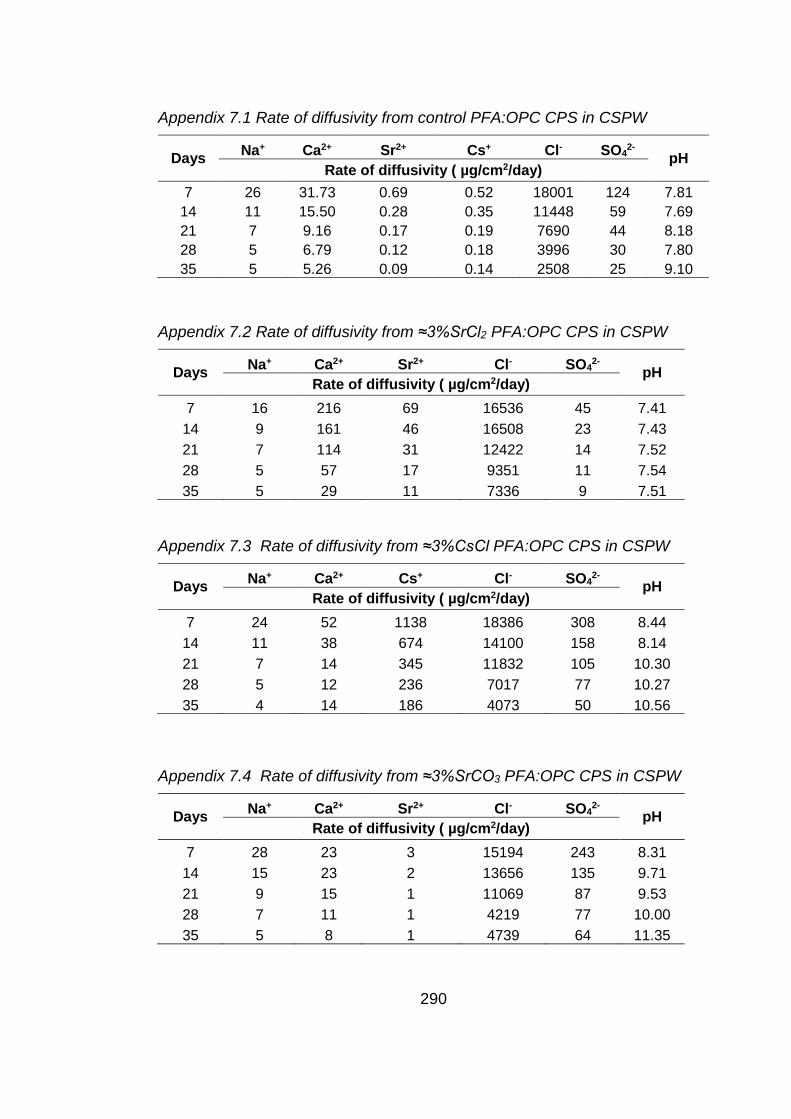
290
Appendix 7.1 Rate of diffusivity from control PFA:OPC CPS in CSPW
Days Na+ Ca2+ Sr2+ Cs+ Cl- SO42- pH
Rate of diffusivity ( µg/cm2/day) 7 26 31.73 0.69 0.52 18001 124 7.81
14 11 15.50 0.28 0.35 11448 59 7.69 21 7 9.16 0.17 0.19 7690 44 8.18 28 5 6.79 0.12 0.18 3996 30 7.80 35 5 5.26 0.09 0.14 2508 25 9.10
Appendix 7.2 Rate of diffusivity from ≈3%SrCl2 PFA:OPC CPS in CSPW
Days Na+ Ca2+ Sr2+ Cl- SO42- pH
Rate of diffusivity ( µg/cm2/day) 7 16 216 69 16536 45 7.41 14 9 161 46 16508 23 7.43 21 7 114 31 12422 14 7.52 28 5 57 17 9351 11 7.54 35 5 29 11 7336 9 7.51
Appendix 7.3 Rate of diffusivity from ≈3%CsCl PFA:OPC CPS in CSPW
Days Na+ Ca2+ Cs+ Cl- SO42- pH
Rate of diffusivity ( µg/cm2/day) 7 24 52 1138 18386 308 8.44 14 11 38 674 14100 158 8.14 21 7 14 345 11832 105 10.30 28 5 12 236 7017 77 10.27 35 4 14 186 4073 50 10.56
Appendix 7.4 Rate of diffusivity from ≈3%SrCO3 PFA:OPC CPS in CSPW
Days Na+ Ca2+ Sr2+ Cl- SO42- pH
Rate of diffusivity ( µg/cm2/day) 7 28 23 3 15194 243 8.31 14 15 23 2 13656 135 9.71 21 9 15 1 11069 87 9.53 28 7 11 1 4219 77 10.00 35 5 8 1 4739 64 11.35
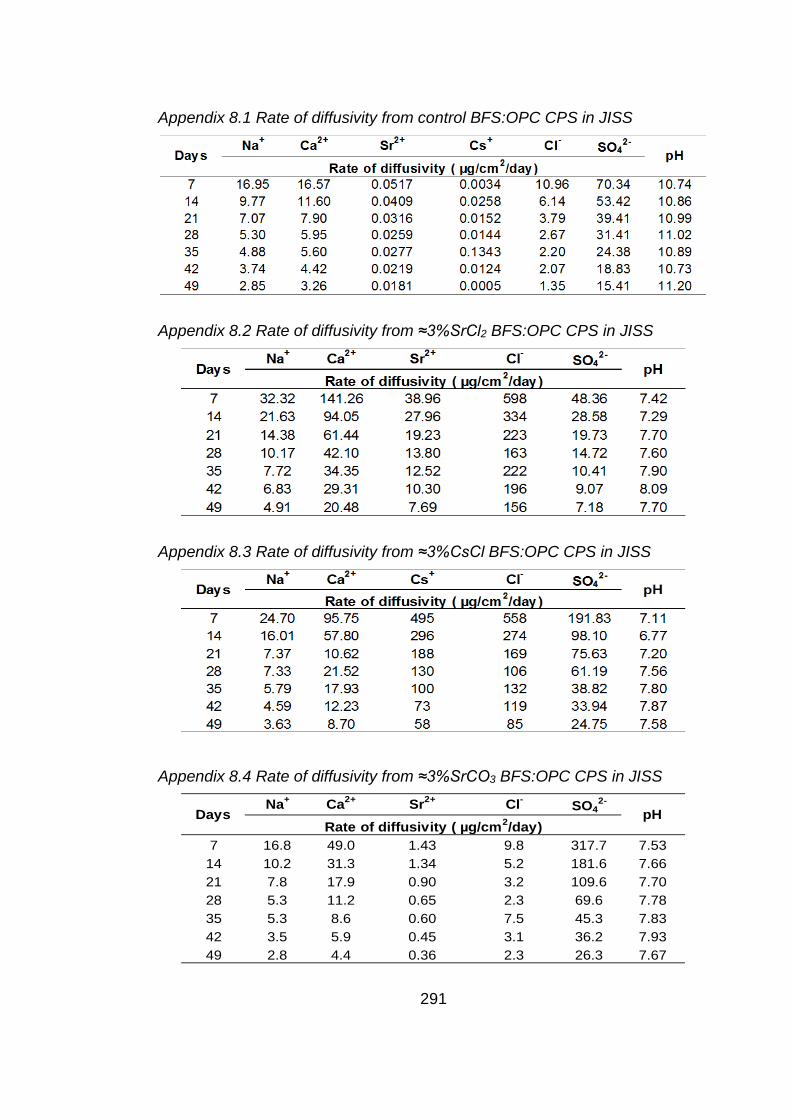
291
Appendix 8.1 Rate of diffusivity from control BFS:OPC CPS in JISS
Appendix 8.2 Rate of diffusivity from ≈3%SrCl2 BFS:OPC CPS in JISS
Appendix 8.3 Rate of diffusivity from ≈3%CsCl BFS:OPC CPS in JISS
Appendix 8.4 Rate of diffusivity from ≈3%SrCO3 BFS:OPC CPS in JISS
Na+ Ca2+ Sr2+ Cl- SO42-
7 16.8 49.0 1.43 9.8 317.7 7.5314 10.2 31.3 1.34 5.2 181.6 7.6621 7.8 17.9 0.90 3.2 109.6 7.7028 5.3 11.2 0.65 2.3 69.6 7.7835 5.3 8.6 0.60 7.5 45.3 7.8342 3.5 5.9 0.45 3.1 36.2 7.9349 2.8 4.4 0.36 2.3 26.3 7.67
Days pHRate of diffusivity ( µg/cm2/day)

292
Appendix 9.1 Rate of diffusivity from control PFA:OPC CPS in JISS
Appendix 9.2 Rate of diffusivity from ≈3%SrCl2 PFA:OPC CPS in JISS
Appendix 9.3 Rate of diffusivity from ≈3%CsCl PFA:OPC CPS in JISS
Appendix 9.4 Rate of diffusivity from ≈3%SrCO3 PFA:OPC CPS in JISS
Na+ Ca2+ Sr2+ Cs+ Cl- SO42-
7 52.47 5.61 0.033 0.050 18.66 118.21 12.1514 32.24 2.53 0.022 0.018 10.04 64.32 12.2421 23.11 2.12 0.017 0.013 6.10 44.90 12.2328 16.58 1.52 0.012 0.020 5.56 35.00 12.2735 13.63 1.44 0.013 0.018 3.67 29.02 12.2542 11.27 1.17 0.015 0.017 3.10 23.83 12.1649 9.07 0.97 0.009 0.012 2.43 18.13 12.11
Days pHRate of diffusivity ( µg/cm2/day)
Na+ Ca2+ Cs+ Cl- SO42-
7 45.7 12.0 861 1064 153.3 11.6314 30.5 5.1 528 597 90.5 11.8521 21.2 2.9 346 388 58.7 11.9928 16.7 2.1 259 273 41.7 11.9835 10.8 1.2 163 163 22.3 11.9242 6.4 0.4 94 83 11.4 11.8449 4.3 0.2 58 49 7.1 11.74
Days pHRate of diffusivity ( µg/cm2/day)
Na+ Ca2+ Sr2+ Cl- SO42-
7 61.4 4.1 0.09 15.6 149.2 12.1614 40.0 0.9 0.05 8.5 88.5 12.1221 25.3 0.5 0.03 5.9 54.5 12.1928 20.8 0.2 0.02 4.4 37.5 12.1435 14.1 0.3 0.02 3.6 27.0 12.1142 6.8 0.3 0.01 2.7 20.5 12.0549 7.6 0.3 0.01 2.1 16.4 11.99
Days pHRate of diffusivity ( µg/cm2/day)


