

I R E L A N D F R E S HR E P O R T

2 IRELAND FRESH REPORT
IN IRELAND FRESH FOODS COMPRISE >56% OF TOTAL GROCERY SPENDING
FRESH FOODS:• Contribute >56 percent of total grocery
spending in Multiples• Help drive strong retailer equity• Are high-traffic volume boosters• Good value for money is a key demand
of the Irish consumer

3IRELAND FRESH REPORT Copyright © 2013 The Nielsen Company
Fresh foods currently contribute around 56% of total Grocery
(including Personal Care) value sales on latest MAT in Nielsen TSR
Multiples sales data (ROI)3. In terms of year on year growth,
total Fresh Foods* performance is flat (-0.8% year on year) in line
with total Food, Grocery and Personal Care performance (-0.5%
year on year). The same trend is reflected in our latest Nielsen
ShopperTrends survey2, where Irish shoppers claim fresh foods to
be around 53 percent of total Grocery and Personal Care spend on
average.
MEAT & POULTRY & FISH
PRODUCE
CHILLED CABINET
BAKERY
DELI
FRESH SHOPPERS ARE VALUABLE TO IRISH SUPERMARKETS
56% 21%
21%
38%
15%
5%
FRESH FOODS CONTRIBUTION TO TOTAL FOOD, DRINK & PERSONAL CARE SALES IN MULTIPLES LATEST MAT
Source: Nielsen latest TSR Multiples read: latest 12 months to we 14 April 2013
% Share of Fresh Expenditure
4 IRELAND FRESH REPORT
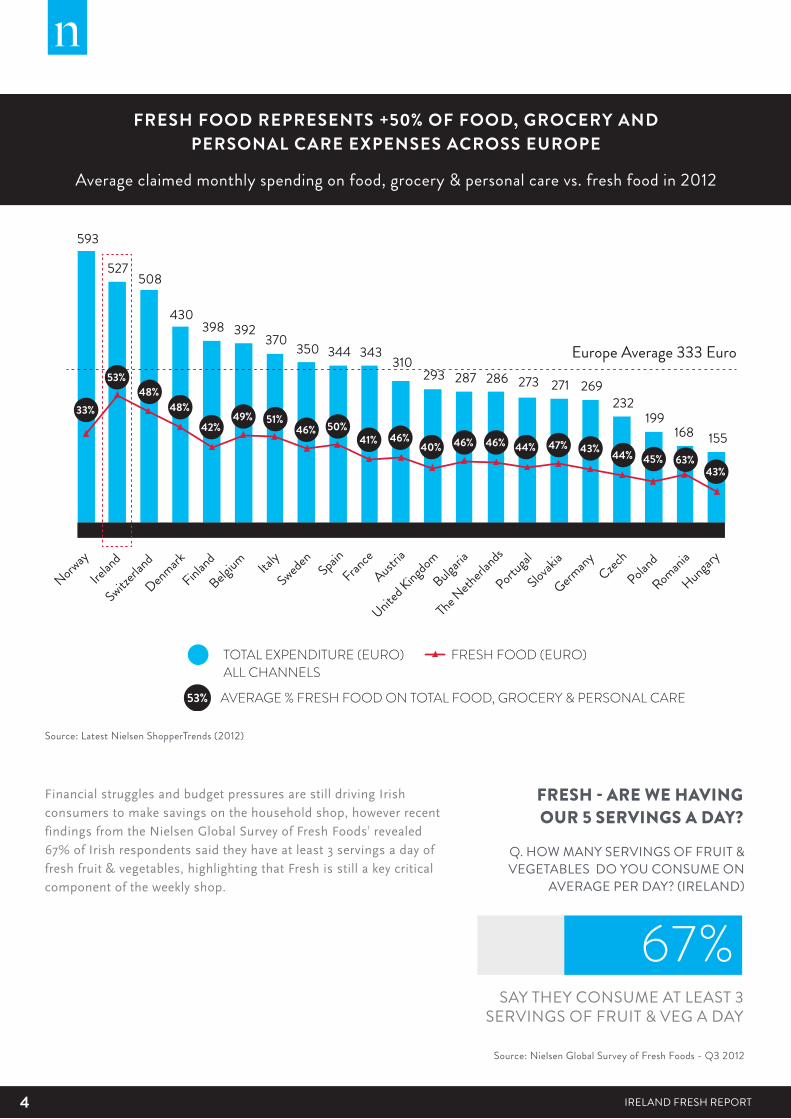
Financial struggles and budget pressures are still driving Irish
consumers to make savings on the household shop, however recent
findings from the Nielsen Global Survey of Fresh Foods¹ revealed
67% of Irish respondents said they have at least 3 servings a day of
fresh fruit & vegetables, highlighting that Fresh is still a key critical
component of the weekly shop.
FRESH FOOD REPRESENTS +50% OF FOOD, GROCERY AND PERSONAL CARE EXPENSES ACROSS EUROPE
Average claimed monthly spending on food, grocery & personal care vs. fresh food in 2012
Europe Average 333 Euro
TOTAL EXPENDITURE (EURO) ALL CHANNELS
FRESH FOOD (EURO)
AVERAGE % FRESH FOOD ON TOTAL FOOD, GROCERY & PERSONAL CARE53%
593
527 508
430 398 392
370 350 344 343 310
293 287 286 273 271 269 232
199 168 155
Norway
Irelan
d
Switzerlan
d
Denmark
Finland
Belgium
Italy
Sweden Spain
France
Austria
United Kingdom
Bulgaria
The Neth
erlands
Portugal
Slovakia
Germany
Czech
Poland
Romania
Hungary
33%
53% 48%
48%
42% 49% 51%
46% 50% 41% 46%
40% 46% 46% 44% 47% 43% 44% 45% 63% 43%
SAY THEY CONSUME AT LEAST 3 SERVINGS OF FRUIT & VEG A DAY
Source: Nielsen Global Survey of Fresh Foods - Q3 2012
Source: Latest Nielsen ShopperTrends (2012)
FRESH - ARE WE HAVING OUR 5 SERVINGS A DAY?
Q. HOW MANY SERVINGS OF FRUIT & VEGETABLES DO YOU CONSUME ON
AVERAGE PER DAY? (IRELAND)
67%

5IRELAND FRESH REPORT Copyright © 2013 The Nielsen Company
FRESH IMPORTANT THOUGH NOT IMMUNE TO PRICE PRESSURES OR QUALITY ISSUESPrice fluctuations for fresh products are driven by supply and
demand, adverse weather conditions, seasonality and industry issues
(for example the recent horse meat crisis), and all can produce
challenges in Fresh for the retailers. Understanding consumer
demand and what they actually want, is a critical link to building
successful strategies to improve both loyalty and profit margins.
The Irish consumer has become extremely price conscious in recent
times. More than 60% compare prices when out shopping for
groceries¹. In addition, half (49%) of Irish respondents in the latest
Nielsen ShopperTrends Survey² said that rising food prices affect their
purchasing of fresh fruit and veg, with meat and poultry categories
impacted further (63%) and Fish & Seafood (65%).
In a measure of retailer equity for Ireland, the availability of high
quality fresh foods was ranked among the top 10 drivers out of
the 25 criteria measured. Interestingly ‘Everything I need in One
Shop’ at No 4 suggests the consumer prefers not to have to shop
around. However, as the impact of economic pressures continue,
and shoppers do continue to shop around, it is critically important
to understand where consumers go for a lower priced option and
where they are willing to trade up because they perceive the value to
be worth it. Fresh food is a high-traffic builder, and if you want to keep
the consumer in the one shop, it is essential to have strong ranges
and vibrant arrays of high quality products, with knowledgeable staff
on hand.

6 IRELAND FRESH REPORT
IRELAND: TOP 10 RETAILER STORE EQUITY DRIVERS
PROVIDE ENJOYABLE SHOPPER EXPERIENCE
A PLACE WHERE IT’S EASY TO QUICKLY FIND
ALWAYS HAVE WHAT I WANT IN STOCK
EVERY THING I NEED IN ONE SHOP
PLEASANT STORE ENVIRONMENT
STAFF PROVIDE EXCELLENT CUSTOMER SERVICE
HAS HIGH QUALITY PREMIUM BRANDS
HAS A WIDER VARIETY OF PRODUCTS
WELL PRESENTED PRODUCT DISPLAYS
HIGH QUALITY FRESH FOOD
1
2
3
4
5
6
7
8
9
10
Source: Latest Nielsen ShopperTrends (2012) - Supermarkets

7IRELAND FRESH REPORT Copyright © 2013 The Nielsen Company
FRESH FOOD IS A HIGH-TRAFFIC BUILDER FOR SUPERMARKETSIn Ireland, we shop for Fresh foods 2.5 times per week on average, with
shopping trips most frequent for fruits and vegetables (3.2 times per
week) and least frequent for fish and seafood (1.6 times per week).
When it comes to where we shop for fresh food, the main supermarket
channel reigns supreme in Ireland. Our Nielsen ShopperTrends reports
consumers in general shop up to 9.4 times a month in Supermarkets
and the Fresh survey indicates that 70 percent on average of online
respondents say they shop at Supermarkets in particular for Fresh
Foods2.
While lowest at 62% for Meat & Poultry, this rises to 72% for Fresh
Produce, 75% for Dairy and 78% for Delicatessen products. While open
markets and speciality shops for fruits and vegetables, and bakeries for
breads are important destinations for these products throughout a lot
of countries in Europe, this is not so in Ireland, and thus Supermarkets
win out here. However, in terms of Meat & Poultry, 23% say they buy at
a butcher (a figure possibly higher since the horse meat crisis in 2013).
MEAT & POULTRY
FISH & SEAFOOD
SUPERMARKET
SUPERMARKET
SUPERMARKET
HYPERMARKET
HYPERMARKET
HYPERMARKET
BUTCHER
FISH SHOP
FRUIT & VEG SHOP
CONVENIENCE STORE / OTHER
CONVENIENCE STORE / OTHER
IRELAND - WHERE WE SHOP FRESH FOODS
62%
64%
72%
23%
17%
9%
12%
16%
16%
3%
3%
3%
FRUITS & VEGETABLES
CONVENIENCE STORE / OTHER

8 IRELAND FRESH REPORT
SUPERMARKET
SUPERMARKET
SUPERMARKET
HYPERMARKET
HYPERMARKET
HYPERMARKET
BAKERY
CONVENIENCE STORE / OTHER
CONVENIENCE STORE / OTHER
CONVENIENCE STORE / OTHER
DAIRY
75%
70%
78%
22%
22%
18%
3%
3%
5%
4%
BREAD & BAKERY
DELICATESSEN
Source: Nielsen Global Survey of Fresh Foods - Q3 2012

9IRELAND FRESH REPORT Copyright © 2013 The Nielsen Company
TOP 3 RETAILER ATTRIBUTES WHEN SELECTING WHERE TO SHOP FOR FRESH FOODSWhile ‘good value for money’ is generally the most important criteria
for buying Fresh among Europeans, it is Freshness in Asia-Pacific,
Latin America and Middle East/Africa (with slight variations from
country to country reflective of the country and it’s culture). In GB,
interestingly Convenience is of paramount important for Fresh Foods,
while the French insist on high quality for their bread, and the Irish
demand good value and high quality for their meat & poultry.
With the recent horse meat scare in Ireland, this demand for high
quality is likely to be even more pronounced. Long term frozen burger
sales are down (-47% year on year) in latest Nielsen TSR Multiples
data on the current MAT³ and declines have spread to Frozen Meat
Ready Meals (-23% year on year). The Association of Craft Butchers
in Ireland also recently reported a 20% increase in shoppers picking
their local butchers over supermarkets since the horsemeat scandal
broke⁴.

10 IRELAND FRESH REPORT
EUROPE FRANCE GB IRELAND
IRELAND – WHAT INFLUENCES ON WHERE YOU BUY?
MEAT/POULTRY
FISH/SEAFOOD
FRUITS/VEGETABLES
DAIRY
BREAD/BAKERY
DELICATESSEN
Good value
Good value
Good Value
Good Value
Fresh Selection
Good Value
Fresh Selection
Convenience
Fresh Selection
Convenience
Convenience
Wide Variety
Fresh Selection
Convenience
Good Value
Convenience
Wide Variety
Convenience
Convenience
High Quality
Convenience
High Quality
Convenience
Wide Variety
Convenience
Local Produce
Good Value
Convenience
Convenience
Wide Variety
Good Value
Wide Variety
Good Value
Fresh Selection
Good Value
Wide Variety
Good Value
Fresh Selection
Good Value
Fresh Selection
Good Value
Wide Variety
High Quality
Fresh Selection
Fresh Selection
High Quality
Fresh Selection
Convenience
Convenience
Fresh Selection
Convenience
Fresh Selection
Convenience
Wide Variety
Convenience
Convenience
Convenience
Convenience
Convenience
Convenience
Good value
Good value
Good Value
Good Value
Good Value
Good value
Good value
Good value
Good Value
Good value
High Quality
Good value
Source: Nielsen Global Survey of Fresh Foods - Q3 2012
11IRELAND FRESH REPORT Copyright © 2013 The Nielsen Company
IRELAND – WHAT INFLUENCES ON WHERE YOU BUY? THE IMPORTANCE OF UNDERSTANDING HOW CONSUMERS SHOP FRESHFresh foods are integral to the success of the retailer and high-traffic
volume boosters, thus expertise on shopper expectations is the key
to unlock the potential. It is imperative to apply a style of category
management based on the knowledge of the Irish consumer and to better
understand how different consumer groups purchase fresh differently; at
which stores, at which price points etc.
Improving the level of servicing in fresh store departments with friendly
staff in key areas such as the meat, deli counter, bakery, produce
departments, may gain customer respect. Customers appreciate the extra
attention and efficient service. In terms of meat and poultry in particular,
it is of utmost importance to ensure high quality standards and effectively
communicate the source of produce.
Consumers buy fresh products with their ‘eyes’ and thus display and
presentation are of critical importance. Freshness, quality, good value
for money and importantly, the human connection are important factors
that keep customers coming back for more. As a retailer, map shopper
expectancy clusters, eating habits and supply patterns of fresh produce
and find the balance. Applying some of these same characteristics to other
product categories and to other parts
of the store can bolster profits.
“THE BENEFITS OF USING CATEGORY MANAGEMENT TECHNIQUES AND PROCESSES ARE MORE CRITICAL THAN EVER FOR THE FRESH FOOD RETAILER GIVEN THE ECONOMIC ENVIRONMENT WE FIND OURSELVES IN.
NOT ONLY DOES IT GENERATE SHOPPER ENTHUSIASM FOR THE CATEGORY BY CREATING AN EASY TO NAVIGATE AND VISUALLY APPEALING SECTION, BUT IT ALSO SERVES A CRITICAL FUNCTIONAL PURPOSE BY MAKING THE BEST USE OF THE RETAIL SPACE AVAILABLE IN A MANNER THAT KEEPS PRODUCT WASTE TO A MINIMUM”.
MARK WALLEDGE, HEAD OF MERCHANDISING SERVICES, NIELSEN
12 IRELAND FRESH REPORT
For any queries on the article please contact
Karen Mooney [email protected]
For any Merchandising Services queries please contact
Mark Walledge [email protected]
Sources for article
¹ Source: Nielsen Global Survey of Fresh Foods, Q3 2012 - The survey
revealed how much fresh foods we consume, where we shop for
fresh products and why we shop these preferred retail channels.
² Nielsen ShopperTrends Survey 2012
³ Nielsen TSR Multiples data to w/e 14th April 2013 –
(Tesco, Supervalu, Superquinn, M&S, Eurospar).
*Fresh Foods is defined as: Meat, Poultry, Fish, Bakery, Dairy,
Deli Counter and Produce
**Total Food & Drink & Personal Care is defined as: Grocery,
Frozen, Meat, Poultry, Fish, total Bakery, total Chilled Cabinet,
Deli Counter, Produce, Alcohol and Health & Beauty
⁴ Irish Examiner 1st March 2013
ABOUT THE NIELSEN GLOBAL SURVEYThe Nielsen Global Survey of Fresh Foods was conducted between
August 10 and September 7, 2012 and polled more than 29,000
online consumers in 58 countries throughout Asia-Pacific, Europe,
Latin America, the Middle East, Africa and North America. The
sample has quotas based on age and sex for each country based on
their Internet users and is weighted to be representative of Internet
consumers and has a maximum margin of error of ±0.6%. This
Nielsen survey is based on the behaviour of respondents with online
access only. Internet penetration rates vary by country. Nielsen uses
a minimum reporting standard of 60 percent Internet penetration
or 10M online population for survey inclusion. The Nielsen Global
Survey, which includes the Global Consumer Confidence Index, was
established in 2005.

IRELAND FRESH REPORT
ABOUT THE NIELSEN SHOPPER TRENDS SURVEYThe Nielsen Shopper Trends Survey is an annual global study covering
54 markets with a total sample size of 87,000 respondents. The survey
is conducted online or with face-to-face in home interviews depending
on country and provides a comprehensive overview of fast-moving
consumer goods retail environment trends, banner equity tracking
and in-depth analysis of shopping patterns across markets and trade
sectors, which includes modern and traditional trade and personal
care stores.
ABOUT NIELSEN
Nielsen Holdings N.V. (NYSE: NLSN) is a global information and
measurement company with leading market positions in marketing
and consumer information, television and other media measurement,
online intelligence, mobile measurement, trade shows and related
properties. Nielsen has a presence in approximately 100 countries,
with headquarters in New York, USA and Diemen, the Netherlands.
For more information, visit www.nielsen.com.
Copyright © 2013 The Nielsen Company. All rights reserved. Nielsen
and the Nielsen logo are trademarks or registered trademarks of
CZT/ACN Trademarks, L.L.C. Other product and service names are
trademarks or registered trademarks of their respective companies.
13/6424


