


2
Is “Dead Data” Really Dead?Multiple Views of Historical
Fundamental Data
Marcus C. Bogue III, Ph.D.
Presented to Northfield’s 16th Annual Research Conference
March 16th through 18th, 2003
Stowe, Vermont

3/15/03
Overview• The Evolution of IBES Estimates and Actuals• Compustat Preliminary, As First Reported and
Restated (Regular)• Preliminary vs. As First Reported Sales• Portfolios with Differing Sales
3/15/03
Overview• The Evolution of IBES Estimates and Actuals• Compustat Preliminary, As First Reported and
Restated (Regular)• Preliminary vs. As First Reported Sales• Portfolios with Differing Sales

3/15/03
Exxon CorpThird Quarter 1998 EPS Estimates
0
20
40
60
80
100
3/1/1997 6/1/1997 9/1/1997 12/1/1997 3/1/1998 6/1/1998 9/1/1998
Ana
lyst
s
0.00
0.10
0.20
0.30
0.40
0.50
Ear
nin
gs
per
Sh
are
IBES Actual EPS: 0.288
Source: I/B/E/S DetailSource: I/B/E/S Detail

3/15/03
Exxon CorpThird Quarter 1998 EPS Estimates and Actuals
0.2
0.25
0.3
0.35
0.4
0.45
0.5
3/1/1997 9/1/1997 3/1/1998 9/1/1998 3/1/1999 9/1/1999 3/1/2000
Ear
nin
gs
per
Sh
are
Compustat Restated EPS
Compustat Preliminary EPSand IBES Actual EPS
Compustat As First Reported EPS
Source: I/B/E/S Detail, Compustat As First Reported and Compustat Preliminary

3/15/03
The Evolution of IBES Estimates and Actuals
• Estimates are Revised as Opinions Change• An Actual is Reported• Actual Should Equal Preliminary?• Preliminary may be Clarified• Company Files Report• Company may Revise Report• “Dead Numbers” are not Really Dead

3/15/03
Overview• The Evolution of IBES Estimates and Actuals• Compustat Preliminary, As First Reported and
Restated (Regular)• Preliminary vs. As First Reported Sales• Portfolios with Differing Sales
3/15/03
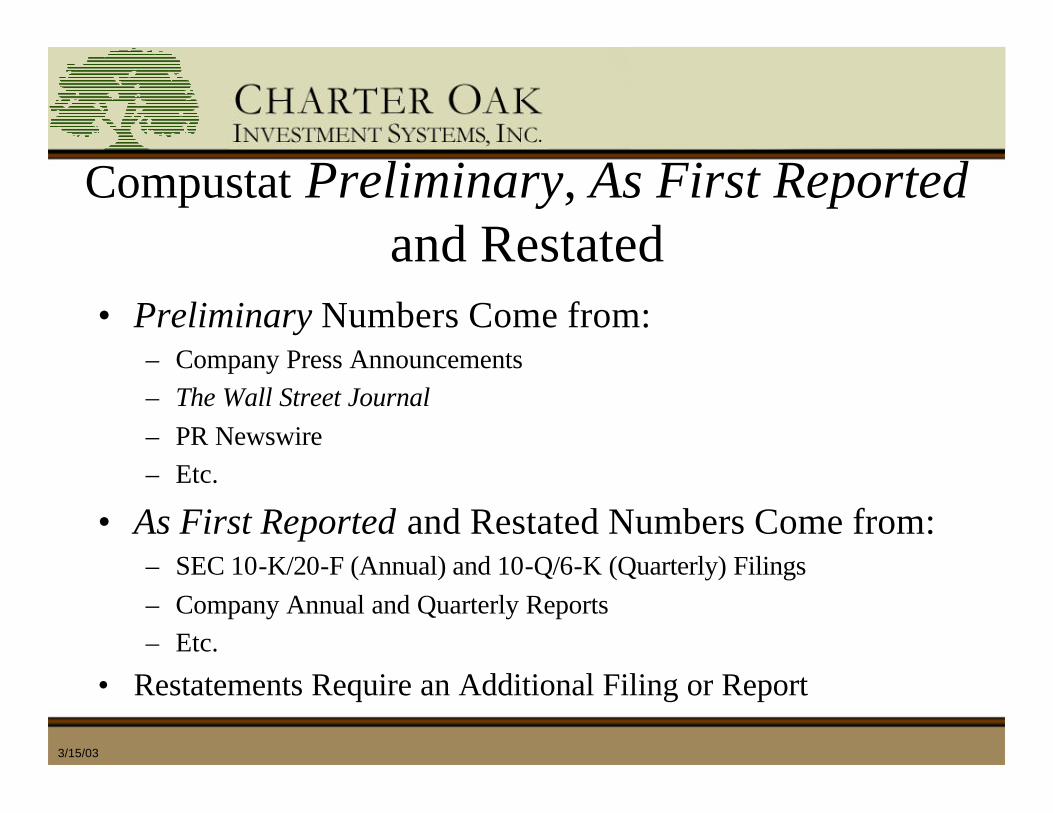
Compustat Preliminary, As First Reportedand Restated
• Preliminary Numbers Come from:– Company Press Announcements– The Wall Street Journal– PR Newswire– Etc.
• As First Reported and Restated Numbers Come from:– SEC 10-K/20-F (Annual) and 10-Q/6-K (Quarterly) Filings– Company Annual and Quarterly Reports– Etc.
• Restatements Require an Additional Filing or Report

3/15/03
Companies with Compustat Quarterly Preliminary Data
0%
25%
50%
75%
100%
Mar-87
Mar-88
Mar-89
Mar-90
Mar-91
Mar-92
Mar-93
Mar-94
Mar-95
Mar-96
Mar-97
Mar-98
Mar-99
Mar-00
Mar-01
Mar-02
S&P 500Next Largest 1000Next Largest 1000 to 2000
Compusat Did Not Collect Preliminary Data During this Period
3/15/03
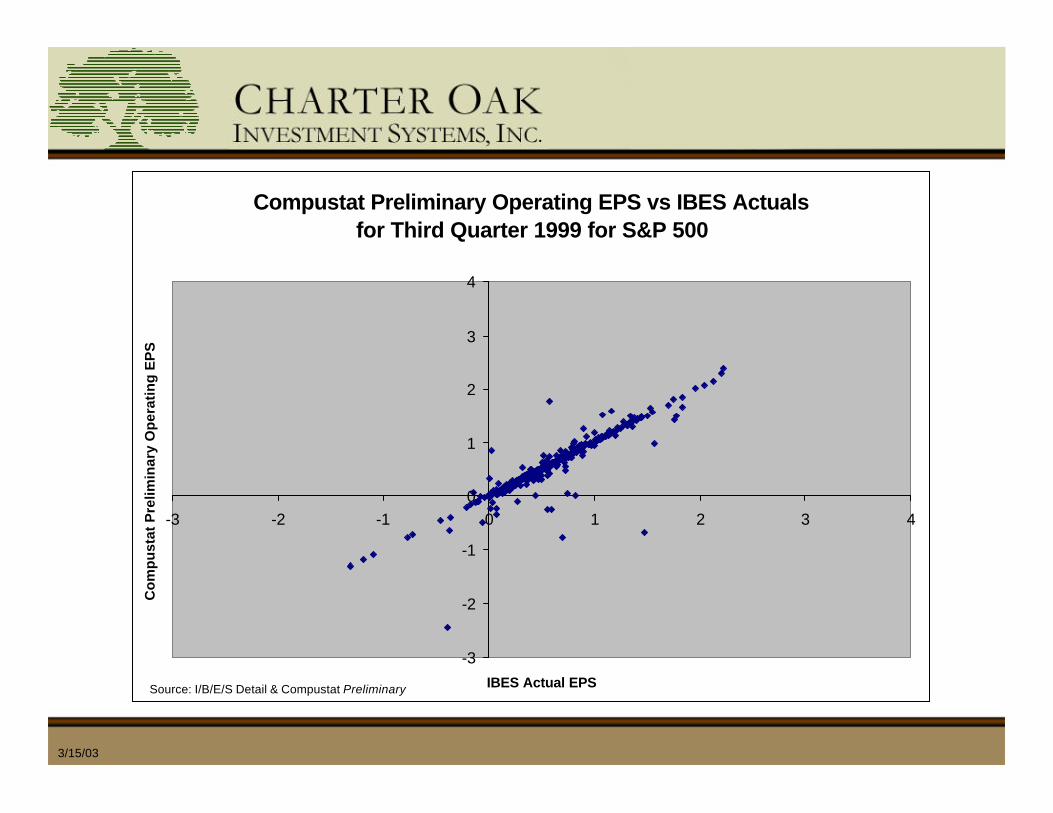
Compustat Preliminary Operating EPS vs IBES Actualsfor Third Quarter 1999 for S&P 500
-3
-2
-1
0
1
2
3
4
-3 -2 -1 0 1 2 3 4
IBES Actual EPS
Co
mp
ust
at P
relim
inar
y O
per
atin
g E
PS
Source: I/B/E/S Detail & Compustat Preliminary
3/15/03
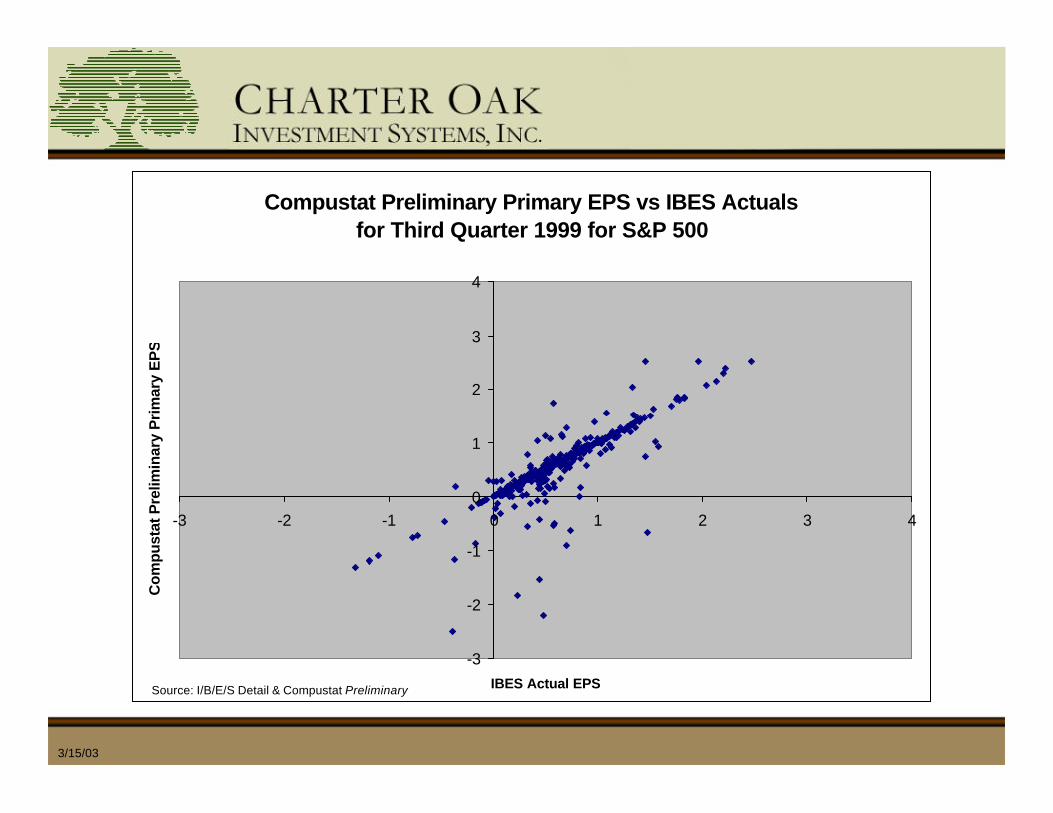
Compustat Preliminary Primary EPS vs IBES Actualsfor Third Quarter 1999 for S&P 500
-3
-2
-1
0
1
2
3
4
-3 -2 -1 0 1 2 3 4
IBES Actual EPS
Com
pust
at P
relim
inar
y P
rim
ary
EP
S
Source: I/B/E/S Detail & Compustat Preliminary

3/15/03
Percent of Companies withCompustat Operating and IBES Actual EPS
Differing by Less Than $0.01 for S&P 500
30%
35%
40%
45%
50%
55%
60%
65%
70%
Mar-90
Mar-91
Mar-92
Mar-93
Mar-94
Mar-95
Mar-96
Mar-97
Mar-98
Mar-99
Mar-00
Mar-01
Mar-02
Mar-03
Restated
As-First-Reported
Preliminary
Percent of Companies withCompustat Primary and IBES Actual EPSDiffering by Less Than $0.01 for S&P 500
30%
35%
40%
45%
50%
55%
60%
65%
70%
Mar-90
Mar-91
Mar-92
Mar-93
Mar-94
Mar-95
Mar-96
Mar-97
Mar-98
Mar-99
Mar-00
Mar-01
Mar-02
Mar-03
Restated
As-First-Reported
Preliminary

3/15/03
Actuals are Like Preliminary
• Actuals Match Operating EPS Best• Some Actuals Match Primary Better• Preliminary EPS Match Better Than As First
Reported

3/15/03
Companies with Compustat Quarterly Restatated Data
0%
10%
20%
30%
40%
50%
60%
Mar-87
Mar-88
Mar-89
Mar-90
Mar-91
Mar-92
Mar-93
Mar-94
Mar-95
Mar-96
Mar-97
Mar-98
Mar-99
Mar-00
Mar-01
Mar-02
S&P 500Next Largest 1000Next Largest 1000 to 2000 Restatements have yet to Happen

3/15/03
As First Reported vs. Restated Data
Exxon Mobil Corp
0
0.05
0.1
0.15
0.2
0.25
0.3
0.35
0.4
0.45
0.5
Jan-9
0Ja
n-91Ja
n-92Ja
n-93Ja
n-94Ja
n-95Ja
n-96Ja
n-97Ja
n-98Ja
n-99Ja
n-00Ja
n-01Ja
n-02
Sal
es to
Pri
ce R
atio
Restated
As First Reported
Exxon Mobil Corp
0
0.01
0.02
0.03
0.04
0.05
0.06
Jan-9
0Ja
n-91Ja
n-92Ja
n-93Ja
n-94Ja
n-95Ja
n-96Ja
n-97Ja
n-98Ja
n-99Ja
n-00Ja
n-01Ja
n-02
Cas
h Fl
ow to
Pri
ce R
atio
Restated
As First Reported

3/15/03
Overview• The Evolution of IBES Estimates and Actuals• Compustat Preliminary, As First Reported and
Restated (Regular)• Preliminary vs. As First Reported Sales• Portfolios with Differing Sales
3/15/03
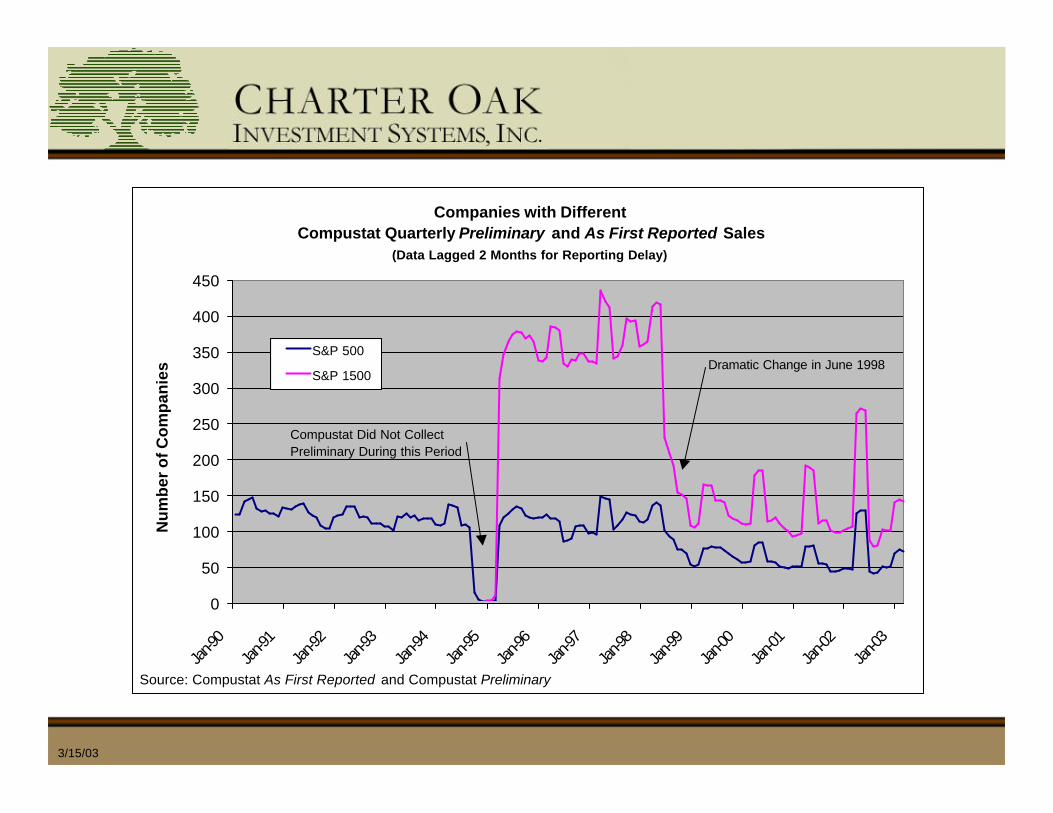
Companies with Different Compustat Quarterly Preliminary and As First Reported Sales
(Data Lagged 2 Months for Reporting Delay)
0
50
100
150
200
250
300
350
400
450
Jan-90
Jan-91
Jan-92
Jan-93
Jan-94
Jan-95
Jan-96
Jan-97
Jan-98
Jan-99
Jan-00
Jan-01
Jan-02
Jan-03
Nu
mb
er o
f Co
mp
anie
s
S&P 500
S&P 1500
Source: Compustat As First Reported and Compustat Preliminary
Compustat Did Not Collect Preliminary During this Period
Dramatic Change in June 1998

3/15/03
Companies with More Than 5% Difference in Preliminary and As First Reported Sales for First Quarter 1997 from the S&P 1500
0%
10%
20%
30%
40%
50%
60%
70%
80%
DUKE EN
ERGY C
ORPHFS
INC
SALO
MON SMITH
BARNEY
HLDGS
HOMESTA
KE M
INING
BEAR
STEA
RNS COMPA
NIES IN
C
FORTU
NE BRAN
DS INC
DEAN W
ITTER
DISCOVE
R & CO
COEUR D'AL
ENE M
INES CORP
INCO LTD
MALLIN
CKRODT IN
C
MANPO
WER IN
C/WI
TECO EN
ERGY I
NC
MORGAN (J
P) & C
O
MARAT
HON O
IL CORP
SCHWAB
(CHAR
LES)
CORP
WACHOVIA
CORP-OLD
NOVEN PH
ARMAC
EUTIC
ALS I
NC
SUNOCO IN
C
RAYMOND JA
MES FI
NANCIAL
CORP
PACIFIC
ORP
MOBIL CO
RP
ALEX
ANDER
& BA
LDWIN IN
C
AMER
ICAN IN
TERNAT
IONAL G
ROUP
CHIRON CORP
STAN
DARD PA
CIFIC CP
PINNAC
LE EN
TERTA
INMENT I
NC
PRIM
E HOSP
ITALIT
Y CORP
MERCAN
TILE B
ANKS
HARES
CORP
COMVERSE
TECHNOLO
GY INC
AMER
ICAN EX
PRES
S
COMDISCO IN
C.
CITY NAT
IONAL
CORP
UNUMPROVID
ENT C
ORP
NFO W
ORLDWIDE I
NC
FIRST
HEALT
H GROUP C
ORP
U S BA
NCORP-OLD
Dif
fere
nce
in Q
uar
terl
y S
ales
For First Quarter 1997 there were 340 of the S&P 1500 Companies with Differing As First Reported and Preliminary Sales

3/15/03
Preliminary vs. As First Reported Sales• Many Changes to Even the Sales Number• Dramatic Reduction in Number of Changes in
Mid 1998• Now Just Below 10% of S&P 1500 and Just
Above 10% of S&P 500 Exhibit Changes
3/15/03
Overview• The Evolution of IBES Estimates and Actuals• Compustat Preliminary, As First Reported and
Restated (Regular)• Preliminary vs. As First Reported Sales• Portfolios with Differing Sales

3/15/03
Portfolios with Differing Preliminary and As First Reported Salesfrom S&P 500
0
1
2
3
4
5
6
7
8
Jan-9
0Ja
n-91
Jan-9
2Ja
n-93
Jan-9
4Ja
n-95
Jan-9
6Ja
n-97
Jan-9
8Ja
n-99
Jan-0
0Ja
n-01
Jan-0
2Ja
n-03
Cum
ulat
ive
Val
ue o
f $1
Inve
sted
S&P 500 (Equally Weighted)
Preliminary > As First Reported Sales
Preliminary < As First Reported Sales
Source: Compustat As First Reported and Compustat Preliminary

3/15/03
Portfolios with Differing Preliminary and As First Reported Salesfrom S&P 500
-0.2
0
0.2
0.4
0.6
0.8
1
Jan-90
Jan-91
Jan-92
Jan-9
3Ja
n-94
Jan-9
5Ja
n-96
Jan-9
7
Jan-9
8
Jan-9
9
Jan-0
0
Jan-0
1
Jan-0
2Jan
-03Lo
g( C
um
ula
tive
Val
ue
of $
1 In
vest
ed ) S&P 500 (Equally Weighted)
Preliminary > As First Reported Sales
Preliminary < As First Reported Sales
Source: Compustat As First Reported and Preliminary
3/15/03
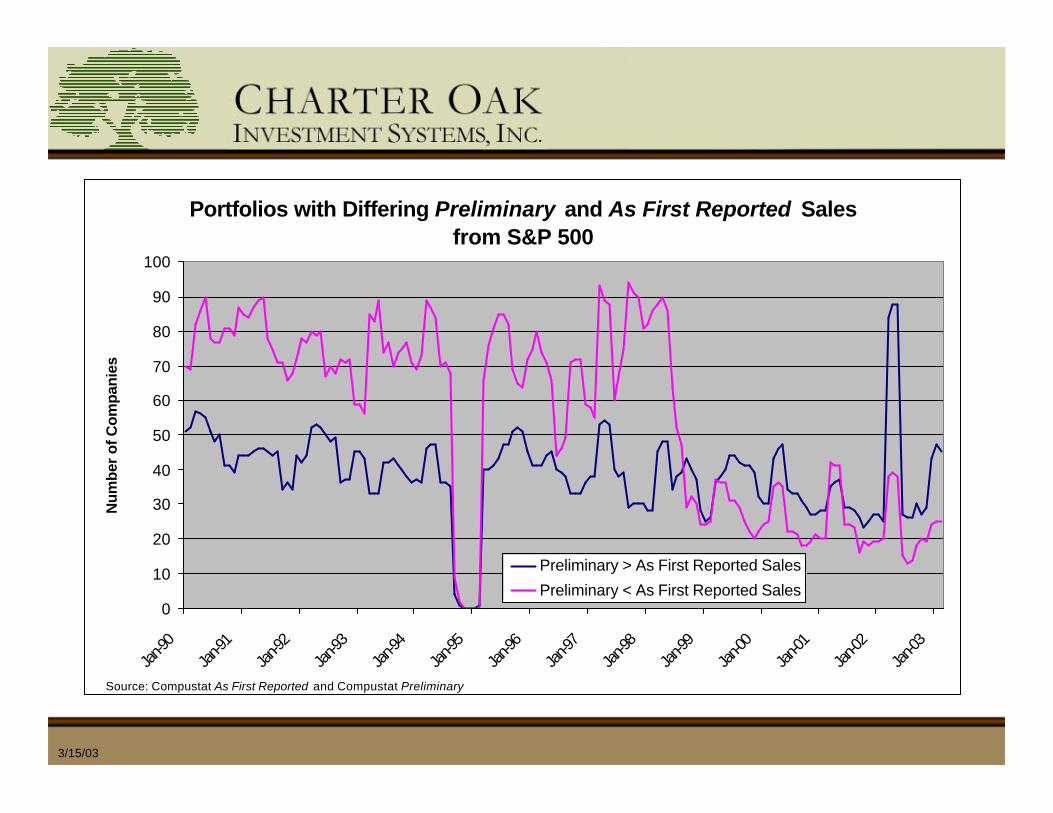
Portfolios with Differing Preliminary and As First Reported Salesfrom S&P 500
0
10
20
30
40
50
60
70
80
90
100
Jan-90
Jan-91
Jan-92
Jan-93
Jan-94
Jan-95
Jan-96
Jan-97
Jan-98
Jan-99
Jan-00
Jan-01
Jan-02
Jan-03
Num
ber
of C
ompa
nies
Preliminary > As First Reported Sales
Preliminary < As First Reported Sales
Source: Compustat As First Reported and Compustat Preliminary
3/15/03
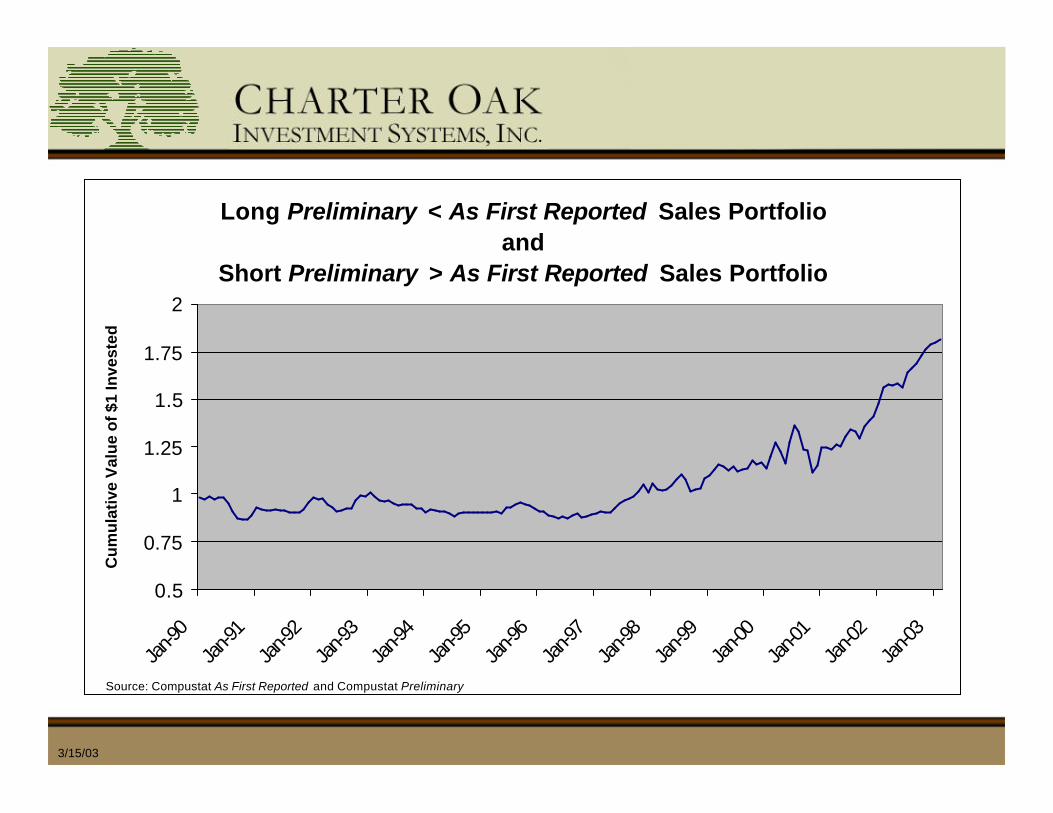
Long Preliminary < As First Reported Sales Portfolioand
Short Preliminary > As First Reported Sales Portfolio
0.5
0.75
1
1.25
1.5
1.75
2
Jan-9
0Ja
n-91
Jan-9
2Ja
n-93
Jan-9
4Ja
n-95
Jan-9
6Ja
n-97
Jan-9
8Ja
n-99
Jan-0
0Ja
n-01
Jan-0
2Ja
n-03
Cu
mu
lati
ve V
alu
e o
f $1
Inve
sted
Source: Compustat As First Reported and Compustat Preliminary
3/15/03
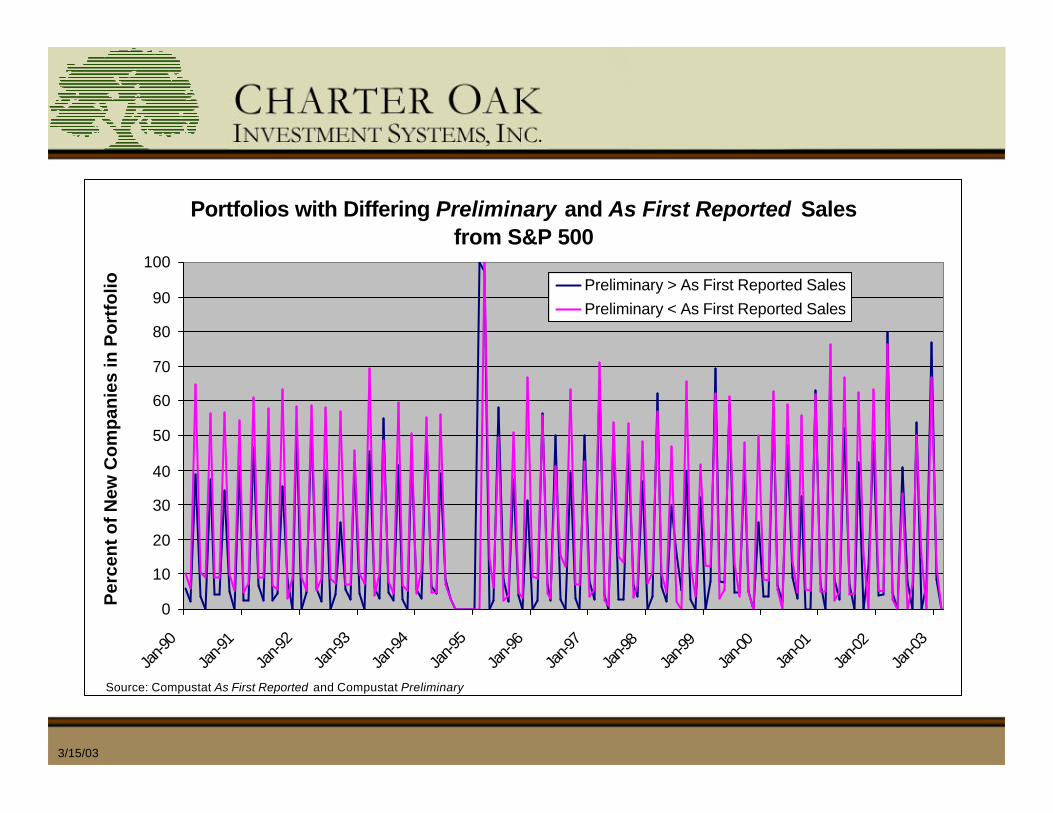
Portfolios with Differing Preliminary and As First Reported Salesfrom S&P 500
0
10
20
30
40
50
60
70
80
90
100
Jan-9
0Ja
n-91
Jan-9
2
Jan-9
3
Jan-9
4
Jan-9
5
Jan-9
6Ja
n-97
Jan-9
8Ja
n-99
Jan-0
0Ja
n-01
Jan-0
2Ja
n-03
Per
cen
t o
f N
ew C
om
pan
ies
in P
ort
folio Preliminary > As First Reported Sales
Preliminary < As First Reported Sales
Source: Compustat As First Reported and Compustat Preliminary

3/15/03
Market Capitalization Breakdown by Fiscal Year End Monthat the End of 2002
0
1
2
3
4
5
6
7
8
Jan Feb Mar Apr May Jun Jul Aug Sep Oct Nov Dec
Tota
l Mar
ket C
apita
lizat
ion
(Tri
llion
s)
S&P 500S&P 1500
6.5% for S&P 500, 6.3% for S&P 1500principally retail companies
6.8% for S&P 500, 6.8% for S&P 1500principally Microsoft and P&G
74.8% for S&P 500, 74.1% for S&P 1500

3/15/03
Portfolios with Differing Preliminary and As First Reported Salesfrom S&P 1500
0
1
2
3
4
5
Jan-95
Jan-96
Jan-97
Jan-98
Jan-99
Jan-00
Jan-01
Jan-02
Jan-03
Cum
ulat
ive
Val
ue o
f $1
Inve
sted
S&P 1500 (Equally Weighted)
Preliminary > As First Reported Sales
Preliminary < As First Reported Sales
Source: Compustat As First Reported and Compustat Preliminary

3/15/03
Portfolios with Differing Preliminary and As First Reported Salesfrom S&P 1500
0
0.25
0.5
0.75
Jan-95
Jan-96
Jan-97
Jan-98
Jan-99
Jan-00
Jan-01
Jan-02
Jan-03
Lo
g(
Cu
mu
lati
ve
Va
lue
of
$1
In
ve
ste
d )
S&P 1500 (Equally Weighted)
Preliminary > As First Reported Sales
Preliminary < As First Reported Sales
Source: Compustat As First Reported and Compustat Preliminary

3/15/03
Portfolios with Differing Preliminary and As First Reported Salesfrom S&P 1500
0
50
100
150
200
250
300
350
400
Jan-95
Jan-96
Jan-97
Jan-98
Jan-99
Jan-00
Jan-01
Jan-02
Jan-03
Nu
mb
er o
f Co
mp
anie
s
Preliminary > As First Reported SalesPreliminary < As First Reported Sales
Source: Compustat As First Reported and Compustat Preliminary
3/15/03
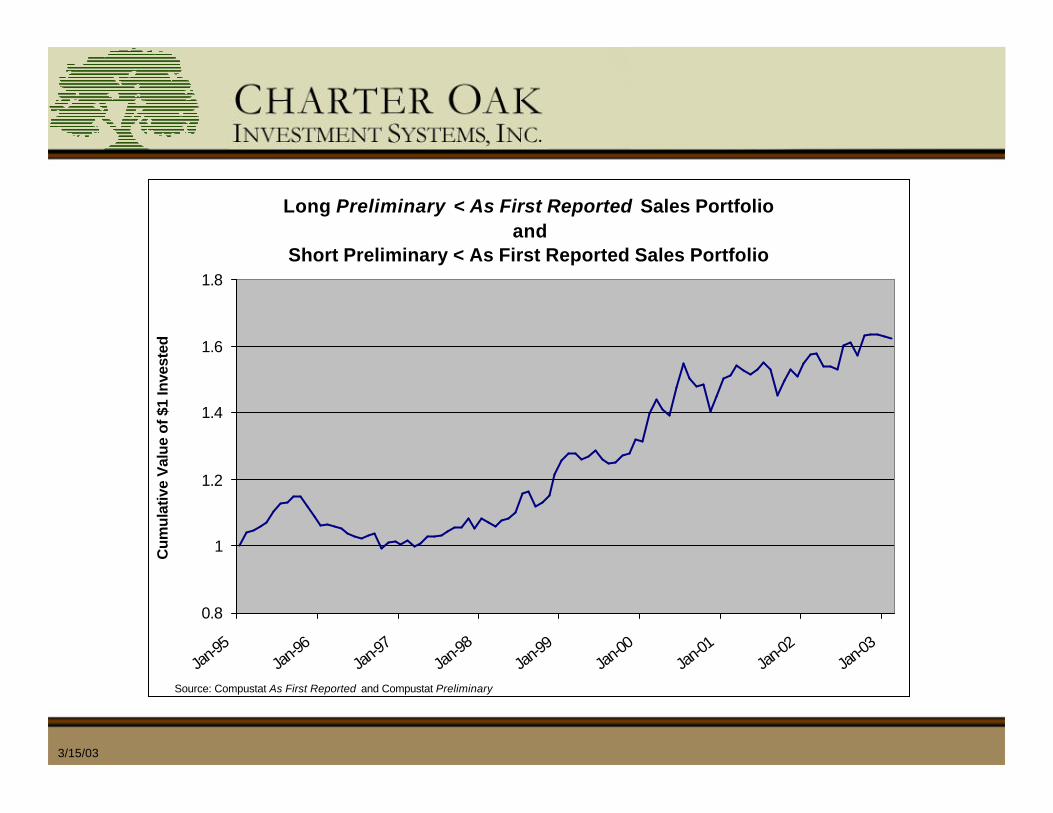
Long Preliminary < As First Reported Sales Portfolioand
Short Preliminary < As First Reported Sales Portfolio
0.8
1
1.2
1.4
1.6
1.8
Jan-95
Jan-96
Jan-97
Jan-98
Jan-99
Jan-00
Jan-01
Jan-02
Jan-03
Cum
ulat
ive
Val
ue o
f $1
Inve
sted
Source: Compustat As First Reported and Compustat Preliminary
3/15/03
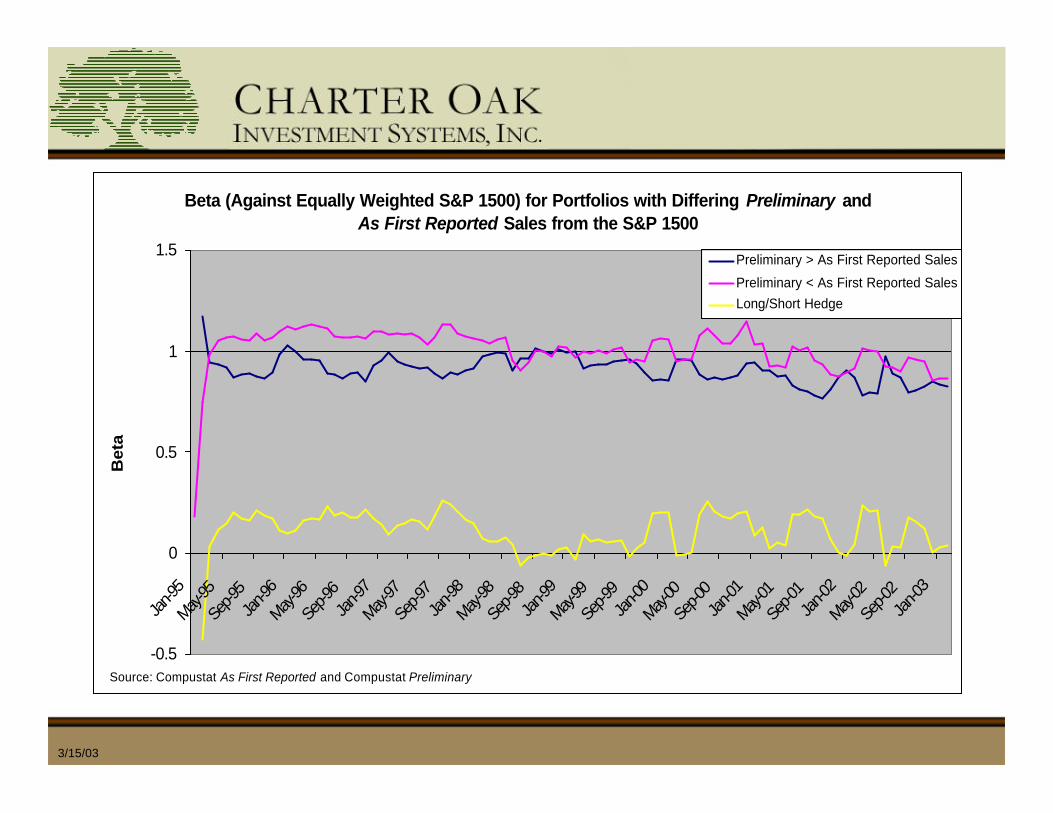
Beta (Against Equally Weighted S&P 1500) for Portfolios with Differing Preliminary and As First Reported Sales from the S&P 1500
-0.5
0
0.5
1
1.5
Jan-9
5
May-95
Sep-9
5Ja
n-96
May-96
Sep-9
6Ja
n-97
May-97
Sep-9
7Ja
n-98
May-98
Sep-9
8Ja
n-99
May-99
Sep-9
9Ja
n-00
May-00
Sep-0
0Ja
n-01
May-01
Sep-0
1Ja
n-02
May-02
Sep-0
2Ja
n-03
Bet
a
Preliminary > As First Reported Sales
Preliminary < As First Reported SalesLong/Short Hedge
Source: Compustat As First Reported and Compustat Preliminary
3/15/03
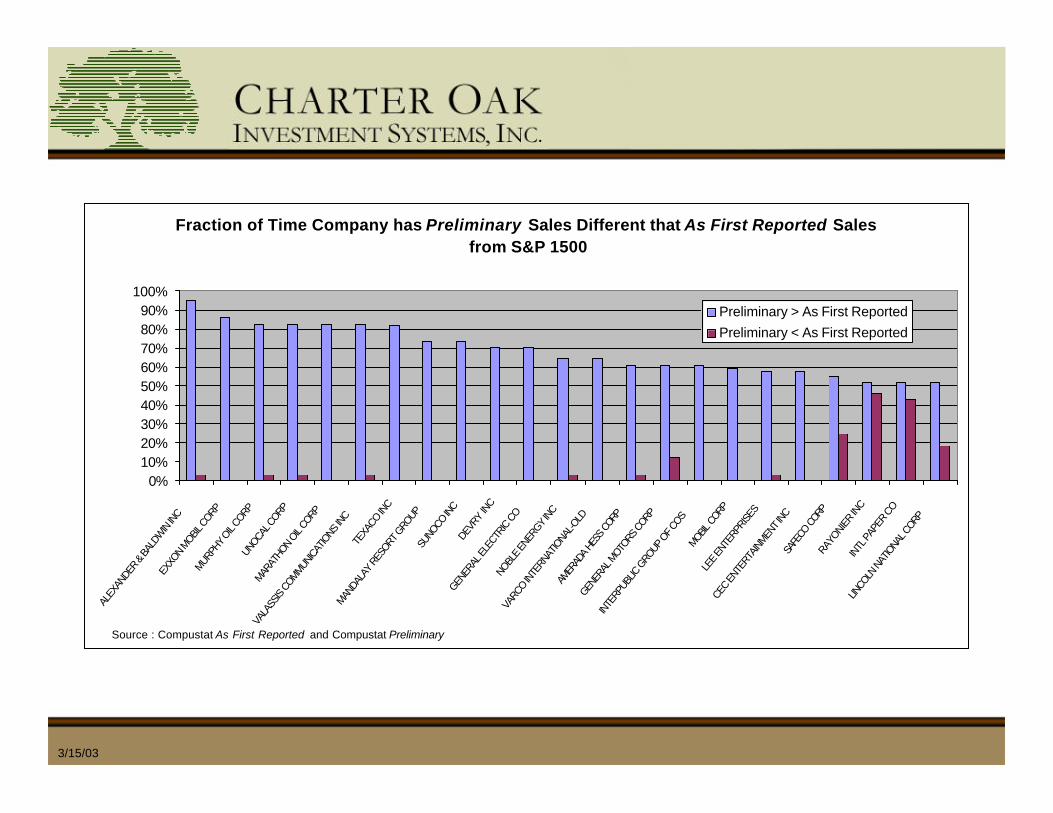
Fraction of Time Company has Preliminary Sales Different that As First Reported Sales from S&P 1500
0%10%20%30%40%50%60%70%80%90%
100%
ALEX
ANDE
R & B
ALDW
IN IN
CEX
XON
MOBIL C
ORP
MURPH
Y OIL
CORP
UNOCA
L CORP
MARAT
HON
OIL CO
RP
VALA
SSIS
COMMUN
ICAT
IONS
INC
TEXA
CO IN
C
MANDA
LAY
RESO
RT G
ROUP
SUNO
CO IN
CDE
VRY
INC
GENER
AL E
LECT
RIC
CONO
BLE E
NERG
Y INC
VARC
O INTE
RNAT
IONA
L-OLD
AMER
ADA
HESS
COR
P
GENER
AL M
OTORS
CORP
INTE
RPUB
LIC G
ROUP
OF C
OSMOBIL
CORP
LEE E
NTER
PRISE
S
CEC
ENTE
RTAIN
MENT I
NCSA
FECO
COR
PRA
YONI
ER IN
CIN
TL PA
PER
CO
LINCO
LN N
ATIO
NAL C
ORP
Preliminary > As First ReportedPreliminary < As First Reported
Source : Compustat As First Reported and Compustat Preliminary

3/15/03
Fraction of Time Company has Preliminary Sales Different that As First Reported Sales from S&P 1500
0%
10%
20%
30%40%
50%
60%
70%
80%
90%
TEXA
S IND
USTR
IES IN
C
SCHW
AB (C
HARL
ES) C
ORP
VALE
RO ENER
GY CORP
DEER
E & CO
DILLAR
DS INC -C
L A
HARLE
Y-DAV
IDSON IN
C
AMER
ICAN E
XPRE
SS
FLUOR C
ORP
SCIEN
TIFIC-
ATLA
NTA I
NC
WELLM
AN IN
C
Preliminary < As First Reported
Preliminary > As First Reported
Source: Compustat As First Reported and Compustat Preliminary

3/15/03
Portfolios with Differing Sales• Have Differing Return Characteristics,
Particularly after Mid 1998• Over and Under S&P 500 Portfolios are Small• Over and Under S&P 1500 Portfolios are Larger
and Much More Robust• There are Consistent Over and Under S&P 1500
Portfolio Constituents• Pattern of Returns is Consistent and Similar to
Earnings Estimates Surprise!


