

Working in partnership
ISLINGTON & HARINGEY JSNA
Demographics Mental HealthChildren and
Young PeoplePhysical wellbeing of
adults & older people
Behavioural risk
factorsSummary Further information
Wider
determinants
Population § The combined Haringey and Islington population is just over 500,000
people (Islington: 232,400 & Haringey: 279,890
§ The populations of Haringey and Islington are living longer, growing
and constantly changing. Although people are living longer, residents
on average spend the last 20 years of their life in poor health.
§ Overall the age structure of both Haringey and Islington is, and will
continue to be, dominated by a young working age population. A
younger population profile presents a significant opportunity for
prevention of conditions that are significant contributors to early
death, disability and poor quality of health in Haringey and Islington.
§ The combined populations of Haringey and Islington are estimated to
increase by 10% over the next 10 years. The highest rate of growth
will be amongst the older population, although in absolute numbers
the older population will remain the smallest age group.
§ Both boroughs have diverse populations which are projected to
increase over the next 10 years. Islington will see a significant
growth in the Black other group whilst Haringey will see a significant
growth in populations Asian Other and Chinese population.
§ Poverty is a key determinant of poor outcomes in health and
wellbeing and is linked to numerous health problems. Both boroughs
are the amongst the most deprived in London (Islington the 5th most
deprived and Haringey the 6th most deprived).
Children and young people§ There is clear evidence of the importance of giving children
the best start in life, and there are a range of early
interventions (starting not only in pregnancy, but before
conception) that are effective in achieving better long term
outcomes and reducing inequalities.
§ Teenage pregnancy rates in both boroughs have declined
and rates are now similar to England and London. The
proportion of babies born with low birth weight has remained
steady over the past 5 years for both boroughs however rates
in Haringey are significantly higher compared to England and
London.
§ Although the majority of children and young people in
Haringey and Islington live healthy lives, there are high levels
of vulnerability and disadvantage. Both Haringey and
Islington have a significantly higher proportion of children
under 16 living in low income households (34% and 26%
respectively) compared to England and London.
§ More than a third of children in Year 6 are obese or
overweight. Estimates suggest that being overweight or
obese contributes to 36% of all the prevalent long term
conditions diagnosed.
§ Mental health needs amongst children and young people are
high in both boroughs, with the proportion of children
estimated to have a diagnosed mental health conditions is
higher than London and England.
SUMMARY AND KEY MESSAGES AUGUST 2017

Working in partnership
ISLINGTON & HARINGEY JSNA
Demographics Mental HealthChildren and
Young PeoplePhysical wellbeing of
adults & older people
Behavioural risk
factorsSummary Further information
Wider
determinants
Physical and mental wellbeing§ Cancer, cardiovascular disease (CVD), and respiratory disease remain
the leading causes of death in both Haringey and Islington. Although
death rates are declining across the population, health inequalities
remain stark. This is demonstrated by the gap in life expectancy
between people living in the most deprived and least deprived areas.
§ Diabetes and high blood pressure are common conditions in both
boroughs that significantly contribute to early death. As well as taking
action to prevent these conditions in the first place, earlier diagnosis and
proactive systematic management of these conditions, including self-
management and support for behaviour change, can help to prevent
disease progression and improve outcomes.
§ Mental health conditions significantly increase the risk of early death
from a number of conditions, along with wider wellbeing impacts. Both
boroughs have a high prevalence of people living with serious mental
health conditions. Islington has the highest diagnosed rate of serious
mental health illness in London. Both boroughs are in the top 5 London
boroughs for proportion of working age people claiming out of work
benefits and those claiming benefits due to mental health.
§ The proportion of people with more than one long term condition
increases with age, as does the risk of becoming frail. Frailty is linked
with poor mobility, difficulty doing everyday activity and results in large
increases in the health cost for care settings such as inpatient,
outpatient and nursing homes. An estimated 5% of the population aged
65 years old and over are classified as severe frail in Islington, and
potentially a similar proportion in Haringey.
§ People with learning disabilities are particularly vulnerable to poorer
health and wellbeing outcomes compared to the general population
and often have poorer physical and mental health. Ensuring good
access to and uptake of preventative interventions is key to
improving health and wellbeing outcomes for people with learning
disabilities.
§ The proportion of people with learning disabilities who have had a
health check in Haringey is significantly higher than the England
average whilst in Islington the rate is similar to the England
average.
§ Dementia is a growing challenge locally, as our populations age
and people live longer. High rates of dementia diagnosis enable
people with dementia and their carers to receive the right care and
support at the right time. Islington has the highest estimated
dementia diagnosis rate in London, at 91%, significantly higher than
London and England. Haringey is closer to the London average at
69%.
SUMMARY AND KEY MESSAGES AUGUST 2017
SM3

Slide 2
SM3 Shaukat, Mahnaz, 07/09/17

Working in partnership
ISLINGTON & HARINGEY JSNA
Demographics Mental HealthChildren and
Young PeoplePhysical wellbeing of
adults & older people
Behavioural risk
factorsSummary Further information
Wider
determinants
Behavioural risk factors§ Healthy habits can prevent illness or at least delay it for many
years. Unlike other factors such as age and genetics, poor
lifestyle behaviours can be altered and in the medium term
improve population health outcomes.
§ Smoking, excess alcohol consumption and excess weight
caused lack of physical activity and diet are habits that
contribute to a range of preventable health problems amongst
our residents in both boroughs.
§ Though smoking prevalence has decreased over the past few
years, smoking levels remain high, especially in key population
groups, such as people in routine and manual occupations and
people with severe mental health conditions.
§ Despite improvements in treatment outcomes, the harm that
alcohol causes remains high. Haringey and Islington have
alcohol-related hospital admissions significantly higher than
the London and England averages and both boroughs have
seen rates of admission increase over the past 10 years.
§ Whilst the proportion of adults in Haringey and Islington who
are overweight or obese is lower than for the London and
England, more than half the adult population in both boroughs
(54.2% and 52.8% in Haringey and Islington respectively) is
overweight or obese.
.
Wider determinants§ Many factors combine to affect the health of individuals and
communities, including genetic factors, their circumstances,
their environment, their behaviours and access to services.
§ Good housing, education and employment are amongst the
key wider determinants of health. A good education is
strongly associated with better health outcomes including
life expectancy.
§ The proportion of children achieving a good level of
development at the end of reception year has been
increasing over the past 5 years in both boroughs although
in Islington the rate is significantly lower than the England
and London average.
§ Decent, secure housing can have a positive impact on the
physical and mental health and wellbeing. Around 3,200
households (28 per 1,000 households) in Haringey and 900
households (9 per 1,000) in Islington are living in temporary
accommodation. The rate is almost double in Haringey
compared to London (15 per 1,000).
.
SUMMARY AND KEY MESSAGES AUGUST 2017

Working in partnership
ISLINGTON & HARINGEY JSNA
Demographics Mental HealthChildren and
Young PeoplePhysical wellbeing of
adults & older people
Behavioural risk
factorsSummary Further information
Wider
determinants
§ There is a strong correlation between unemployment and poor
health. About one in ten people aged 16 to 64 years are
claiming an out-of-working benefit in Haringey (9%) and
Islington (10%). This is higher than the London (7%) and
England (8%) averages. Islington has the second highest
proportion of out-of-claimants in London, and Haringey has the
6th highest proportion
§ A significant proportion of people who are out of work in
Haringey and Islington have a long-term illness. About 5,500
(3%) working age people in Haringey and 6,400 (4%) in
Islington are on sickness / disability benefits due to mental
illness, meaning one-in-three out-of-work benefit claims are due
to mental illness.
SUMMARY AND KEY MESSAGES

Working in partnership
ISLINGTON & HARINGEY JSNA
Demographics Mental HealthChildren and
Young PeoplePhysical wellbeing of
adults & older people
Lifestyles & Risk
factorsSummary Further information
Wider
determinants
DEMOGRAPHICS

Working in partnership
Demographics Mental HealthChildren and
Young PeoplePhysical wellbeing of
adults & older people
Lifestyles & Risk
factorsSummary Further information
Wider
determinants
DEMOGRAPHICS
Islington
78.7
London
80.2
England
79.5
Haringey
80.0
83.1 84.1 83.184.5
Life Expectancy Healthy Life Expectancy
Average life expectancy at birth 2013-15
Source, PHOF, 2017
Life expectancy at birth has
increased in both Islington and
Haringey over the past decade.
For Haringey, life expectancy is
now similar to London and
England for males and for females
it is similar to London and
significantly higher compare to
England.
Female life expectancy in
Islington is significantly lower than
London and similar to England.
Male life expectancy in Islington
remains significantly lower than
both London and England.
63.4
64.1
64.1
64.1
65.0
60.5
60.7
61.6
0.0 20.0 40.0 60.0 80.0
Male
Female
Islington Haringey London England
In both boroughs residents
spend on average the last 20
years of life in poor health.
Male healthy life expectancy
in Haringey is similar to
London and England, whilst
healthy life expectancy for
women is significantly lower
than London and England.
In Islington, healthy life
expectancy for women is
similar to London and
England, whilst for men it is
significantly lower than
England but similar to
London.
Average healthy life expectancy at birth 2013-15
Source, PHOF, 2017
Overall the populations of Islington and Haringey are young.
The Haringey population is similar to London. Islington,
however, has a higher proportion of younger people aged 25-
39 years old compared to London and Haringey. Islington also
has fewer children between the ages of 10 and 19 than the
London average.
Source, GLA 2015-based population projections
Population structure
Proportion of populationProportion of population
8 6 4 2 0 2 4 6 8
0-4
10-14
20-24
30-34
40-44
50-54
60-64
70-74
80-84
>90
8 6 4 2 0 2 4 6 8
0-4
10-14
20-24
30-34
40-44
50-54
60-64
70-74
80-84
>90Islington Haringey

Working in partnership
Demographics Mental HealthChildren and
Young PeoplePhysical wellbeing of
adults & older people
Lifestyles & Risk
factorsSummary Further information
Wider
determinants
0
100
200
300
400
500
600
2017 2022 2027
Siz
e o
f p
op
ula
tio
n,
Th
ou
sa
nd
s (
00
0's
) 85+
65-84
20-64
5-19
0-4
DEMOGRAPHICS
Population projections to 2027
Proportions of ethnic groups in Haringey
and Islington, 2017The combined Haringey and Islington population is just over
500,000 people (Islington: 232,400 & Haringey: 279,890).
This combined population size is expected to increase to
564,785 by 2027, an increase of 10% (9% increase for
Islington and 11% increase in Haringey).
The highest expected growth is in the older age groups. The
85+ age group will rise from 6,535 to 7,572. The 65-84
group will rise from 41,390 to 52,626 people.
The working age population will remain the largest
population overall for both boroughs.
Ethnicity
Population growth for Haringey & Islington
combined, 2017, 2022 and 2027
Both boroughs have ethnically diverse
populations, with BME groups accounting
for 38% of the whole population in
Haringey and 32% in Islington.
The ethnic diversity is expected to remain
stable over the next decade in both
boroughs. The ethnic groups with the
highest projected population growth is
Black Other (32%) in Islington and Asian
Other (14%) in Haringey. Both boroughs
will see a reduction in the Black Caribbean
population.
Percentage change in proportions of ethnic groups, 2017 to 2027
10%
Source, GLA 2015-based population projections Source, GLA 2015-based population projections
62% 17% 9% 12%68% 12% 10% 10%0%
20%
40%
60%
80%
100%
White Black Asian Mixed/Other
Pe
rce
nta
ge
of
po
pu
lati
on
Ethnicity
14%12% 12% 11% 10%
5%2%
0% -1% -6%
16%17%
10%
32%
7%10%
15%
1%
16%
-3%
-10%
0%
10%
20%
30%
40%
As
ian
Oth
er
Mix
ed
/Oth
er
Wh
ite
Bla
ck
Oth
er
Ch
ine
se
Bla
ck
Afr
ica
n
Ind
ian
Ba
ng
lad
es
hi
Pa
kis
tan
i
Bla
ck
Ca
rib
be
an
Pe
rce
nta
ge
ch
an
ge
ov
er
10
ye
ars Haringey
Islington
SM4

Slide 7
SM4 Grid lines on the population projection graph to be consistent with the rest?Shaukat, Mahnaz, 07/09/17

Working in partnership
Demographics Mental HealthChildren and
Young PeoplePhysical wellbeing of
adults & older people
Lifestyles & Risk
factorsSummary Further information
Wider
determinants
0 5 10 15
2010 - 12
2011 - 13
2012 - 14
2013 - 15
Year
Women
Men
Inequality in life expectancy in Islington
Range in years of life expectancy across the social
gradient from most to least deprived residents
DEMOGRAPHICS
Inequality in life expectancy Deprivation
Source, DCLG 2015
In Haringey, deprivation is more concentrated in the north east of the
borough.
In Islington, areas of deprivation are more evenly spread throughout the
borough, with residents from very different socio-economic circumstances
living side-by-side.Distribution of deprivation across Islington and Haringey
by ward and LSOAOverall Islington is
ranked as the 5th
most deprived
borough in London
and Haringey the 6th
most deprived.
The relative national
deprivation ranking
of both boroughs has
improved since
2010.
0 5 10 15
2010 - 12
2011 - 13
2012 - 14
2013 - 15
Year
Women
Men
Inequality in life expectancy in Haringey
Range in years of life expectancy across the social
gradient from most to least deprived residents
In Islington, men who live in the
worst off areas are expected to
live 8 fewer years than men
living in the best off areas in the
borough. Women have fewer
inequality in life expectancy (2.7
years) across the social
gradient (average life
expectancy measured against
local deprivation decile between
2013-15).
Inequality in life expectancy for
men has been rising over the
last 5 years, while it has
remained stable for women.
PHOF, 2017
In Haringey, men have greater
inequality in life expectancy
than women across the social
gradient (6.5 vs 4.7 fewer years
for those living in the most
deprived areas than those living
in the least deprived areas).
Inequality in life expectancy for
men has decreased over the
last 5 years (from 7.7 years in
2010-12). For women inequality
in life expectancy has slightly
increased in last 5 years (from
3.9 years in 2010-12).

Working in partnership
Demographics Mental HealthChildren and
Young PeoplePhysical wellbeing of
adults & older people
Lifestyles & Risk
factorsSummary Further information
Wider
determinants
DEMOGRAPHICS
Poverty among children Poverty among older people
Source, DCLG 2015
In Haringey, deprivation is more concentrated in the north east of the
borough.
In Islington, areas of deprivation are more evenly spread throughout the
borough, with residents from very different socio-economic circumstances
living side-by-side.
Distribution of income deprivation among residents over 60
Islington and Haringey by ward and LSOA
Source, Personal tax credits: Children in low-income families
local measure, 2014
The proportion of children living in low income families is significantly higher in
Islington and Haringey compared to London and England.
In Haringey, children from low income households are more concentrated in the
north east region of the borough. In Islington, child poverty is more evenly spread
throughout the borough, with residents from very different socio-economic
circumstances living side-by-side.
Distribution of poverty among children across Islington
and Haringey by ward and LSOA
Overall Islington has
more areas where
the density of
children from low
income households
is highest (40% -
50% of all children
living within an
LSOA region)
Total number of children from low
income households as a proportion of
total children in each LSOA (2014) Index of Multiple Deprivation (2015)
Islington & Haringey LSOAs
By local deprivation Quintiles (IMD 2015)
SM1
Slide 9
SM1 Can we include stats on inequality in life expectancy for male and females
(https://fingertips.phe.org.uk/profile/wider-determinants/data#page/4/gid/1938133080/pat/6/par/E12000007/ati/102/are/E09000007/iid/92901/age/1/sex/2)
along side the deprivation graph and put the child poverty map on a new slide alongside a map of income deprivation for older peopleShaukat, Mahnaz, 07/09/17

Working in partnership
Demographics Mental HealthChildren and
Young PeoplePhysical wellbeing of
adults & older people
Behavioural risk
factorsSummary Further information
Wider
determinants
ISLINGTON & HARINGEY JSNA
CHILDREN & YOUNG PEOPLE
Working in partnership
Demographics Mental HealthChildren and
Young PeoplePhysical wellbeing of
adults & older people
Behavioural risk
factorsSummary Further information
Wider
determinants
CHILDREN AND YOUNG PEOPLE
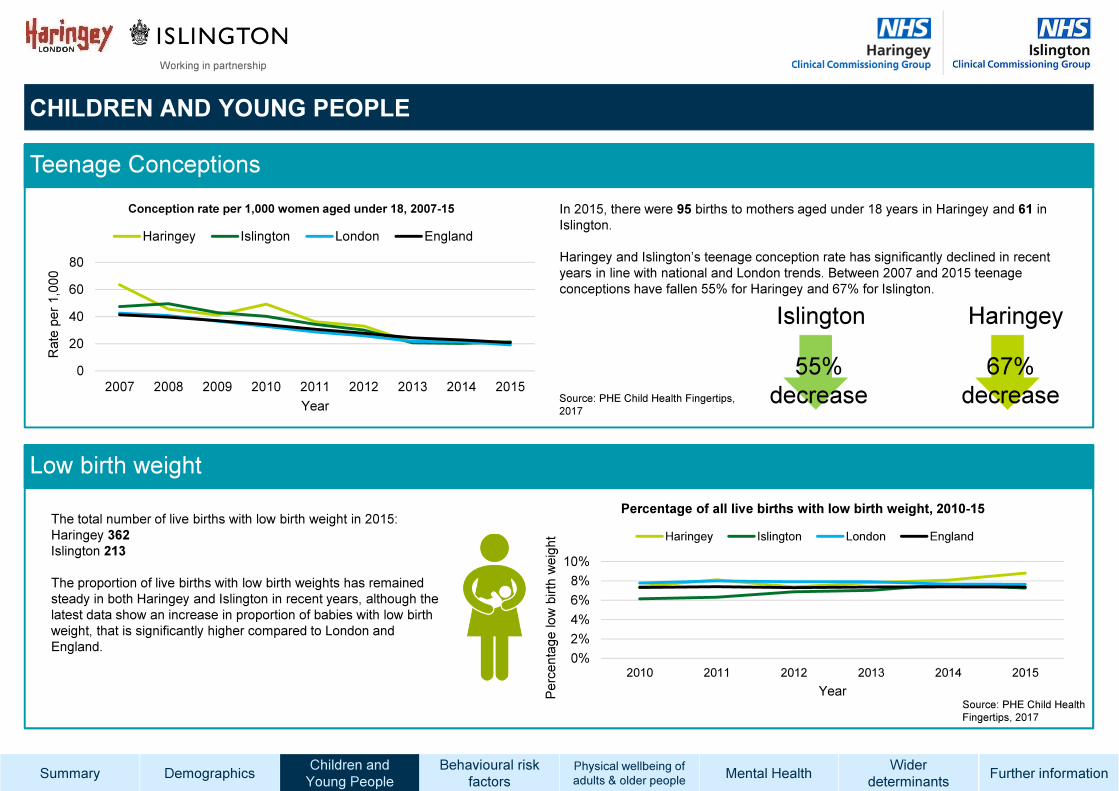
In 2015, there were 95 births to mothers aged under 18 years in Haringey and 61 in
Islington.
Haringey and Islington’s teenage conception rate has significantly declined in recent
years in line with national and London trends. Between 2007 and 2015 teenage
conceptions have fallen 55% for Haringey and 67% for Islington.
Teenage Conceptions
Low birth weight
The total number of live births with low birth weight in 2015:
Haringey 362
Islington 213
The proportion of live births with low birth weights has remained
steady in both Haringey and Islington in recent years, although the
latest data show an increase in proportion of babies with low birth
weight, that is significantly higher compared to London and
England.
55%
decrease
67%
decrease
Teenage Conceptions
Low birth weight
Islington Haringey
Source: PHE Child Health
Fingertips, 2017
Source: PHE Child Health Fingertips,
2017
0
20
40
60
80
2007 2008 2009 2010 2011 2012 2013 2014 2015
Rate
per 1,0
00
Year
Conception rate per 1,000 women aged under 18, 2007-15
Haringey Islington London England
0%
2%
4%
6%
8%
10%
2010 2011 2012 2013 2014 2015
Perc
enta
ge low
birth
weig
ht
Year
Percentage of all live births with low birth weight, 2010-15
Haringey Islington London England
Working in partnership
Demographics Mental HealthChildren and
Young PeoplePhysical wellbeing of
adults & older people
Behavioural risk
factorsSummary Further information
Wider
determinants
Vaccination Coverage – Dtap / IPV / Hib
CHILDREN AND YOUNG PEOPLE
Vaccination Coverage - MMR
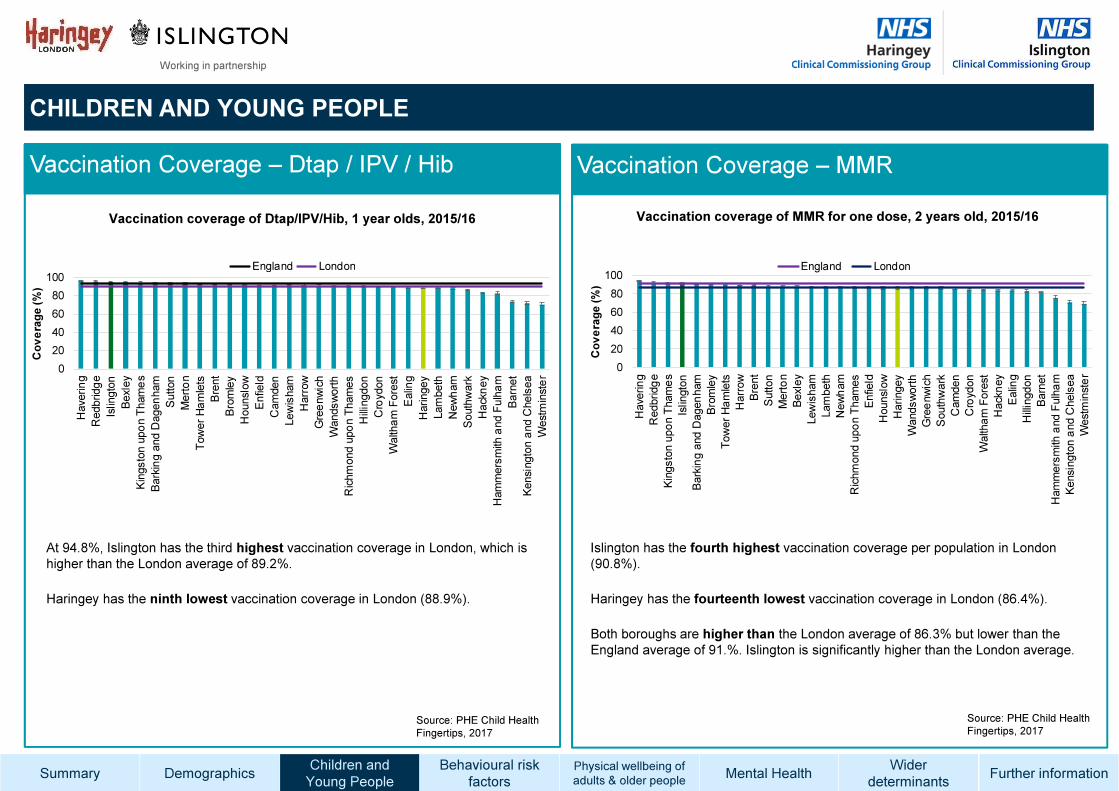
Islington has the fourth highest vaccination coverage per population in London
(90.8%).
Haringey has the fourteenth lowest vaccination coverage in London (86.4%).
Both boroughs are higher than the London average of 86.3% but lower than the
England average of 91.%. Islington is significantly higher than the London average.
At 94.8%, Islington has the third highest vaccination coverage in London, which is
higher than the London average of 89.2%.
Haringey has the ninth lowest vaccination coverage in London (88.9%).
Vaccination Coverage – MMR
Source: PHE Child Health
Fingertips, 2017
Source: PHE Child Health
Fingertips, 2017
Vaccination coverage of MMR for one dose, 2 years old, 2015/16Vaccination coverage of Dtap/IPV/Hib, 1 year olds, 2015/16
0
20
40
60
80
100
Havering
Redbridge
Kingston upon Thames
Islington
Barking and Dagenham
Bromley
Tower Hamlets
Harrow
Brent
Sutton
Merton
Bexley
Lewisham
Lambeth
Newham
Richmond upon Thames
Enfield
Hounslow
Haringey
Wandsworth
Greenwich
Southwark
Camden
Croydon
Waltham Forest
Hackney
Ealing
Hillingdon
Barnet
Hammersmith and Fulham
Kensington and Chelsea
Westminster
Co
ve
rag
e (%
)
England London
0
20
40
60
80
100
Havering
Redbridge
Islington
Bexley
Kingston upon Thames
Barking and Dagenham
Sutton
Merton
Tower Hamlets
Brent
Bromley
Hounslow
Enfield
Camden
Lewisham
Harrow
Greenwich
Wandsworth
Richmond upon Thames
Hillingdon
Croydon
Waltham Forest
Ealing
Haringey
Lambeth
Newham
Southwark
Hackney
Hammersmith and Fulham
Barnet
Kensington and Chelsea
Westminster
Co
ve
rag
e (%
)
England London

Working in partnership
Demographics Mental HealthChildren and
Young PeoplePhysical wellbeing of
adults & older people
Behavioural risk
factorsSummary Further information
Wider
determinants
CHILDREN AND YOUNG PEOPLE
At 141 per 100,000, Haringey had the 7th
lowest admissions rate for asthma, amongst
children aged under 19 years, in London
(2015/16). This is significantly lower than the
national average.
Islington performs far differently. With a rate
of 224 asthma admissions per 100,000,
Islington has the 8th highest admissions rate
in, although this rate is similar to the London
and England average.
Islington’s asthma admissions has significantly decreased since 2011, despite
an increase in 2014/15. It has remained above London and England during this
period.
Trends in asthma admissions for Haringey have remained below the London
and England rates and continue to decrease.
Trends in asthma admissions
Asthma admissions across London
Source: PHE Child Health Fingertips, 2017
Source: PHE Child Health Fingertips, 2017
0
100
200
300
400
2011/12 2012/13 2013/14 2014/15 2015/16
Rate
per
100,0
00
Year
Hospital admissions for asthma (under 19 years), per 100,000, 2011-2016
England London Haringey Islington
0
100
200
300
400
Lewisham
Croydon
Greenwich
Lambeth
Barking and Dagenham
Newham
Southwark
Islington
Brent
Redbridge
Harrow
Ealing
Tower Hamlets
Merton
Hackney
Waltham Forest
Bexley
Enfield
Hillingdon
Havering
Camden
Richmond upon Thames
Bromley
Hounslow
Westminster
Haringey
Wandsworth
Sutton
Kingston upon Thames
Barnet
Hammersmith and Fulham
Kensington and Chelsea
Rra
te p
er
100,0
00 England London
Hospital admissions for asthma, per 100,000, 2015/16

Working in partnership
Demographics Mental HealthChildren and
Young PeoplePhysical wellbeing of
adults & older people
Behavioural risk
factorsSummary Further information
Wider
determinants
CHILDREN AND YOUNG PEOPLE
Prevalence of overweight and obese Year 6
pupils, Haringey and Islington, 2015/16
0
20
40
60
2007-0
9
2008-1
0
2009-1
1
2010-1
2
2011-1
3
2012-1
4
2013-1
5
Pre
vale
nce (%
)
Prevalence of excess weight in year 6 children, 2007-15
Haringey Islington London England
Prevalence of overweight and obese Year 6 pupils, 3-year rolling average, 2007-15
Prevalence of overweight and obese by deprivation quintile, Haringey and
Islington, Year 6 pupils, 2015/16
24% of children in Reception and 38% of
children in Year 6 in Haringey are overweight
or obese, compared to 23% and 37% for
Islington. As of 2015/16, both Haringey and
Islington have a significantly higher prevalence
of excess weight in year 6 children, compared
to England.
In Haringey and Islington, there are 582 year 6
children who are overweight, and 918 year 6
children who are obese out of a total year 6
population of 3978 (2015/16)
Year 6 children in the most deprived wards of Haringey are two and a half times more likely to be
overweight or obese compared to those in the most affluent parts (where 1 is most deprived). Obesity is
more dispersed among deprivation quintiles in Islington.
Excess weight in children aged 10-11 years old
by wardTrends in prevalence of excess weight amongst children
Obesity and Deprivation in Year 6
Source: NCMP, 2015/16
Source: NCMP, 2015/16
Source: NCMP, 2015/16
0%
20%
40%
60%
1 2 3 4 5
Pre
vale
nce
Deprivation Quintile
Year 6 obesity and deprivation, 2015/16
Islington average
0%
20%
40%
60%
1 2 3 4 5
Pre
vale
nce
Deprivation Quintile
Year 6 obesity and deprivation, 2015/16
Haringey average
Working in partnership
Demographics Mental HealthChildren and
Young PeoplePhysical wellbeing of
adults & older people
Behavioural risk
factorsSummary Further information
Wider
determinants
CHILDREN AND YOUNG PEOPLE
Self-harm
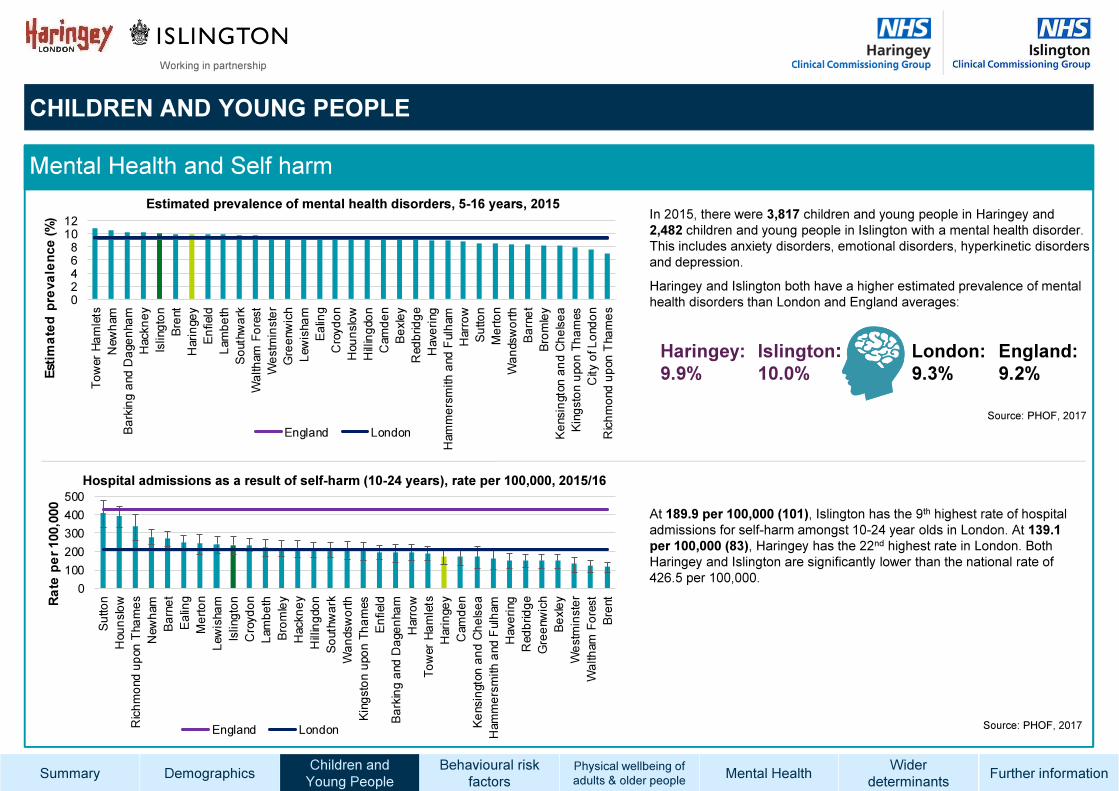
In 2015, there were 3,817 children and young people in Haringey and
2,482 children and young people in Islington with a mental health disorder.
This includes anxiety disorders, emotional disorders, hyperkinetic disorders
and depression.
Haringey and Islington both have a higher estimated prevalence of mental
health disorders than London and England averages:
At 189.9 per 100,000 (101), Islington has the 9th highest rate of hospital
admissions for self-harm amongst 10-24 year olds in London. At 139.1
per 100,000 (83), Haringey has the 22nd highest rate in London. Both
Haringey and Islington are significantly lower than the national rate of
426.5 per 100,000.
Haringey:
9.9%
Islington:
10.0%
London:
9.3%
England:
9.2%
Mental Health and Self harm
Source: PHOF, 2017
Source: PHOF, 2017
Estimated prevalence of mental health disorders, 5-16 years, 2015
02468
1012
Tower Hamlets
Newham
Barking and Dagenham
Hackney
Islington
Brent
Haringey
Enfield
Lambeth
Southwark
Waltham Forest
Westminster
Greenwich
Lewisham
Ealing
Croydon
Hounslow
Hillingdon
Camden
Bexley
Redbridge
Havering
Hammersmith and Fulham
Harrow
Sutton
Merton
Wandsworth
Barnet
Bromley
Kensington and Chelsea
Kingston upon Thames
City of London
Richmond upon Thames
Esti
ma
ted
pre
va
len
ce
(%
)
England London
Hospital admissions as a result of self-harm (10-24 years), rate per 100,000, 2015/16
0
100
200
300
400
500
Sutton
Hounslow
Richmond upon Thames
Newham
Barnet
Ealin
g
Merton
Lewisham
Islington
Croydon
Lambeth
Bromley
Hackney
Hillingdon
Southwark
Wandsworth
Kingston upon Thames
Enfield
Barking and D
agenham
Harrow
Tower Hamlets
Haringey
Camden
Kensington and C
helsea
Hammersmith and Fulham
Havering
Redbridge
Greenwich
Bexley
Westm
inster
Waltham Forest
Brent
Ra
te p
er
100,0
00
England London

Working in partnership
Demographics Mental HealthChildren and
Young PeoplePhysical wellbeing of
adults & older people
Behavioural risk
factorsSummary Further information
Wider
determinants
CHILDREN AND YOUNG PEOPLE
0%
10%
20%
30%
2014 2015 2016Perc
enta
ge w
ith S
EN
Year
Percentage of school age (4-16 years) pupils with special educational needs
(SEN), 2014-16
Haringey Islington London England
Special Education Needs
Learning Disability
NEETs
Looked after Children
In 2016, there were 1,079
school age pupils in
Islington and 1,810 in
Haringey with a learning
disability
In 2014 almost a quarter of
children aged under 16
(N=13,620) in Haringey and
more than one third of under
16s (N=11,280) in Islington
were living in low income
families. The proportion has
decreased over the decade in
both Haringey and Islington, in
line with the national trend, it is
still higher in both boroughs
compared to London (23%)
and England (20%).
In 2015/16, there were 405
LAC <18 years old in
Haringey and 110 in
Islington
0
20
40
60
80
100
2012/13 2013/14 2014/15 2015/16Rate
per 10,0
00
Year
Rate of looked after children per 10,000, <18 years, 2012/12-2015/16
Haringey Islington London England
Special Education Needs
In 2016, there were
6,331 school age
pupils in Haringey and
4,524 in Islington with
Special Education
Needs.
Children in low income families
Learning Disability Looked after Children
Source: PHE Child Health
Fingertips, 2017 Source: PHE Health Profile, 2017
Source: PHE Child Health
Fingertips, 2017
Source: PHE Child Health
Fingertips, 2017
0%
1%
2%
3%
4%
5%
6%
7%
2013 2014 2015 2016
Perc
enta
ge w
ith L
D
Percentage of school age pupils with a Learning Disability, 2013-16
Haringey Islington London England
Percentage of children aged under 16 living in
low income families, 2014
0%
20%
40%
60%
80%
100%
Haringey Islington London England
Percentage

Working in partnership
Demographics Mental HealthChildren and
Young PeoplePhysical wellbeing of
adults & older people
Behavioural risk
factorsSummary Further information
Wider
determinants
ISLINGTON & HARINGEY JSNA
BEHAVIOURAL RISK FACTORS

Working in partnership
Demographics Mental HealthChildren and
Young PeoplePhysical wellbeing of
adults & older people
Behavioural risk
factorsSummary Further information
Wider
determinants
BEHAVIOURAL RISK FACTORS
0500
10001500200025003000
2009/1
0
2010/1
1
2011/1
2
2012/1
3
2013/1
4
2014/1
5
2015/1
6Rate
per 100,0
00
Smoking attributable hospital admissions, rate per 100,000, 2009-16
England London Haringey Islington
0
100
200
300
400
500
2007-0
9
2008-1
0
2009-1
1
2010-1
2
2011-1
3
2012-1
4
2013-1
5
Rate
per 100,0
00
Smoking Attributable Mortality, rate per 100,000, 2007-15
England London Haringey Islington
0
5
10
15
20
25
2012 2013 2014 2015 2016
Pre
vale
nce (%
)
Smoking Prevalence in adults - current smokers, 2012-16
England London Haringey Islington
010203040
Managerial &professionaloccupations
Intermediateoccupations
Routine & manualoccupations
Never worked &long term
unemployed
Pre
vale
nce (%
)
Socioeconomic class
Smoking Prevalence in adults by socioeconomic class
Islington Haringey Haringey avg. Islington avg.
Smoking Prevalence Smoking Attributable Hospital Admissions
Smoking Attributable Mortality Smoking by Socioeconomic class
Islington’s smoking
prevalence has
declined since 2015
and is now similar to
London and England
at 13.4%. Haringey’s
smoking prevalence
remains around 2012
levels at 17.7%, and
also similar to the
London and England
average.
Haringey and
Islington’s smoking-
attributable hospital
admission rates have
remained steady
since 2009/10.
Islington remains
significantly higher
than London and
England, whilst
Haringey is closer to
the comparator
averages.
Islington’s smoking-
attributable mortality
rate has steadily
declined since 2007-
09 and is now closer
to Haringey’s rate.
Haringey has
remained steady since
2007/09 and is
currently lower than
the London and
England averages. Haringey has a significantly higher smoking prevalence for those in intermediate
occupations (37.8%) compared to Islington (18.1%). Haringey also has a higher
prevalence for those in routine and manual occupations (31.2%) compared to
Islington (23.4%).
Source: APS, PHOF, 2017 Source: PHOF, 2017
Source: PHOF, 2017 Source: PHOF, 2017

Working in partnership
Demographics Mental HealthChildren and
Young PeoplePhysical wellbeing of
adults & older people
Behavioural risk
factorsSummary Further information
Wider
determinants
Alcohol-related mortality
rates in Haringey and
Islington are similar to
the London rate.
Compared to England,
Islington has a higher
rate and Haringey a
similar rate.
Trends in alcohol-related
mortality have not
changed significantly
over time in both
boroughs.
BEHAVIOURAL RISK FACTORS
Alcohol-related hospital admissions Alcohol-related mortality
Off-trade alcohol sales
Haringey ranks highest in London (out of 32 boroughs) for litres
sold per adult through the off-trade, significantly higher than the
London average of 4.7 litres and England average of 5.5 litres.
Islington ranks 8th highest with 5.3 litres, similar to London and
England.
A total of 1,561,000 litres of alcohol was sold through the off-trade in
Haringey in 2014, compared to 1,007,000 litres in Islington.
0
1000
2000
3000
4000
2008/0
9
2009/1
0
2010/1
1
2011/1
2
2012/1
3
2013/1
4
2014/1
5
2015/1
6Rate
per
100,0
00
Admission episodes for alcohol-related conditions (Broad), per 100,000, 2008-16
England London Haringey Islington
Haringey and Islington
have alcohol-related
hospital admissions
significantly higher
than the London and
England averages.
Both boroughs have
seen rates of
admission increase
since 2008/09.0
20
40
60
80
2008
2009
2010
2011
2012
2013
2014
2015Rate
per
100,0
00
Alcohol-related mortality, rate per 100,000, 2008-15
England London Haringey Islington
Source: PHOF, 2017 Source: PHOF, 2017
Source: LAPE, 2017; CGA Strategy/Nielsen, 2014
Volume of pure alcohol sold through the off-trade, all alcohol sales,
London boroughs, 2014
0
2
4
6
8
10
Haringey
Hammersmith and Fulham
Wandsworth
Camden
Kensington and Chelsea
Kingston upon Thames
Richmond upon Thames
Islington
Westminster
Merton
Hounslow
Ealing
Croydon
Lewisham
Hillingdon
London region
Harrow
Sutton
Greenwich
Waltham Forest
Tower Hamlets
Hackney
Havering
Newham
Enfield
Bexley
Brent
Bromley
Lambeth
Southwark
Barking and Dagenham
Redbridge
Barnet
Litres
England London

Working in partnership
Demographics Mental HealthChildren and
Young PeoplePhysical wellbeing of
adults & older people
Behavioural risk
factorsSummary Further information
Wider
determinants
BEHAVIOURAL RISK FACTORS
Healthy Diet
Obesity in adults
Physical Inactivity
0
10
20
30
40
2012 2013 2014 2015
Perc
en
tag
e (
%)
Percentage of adults achieving less than 30 minutes of physical activity per week
England London Haringey Islington
Haringey (28.2%) have
a similar proportion of
inactive adults as
London and England,
whilst Islington have
remained lower than its
comparators since
2012. In 2015, 23.6% of
adults in Islington were
inactive.
Islington (57.9%) and Haringey (57.4%) have the 3rd
and 4th highest proportions of adults meeting their
recommended 5-a-day in 2013-15. Both boroughs
have proportions higher than the London and
England averages.
Haringey and Islington are both below the London
and England averages for excess weight in adults,
at 54.2% and 52.8% respectively. Islington is the 7th
lowest proportion of adult obesity in London, whilst
Haringey is the 11th lowest.
Source: PHOF, 2017Source: PHOF, 2017
Source: PHOF, 2017
0
20
40
60
80
100
Ba
rkin
g a
nd
Da
ge
nha
m
Be
xle
y
Red
brid
ge
Have
ring
Cro
yd
on
Bro
mle
y
Gre
enw
ich
En
field
New
ham
Hou
nslo
w
Hill
ing
do
n
Ea
ling
Harr
ow
Su
tto
n
Lew
isha
m
Me
rto
n
Bre
nt
Wa
lth
am
Fo
rest
Kin
gsto
n u
po
n T
ha
mes
Ba
rne
t
So
uth
wa
rk
We
stm
inste
r
Hari
nge
y
Wa
ndsw
ort
h
Hackn
ey
Ric
hm
ond
up
on
Tha
me
s
Isling
ton
To
wer
Ha
mle
ts
Ham
me
rsm
ith
and
Fulh
am
Lam
be
th
City o
f L
ond
on
Ke
nsin
gto
n a
nd C
he
lse
a
Cam
de
n
Pre
va
len
ce
(%
)
England London
Proportion of adults with an excess weight, 2013-15
Proportion of adults (16+ years) meeting the
recommended ‘5-a-day’ on a ‘usual day’, 2015The proportion of adults
meeting the recommended 5-a-
day in Islington (58%) and
Haringey (58%) is significantly
higher than the London (49%)
and England (52%) averages.
Islington and Haringey are the
3rd and 4th highest achieving
boroughs for this indicator in
London. 0%
20%
40%
60%
80%
100%
Haringey Islington London England
Perc
entage

Working in partnership
Demographics Mental HealthChildren and
Young PeoplePhysical wellbeing of
adults & older people
Lifestyles & Risk
factorsSummary Further information
Wider
determinants
ISLINGTON & HARINGEY JSNA
PHYSICAL WELLBEING OF ADULTS &
OLDER PEOPLE

Working in partnership
Demographics Mental HealthChildren and
Young PeoplePhysical wellbeing of
adults & older people
Lifestyles & Risk
factorsSummary Further information
Wider
determinants
ADULTS AND OLDER PEOPLE
Premature Mortality
Rates of mortality caused by
the top 3 killers (Cancer, CVD
and Respiratory Disease) have
been declining in both Islington
and Haringey over the last
decade.
This is in line with both the
regional and national trend.
Mortality rates over time
Source, End of Life Care Profiles (PHE Finger tips), 2015
0
50
100
150
200
250
20
01
-03
20
02
-04
20
03
-05
20
04
-06
20
05
-07
20
06
-08
20
07
-09
20
08
-10
20
09
-11
20
10
-12
20
11
-13
20
12
-14
20
13
-15
Tota
l death
s p
er
100,0
00
popula
tion
Age-standardised mortality rate for
population with Cancer
0
10
20
30
40
50
60
20
01
-03
20
02
-04
20
03
-05
20
04
-06
20
05
-07
20
06
-08
20
07
-09
20
08
-10
20
09
-11
20
10
-12
20
11
-13
20
12
-14
20
13
-15
Tota
l death
s p
er
100,0
00
popula
tion
Age-standardised mortality rate for
population with Respiratory disease
0
20
40
60
80
100
120
140
160
180
200
20
01
-03
20
02
-04
20
03
-05
20
04
-06
20
05
-07
20
06
-08
20
07
-09
20
08
-10
20
09
-11
20
10
-12
20
11
-13
20
12
-14
20
13
-15
Tota
l death
s p
er
100,0
00
popula
tion
Age-standardised mortality rate for
population with CVDs
Total
Annual
Deaths
2,210
Cardiovascular
DiseaseCancer
Respiratory
Diseases
650
Other
Causes of
Death
Note: Numbers do not add up due to rounding.
Source: Primary care mortality database (PCMD) 2015 - NHS Digital
Top 3 Killers In Haringey & Islington
Combined (Rounded To Nearest 10) Mortality rates among the
combined population of
Islington & Haringey is highest
among those with
cardiovascular disease, cancer
and diabetes.
For Islington, the mortality
rates for these 3 disease are
higher than the average rate
for both London and England.
610
660
280
Working in partnership
Demographics Mental HealthChildren and
Young PeoplePhysical wellbeing of
adults & older people
Lifestyles & Risk
factorsSummary Further information
Wider
determinants
0%
5%
10%
15%
20%
25%
30%
Hypertensio
n
Dia
bete
s M
ellitu
s
CH
D
CO
PD
Atria
l Fib
rilla
tion
Hypertensio
n
Dia
bete
s M
ellitu
s
CH
D
CO
PD
Atria
l Fib
rilla
tion
Haringey Islington
% P
revale
nce
Prevalence gap for long-term conditions, Islington and Haringey registered population aged 16 and over, 2015-16
Undiagnosed
Observed Prevalence
ADULTS AND OLDER PEOPLE
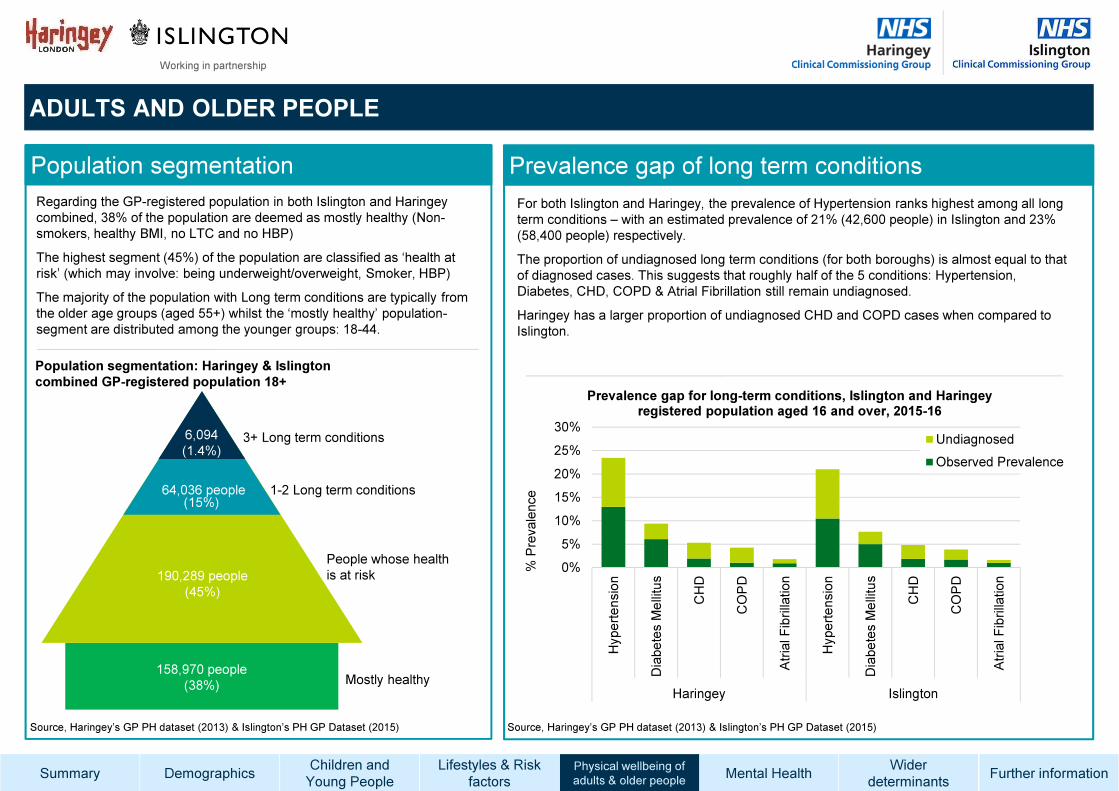
Prevalence gap of long term conditionsPopulation segmentation
Mostly healthy
People whose health
is at risk
1-2 Long term conditions
3+ Long term conditions
158,970 people
(38%)
190,289 people
(45%)
64,036 people(15%)
6,094
(1.4%)
Population segmentation: Haringey & Islington
combined GP-registered population 18+
Source, Haringey’s GP PH dataset (2013) & Islington’s PH GP Dataset (2015)
Regarding the GP-registered population in both Islington and Haringey
combined, 38% of the population are deemed as mostly healthy (Non-
smokers, healthy BMI, no LTC and no HBP)
The highest segment (45%) of the population are classified as ‘health at
risk’ (which may involve: being underweight/overweight, Smoker, HBP)
The majority of the population with Long term conditions are typically from
the older age groups (aged 55+) whilst the ‘mostly healthy’ population-
segment are distributed among the younger groups: 18-44.
Source, Haringey’s GP PH dataset (2013) & Islington’s PH GP Dataset (2015)
For both Islington and Haringey, the prevalence of Hypertension ranks highest among all long
term conditions – with an estimated prevalence of 21% (42,600 people) in Islington and 23%
(58,400 people) respectively.
The proportion of undiagnosed long term conditions (for both boroughs) is almost equal to that
of diagnosed cases. This suggests that roughly half of the 5 conditions: Hypertension,
Diabetes, CHD, COPD & Atrial Fibrillation still remain undiagnosed.
Haringey has a larger proportion of undiagnosed CHD and COPD cases when compared to
Islington.

Working in partnership
Demographics Mental HealthChildren and
Young PeoplePhysical wellbeing of
adults & older people
Lifestyles & Risk
factorsSummary Further information
Wider
determinants
Women (65+) are more likely to have mild frailty (33%)
than older men (30%), and twice as likely to have a
severe frailty then older men (6% vs 3%).
Who is at risk? – Gender
Who is at risk – Ethnicity
Black women (38%) and Black and Asian
men (37%) are more likely to have a
moderate/severe frailty compared to the
Islington average (32%).
Mostly
healthy
Moderate
frailty
Severe
frailty
10,222
(50%)
6,532
(32%)
2,741
(13%)
Mild
frailty
5%
957
Frailty
Frailty status among Islington residents
Frailty is a loss of resilience that means people living with frailty do not bounce
back quickly after a physical or mental illness, an accident or other stressful
event. People living with frailty are likely to have a number of different issues or
problems, which, taken individually, might not be very serious but when added
together have a large impact on health, confidence and wellbeing.
The prevalence of Frailty has been measured using a Frailty Index (eFi) - where
a detailed frailty score is assigned to residents based on whether they have a
combination of specific illnesses – ranging from arthritis, CVD right through to
impairments in hearing and mobility.
Frailty is linked with poor mobility, difficulty doing everyday activity, or simply
‘slowing up’ and results in large increases in the health cost for care settings
such as inpatient, outpatient and nursing homes.
Source, Frailty Index analysis, Islington 2015. NB results are likely to apply equally to Haringey
Over 65's segmented by Frailty Status
(Islington only)
Source, Frailty Index analysis, Islington 2015
Based on the local review of
the frailty index
approximately one third
(6,532) of people aged 65
and over in Islington are
classified with a mild frailty.
Estimated
falls in
Haringey(2016)
7,7404706% of all
estimated falls
admitted to hospital
(2014/15)
Estimated
falls in
Islington (2016)
6,060 591
10% of all
estimated falls
admitted to hospital
(2014/15)
Falls in Islington and Haringey
Each year, an estimated 6,000
falls occur among Islington's
65+ population. 10% of all
estimated falls are admitted to
hospital.
In Haringey, roughly 6% of all
estimated falls (among the
Haringey 65+ population) are
admitted to hospital.
Source, PHOF, 2017
Source: NHS ENGLAND

Working in partnership
Demographics Mental HealthChildren and
Young PeoplePhysical wellbeing of
adults & older people
Lifestyles & Risk
factorsSummary Further information
Wider
determinants
0%
20%
40%
60%
80%
2011/12 2012/13 2013/14 2014/15 2015/16
Perc
enta
ge p
oin
t gap
Time period
Haringey
Islington
0.0
0.1
0.2
0.3
0.4
0.5
Islington Haringey London England
Perc
enta
ge o
f G
P
regis
tere
d p
opula
tion
0
5
10
15
20
25
30
Islington Haringey London
region
England
Perc
enta
ge o
f popula
tion
0
1
2
3
4
Islington Haringey London
region
England
Rate
per
1,0
00 p
opula
tion
ADULTS AND OLDER PEOPLE
Learning difficulties – Prevalence, Housing, Employment & further support
There are 2,066 people
living with a learning
disability in Haringey and
Islington (1,090 and 976
respectively). The
prevalence of learning
disabilities in Islington is
significantly higher than the
London average and
significantly lower than the
England average.
In Haringey the prevalence
of learning disabilities is
similar to the London
average and significantly
lower than the England
average.
The percentage gap in employment
between people with learning
difficulties and the overall population is
66% in Islington (2015/16) and 69% in
Haringey (2015/16).
These figures are similar to the
average percentage gap in
employment for both London and
England.
On average the percentage gap in
Employment is higher in Haringey than
in Islington.
This percentage gap, for both
Haringey and Islington, has increased
over the past 4 years, at a very similar
rate to the national trend.
Source, QOF 2013-14
Source, PHOF, PHE, 2017
Prevalence of Learning disability among GP-
registered population, All ages, 2015/16
Percentage of adults 18-64 with learning difficulties
living in non-settled accommodation, 2015/16
Adults (18 to 64) with learning disability getting
long term support from Local Authorities
Islington has a higher
proportion (24.2%) of adults
with learning difficulties
living in non-settled
accommodation than
Haringey (11.7%). This
proportion in Islington is
also similar to the regional
and national average.
The Rate of adults receiving
long term support from the
Local Authority is higher
than that in Islington. This
rate in Haringey is higher
than the regional average
but similar to the national
average.
Percentage gap in employment rate between
people with a learning disability and the overall
population, 18-64 years, 2011/12 to 2015/16
Working in partnership
Demographics Mental HealthChildren and
Young PeoplePhysical wellbeing of
adults & older people
Lifestyles & Risk
factorsSummary Further information
Wider
determinants
ISLINGTON & HARINGEY JSNA
MENTAL HEALTH

Working in partnership
Demographics Mental HealthChildren and
Young PeoplePhysical wellbeing of
adults & older people
Lifestyles & Risk
factorsSummary Further information
Wider
determinants
0.0
0.4
0.8
1.2
1.6
2.0Islington
K&C and QPP
Camden
City And Hackney
Tower Hamlets
Hammersmith And Fulham
Lewisham
Westminster
Haringey
Lambeth
Southwark
Brent
Greenwich
Waltham Forest
Newham
Croydon
Ealing
Enfield
Barnet
Harrow
Wandsworth
Sutton
Merton
Redbridge
Kingston
Richmond
Hounslow
Bromley
Hillingdon
Barking And Dagenham
Bexley
Havering
Pre
va
len
ce
(%
) England London
MENTAL HEALTH
Employment Support Allowance (ESA) claimants for Mental
Health reasonsDepression and severe mental illness
There is a higher proportion of mental health ESA claimants in
the east of Haringey, compared to the west. MH ESA
claimants are more dispersed in Islington, with a high
concentration in the northern wards that border Haringey.
Source: QOF, 2015/16
Islington has the
highest recorded
prevalence of
depression (8.1%, N=
16,080) in London. In
Haringey 5.8% of
people aged 18 years
or over (N=14,100)
are diagnosed with
depression. This is
significantly lower
than the England
average (8.3%).
Islington has the
highest prevalence of
SMI in London (1.5%,
N= 3,610), and
Haringey has the 9th
highest (1.3%,
N=3,980). These are
significantly higher
than the London
(1.1%) and England
(0.9%) averages.
Recorded prevalence of depression, 18+ years, 2015/16
Recorded prevalence of serious mental illness (SMI)*, 2015/16
* includes schizophrenia,
bipolar disorder or other
psychoses, or patients on
lithium therapy; Source:
QOF, 2015/16
0
2
4
6
8
10
Islington
Bromley
Sutton
City And Hackney
K&C & QPP
Camden
Lewisham
Southwark
Lambeth
Enfield
Hillingdon
Bexley
Tower Hamlets
Kingston
Hammersmith And Fulham
Merton
Barnet
Greenwich
Haringey
Waltham Forest
Wandsworth
Croydon
Hounslow
Richmond
Harrow
Brent
Havering
Barking And Dagenham
Westminster
Ealing
Newham
Redbridge
Pre
va
len
ce
(%
) England London

Working in partnership
Demographics Mental HealthChildren and
Young PeoplePhysical wellbeing of
adults & older people
Lifestyles & Risk
factorsSummary Further information
Wider
determinants
MENTAL HEALTH
Dementia
Suicide Self-harm
0
50
100
150
200
250
2011/12 2012/13 2013/14 2014/15
Adm
issio
ns
Year
Emergency Hospital Admissions for Intentional Self-Harm, per 100,000, 2011-15
England London Haringey Islington
05
10152025
2001-03
2002-04
2003-05
2004-06
2005-07
2006-08
2007-09
2008-10
2009-11
2010-12
2011-13
2012-14
2013-15
Rate
per
100,0
00
Year
Suicide: age-standardised rate, per 100,000 (3 year avg.), 2001-15
England London Haringey Islington
In Haringey there are an estimated 1,710 (5.8%) people aged 65 years or over are living
with dementia. 69% of those are diagnosed, accounting for 4.0% of the elderly population
aged 65+ (N=1,180).
In Islington 5.6% of the population aged 65 years or over are thought to have dementia
(N=1,240). Most of them are diagnosed with dementia (5.1% of the population, N=1,120),
leading to the highest dementia diagnosis rate (91%) in Islington among London boroughs,
which is higher than both the London (71%) and England (68%).
Islington’s suicide
rate has decreased
substantially since a
2003-05 peak of 19
per 100,000 to 11
per 100,000 in
2013-15. Similarly,
Haringey has
decreased over the
same time period
and is now closer to
the England
average at 11.1 per
100,000.
Haringey’s self-harm
admissions rate has
remained steady since
2011/12 and remains
significantly lower than
the England average
at 93.9 per 100,000.
Islington’s rate has
fluctuated in recent
years and remains
significantly higher
than both Haringey
and London at 117.2
per 100,000
Source: PHE Dementia profile, 2017
Source: PHOF, 2017 Source: PHOF, 2017
Recorded and estimated prevalence of dementia, 65+ years, 2017
0%
2%
4%
6%
8%
10%
Haringey Islington London England
Pe
rce
nta
ge
of
pe
op
le Recorded prevalence
Expected prevalence
Working in partnership
Demographics Mental HealthChildren and
Young PeoplePhysical wellbeing of
adults & older people
Lifestyles & Risk
factorsSummary Further information
Wider
determinants
0
1
2
3
4
5
6
Camden
Islington
Westm
inster
Barnet
Sutton
Tower Hamlets
Brent
Ealin
g
Enfield
Bexley
Lambeth
Redbridge
Hammersmith and Fulham
Lewisham
Hillingdon
Hackney
Richmond upon Thames
Southwark
Wandsworth
Bromley
Kensington and C
helsea
Merton
Waltham Forest
Hounslow
Croydon
Harrow
Barking and D
agenham
Newham
Havering
Greenwich
Haringey
Kingston upon Thames
City of London
Prevalence
England
London
Pre
vale
nce (
%)
MENTAL HEALTH
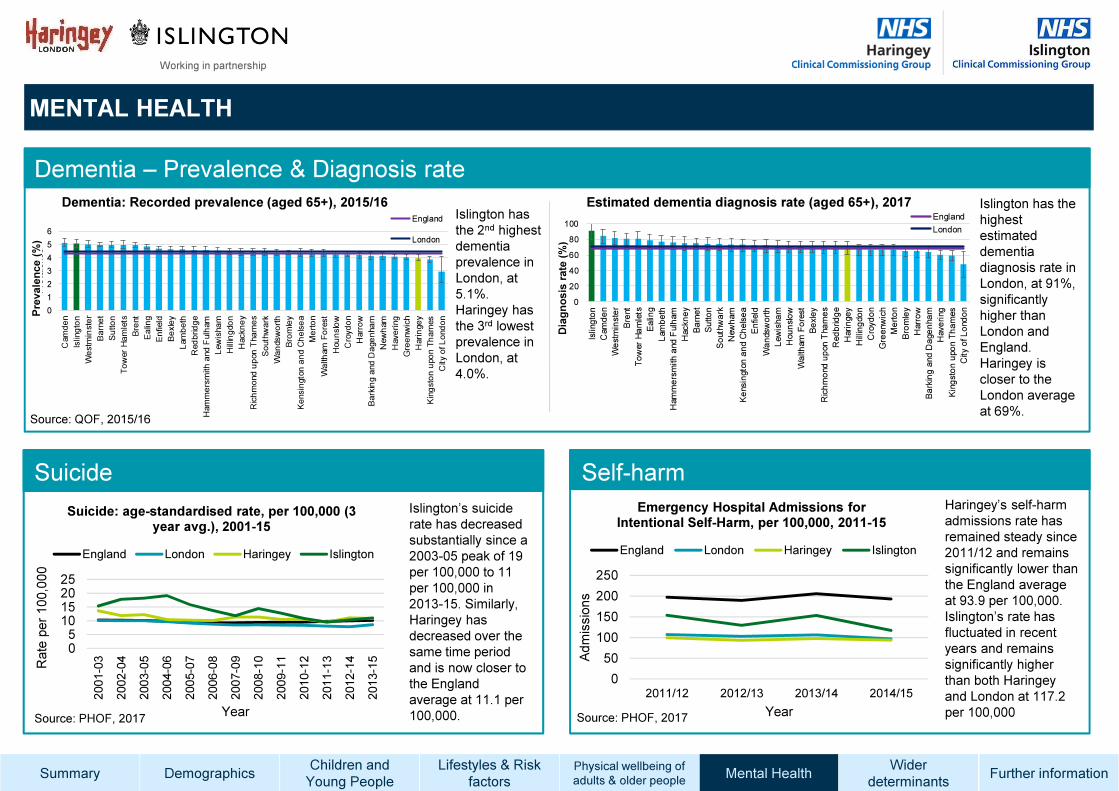
Dementia – Prevalence & Diagnosis rate
Suicide Self-harm
0
50
100
150
200
250
2011/12 2012/13 2013/14 2014/15
Adm
issio
ns
Year
Emergency Hospital Admissions for Intentional Self-Harm, per 100,000, 2011-15
England London Haringey Islington
05
10152025
2001-03
2002-04
2003-05
2004-06
2005-07
2006-08
2007-09
2008-10
2009-11
2010-12
2011-13
2012-14
2013-15
Rate
per 100,0
00
Year
Suicide: age-standardised rate, per 100,000 (3 year avg.), 2001-15
England London Haringey Islington
Islington has
the 2nd highest
dementia
prevalence in
London, at
5.1%.
Haringey has
the 3rd lowest
prevalence in
London, at
4.0%.
Islington has the
highest
estimated
dementia
diagnosis rate in
London, at 91%,
significantly
higher than
London and
England.
Haringey is
closer to the
London average
at 69%.
Islington’s suicide
rate has decreased
substantially since a
2003-05 peak of 19
per 100,000 to 11
per 100,000 in
2013-15. Similarly,
Haringey has
decreased over the
same time period
and is now closer to
the England
average at 11.1 per
100,000.
Haringey’s self-harm
admissions rate has
remained steady since
2011/12 and remains
significantly lower than
the England average
at 93.9 per 100,000.
Islington’s rate has
fluctuated in recent
years and remains
significantly higher
than both Haringey
and London at 117.2
per 100,000
Source: QOF, 2015/16
Source: PHOF, 2017 Source: PHOF, 2017
Dementia: Recorded prevalence (aged 65+), 2015/16 Estimated dementia diagnosis rate (aged 65+), 2017
0
20
40
60
80
100
Islington
Camden
Westminster
Brent
Tower Hamlets
Ealing
Lambeth
Hammersmith and Fulham
Hackney
Barnet
Sutton
Southwark
Newham
Kensington and Chelsea
Enfield
Wandsworth
Lewisham
Hounslow
Waltham Forest
Bexley
Richmond upon Thames
Redbridge
Haringey
Hillingdon
Croydon
Greenwich
Merton
Bromley
Harrow
Barking and Dagenham
Havering
Kingston upon Thames
City of London
England
London
Dia
gn
osis
rate
(%
)
Working in partnership
Demographics Mental HealthChildren and
Young PeoplePhysical wellbeing of
adults & older people
Lifestyles & Risk
factorsSummary Further information
Wider
determinants
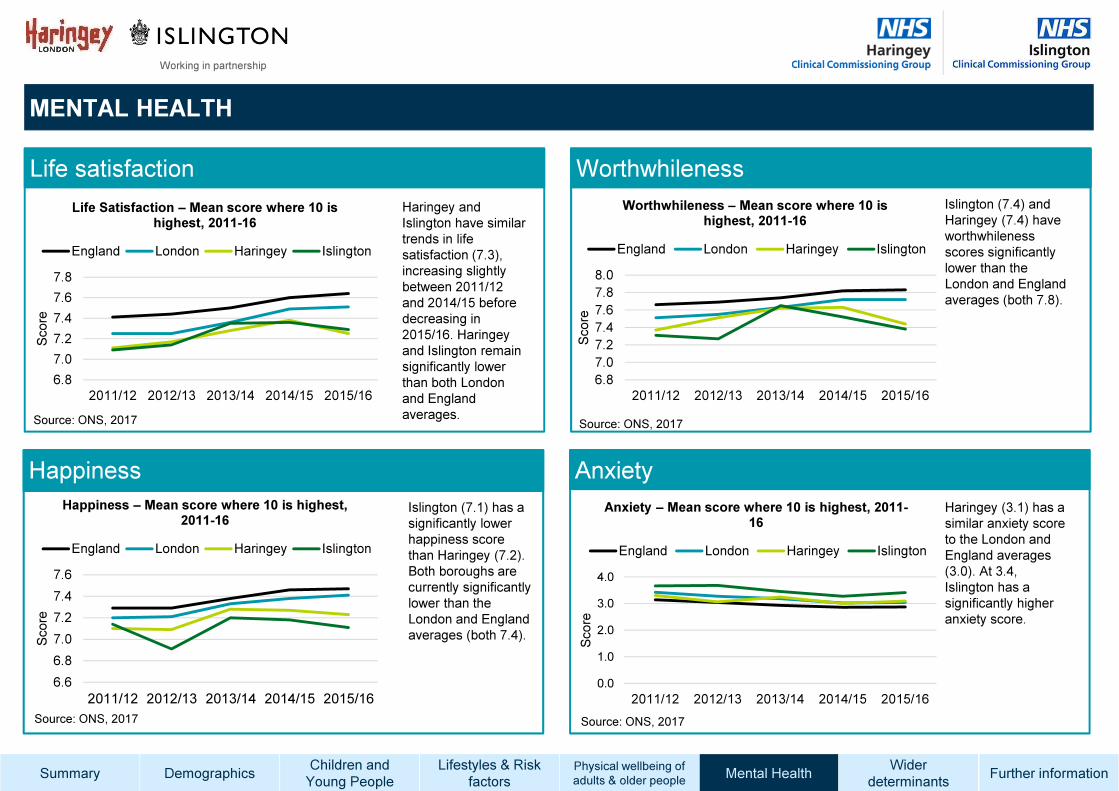
MENTAL HEALTH
Life satisfaction Worthwhileness
Happiness Anxiety
6.6
6.8
7.0
7.2
7.4
7.6
2011/12 2012/13 2013/14 2014/15 2015/16
Score
Happiness – Mean score where 10 is highest, 2011-16
England London Haringey Islington
6.8
7.0
7.2
7.4
7.6
7.8
8.0
2011/12 2012/13 2013/14 2014/15 2015/16
Score
Worthwhileness – Mean score where 10 is highest, 2011-16
England London Haringey Islington
6.8
7.0
7.2
7.4
7.6
7.8
2011/12 2012/13 2013/14 2014/15 2015/16
Score
Life Satisfaction – Mean score where 10 is highest, 2011-16
England London Haringey Islington
0.0
1.0
2.0
3.0
4.0
2011/12 2012/13 2013/14 2014/15 2015/16
Score
Anxiety – Mean score where 10 is highest, 2011-16
England London Haringey Islington
Haringey and
Islington have similar
trends in life
satisfaction (7.3),
increasing slightly
between 2011/12
and 2014/15 before
decreasing in
2015/16. Haringey
and Islington remain
significantly lower
than both London
and England
averages.
Islington (7.4) and
Haringey (7.4) have
worthwhileness
scores significantly
lower than the
London and England
averages (both 7.8).
Source: ONS, 2017Source: ONS, 2017
Source: ONS, 2017 Source: ONS, 2017
Islington (7.1) has a
significantly lower
happiness score
than Haringey (7.2).
Both boroughs are
currently significantly
lower than the
London and England
averages (both 7.4).
Haringey (3.1) has a
similar anxiety score
to the London and
England averages
(3.0). At 3.4,
Islington has a
significantly higher
anxiety score.

Working in partnership
Demographics Mental HealthChildren and
Young PeoplePhysical wellbeing of
adults & older people
Lifestyles & Risk
factorsSummary Further information
Wider
determinants
ISLINGTON & HARINGEY JSNA
WIDER DETERMINANTS

Working in partnership
Demographics Mental HealthChildren and
Young PeoplePhysical wellbeing of
adults & older people
Lifestyles & Risk
factorsSummary Further information
Wider
determinants
WIDER DETERMINANTS
Housing
Overcrowded households, 2015/16
Source: 2011 Census, Department for
Communities and Local Government, 2015/16
An estimated 18,100 households
in Haringey and 11,300 in
Islington are overcrowded.
Out-of-work benefit claimants, November 2016
About one in ten people aged 16 to 64 years
are claiming an out-of-working benefit in
Haringey (9%) and Islington (10%). Islington has
the second highest proportion of out-of-
claimants in London (7%). Higher proportions of
benefit claimants were found in BME groups,
people with disabilities and lone parents.
Employment
Source: DWP, accessed the 7th of September 2017
Education Violent crime
Households in temporary
accommodation, 2015/16
Around 3,200 households (28 per 1,000
households) in Haringey and 900
households (9 per 1,000) in Islington
are living in temporary accommodation.
The rate is almost double in Haringey
compared to London (15 per 1,000).
Source: PHE, 2017
About 5,500 (3%) working age people in
Haringey and 6,400 (4%) in Islington are on
sickness / disability benefits due to mental
illness, meaning one-in-three out-of-work
benefit claims are due to mental illness.
School readiness, 2015/16
72% of 5 year olds in Haringey and 66% in
Islington are reaching a ‘good level of development’
at the end of reception. It is significantly lower in
Islington compared the London average (71%).
Young people not in education, employment or training, 2015
Source: PHE, 2017
3.6% of 16-18 years old in Haringey and 2.1% in
Islington are not in education, employment, or
training. Compared to London (3.1%), the proportion
is slightly higher in Haringey and lower in Islington. It
has decreased in Islington, from 8.8% in 2012, while
It has remained stable in Haringey.
In 2015/16 almost
6,600 (25 per 1,000
population) violence
against the person
offences in Haringey
and 6,030 (27 per
Violence offences, 2015/16 Sexual offences, 2015/16
In Haringey and Islington there
were about 490 (1.8 per 1,000
population) and 430 (2.0 per
1,000) sexual offences recorded in
2015/16 respectively.
Source: PHE, 2017
Domestic violence, 2015/16
In 2015/16, 22.5 domestic
abuse-related incidents and
crimes per 1,000 people
aged 16 or over were
recorded in Haringey and
Islington.
1,000) in Islington were recorded.
The rates are higher compared to
London (22 per 1,000) and England
(17 per 1,000). Islington had the
second highest violent crime rate
among the London boroughs.
Education
Employment
Training

Working in partnership
Demographics Mental HealthChildren and
Young PeoplePhysical wellbeing of
adults & older people
Lifestyles & Risk
factorsSummary Further information
Wider
determinants
FURTHER INFORMATION
About Islington and Haringey’s JSNA
Islington Council’s Evidence Hub brings together information held across different organisations into one accessible place. It provides access to evidence, intelligence and data on
the current and anticipated needs of Islington’s population and is designed to be used by a broad range of audiences including practitioners, researchers,
commissioners, policy makers, Councillors, students and the general public: http://evidencehub.islington.gov.uk/jsna/Pages/default.aspx
Additional insight on Haringey’s JSNA can found via the following webpage: http://www.haringey.gov.uk/social-care-and-health/health/joint-strategic-needs-assessment-jsna
This summary was produced by Mustafa Kamara (Public Health Analyst, Islington) James Barber (Senior Public Health Analyst, Haringey) Minkyoung Choi (Public Health Office,
Islington) Sam Stevenson (Public Health Analyst, Haringey), reviewed and approved for publication by Mahnaz Shaukat (Head of Health Intelligence)
Contact: [email protected]


