

Global J Res. Med. Plants & Indigen. Med. | Volume 3, Issue 11 | November 2014 | 389–401
Global Journal of Research on Medicinal Plants & Indigenous Medicine || GJRMI ||
ISSN 2277-4289 | www.gjrmi.com | International, Peer reviewed, Open access, Monthly Online Journal
EVALUATION OF THE BIOCHEMICAL AND HEMATOLOGICAL
PARAMETERS IN THE SERUM OF ALBINO RATS FED WITH
SKIMMED, WHOLE, FLAVORED AND SOYA MILK
COMMONLY CONSUMED IN NIGERIA
Essien E B1*, Onwuka F C
2, Odjoh O
3, Odeghe O B
4
1,2,3,4
Department of Biochemistry, Faculty of Science, P.M.B 5323 University of Port Harcourt, Rivers State,
Nigeria.
*Corresponding Author: E-mail: [email protected]
Received: 07/08/2014; Revised: 20/10/2014; Accepted: 30/10/2014
ABSTRACT
The effect of milk samples on haematological and biochemical parameters in the serum of twenty-
five albino rats was evaluated. Rats were subjected to feeding trial over a period of 4 weeks on diets
containing: 100g of standard rat feed and water (group A), 55g of milk sample with 45g of standard rat
feed and water for groups B (skimmed milk), C (whole milk), D (soya milk), and E (flavoured milk). At
the end of the experimental period, the highest weight gain was observed in rats fed with soya milk
(61.20%), while rats fed with skimmed milk had the least weight gain (32.40%) when compared to the
control (47.80%). Rats fed with soya milk had the highest hemoglobin concentration (13.24 ± 0.42g/dl)
and packed cell volume (39.80 ± 1.28%). The urea concentration of rats fed with soya milk was higher
(3.10 ± 0.05 mmol/l) than values obtained from the other milk samples evaluated. Results of creatinine
and bilirubin concentrations of rats in all groups were within normal values, while the values obtained
from the enzyme activities analyzed were consistent with normal reference values. Rats fed with
skimmed milk had the highest cholesterol and high density lipoprotein cholesterol concentrations as 3.70
± 0.05mmol/l and 0.91 ± 0.00mmol/l respectively, when compared to the control (3.23 ± 0.03 and
0.83 ± 0.01mmol/l respectively). A hypocholesteremic effect was observed in rats fed with whole milk,
soya milk and flavoured milk. Rats fed with flavoured milk and skimmed milk had higher concentration
of low density lipoprotein cholesterol (2.03 ± 0.61mmol/l and 2.33 ± 0.06mmol/l respectively) when
compared to the control group (1.96 ± 0.03mmol/l). The least triglyceride concentration was observed in
rats fed with soya milk (1.06 ± 0.08mmol/l) when compared to the control, while rats fed with skimmed
milk, whole milk and flavored milk had elevated triglyceride levels. Results of present investigation
demonstrate the benefits of consuming soya milk. On the other hand, the consumption of skimmed milk
with respect to weight gain is encouraged.
KEY WORDS: Milk, biochemical, hematological, enzyme activities, blood lipids.
Research Article
Cite this article:
Essien E B, Onwuka F C, Odjoh O, Odeghe O B (2014), EVALUATION OF THE BIOCHEMICAL AND
HEMATOLOGICAL PARAMETERS IN THE SERUM OF ALBINO RATS FED WITH SKIMMED,
WHOLE, FLAVORED, AND SOYA MILK COMMONLY CONSUMED IN NIGERIA,
Global J Res. Med. Plants & Indigen. Med., Volume 3(11): 389–401

Global J Res. Med. Plants & Indigen. Med. | Volume 3, Issue 11 | November 2014 | 389–401
Global Journal of Research on Medicinal Plants & Indigenous Medicine || GJRMI ||
INTRODUCTION
Milk is the natural secretion of the
mammary glands which plays a fundamental
role in nutrition, growth, development and
immunity of the newly born young (Woo et al.,
1995). Each species of mammals produces
milk with a unique composition designed to
meet the specific needs of the infants. For
instance, the milk of animals that grow rapidly,
such as cows which double their birth weight in
50 days is rich in protein and minerals. Milk
has also been defined as an emulsion of fat
globules in a suspension of casein micelles, all
suspended in an aqueous phase which contains
solubilized lactose, whey proteins and mineral
salts (Jensen, 1998). Milk is a highly nutritious
versatile food. People enjoy drinking milk in its
natural form and also use it to make a wide
range of food products including butter, yogurt,
cheese and ice cream. Cow’s milk and milk
products have played an important role in
human nutrition. Fresh cow milk is reported to
contain about 88% water (Kataoka et al.,
1991). During processing, the water content of
the milk is reduced, which confers desirable
qualities on the milk such as increased shelf
life, product flexibility and decreased
transportation cost (Miller et al., 1999). Milk
and milk products play an important part in a
healthy diet as they contribute to intakes of
essential nutrients and protein of a nutritionally
high quality. Milk products provide beneficial
nutrients including calcium, riboflavin, protein
and vitamin A to the diet (Block, 1985), but
whole milk products also contribute significant
amount of fats, saturated fat and cholesterol,
which have been shown to increase blood
cholesterol and subsequently pose a risk of
coronary heart disease (Kristi et al., 1994).
Several investigations on the effect of milk
in relation to coronary heart diseases have been
carried out on both rats and man. While some
investigations reveal the benefits of milk
consumption, other studies have established a
link of the dairy product to coronary heart
disease. Still, some other researchers have
encouraged the consumption of specific milk
brands due to results obtained from their
findings. But there was no convincing evidence
that milk is harmful (Elwood et al., 2004).
Another study found no evidence that men
(aged 35–64 years) who consumed milk each
day, at a time when most milk consumed was
full fat milk, were at increased risk of death
from all causes or from coronary heart disease
(Ness et al., 2001). On the contrary, another
study has shown a high positive correlation
between milk consumption in different
countries and rates of death a few years later
from coronary heart disease (Margaret, 2002).
Milk intake is probably positively related to
blood lipids (Steinmetz et al., 1994). Although
milk has long been considered an important
factor in coronary heart disease because of the
contribution it makes to the dietary intake of
saturated fats, expert groups have advised that
milk consumption should be limited, and that
fat reduced milk should be preferred
(Nutritional Aspects of Cardiovascular Disease,
1994). This fact was further strengthened in a
report by Kritchevsky et al. (1979), in which
they pointed out that there is a factor in milk
which helps to reduce cholesterol levels in rats
and man. Although the mechanism by which
milk help to reduce cholesterol level is unclear,
they suggest that milk does not exert a
hypercholesterolemic effect. A study on eight
healthy male subjects (adults) demonstrated the
benefits of drinking skimmed milk, as
compared with whole milk (Kristi et al., 1994).
As a result of the effects of milk on human
health, some individuals now consume soya
milk in place of dairy milk products. Using soy
milk to replace foods high in animal protein
that contain saturated fat and cholesterol may
confer benefits to cardiovascular health (Sacks
et al., 2006). Comparative clinical trials have
shown that consumption of diets rich in soy
protein as opposed to those high in animal
protein significantly lowered blood total
cholesterol, low density lipoprotein, and
triglycerides, without lowering helpful high
density lipoprotein cholesterol (Anderson et al.,
1995). As a result of the previous research
investigations on the effect of milk on coronary
heart diseases examined, the present study was
carried out with a view of bringing to light the
effect of milk consumption on the

Global J Res. Med. Plants & Indigen. Med. | Volume 3, Issue 11 | November 2014 | 389–401
Global Journal of Research on Medicinal Plants & Indigenous Medicine || GJRMI ||
hematological and biochemical parameters in
the serum of albino rats.
MATERIALS AND METHODS
Collection and preparation of milk samples
The different types of milk used for this study
were purchased from a local market in Choba,
Port Harcourt. Dano slim milk serve as
skimmed milk, cowbell chocolate flavor milk
as flavoured milk, while peak instant full cream
milk powder as the whole milk used for this
study. Soya bean seed (Glycine maximus) were
bought from a local market, cleaned off dirt and
soaked with clean water for 12 hours. It was
thereafter hulled, washed, and ground to a
homogenous paste. To this was added water to
form a slightly liquid mixture and filtered with
cheese cloth to obtain the filtrate as milk which
was analyzed immediately.
Experimental design
Twenty-five albino rats (Wistar strain)
weighing between 182–247g were purchased
from the Animal House of the Department of
Biochemistry, University of Port Harcourt. The
animals were then divided into five groups of
five rats each designated A (control), B, C, D,
and E. Before the commencement of the dietary
regimen, the animals were fasted over night but
allowed access to water ad libitum. The
treatment protocol is as follows: group A
received 100 g of standard rat feed and water,
groups B, C, D, and E were fed 55 g of
skimmed, whole, soya, and flavoured milk
respectively with 45 g of standard rat feed.
Assay
At the end of the study period, the animals
were exposed to chloroform vapour, and about
2ml of blood sample was obtained by cardiac
puncture, which was transferred into EDTA
and heparin bottles. Blood samples were then
centrifuged at 4000 rpm for 10 minutes to
obtain serum, which was stored in the
refrigerator and analyzed three hours later. The
weights of the animals were taken before and
after the dietary regimen. The proximate
analysis was determined using the standard
method of AOAC (1984). These include the
determination of crude protein, crude fat,
moisture content, ash, crude fiber,
carbohydrates and minerals, while the
phytochemical screening of the secondary
metabolites in soya milk was by the method of
Harborne (1973). The vitamin contents were
analyzed according to the method of AOVC
(1966). The energy content was obtained by
multiplying the protein, fat and carbohydrates
by factors 4, 9 and 4 respectively.
Haematological parameters were analyzed
using microhaematocrit method and Sahli’s
haemoglobinometer as described by Ramnik,
1990. The biochemical parameters analyzed
was carried out using commercial kits from
Randox laboratories Ltd (Northern Ireland).
Total protein was determined by the Biuret
reaction described by Tietz (1990) and albumin
concentrations were estimated by method of
Doumas et al. (1971). Creatinine estimation
was done using Reflotron, a semi automated
dry chemistry analyzer, and urea was by the
method of Fawcett and Scott, (1960). Bilirubin
concentration was by the method of Jendrassik
and Grof, (1938). Serum samples were
analyzed for aspartate aminotransaminase
(AST), alanine aminotransaminase (ALT), and
alkaline phosphatase activities using
commercial kits as described by Reitman and
Frankel (1957), and Klein et al. (1960).
Determination of total cholesterol in the serum
was by the method of Trinder, (1960); high
density lipoprotein cholesterol (HDL-C) was
determined by the method of Friedewald
(1972), while the level of low density
lipoprotein cholesterol (LDL-C) was calculated
using Friedewald’s equation. Serum
triglyceride (TG) was determined using the
method of Tietz, (1990).
Statistical analysis
The data were analyzed using inferential
statistics. All values are presented as Mean ±
SEM (standard error of mean) for 5 rats in each
of the 5 groups. The significance of difference
in the means of all parameters reported was

Global J Res. Med. Plants & Indigen. Med. | Volume 3, Issue 11 | November 2014 | 389–401
Global Journal of Research on Medicinal Plants & Indigenous Medicine || GJRMI ||
determined using one way ANOVA by least
significant difference (LSD) comparison test.
RESULTS
Results of the study to evaluate the
proximate composition, biochemical and
hematological parameter in the serum of albino
rats fed with skimmed milk, whole milk, soya
milk and flavoured milk are presented in tables
1 to 7. The result of proximate analysis of milk
samples is presented in Table 1. The milk
samples had energy values of between
261.5kcal and 393.2kcal. Whole milk had the
highest energy value while skimmed milk had
the least energy value. The highest crude
protein obtained was recorded in skimmed milk
(28.13%), followed by whole milk (24.01%),
and soya milk (21.44%), with flavoured milk
having the least crude protein value of 12.36%.
The ash content was highest in skimmed milk
(8.70%), with the least value in flavoured milk
(2.13%). Although whole milk had the highest
fat content of 23.16% than the other milk
samples, it had the least moisture content
(0.81%), while skimmed milk had the least fat
content (2.52%). The fiber content of the milk
samples range between 0 and 36.62%, with
soya milk having the highest fiber content.
Flavoured milk had the highest carbohydrate
content of 56.44%, while the least carbohydrate
content was obtained from soya milk. The
vitamin and mineral contents of whole and
flavoured milk were reported as stated by the
manufacturers, while the trace elements in
skimmed milk were analyzed. The proximate
composition of soya milk was obtained by
analysis. The highest of vitamin B1 was
observed in whole milk (0.99 mg), with soya
milk obtaining the least value (0.19mg).
Skimmed and flavoured milk both had the
highest content of vitamin B2, being 1.40 mg
respectively, while soya milk had the least
vitamin B2. Although soya milk had the highest
vitamins B6 and B12 values of 5.35 mg and 3.47
mg, than the other milk samples, it obtained a
corresponding least vitamin C content (3.63
mg), with whole milk had the highest vitamin C
content. Results of macro and trace minerals
obtained revealed skimmed milk as having the
highest content of calcium (1800 mg),
phosphorus (900 mg), and potassium (1600
mg), with soya milk had the least calcium (81.5
mg), phosphorus (5.50 mg), and potassium (12
mg) contents. The magnesium content was
higher in soya milk (192.69 mg), and least in
whole milk (85 mg). The iron content range
between 0.17 and 15.30 mg, with the highest
value obtained from soya milk and whole milk
having the least value. The zinc content of
whole milk was higher than the other milk
samples analysed. Results of phytochemical
screening of soya milk indicate the presence of
glycosides, steroids, terpenoids, and reducing
sugars (Table 2).
The initial and final body weights of rats
fed with milk samples are presented in Table 3.
An increase in body weight was observed in
each group at the end of the dietary regimen.
However, there was no significant difference in
the initial and final body weights of the control
and treatment group. Rats fed with soya milk
(61.20%) gained the highest weight when
compared with the control group (47.80%),
while the least weight gained was observed in
rat groups fed with skimmed milk (32.40%).
The hematological investigation on rats fed
the milk samples is presented in Table 4. Group
D rats fed soya milk had the highest
hemoglobin concentration (13.24 ± 0.42g/dl)
and packed cell volume of 39.80 ± 1.28%,
while the least values was obtained from the
control group (10.04 ± 0.98 g/dl and
30.00 ± 2.94%) respectively. No significant
difference was observed in the hemoglobin
concentration of groups B, C and E rats (fed
with skimmed, whole, and flavoured milk
respectively) when compared with the control,
while a significant difference was observed in
the packed cell volume of groups B and E rats
when compared with the control group.

Global J Res. Med. Plants & Indigen. Med. | Volume 3, Issue 11 | November 2014 | 389–401
Global Journal of Research on Medicinal Plants & Indigenous Medicine || GJRMI ||
Table 1. Proximate analysis of milk samples and soya milk analyzed
Parameter Skimmed milk whole milk Flavoured milk Soya milk
Energy (kcal) 261.5 393.2 339.2 339.2
Protein (%) 28.13 ± 0.15 24.01 ± 0.03 12.36 ± 0.64 21.44 ± 0.29
Ash (%) 8.70 ± 0.01 5.44 ± 0.03 2.13 ± 0.13 6.50 ± 0.02
Fats (%) 2.52 ± 0.08 23.16 ± 0.23 7.11 ± 0.20 21.90 ± 0.42
Moisture (%) 3.96 ± 0.03 0.81 ± 0.01 21.52 ± 0.57 1.20 ± 0.01
Fiber (%) 0.00 0.00 0.00 36.62 ± 0.03
Carbohydrate (%) 31.57 ± 0.82 22.21 ± 0.03 56.44 ± 2.23 12.34 ± 0.17
Vitamin A (IU) 2500* 2700 3750 23.21 ± 0.02
Vitamin B1(mg) NI 0.99 0.90 0.19 ± 0.02
Vitamin B2 (mg) 1.40 1.10 1.40 0.15 ± 0.03
Vitamin B3 (mg) NI 0.60 11.00 0.98 ± 0.08
Vitamin B6 (mg) NI 0.90 1.50 5.35 ± 0.04
Vitamin B12(mg) 0.003 0.0024 0.0045 3.47 ± 0.07
Vitamin C (mg) NI 90 30 3.63 ± 0.03
Vitamin E (mg) NI 0.60 4.00 0.34 ± 0.05
Calcium (mg) 1800 930 380 81.5 ± 0.06
Phosphorus (mg) 900 750 312 5.50 ± 0.02
Magnesium (mg) 120 85 121 192.69 ± 0.07
Potassium (mg) 1600 1200 523 12.00 ± 0.06
Sodium (mg) 19.87 340 106 2.59 ± 0.11
Iron (mg) NI 0.17 13.50 15.30 ± 0.06
Zinc (mg) 0.08 31 3.8 0.20 ± 0.03
Copper (mg) 0.12 0.02 0.1 0.20 ± 0.03
Selenium (µg) NI 10 17.5 7.15 ± 0.02mg
Manganese (mg) 0.04 0.02 0.10 0.01 ± 0.02 *Enriched, NI= Not indicated
Table 2. Phytochemical Screening Of Soya Milk
Secondary metabolites Relative abundance
Alkaloids −
Flavonoids −
Glycosides ++
Saponins ND
Steroids ++
Terpenioids +++
Carbohydrates ND
Reducing sugar ++
Resin ND
Tannins −
Proteins ND
Oils ND
Acid compounds ND Key: − = Absent; + = Low in concentration; ++ = Moderate in concentration; +++ = High in concentration;
ND = Not determined

Global J Res. Med. Plants & Indigen. Med. | Volume 3, Issue 11 | November 2014 | 389–401
Global Journal of Research on Medicinal Plants & Indigenous Medicine || GJRMI ||
Table 3. Mean body weights of rats (grams) fed the milk samples
Groups Initial body weight Final body weight Weight gained (%)
Control 218.20 ± 12.31b 266.00 ± 14.50
b 47.80
Skimmed milk 208.00 ± 9.43b 240.40 ± 12.25
b 32.40
Whole milk 206.60 ± 6.79b 242.20 ± 7.45
b 35.60
Soya milk 209.80 ± 10.05b 271.00 ± 10.95
b 61.20
Flavoured milk 209.60 ± 8.61b 245.60 ± 9.26
b 36.00
Values are mean ± SEM (n=5/group). bP>0.05. One way ANOVA by least significant difference comparison (LSD) test
Table 4. Hematological parameters of rats fed with milk samples
Group Hemoglobin (g/dl) Packed cell volume (%)
Control 10.04 ± 0.98b 30.00 ± 2.94
b
Skimmed milk 11.22 ± 0.44b 33.60 ± 1.20
a
Whole milk 10.47 ± 0.77b 31.50 ± 2.32
b
Soya milk 13.24 ± 0.42a 39.80 ± 1.28
a
Flavoured milk 11.50 ± 0.16b 34.80 ± 0.37
a
Values are mean ± SEM (n=5 rats/group). Values in the same row carrying different superscripts are significantly
different (P<0.05).
The results obtained for the biochemical
parameters considered in this study is presented
in Table 5. The control rats had the highest
serum total protein concentration being 67.40 ±
0.86g/l, while animals fed soya milk had the
least total protein concentration of 44.73 ±
4.78g/l. The least albumin concentration was
obtained by rats fed with soymilk (27.13 ±
2.70g/l), followed by rats fed with flavoured
milk (31.13 ± 2.54g/l) and whole milk (31.70 ±
3.09g/l) respectively. The control group had the
highest albumin concentration as 40.20 ±
0.49g/l, followed by rats fed with skimmed
milk (39.40 ± 0.00g/l). Although no significant
difference was observed in serum creatinine,
urea and bilirubin concentration of rats in each
groups, the creatinine concentration ranged
from 57.33 ± 0.66 to 60.66 ± 0.33µmol/l. Rats
fed with flavoured milk had the least creatinine
concentration, with the highest concentration
observed in rats fed with soya milk. Rats fed
with soya milk had the highest urea
concentration of 3.10 ± 0.05 when compared
with the control rats (2.90 ± 0.10), with the
least value obtained by rats fed with flavoured
milk (2.80 ± 0.05mmol/l). A slight significant
increase in urea concentration was observed in
rats fed with skimmed milk and whole milk
when compared to the control group, while rats
fed flavoured milk had slight reduction as
compared to the control group. The direct
bilirubin concentrations of rats ranged between
3.26 ± 0.14 µmol/l (soya milk) and 4.00 ±
0.57µmol/l (whole milk). The control rats
obtained the highest total bilirubin
concentration being 7.53 ± 0.37µmol/l,
followed by rats fed with soya milk (7.26 ±
0.21µmol/l), while rats fed with whole milk
had the least total bilirubin concentration (6.96
± 0.32µmol/l).
The enzyme activities of animals fed the
various experimental diets and the control is
depicted in Table 6. From the results obtained,
no significant difference (P>0.05) was
observed in the activities of aspartate
aminotransaminase (AST), alanine
aminotransminase (ALT) and alkaline
phosphatase when compared with the values
obtained from the control rats.
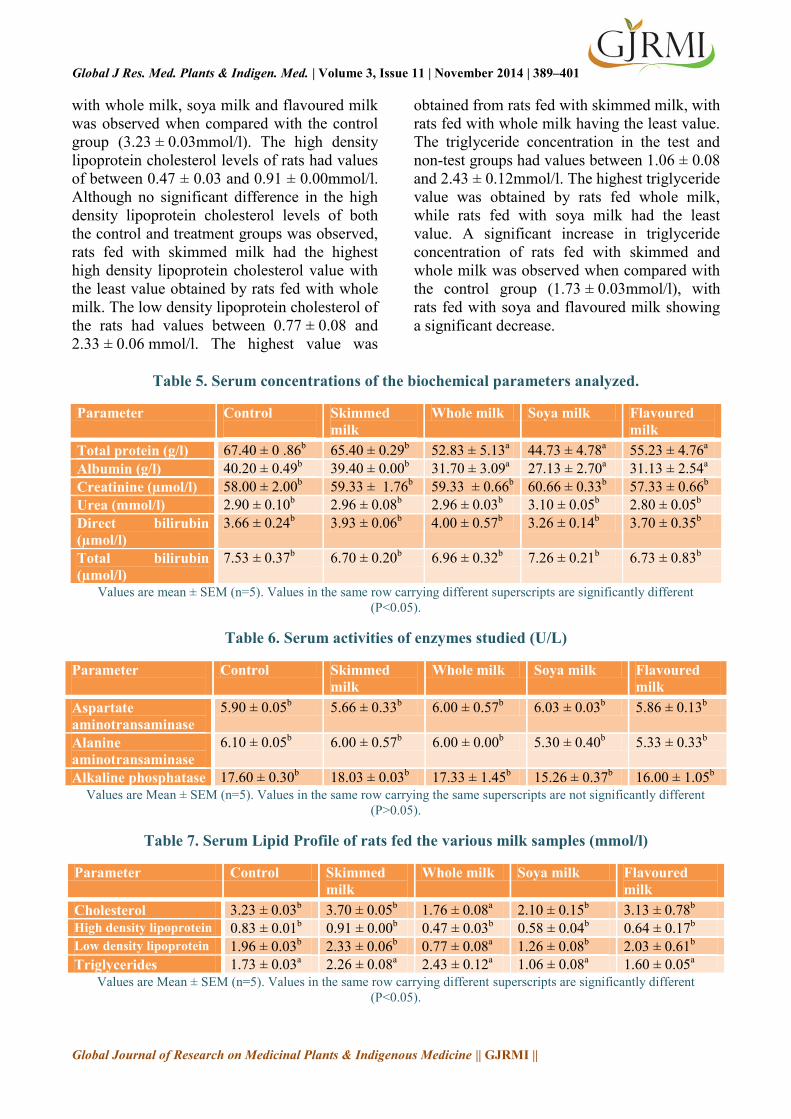
The effect of the various milk samples on
serum lipid profile of rats is shown in Table 7.
From the results obtained, the highest
cholesterol level was obtained by rats fed
skimmed milk being 3.70 ± 0.05mmol/l, while
rats fed whole milk had the least cholesterol
value (1.76 ± 0.08 mmol/l). A significant
reduction in the cholesterol level of rats fed
Global J Res. Med. Plants & Indigen. Med. | Volume 3, Issue 11 | November 2014 | 389–401
Global Journal of Research on Medicinal Plants & Indigenous Medicine || GJRMI ||
with whole milk, soya milk and flavoured milk
was observed when compared with the control
group (3.23 ± 0.03mmol/l). The high density
lipoprotein cholesterol levels of rats had values
of between 0.47 ± 0.03 and 0.91 ± 0.00mmol/l.
Although no significant difference in the high
density lipoprotein cholesterol levels of both
the control and treatment groups was observed,
rats fed with skimmed milk had the highest
high density lipoprotein cholesterol value with
the least value obtained by rats fed with whole
milk. The low density lipoprotein cholesterol of
the rats had values between 0.77 ± 0.08 and
2.33 ± 0.06 mmol/l. The highest value was
obtained from rats fed with skimmed milk, with
rats fed with whole milk having the least value.
The triglyceride concentration in the test and
non-test groups had values between 1.06 ± 0.08
and 2.43 ± 0.12mmol/l. The highest triglyceride
value was obtained by rats fed whole milk,
while rats fed with soya milk had the least
value. A significant increase in triglyceride
concentration of rats fed with skimmed and
whole milk was observed when compared with
the control group (1.73 ± 0.03mmol/l), with
rats fed with soya and flavoured milk showing
a significant decrease.
Table 5. Serum concentrations of the biochemical parameters analyzed.
Parameter Control
Skimmed
milk
Whole milk Soya milk Flavoured
milk
Total protein (g/l) 67.40 ± 0 .86b 65.40 ± 0.29
b 52.83 ± 5.13
a 44.73 ± 4.78
a 55.23 ± 4.76
a
Albumin (g/l) 40.20 ± 0.49b 39.40 ± 0.00
b 31.70 ± 3.09
a 27.13 ± 2.70
a 31.13 ± 2.54
a
Creatinine (µmol/l) 58.00 ± 2.00b 59.33 ± 1.76
b 59.33 ± 0.66
b 60.66 ± 0.33
b 57.33 ± 0.66
b
Urea (mmol/l) 2.90 ± 0.10b 2.96 ± 0.08
b 2.96 ± 0.03
b 3.10 ± 0.05
b 2.80 ± 0.05
b
Direct bilirubin
(µmol/l)
3.66 ± 0.24b 3.93 ± 0.06
b 4.00 ± 0.57
b 3.26 ± 0.14
b 3.70 ± 0.35
b
Total bilirubin
(µmol/l)
7.53 ± 0.37b 6.70 ± 0.20
b 6.96 ± 0.32
b 7.26 ± 0.21
b 6.73 ± 0.83
b
Values are mean ± SEM (n=5). Values in the same row carrying different superscripts are significantly different
(P<0.05).
Table 6. Serum activities of enzymes studied (U/L)
Parameter
Control Skimmed
milk
Whole milk Soya milk Flavoured
milk
Aspartate
aminotransaminase
5.90 ± 0.05b 5.66 ± 0.33
b 6.00 ± 0.57
b 6.03 ± 0.03
b 5.86 ± 0.13
b
Alanine
aminotransaminase
6.10 ± 0.05b 6.00 ± 0.57
b 6.00 ± 0.00
b 5.30 ± 0.40
b 5.33 ± 0.33
b
Alkaline phosphatase 17.60 ± 0.30b 18.03 ± 0.03
b 17.33 ± 1.45
b 15.26 ± 0.37
b 16.00 ± 1.05
b
Values are Mean ± SEM (n=5). Values in the same row carrying the same superscripts are not significantly different
(P>0.05).
Table 7. Serum Lipid Profile of rats fed the various milk samples (mmol/l)
Parameter Control Skimmed
milk
Whole milk Soya milk Flavoured
milk
Cholesterol 3.23 ± 0.03b 3.70 ± 0.05
b 1.76 ± 0.08
a 2.10 ± 0.15
b 3.13 ± 0.78
b
High density lipoprotein 0.83 ± 0.01b 0.91 ± 0.00
b 0.47 ± 0.03
b 0.58 ± 0.04
b 0.64 ± 0.17
b
Low density lipoprotein 1.96 ± 0.03b 2.33 ± 0.06
b 0.77 ± 0.08
a 1.26 ± 0.08
b 2.03 ± 0.61
b
Triglycerides 1.73 ± 0.03a 2.26 ± 0.08
a 2.43 ± 0.12
a 1.06 ± 0.08
a 1.60 ± 0.05
a
Values are Mean ± SEM (n=5). Values in the same row carrying different superscripts are significantly different
(P<0.05).

Global J Res. Med. Plants & Indigen. Med. | Volume 3, Issue 11 | November 2014 | 389–401
Global Journal of Research on Medicinal Plants & Indigenous Medicine || GJRMI ||
DISCUSSION
The results of proximate composition of the
milk samples as depicted in Table 1 shows a
slight variation in the energy values of whole
milk, flavoured milk and soya milk. This
variation was due to the energy contents
obtained from the carbohydrate, crude protein
and fat contents of the milk samples. The
highest energy value was obtained from whole
milk, while skimmed milk had the least energy
value. The consumption of skimmed milk is
therefore recommended for those who wish to
reduce their calorie intake.
Results of crude protein revealed that the
consumption of skimmed milk, whole milk and
soya milk are good dietary sources of protein. It
is reported that an adult would have to drink
about two liters of milk to satisfy the
recommended daily allowance for protein (60–
70g) (Pamplona-Roger, 2004).
The ash content of a food sample is a
reflection of its mineral element composition.
Skimmed milk was shown to have the highest
ash content, followed by soya milk, with the
least ash content obtained from flavoured milk.
The higher ash content in the skimmed milk
analysed revealed a rich composition of
mineral elements, especially the macro
elements.
One cup of 236 ml whole milk contains
approximately 629kJ (150kcal) and 8 grams of
fat (5 grams of which are saturated) as
compared with 356kJ (85kcal) and 0.4g fat in
one cup of skimmed milk (United States
Department of Agriculture, 1976). The highest
crude fat was obtained from whole milk when
compared with the fat contents of the other
milk samples while skimmed milk had the least
crude fat content. The least crude fat obtained
from skimmed milk is a reflection of its
reduced fat (calorie) content during the
production process. Hence, adults who wish to
reduce their calorie intake from milk products
should be encouraged to consume skimmed
milk. The moisture content of the milk samples
was highest in flavoured milk, and this tends to
decrease its keeping property. Whole milk had
the least moisture content which may indicate
that it would keep longer than other samples.
Of the milk samples analysed, only soya
milk had a fiber content which could be
attributed to the fact that it is obtained from
plant source, as opposed to processed milk
from animal source. Soya milk proved to be an
excellent source of dietary fiber, hence its
consumption should be highly recommended.
The carbohydrate content of soya milk was
low, as compared with the carbohydrate
contents in the processed milk samples.
Flavoured milk was shown to contain the
highest carbohydrate content.
Vitamin content analyses as presented in
Table 1 showed skimmed milk, whole milk,
and flavoured milk to be good sources of
vitamin A as opposed to the content in soya
milk. Thus processed dairy milk powder
provides the daily recommended intake of this
vitamin being 600–900 mg for adults, and 300–
400 mg for children (Daily Reference Intakes,
2001).
Results shows the milk samples to be a
poor source of vitamin B1 (thiamin), as they do
not provide the daily recommended need of
0.9–1.2 mg/day (for adults) and 0.5–0.6 mg/day
for children (Daily Reference Intakes, 1998).
The consumption of approximately 28 grams of
skimmed and flavoured milk by adults and
children can provide the daily intake of vitamin
B2 (riboflavin), being 0.5–0.6 mg for children
and 0.9–1.3 mg for adults (Daily Reference
Intakes, 1998). These milk samples show them
to be poor sources of vitamin B3
(Nicotinamide) as they do not provide the daily
requirement for this vitamin. Soya milk proved
to be good sources of vitamins B6 (pyridoxine)
and B12 (cobalamine), when compared to the
contents derived from the processed milk
samples. The Daily Reference Intake of vitamin
C by adults is 45–90 mg and 15–25 mg for
children. Result of proximate composition of
the whole milk powder used for this study is
shown to provide the daily need of this vitamin
by both adults and children. The milk samples
also proved to be poor sources of vitamin E

Global J Res. Med. Plants & Indigen. Med. | Volume 3, Issue 11 | November 2014 | 389–401
Global Journal of Research on Medicinal Plants & Indigenous Medicine || GJRMI ||
since they do not provide the required daily
intake for both children and adults. The mineral
elements constitute an important group of
nutrients required by the body for optimal
functions (WHO, 1996). They are divided into
macro minerals (sodium, potassium,
magnesium, calcium and phosphorus) and trace
elements (iron, zinc, copper and manganese).
The sodium content of the milk samples
prove to be poor sources of sodium since they
do not provide the daily reference intake of
1.0–1.2g (for children), and 1.2–1.5g for adults
(DRI, 2001). The estimated safe and adequate
daily dietary intake for potassium is 550–4575
mg in children, and 1875–5625 mg in adults
(Daily Reference Intakes, 2001). Result shows
that the milk samples analyzed do not
contribute to the daily requirement of this
element. Skimmed milk had the highest
calcium and phosphorus content with soya milk
had the least calcium and phosphorus content.
This indicates that consumption of skimmed
and whole milk can provide the daily need for
calcium and phosphorus in both children and
adults. In this present study, soya milk was
shown to contain the highest magnesium
content over the dairy milk products analyzed.
Soya milk consumption contributes to the
recommended daily allowance of magnesium in
children, being 70–170mg/day, but not for
adults who require about 270–400mg/day
(Food and Nutrition Board, 1989).
The milk samples analyzed were found to
contain 0.17–15.30mg of iron per 100 gram. Of
these, soya milk had the highest iron content
than the processed milk samples. Consumption
of soya milk as dietary source of iron should be
encouraged. The milk samples had zinc
contents of between 0.20 and 31 mg per 100
gram. The recommended daily allowance of
this element is 10 mg for children and 12–
15 mg for adults (FNB, 1989). Result of
analysis shows that the consumption of whole
milk provides a remarkable contribution of this
element in both adults and children, due to its
high zinc content. The copper content of the
milk samples was found to be below the
recommended daily intake. Although soya milk
had the highest copper intake, these milk
samples should not be consumed by adults or
children deficient of this element as sources of
dietary copper. The estimated safe and
adequate daily intake of manganese is 1–2mg
in children, and 2–5 mg in adults (FNB, 1989).
Results of proximate composition of
manganese range between 0.01 and 0.10 mg
per 100 gram. This shows that the milk samples
to be poor sources of this element.
The results of phytochemical screening of
soya milk as shown in Table 2 indicates the
presence of moderate concentration of
glycosides, steroids, reducing sugars, and high
concentration of terpenoids. Alkaloids,
flavonoids and tannins were found to be absent
in soya milk.
Results obtained from rat feeding studies
shows increase in body weights of rats in all
groups (Table 3). Rats fed soya milk showed a
considerable weight gain when compared with
rats fed dairy milk samples. The least weight
gain was observed in rats fed skimmed milk,
followed by rats fed whole milk. As a result,
adults who wish to control their weight, with a
significant reduction of their calorie intake
should be encouraged to consume skimmed
milk in preference to whole and flavoured milk.
Skimmed milk ability to cause the least weight
gain is due to its low calorie content (Table 1)
when compared with those of whole milk, soya
milk and flavoured milk.
From the results of hematological
investigations (Table 4), it was observed that
consumption of skimmed milk, whole milk and
flavoured milk by rats resulted in a significant
decrease in hemoglobin concentration and
packed cell volume. The hemoglobin and
packed cell volume concentrations are basic
values revealing the degree of anemia.
Although the hemoglobin concentration and
packed cell volume of rats fed soya milk were
slightly lower than the reference values, these
values were significantly higher than the values
obtained for rats fed the other milk samples.
Soya milk has been reported to be a rich source
of iron (Murray-Kolb, et al., 2003).
Consumption of soya milk as a source of
dietary iron is therefore encouraged.

Global J Res. Med. Plants & Indigen. Med. | Volume 3, Issue 11 | November 2014 | 389–401
Global Journal of Research on Medicinal Plants & Indigenous Medicine || GJRMI ||
The results of biochemical estimations are
presented in Table 5. Total protein is the sum
of albumin (60%) and globulins in the serum.
Albumin is synthesized by the liver using
dietary protein. A decrease in serum total
protein and albumin concentration was
observed in rats fed soya milk. This decrease
may be due to the soy protein not digested and
absorbed properly.
The creatinine concentration of rats in all
groups reveals normal and healthy values.
Although no significant difference (P>0.05) in
the creatinine concentration of rats in all groups
was observed, rats fed with soya milk had the
highest creatinine concentration. The effect of
the milk samples on serum creatinine did
indicate any harmful benefits on milk
consumption.
Rats fed with soya milk had the highest
urea concentration when compared to the
control group. The urea concentration of rats
fed with skimmed milk, whole milk, and
flavoured milk were slightly lower than the
value obtained from rats fed soya milk.
The bilirubin concentration of rats in each
group was with normal clinical values (Table
5). Bilirubin is formed by the breakdown of
hemoglobin in the liver, bone marrow and
spleen. An increase in plasma bilirubin results
in jaundice. Although no significant difference
was observed (P>0.05) in the bilirubin
concentration of both the test and non-test
groups, the highest direct bilirubin
concentration was observed in rats fed with
whole milk, with the control group having the
highest total bilirubin concentration. The effect
of the milk samples analysed on serum
bilirubin did not indicate the presence of
jaundice.
Enzyme assay is usually conducted to
determine the health condition of tissues
especially the liver and heart. High activities of
these enzymes in the blood are an indication of
tissue damage. No significant difference
(P>0.05) was observed in aspartate
aminotransaminase, alanine aminotransaminase
and alkaline phosphatase activities of rats in all
groups. The results indicates a slight lower
aspartate aminotransaminase activity in rats fed
skimmed and flavoured milk when compared
with the control, while rats fed soya milk and
flavoured milk had lower alanine
aminotransaminase activities as compared with
the control group. The alkaline phosphatase
activity of rats fed with skimmed milk was
higher than the control, while rats fed with
whole milk, soya milk and flavoured milk had
lower alkaline phosphatase activities when
compared with the control. The effect of the
milk samples on enzyme activities of rats in
each group revealed healthy concentrations
when with normal clinical values.
The result of lipid profile analyses is shown
in Table 7. Rats fed with skimmed milk had
the highest serum cholesterol and high density
lipoprotein cholesterol, which were within
normal clinical values. Contrary to the expected
elevated level of serum cholesterol
concentration in rats fed whole milk, a
hypocholesteremic effect was observed. Rats
fed with soya milk and flavoured milk also had
reduced cholesterol concentration when
compared with the control group. Soya milk
has been shown to decrease serum total
cholesterol level in rats (Anderson et al., 1995;
Zhan and Ho, 2005). Consumption of whole
milk, soya milk and flavoured milk did not lead
to increased concentration of high density
lipoprotein cholesterol in this study, instead, a
reduction was observed. Comparison of the
cholesterol and high density cholesterol
concentrations with normal clinical values,
revealed healthy levels in rats fed with
skimmed milk, while rats in the other groups
had lower concentrations.
Rats fed with skimmed and flavoured milk
had a higher low density lipoprotein cholesterol
concentration when compared with control,
which is between normal reference values. It is
important to note that soya milk and whole
milk consumption by rats led to a significant
lowering of serum low density lipoprotein
cholesterol.
An elevated concentration of triglycerides
was observed in rats fed skimmed and whole

Global J Res. Med. Plants & Indigen. Med. | Volume 3, Issue 11 | November 2014 | 389–401
Global Journal of Research on Medicinal Plants & Indigenous Medicine || GJRMI ||
milk when compared with the control, with
whole milk having the highest triglyceride
concentration. The least concentration was
observed in rats fed with soya milk, which
indicate that soya milk had beneficial effect on
triglyceride. Result shows that consumption of
skimmed milk, whole milk and flavoured milk
had positive effect on serum triglyceride level.
CONCLUSION
Although the highest weight gained was
observed in rats fed with soya milk, results of
lipid profile analysis revealed the health benefit
of consuming the non-dairy product. A
hypocholesteremic effect was observed in rats
fed whole milk, soya milk and flavoured milk.
The benefit of skimmed milk on weight gain
was also observed. Thus, the consumption of
skimmed milk by adults who wish to control
their weight should be encouraged, since
consumption of this milk led to the least weight
gain by rats. The effect of these milk samples
did not reveal potential harm on human health.
Consumption of soya milk over the processed
milk samples evaluated should be encouraged.
In conclusion, the hypothesis that consumption
of whole milk leads to coronary heart diseases
due to its saturated fat content was not
confirmed by this study.
RECOMMENDATION
This relatively short-term study indicates
that soya milk appears to have beneficial
advantages over the processed milk samples
studied. A longer term effect of these milk
samples, with further investigation on
flavoured milk should be evaluated.
REFERENCES
Anderson, J.W., Johnstone, B.M. and Cook-
Newell, M.E. (1995). Meta-analysis
of the effects of soy protein intake on
serum lipids. N. Engl. J. Med. 3(5):
276–282.
AOAC (1984). Association of Official
Analytical Chemists. Official Method
of Analysis. 18th
ed., Arlington, VA,
USA.
AOVC (1966). Association of Vitamin
Chemists. Methods of vitamin assay,
3rd
ed., N.Y. Int. Science Publishers.
Block, G.B., Dresser, C.M., Hartman, A. and
Carroll, M.D. (1985). Nutrient
Sources in the American diet:
quantitative data from the NHANES
II Survey.I Macronutrients and fats.
Am. J. Epidemiol 122:27–40.
Daily Reference Intakes (1998). Recommended
Intakes for individuals vitamins. Food
and Nutrition Board, Institute of
Medicine, National Academies.
Daily Reference Intakes (2001). Recommended
Intakes for individuals vitamins. Food
and Nutrition Board, Institute of
Medicine, National Academies.
Doumas, B.T., Watson, W.A. and Biggs, H.G.
(1971). Albumin standards and
measurement of serum albumin with
bromcresol green. Clin. Chim. Acta.
31:87.
Elwood, P.C., Pickering, J.E., Fehily, A.M.,
Hughes, J. and Ness, A.R. (2004).
Milk drinking, ischaemic heart
disease and ischaemic strike. I.
evidence from a Cohort studies.
Eur.J.Clin. Nutr. 58:711–717.
Fawcett, J.K. and Scott, J.E. (1960). A rapid
and precise method for the
determination of urea. J. Clin. Path.
13: 156.
FNB (1989). Recommended Dietary
Allowances. 10th
ed. Food and
Nutrition Board, National Research
Council. National Academy of
Science, United States.

Global J Res. Med. Plants & Indigen. Med. | Volume 3, Issue 11 | November 2014 | 389–401
Global Journal of Research on Medicinal Plants & Indigenous Medicine || GJRMI ||
Friedewald, W.T., Levy, R.T. and Fredickson,
D.S. (1972). Estimation of the
concentration of low density
lipoprotein cholesterol in plasma,
without use of preparative
ultracentrifuge. Clin. Chem. 18: 499–
502.
Harborne, J.B. (1973). Phytochemical method.
A guide to modern techniques for
plant analysis. Chapman and Hill,
London. Pp.182–201.
Jendrassik, L. and Grof, P. (1938). Colorimetric
method and determination of
bilirubin. Biochem. Z. 297: 81.
Jensen, R.G. (1998). Handbook of Milk
Composition. Academic Press, New
York.
Kataoka, K., Nakae, T. and Imamura, T.
(1991). Comparative studies on the
milk constituents of various mammals
in Japan. J. Dairy Sci. 20:222–232.
Klein, B., Read, P.A. and Babson, L.A. (1960).
Rapid method for quantitative
determination of serum alkaline
phosphatase. Clin. Chem. 6: 269–275.
Kristi, A.S., Mariam, T.C., Cheryl, S.,
Lawrence, H.K., McGoven, G.P.,
Potter, D.J. and William, K.Y. (1994).
Effect of consumption of whole milk
and skim milk on blood lipid profiles
in healthy men. Am. J. Clin. Nutr. 59:
612–618.
Kritchevsky, D., Shirley, A.T., Robert, B.M.,
Susanne, K.C. and David, M.K.
(1979). Influence of whole or skim
milk on cholesterol metabolism in
rats. Am. J. Clin. Nutr. 32: 597–600.
Margaret, M. (2002). Does Milk Cause
Coronary Heart Disease? J. Nutr.
Environ. Med. 12 (3): 207–216.
Miller, G.D., Jarvis, J.K. and McBean, L.D.
(1999). Handbook of Dairy Foods and
Nutrition. 2nd
ed, CRC Press.
Murray-Kolb, L.E., Welch, R., Theil, E.C. and
Beard, J.L. (2003). Women with low
iron stores absorb iron from soybeans.
Am. J. Clin. Nutr. 77:180–4.
Ness, A.R., Smith, D.G. and Hart, C. (2001).
Milk, Coronary Heart Disease and
Mortality. J. Epidemiol. 55: 379–382.
Nutritional Aspects of Cardiovascular Disease
(1994). Report of the Cardiovascular
Review Group: the Committee on
Medical Aspects of Food Policy,
London.
Pamplona-Roger, G.D. (2004). Encyclopedia of
foods and their healing power. A
guide to Food Science and Diet
Therapy. Vol.1. Editorial safeliz. pp.
183.
Ramnik, S. (1990). Medical Laboratory
Technology. JAYPEE Brothers, New
Delhi. Pp. 148–151.
Reitman, S. and Frankel, S. (1957). A
colorimetric method for the
determination of serum glutamate
oxaloacetate and pyruvate
transaminase. Am. J. Clin. Path. 28:
56.
Sacks, F.M., Lichtenstein, A., Van Horn, L.,
Harris, W., Kris-Etherton, P. and
Winston, M. (2006). Soy protein
isoflavones and cardiovascular health.
Circulation 113: 1034.
Steinmetz, K.A., Childs, M.T., Stimson, C.,
Kushi, L.H., McGovern, P.G., Potter,
J.D. and Yamanaka, W.K. (1994).
Effect of consumption of whole milk
and skim milk on blood lipid profiles
in healthy men. Am. J. Clin. Nutr. 59:
612–618.
Tietz, N.W. (1990). Clinical Guide to
Laboratory Tests, 2nd
ed. W.B.
Saunders Company, Philadelphia,
USA. Pp. 554–556.

Global J Res. Med. Plants & Indigen. Med. | Volume 3, Issue 11 | November 2014 | 389–401
Global Journal of Research on Medicinal Plants & Indigenous Medicine || GJRMI ||
Trinder, P. (1969). Enzymatic colorimetric
glucose determination. Ann. Clin.
Biochem. 6: 24–27.
United State Department of Agriculture (1976).
Agricultural Research Services.
Composition of foods. Washington,
D.C.
WHO (1996). Trace Elements in Human
Nutrition and Health. WHO,
Switzerland.
Woo, R.U., Daniels, K.R. and Houston, E.S.
(1995). Regulation of energy balance.
Ann. Rev. Nutr. 5: 411–418.
Zhan, S. and Ho, S.C. (2005). Meta-analysis of
the effects of soy protein containing
isoflavones on the lipid profile. Am. J.
Clin. Nutr. 81: 397–408.
Source of Support: NIL Conflict of Interest: None Declared


