
ISSN No IS : 2454-8782
Lac, Plant Resins and GumsStatistics 2015 : At a Glance
ICAR-Indian Institute of Natural Resins and Gums Namkum, Ranchi-834 010, Jharkhand (India)

ISSN No IS : 2454-8782
Lac, Plant Resins and GumsStatistics 2015 : At a Glance
ICAR-Indian Institute of Natural Resins and Gums Namkum, Ranchi-834 010, Jharkhand (India)
RK Yogi
Alok Kumar
AK Jaiswal
Lac, Plant Resins and Gums Statistics 2015 : At a Glance
Bulletin (Technical) No. 17/2017
April 2017
Published byDr KK SharmaDirector
Correct citation
Yogi RK, Kumar Alok and Jaiswal AK 2017. Lac, Plant Resins and Gums Statistics 2015: At a Glance. ICAR-Indian Institute of Natural Resins and Gums, Ranchi (Jharkhand), India. Bulletin (Technical) No. 17/2017. 01-72 pp.
Technical assistanceMadan Mohan DK Singh
Produced byDr MZ Siddiqui, Dr RK Yogi, Dr SS Bhat, Dr Anjesh Kumar
Cover page photographsUp to down : Row 1 - Accasia nilotia (Rajasthan) Row 2 - Sterculia urens (Jharkhand)Row 3 - Commiphora wightii (Gujarat) Watermark - Production and EXIM trend of guar gum.
ISSN No.IS-2454-8782
© ICAR-Indian Institute of Natural Resins and Gums, Namkum, RanchiPhone: 0651-2261154 (TOT Division), Fax: 0651-2260202Email:[email protected], Visit us:www.icar.org.in/iinrg/default.htm
Lac, Plant Resins and Gums Statistics 2015 : At a Glance
FOREWORDNon-Wood Forest Products (NWFPs) have for many years been seen as providing fertile ground for community development initiatives, especially those focused on rural, remote, indigenous, and/or economically marginalized communities. Production of such natural products is greatly influenced by weather vagaries and prices. Therefore, statistics of these commodities are sought by the traders, processors, exporters, importers, government officials, policy makers, researchers and others. The present publication, ‘Lac, Plant Resins and Gums Statistics 2015: At a Glance’ contains statistics on geographical distribution, production, price, processing, export and import of natural resins and gums including lac, pine resins, guar gum, gum karaya, dhawda gum, Olibanum, etc. The production of gums in important States, viz, Chhattisgarh, Madhya Pradesh, Gujarat, Rajasthan and Andhra Pradesh; production of pine resins in Uttarakhand and Himachal Pradesh; export and import of natural resins and gums is included to give a clear and comprehensive overview of the most important information in as little time as possible.
Reliable and timely availability of data and information on natural resins and gums production may be helpful to the stakeholders. Documentation of updated major production and market areas will be helpful in relation to plan their operation in time for collection and disposal of the produces. This publication is the comprehensive treatment of Natural Resins and Gums (NRGs) in India. It had a strong focus on the markets and potential markets for these products. It will be useful to private sectors who are interested in increasing their income and widening its base.
In this issue, content is presented in five major headings covering introduction; methodology; production, processing and trade; policy implications and conclusions. Information on market trend is essential for better organization of Indian producing states to meet increasing demand through better organization of their local/regional/national commercial channels from production to export, stabilization of the market with appropriate stocks, quality control of exported products and adequate support and application of price at production level. While it applies to a wide range of situations, marketing research gives decision-makers the information they need to find solutions to business problems such as how consumer satisfaction, decision, etc. Simply put, the solution to most business problems can be found through marketing research.
We believe it will contribute to the development of a sector that has huge untapped potential in an assortment of directions. I am sure that the information and data contained in this bulletin would be useful to all the stakeholders of NRG sector. Authors made every effort to distill and condence a very large and diverse topic into and approachable volume. I exalt the authors for their efforts in bringing out this bulletin. Suggestions and inputs are sought from stakeholders for improvement of this publication in future. The information used in the publication will be duly acknowledged.
Ranchi
(KK Sharma)
Director
Lac, Plant Resins and Gums Statistics 2015 : At a Glance
Acknowledgement
We thankfully acknowledge The International Trade Centre (ITC) a joint agency of the World Trade Organization and the United Nations, Genewa, Switzerland; Director General of Commercial Intelligence and Statistics, Government of India, Kolkata; Shellac and Forest Products Export Promotion Council, Kolkata; Directorate of Economics and Statistics, Ministry of Agriculture, Govt. of India; Girijan Co-operative Corporation Limited, Visakhapatnam, Government of Andhra Pradesh; Kovel Foundation, Visakhapatnam, Andhra Pradesh; Sahayog Community Coordination Network, Visakhapatnam, Andhra Pradesh; The Tribal Cooperative Marketing Development Federation of India Limited (TRIFED), New Delhi. The Jharkhand State Co-operative Lac Marketing & Procurement Federation Ltd., Ranchi, Government of Jharkhand State Agriculture Marketing Board (JHAMFCOFED), Ranchi, Jharkhand; Chhattisgarh Minor Forest Product Federation Ltd., Raipur, Government of Chhattisgarh; Madhya Pradesh State Minor Forest Product Federation Ltd., Bhopal, Government of Madhya Pradesh; Gujarat State Forest Development Corporation, Vadodara, Gujarat; Forest Department, Government of Himachal Pradesh; Forest Department, Government of Uttarakhand; Forest Department, Government of Maharashtra; various NRG based processors, traders, exporters, importers, progressive farmers, forest dwellers, officials of various Government and Non - Government Organizations and other key informants for their valuable inputs, information and data.
Lac, Plant Resins and Gums Statistics 2015 : At a Glance
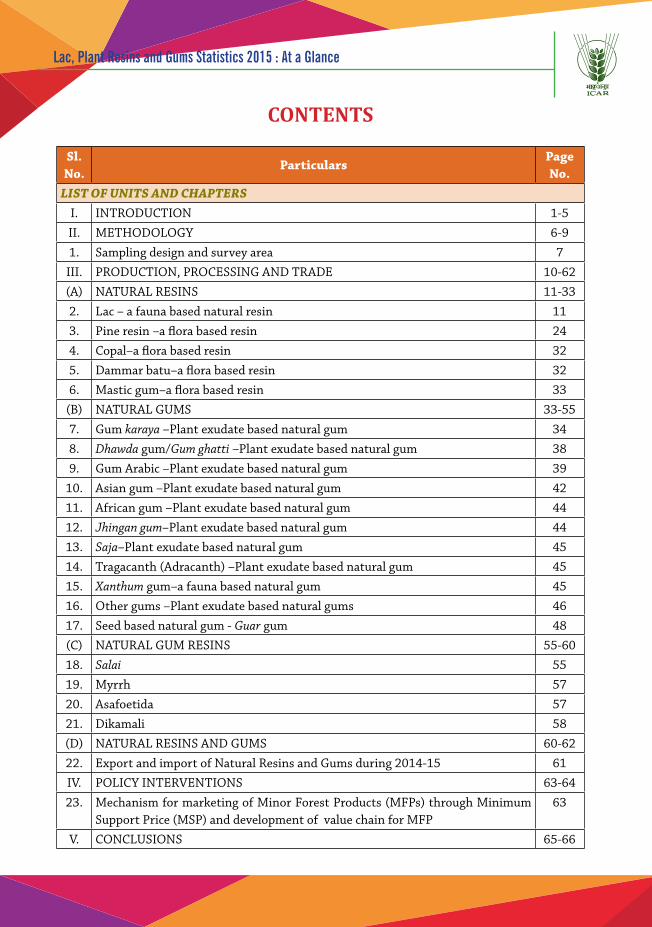
CONTENTS
Sl. No.
ParticularsPage No.
LIST OF UNITS AND CHAPTERSI. INTRODUCTION 1-5II. METHODOLOGY 6-91. Sampling design and survey area 7
III. PRODUCTION, PROCESSING AND TRADE 10-62(A) NATURAL RESINS 11-332. Lac – a fauna based natural resin 113. Pine resin –a flora based resin 244. Copal–a flora based resin 325. Dammar batu–a flora based resin 326. Mastic gum–a flora based resin 33
(B) NATURAL GUMS 33-557. Gum karaya –Plant exudate based natural gum 348. Dhawda gum/Gum ghatti –Plant exudate based natural gum 389. Gum Arabic –Plant exudate based natural gum 39
10. Asian gum –Plant exudate based natural gum 4211. African gum –Plant exudate based natural gum 4412. Jhingan gum–Plant exudate based natural gum 4413. Saja–Plant exudate based natural gum 4514. Tragacanth (Adracanth) –Plant exudate based natural gum 4515. Xanthum gum–a fauna based natural gum 4516. Other gums –Plant exudate based natural gums 4617. Seed based natural gum - Guar gum 48(C) NATURAL GUM RESINS 55-6018. Salai 5519. Myrrh 5720. Asafoetida 5721. Dikamali 58(D) NATURAL RESINS AND GUMS 60-6222. Export and import of Natural Resins and Gums during 2014-15 61IV. POLICY INTERVENTIONS 63-6423. Mechanism for marketing of Minor Forest Products (MFPs) through Minimum
Support Price (MSP) and development of value chain for MFP63
V. CONCLUSIONS 65-66
Lac, Plant Resins and Gums Statistics 2015 : At a Glance
Sl. No.
ParticularsPage No.
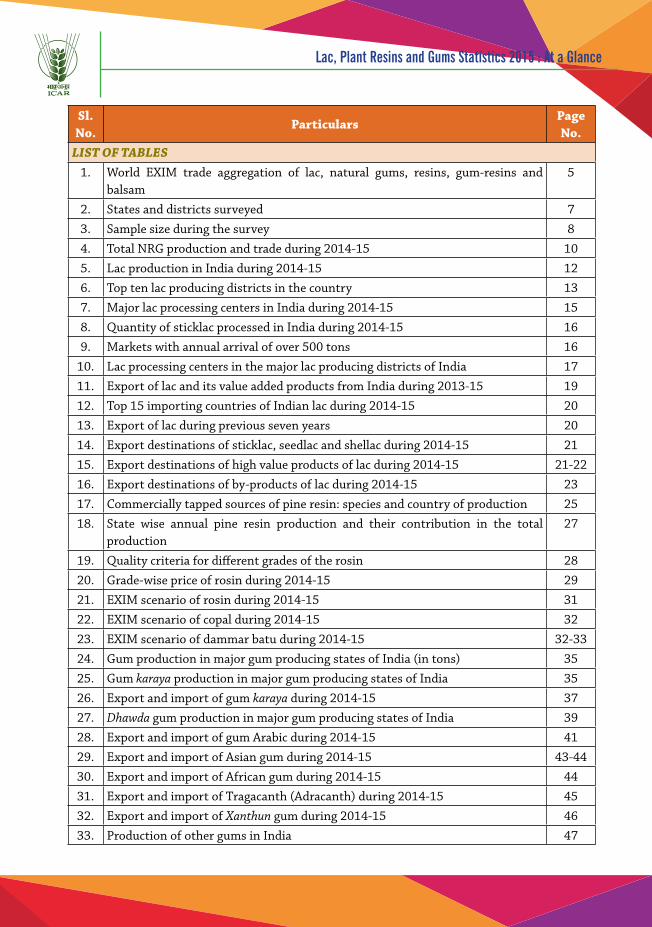
LIST OF TABLES1. World EXIM trade aggregation of lac, natural gums, resins, gum-resins and
balsam5
2. States and districts surveyed 73. Sample size during the survey 84. Total NRG production and trade during 2014-15 105. Lac production in India during 2014-15 126. Top ten lac producing districts in the country 137. Major lac processing centers in India during 2014-15 158. Quantity of sticklac processed in India during 2014-15 169. Markets with annual arrival of over 500 tons 16
10. Lac processing centers in the major lac producing districts of India 1711. Export of lac and its value added products from India during 2013-15 1912. Top 15 importing countries of Indian lac during 2014-15 2013. Export of lac during previous seven years 2014. Export destinations of sticklac, seedlac and shellac during 2014-15 2115. Export destinations of high value products of lac during 2014-15 21-2216. Export destinations of by-products of lac during 2014-15 2317. Commercially tapped sources of pine resin: species and country of production 2518. State wise annual pine resin production and their contribution in the total
production27
19. Quality criteria for different grades of the rosin 2820. Grade-wise price of rosin during 2014-15 2921. EXIM scenario of rosin during 2014-15 3122. EXIM scenario of copal during 2014-15 3223. EXIM scenario of dammar batu during 2014-15 32-3324. Gum production in major gum producing states of India (in tons) 3525. Gum karaya production in major gum producing states of India 3526. Export and import of gum karaya during 2014-15 3727. Dhawda gum production in major gum producing states of India 3928. Export and import of gum Arabic during 2014-15 4129. Export and import of Asian gum during 2014-15 43-4430. Export and import of African gum during 2014-15 4431. Export and import of Tragacanth (Adracanth) during 2014-15 4532. Export and import of Xanthun gum during 2014-15 4633. Production of other gums in India 47
Lac, Plant Resins and Gums Statistics 2015 : At a Glance
Sl. No.
ParticularsPage No.
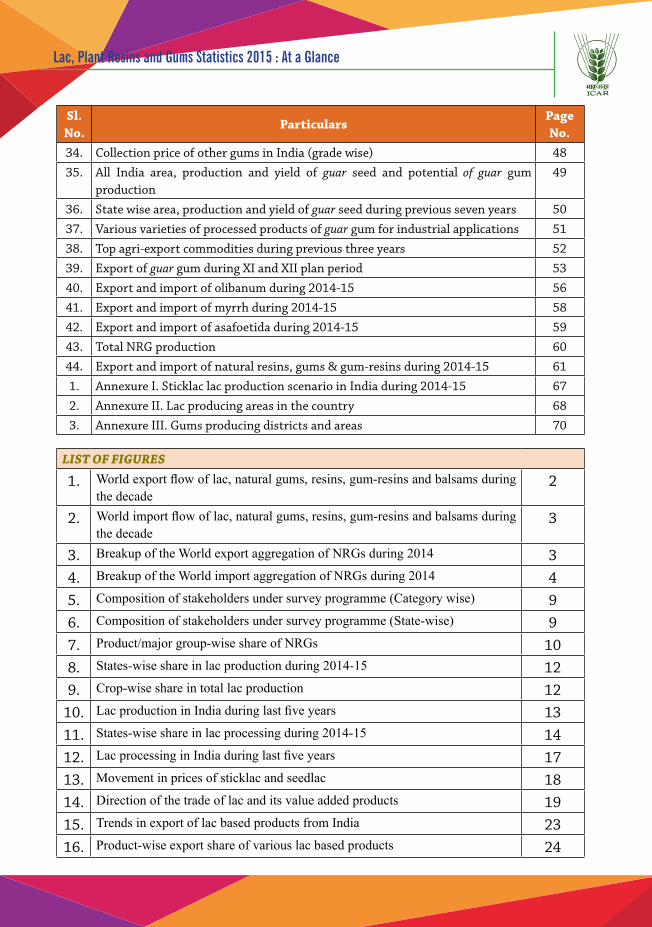
34. Collection price of other gums in India (grade wise) 4835. All India area, production and yield of guar seed and potential of guar gum
production49
36. State wise area, production and yield of guar seed during previous seven years 5037. Various varieties of processed products of guar gum for industrial applications 5138. Top agri-export commodities during previous three years 5239. Export of guar gum during XI and XII plan period 5340. Export and import of olibanum during 2014-15 5641. Export and import of myrrh during 2014-15 5842. Export and import of asafoetida during 2014-15 5943. Total NRG production 6044. Export and import of natural resins, gums & gum-resins during 2014-15 611. Annexure I. Sticklac lac production scenario in India during 2014-15 672. Annexure II. Lac producing areas in the country 683. Annexure III. Gums producing districts and areas 70
LIST OF FIGURES
1. World export flow of lac, natural gums, resins, gum-resins and balsams during the decade
2
2. World import flow of lac, natural gums, resins, gum-resins and balsams during the decade
3
3. Breakup of the World export aggregation of NRGs during 2014 34. Breakup of the World import aggregation of NRGs during 2014 45. Composition of stakeholders under survey programme (Category wise) 96. Composition of stakeholders under survey programme (State-wise) 97. Product/major group-wise share of NRGs 108. States-wise share in lac production during 2014-15 129. Crop-wise share in total lac production 12
10. Lac production in India during last five years 1311. States-wise share in lac processing during 2014-15 1412. Lac processing in India during last five years 1713. Movement in prices of sticklac and seedlac 1814. Direction of the trade of lac and its value added products 1915. Trends in export of lac based products from India 2316. Product-wise export share of various lac based products 24
Lac, Plant Resins and Gums Statistics 2015 : At a Glance
17. Pine resin production and its value in Himachal Pradesh and Uttarakhand 2618. Pine resin production in Himachal Pradesh and Uttarakhand 2719. Price pattern of various grades of Pine resin based products 2920. Destination wise scenario of rosin during 2014-15 3121. Source wise scenario of rosin during 2014-15 3122. Year wise production scenario of natural gums in India 3423. State-wise average production of gum karaya 3624. Gum karaya production in India 3725. Export of gum karaya from India 3826. Destination wise scenario of gum karaya during 2014-15 3827. Source wise scenario of gum karaya during 2014-15 3828. Year wise production scenario of gum ghatti in India 3929. Destination wise scenario of gum Arabic during 2014-15 4030. Source wise scenario of gum arabic during 2014-15 4231. Destination wise scenario of asian gum during 2014-15 4332. Total production of other gums across various states in India 4733. International price level of different grades of guar gum 5234. Trends in production potential and export of guar gum from India 5335. Composition of guar gum export from India 5436. Destination wise scenario of guar meal during 2014-15 5437. Destination wise scenario of guar gum Refined split during 2014-15 5438. Destination wise scenario of guar gum treated and pulverized during 2014-15 5439. Destination-wise quantitative share of the guar gum exported from India (Overall) 5440 Destination-wise quantitative share of the olibanum exported from India 5741. Trend in export of natural resins and gums from India during last five years 6242. Trend in import of natural resins and gums in India during last five years 621. Photo 1. Lac and its value added products 112. Photo 2. Pine resin collection using borehole method 243. Photo 3. Karaya Tree (S. urens) : Source of gum karaya 334. Photo 4. Guar plant (C. tetragonoloba ) with pods 49

1
Lac, Plant Resins and Gums Statistics 2015 : At a Glance
Along with the remarkable economic growth and industry development, India has become one of the largest producer, consumer and trader of Non-Wood Forest Products (NWFPs) in the world. This rapid development has led to substantial changes in the global picture of NWFPs trade and has drawn attention to the future demand and supply on a global scale. India is a diverse tropical (dry and wet) country of approximately 1252 million people. Forest cover is about 21.34% (FSI, 2015) of the total geographical area. Forest is an important sector having a significant contribution to the Indian economy. Forest industries contribute to 1.2% of India’s Gross Domestic Product (Economic Survey, Ministry of Finance, 2011). It is estimated that of the 6.2 billion people on the planet, 25 % depend to varying degrees on the forest resources for their livelihood with 350 million people living in or near dense forest areas and depend highly on them for their subsistence or livelihood (Killman, 2003). About 80% of the people living in developing countries depend on Non-Wood Forest Products (NWFPs), such as fruits and herbs, for their primary health and nutritional needs (FAO, 2008).
India houses 30% of the global poor, 24% of global population without access to electricity, and 92 million people without access to safe drinking water. Coupled with its vulnerability in terms of the impact of climate change, this entails that India faces formidable and complex challenges in terms of balancing the sustainable development agenda. Given the challenges it faces, it has prepared an ambitious plan in terms of clean energy, energy efficiency and lower emission intensity while addressing the critical issue of poverty and food security. The world also witnessed the adoption of the Sustainable Development Goals (SDGs) in September 2015 which replace the State of the Economy: An overview 29 Millennium Development Goals (MDGs) and set the development agenda for the next 15 years with the aim of guiding the international community and national governments on a path of sustainable development. Domestically, many initiatives have been taken by India on climate change and sustainable development. India has submitted ambitious targets in its Intended Nationally Determined Contribution (INDC) in the renewable energy sector, mainly from solar and wind energy. India’s INDC has been welcomed as fair and ambitious specifically on renewable energy and forestry sector. Out of the eight National Missions on Climate Change in India, five focus on adaptation in sectors like agriculture, water and forestry. In the June 2012 RIO+20 United Nations Conference on Sustainable Development, the UN General Assembly’s Open Working Group proposed SDGs covering a broad range of sustainable development issues, including ending poverty and hunger, improving health and education, making cities more sustainable, combating climate change and protecting oceans and forests, and were adopted by the General Assembly as part of the broader post-2015 development agenda in September 2015. The SDGs are effective from January 2016 and will end in 2030.
Indian subcontinent is a major hub of biodiversity of fauna and flora. Several forest products have significant importance in social and economic life in tropical areas. These forest products are classified into wood and Non-Wood Forest Products (NWFPs). NWFPs according to definition of FAO (1999) are ‘products of biological origin other than wood, derived from forests, shrublands and tree plantations’. These products are produced from trees, understory plants, fungi or animals and collected from forests or cultivated. Many of the NWFPs have commercial value and important contribution to the economy on local and national level. The non-wood plant species of commercial
INTRODUCTION
2
Lac, Plant Resins and Gums Statistics 2015 : At a Glance
importance worldwide are estimated to be 4000 to 6000 (FAO, 2001). NWFPs include natural resins, gums and exudates, leaves (tendu), turpentine from pines and perfumery oils from roots, stumps and fruits of various tree species. These are also natural source of spices, medicines, dyes and tannins. Most NWFPs are export currency earners and many are well suited for local small scale industries. In tribal and disadvantaged district areas of the India, NWFPs such as natural resins, gums and tamarind seeds are more profitable than timber. Despite the importance of NWFPs, the sustainable management of forests has been traditionally focused on timber production. However, in the recent decades the interest for NWFPs have been increased, as a result of the international shift to multifunctional sustainable forest management, which aims at optimizing the provision of multiple goods and services, while maintaining the equilibrium of forest ecosystems. Within this framework the promotion and utilization of NWFPs is identified as a priority area by the FAO. However, the particularities in harvesting these products distinguish their management from that of timber. For example, some NWFP have short harvesting period and products perish soon after this period. Additionally, their frequent, uncontrollable and illegal harvest may have negative effects on the forest ecosystem.
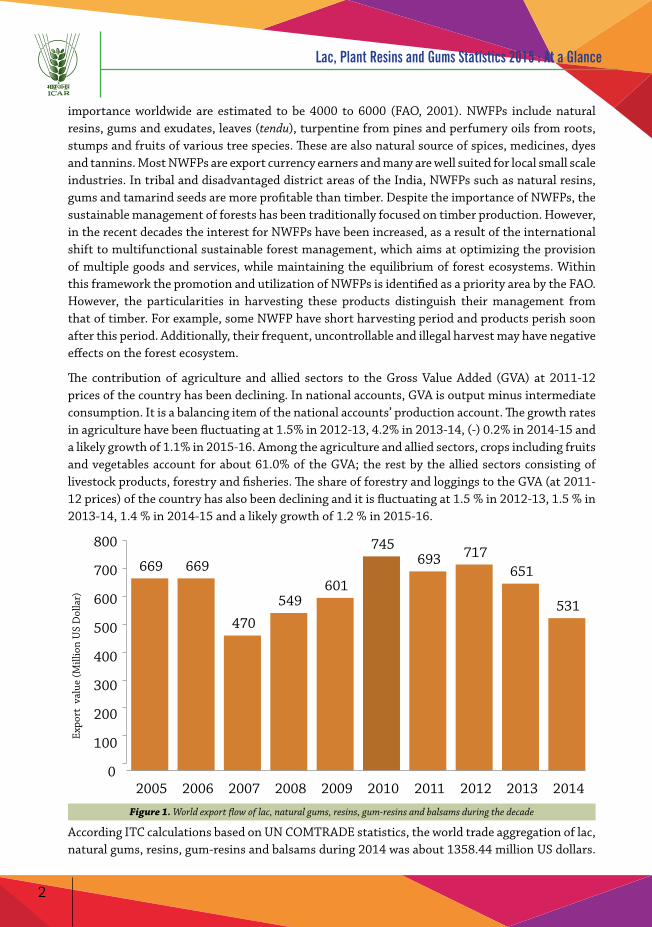
The contribution of agriculture and allied sectors to the Gross Value Added (GVA) at 2011-12 prices of the country has been declining. In national accounts, GVA is output minus intermediate consumption. It is a balancing item of the national accounts’ production account. The growth rates in agriculture have been fluctuating at 1.5% in 2012-13, 4.2% in 2013-14, (-) 0.2% in 2014-15 and a likely growth of 1.1% in 2015-16. Among the agriculture and allied sectors, crops including fruits and vegetables account for about 61.0% of the GVA; the rest by the allied sectors consisting of livestock products, forestry and fisheries. The share of forestry and loggings to the GVA (at 2011-12 prices) of the country has also been declining and it is fluctuating at 1.5 % in 2012-13, 1.5 % in 2013-14, 1.4 % in 2014-15 and a likely growth of 1.2 % in 2015-16.
669 669
470
549 601
745 693 717
651
531
0
100
200
300
400
500
600
700
800
2005 2006 2007 2008 2009 2010 2011 2012 2013 2014
Expo
rt v
alue
(Mill
ion
US
Dol
lar)
Figure 1. World export flow of lac, natural gums, resins, gum-resins and balsams during the decade
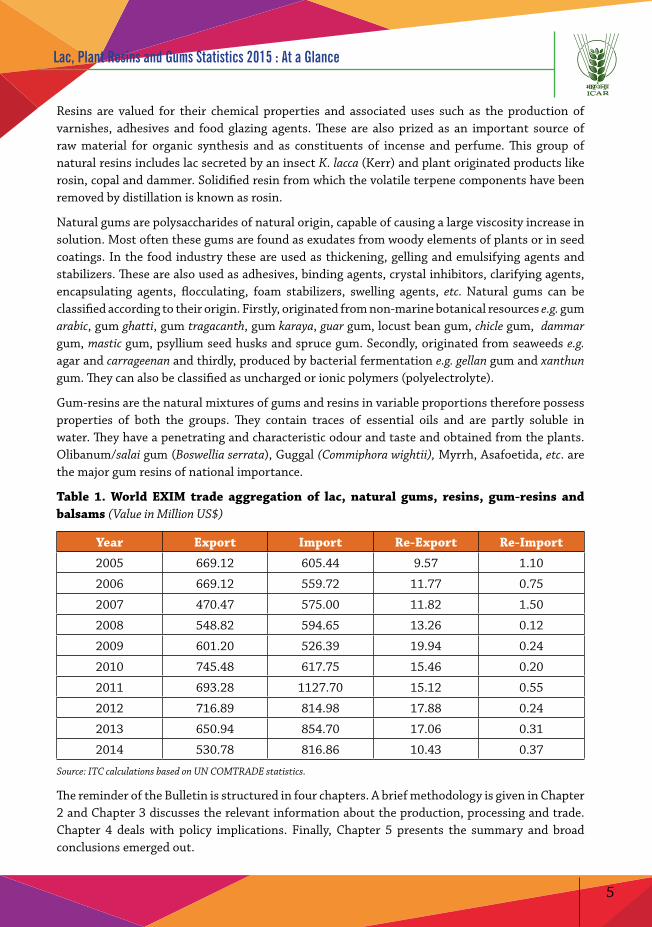
According ITC calculations based on UN COMTRADE statistics, the world trade aggregation of lac, natural gums, resins, gum-resins and balsams during 2014 was about 1358.44 million US dollars.
3
Lac, Plant Resins and Gums Statistics 2015 : At a Glance
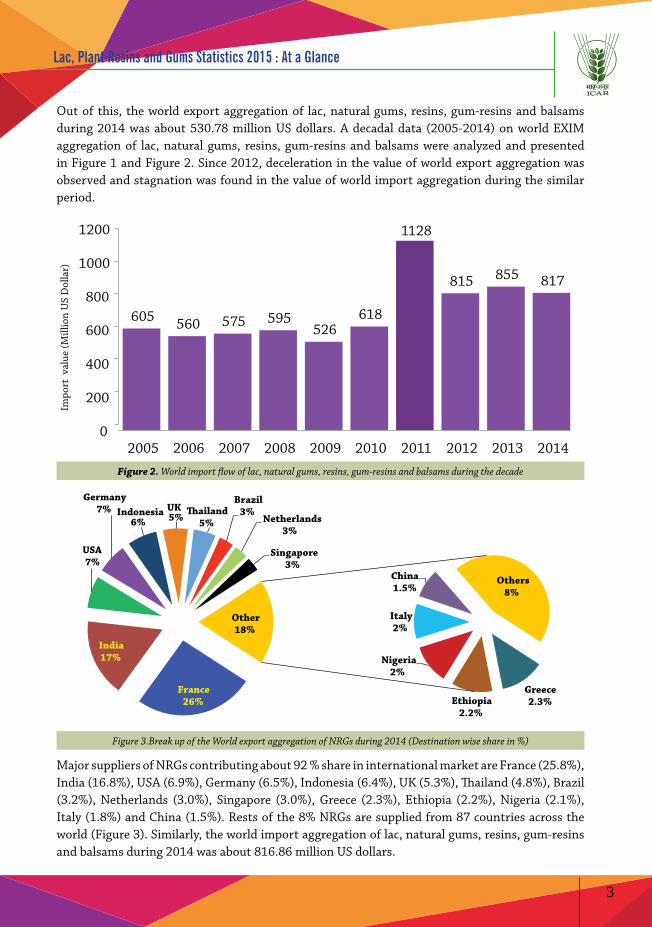
Out of this, the world export aggregation of lac, natural gums, resins, gum-resins and balsams during 2014 was about 530.78 million US dollars. A decadal data (2005-2014) on world EXIM aggregation of lac, natural gums, resins, gum-resins and balsams were analyzed and presented in Figure 1 and Figure 2. Since 2012, deceleration in the value of world export aggregation was observed and stagnation was found in the value of world import aggregation during the similar period.
605 560 575 595 526
618
1128
815 855 817
0
200
400
600
800
1000
1200
2005 2006 2007 2008 2009 2010 2011 2012 2013 2014
Impo
rt v
alue
(Mill
ion
US
Dol
lar)
Figure 2. World import flow of lac, natural gums, resins, gum-resins and balsams during the decade
France 26%
India 17%
USA 7%
Germany 7% Indonesia
6% UK 5%
�ailand 5%
Brazil 3%
Netherlands 3%
Singapore 3%
Greece 2.3% Ethiopia
2.2%
Nigeria 2%
Italy 2%
China 1.5%
Others 8%
Other 18%
Figure 3.Break up of the World export aggregation of NRGs during 2014 (Destination wise share in %)
Major suppliers of NRGs contributing about 92 % share in international market are France (25.8%), India (16.8%), USA (6.9%), Germany (6.5%), Indonesia (6.4%), UK (5.3%), Thailand (4.8%), Brazil (3.2%), Netherlands (3.0%), Singapore (3.0%), Greece (2.3%), Ethiopia (2.2%), Nigeria (2.1%), Italy (1.8%) and China (1.5%). Rests of the 8% NRGs are supplied from 87 countries across the world (Figure 3). Similarly, the world import aggregation of lac, natural gums, resins, gum-resins and balsams during 2014 was about 816.86 million US dollars.
4
Lac, Plant Resins and Gums Statistics 2015 : At a Glance
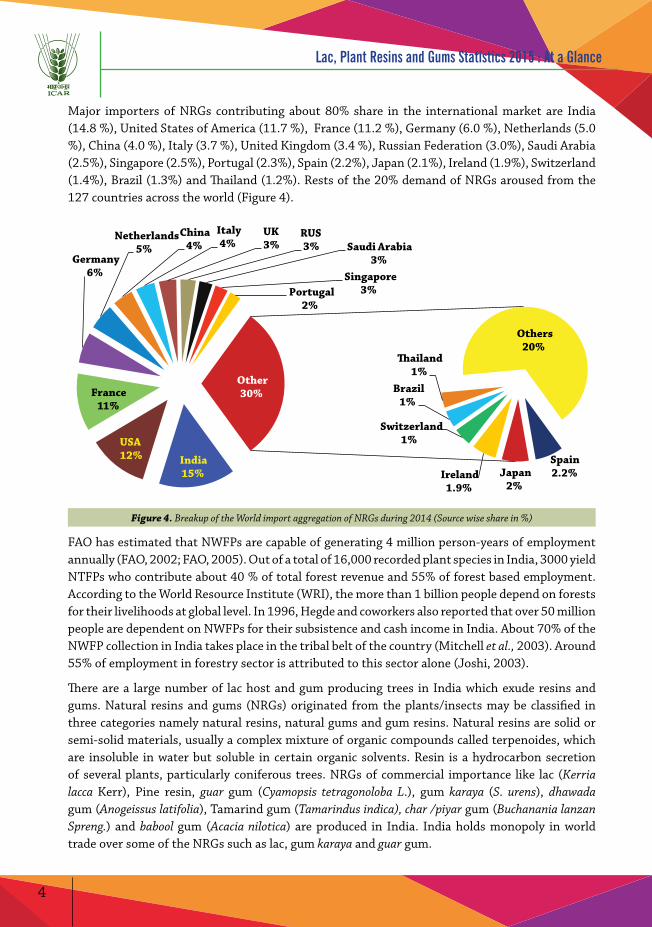
Major importers of NRGs contributing about 80% share in the international market are India (14.8 %), United States of America (11.7 %), France (11.2 %), Germany (6.0 %), Netherlands (5.0 %), China (4.0 %), Italy (3.7 %), United Kingdom (3.4 %), Russian Federation (3.0%), Saudi Arabia (2.5%), Singapore (2.5%), Portugal (2.3%), Spain (2.2%), Japan (2.1%), Ireland (1.9%), Switzerland (1.4%), Brazil (1.3%) and Thailand (1.2%). Rests of the 20% demand of NRGs aroused from the 127 countries across the world (Figure 4).
India 15%
USA 12%
France 11%
Germany 6%
Netherlands 5%
China 4%
Italy 4%
UK 3%
RUS 3% Saudi Arabia
3% Singapore
3% Portugal 2%
Spain 2.2% Japan
2% Ireland 1.9%
Switzerland 1%
Brazil 1%
�ailand 1%
Others 20%
Other 30%
Figure 4. Breakup of the World import aggregation of NRGs during 2014 (Source wise share in %)
FAO has estimated that NWFPs are capable of generating 4 million person-years of employment annually (FAO, 2002; FAO, 2005). Out of a total of 16,000 recorded plant species in India, 3000 yield NTFPs who contribute about 40 % of total forest revenue and 55% of forest based employment. According to the World Resource Institute (WRI), the more than 1 billion people depend on forests for their livelihoods at global level. In 1996, Hegde and coworkers also reported that over 50 million people are dependent on NWFPs for their subsistence and cash income in India. About 70% of the NWFP collection in India takes place in the tribal belt of the country (Mitchell et al., 2003). Around 55% of employment in forestry sector is attributed to this sector alone (Joshi, 2003).
There are a large number of lac host and gum producing trees in India which exude resins and gums. Natural resins and gums (NRGs) originated from the plants/insects may be classified in three categories namely natural resins, natural gums and gum resins. Natural resins are solid or semi-solid materials, usually a complex mixture of organic compounds called terpenoides, which are insoluble in water but soluble in certain organic solvents. Resin is a hydrocarbon secretion of several plants, particularly coniferous trees. NRGs of commercial importance like lac (Kerria lacca Kerr), Pine resin, guar gum (Cyamopsis tetragonoloba L.), gum karaya (S. urens), dhawada gum (Anogeissus latifolia), Tamarind gum (Tamarindus indica), char /piyar gum (Buchanania lanzan Spreng.) and babool gum (Acacia nilotica) are produced in India. India holds monopoly in world trade over some of the NRGs such as lac, gum karaya and guar gum.
5
Lac, Plant Resins and Gums Statistics 2015 : At a Glance
Resins are valued for their chemical properties and associated uses such as the production of varnishes, adhesives and food glazing agents. These are also prized as an important source of raw material for organic synthesis and as constituents of incense and perfume. This group of natural resins includes lac secreted by an insect K. lacca (Kerr) and plant originated products like rosin, copal and dammer. Solidified resin from which the volatile terpene components have been removed by distillation is known as rosin.
Natural gums are polysaccharides of natural origin, capable of causing a large viscosity increase in solution. Most often these gums are found as exudates from woody elements of plants or in seed coatings. In the food industry these are used as thickening, gelling and emulsifying agents and stabilizers. These are also used as adhesives, binding agents, crystal inhibitors, clarifying agents, encapsulating agents, flocculating, foam stabilizers, swelling agents, etc. Natural gums can be classified according to their origin. Firstly, originated from non-marine botanical resources e.g. gum arabic, gum ghatti, gum tragacanth, gum karaya, guar gum, locust bean gum, chicle gum, dammar gum, mastic gum, psyllium seed husks and spruce gum. Secondly, originated from seaweeds e.g. agar and carrageenan and thirdly, produced by bacterial fermentation e.g. gellan gum and xanthun gum. They can also be classified as uncharged or ionic polymers (polyelectrolyte).
Gum-resins are the natural mixtures of gums and resins in variable proportions therefore possess properties of both the groups. They contain traces of essential oils and are partly soluble in water. They have a penetrating and characteristic odour and taste and obtained from the plants. Olibanum/salai gum (Boswellia serrata), Guggal (Commiphora wightii), Myrrh, Asafoetida, etc. are the major gum resins of national importance.
Table 1. World EXIM trade aggregation of lac, natural gums, resins, gum-resins and balsams (Value in Million US$)
Year Export Import Re-Export Re-Import
2005 669.12 605.44 9.57 1.10
2006 669.12 559.72 11.77 0.75
2007 470.47 575.00 11.82 1.50
2008 548.82 594.65 13.26 0.12
2009 601.20 526.39 19.94 0.24
2010 745.48 617.75 15.46 0.20
2011 693.28 1127.70 15.12 0.55
2012 716.89 814.98 17.88 0.24
2013 650.94 854.70 17.06 0.31
2014 530.78 816.86 10.43 0.37
Source: ITC calculations based on UN COMTRADE statistics.
The reminder of the Bulletin is structured in four chapters. A brief methodology is given in Chapter 2 and Chapter 3 discusses the relevant information about the production, processing and trade. Chapter 4 deals with policy implications. Finally, Chapter 5 presents the summary and broad conclusions emerged out.
6
Lac, Plant Resins and Gums Statistics 2015 : At a Glance
METHODOLOGY
Reliable and periodical assessments of quantities and values of production and market outlook studies at the national level of Non-Wood Forest Products (NWFPs) are essential to decision-makers for policy formulation and governing the sustainable development of the sector. Appropriate and biometrically valid inventories of NWFPs are an essential prerequisite for their sustainable management and harvesting. However, methodologies for the precise assessment of forest resources yielding NWFPs are not yet sufficiently elaborated, neither can they be easily implemented by resource managers in the field. Timely and accurate estimation of production may be helpful for the stakeholders to plan their operations in time. Accuracy in production estimate would be useful in precision planning by all concerned. Besides knowing the present status, it would be helpful in regulating imports, planning for enhanced exports, reasonable prices and reliability in supply of lac based products. However, such statistics do not yet exist for many countries, neither is the already available data comparable among countries. In most countries, the current coverage and quality of existing information is inadequate for policy analysis and decision making at national level.
FAO currently assists national governments and institutions to improve the availability of national qualitative and quantitative data related to NWFPs. These efforts include: the development of a standard framework that describes the key information required for the evaluation of NWFPs utilization at the country level; the improvement and elaboration of methodologies for the collection and validation of the required information including more precise product nomenclature and corresponding product classification; and the compilation of standardized national reporting formats on NWFPs. From the lessons learned by implementing this national survey, specific case studies to improve NRGs data gathering methodologies are being carried out in selected states (Jharkhand, West Bengal, Chhattisgarh and Madhya Pradesh). Hence, under the research project “Market research for production and marketing of natural resins and gums” a standard reporting format has been developed to assist in recording statistics on the production and trade of major NRGs. This approach was used in order to compile NRGs state profiles for all states of India. A brief summary of the assessment is also being published annually as a separate chapter in the Agricultural Research Data Book, ICAR-IASRI, New Delhi.
The objectives of present methodology are to estimate and update the production, processing and value addition of NRGs at national level and to compile the latest EXIM data. The approach used in the present methodology was through survey of local traders and processors, as all NRGs produced in India are collected/procured through the local traders/societies/forest departments.
Big traders/federations are limited in number but they have close contact with the primary purchaser who have knowledge of present crop condition and expected output. Survey of all big traders was helpful in estimation. Further, all the produced products pass through the processing units. Processors use the current harvested or stocked or imported crop/produce. Survey of processing units was helpful in estimating quantity of processed products at national level and validation of production data. Information on market arrival during seasons at important markets in India was collected through survey of identified major markets. Regular contacts were also made with the persons/ organizations related to NRGs in India through correspondence, phone
7
Lac, Plant Resins and Gums Statistics 2015 : At a Glance
and personal visit for collection and updating of data. Production estimation was made by the survey of selected processors, exporters, importers and markets (traders). Export and import NRGs related products were obtained from Directorate General of Commercial Intelligence and Statistics (DGCI&S), Kolkata. Five schedules / questionnaire were framed for collection of data and information during the field surveys i.e. survey of markets, survey of processing centers, crop-wise arrival in the market, survey of importers and processing at processing centers. Production year was considered from April to March (Financial year) and final production assessment completed by the month of April. Data and other related information for estimation of production and processing was collected throughout the year. Tabular analysis and pictorial presentation has been used to analyze the survey data. Validation of production data at national level was made by secondary data on quantity processed at national level, export and import figures.
Sampling design and survey area
It’s been said that information is power. This simple cliché underscores the market control and business success that information yields. Marketing research is about collecting information. While it applies to a wide range of situations, marketing research gives decision-makers the information they need to find solutions to business problems such as consumer satisfaction, decision, representation and response to completion, etc. Simply put, the solution to most business problems can be found through marketing research. National level information and data on NRGs were collected from primary and secondary sources. Survey was made in various NRG producing areas of the country for collection of data throughout the year during 2014-15. The requisite data has been collected from respondents at various NRGs markets and processing centers. For updating the information and data, regular telephonic contacts were also made with the respondents.
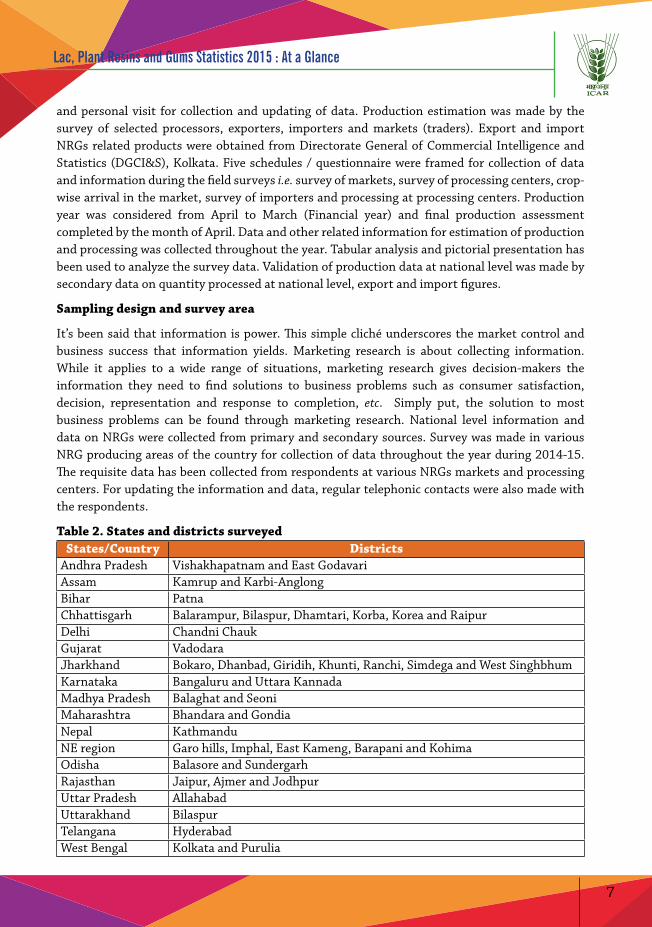
Table 2. States and districts surveyedStates/Country Districts
Andhra Pradesh Vishakhapatnam and East GodavariAssam Kamrup and Karbi-Anglong Bihar PatnaChhattisgarh Balarampur, Bilaspur, Dhamtari, Korba, Korea and Raipur Delhi Chandni ChaukGujarat Vadodara Jharkhand Bokaro, Dhanbad, Giridih, Khunti, Ranchi, Simdega and West SinghbhumKarnataka Bangaluru and Uttara KannadaMadhya Pradesh Balaghat and Seoni Maharashtra Bhandara and GondiaNepal KathmanduNE region Garo hills, Imphal, East Kameng, Barapani and Kohima Odisha Balasore and Sundergarh Rajasthan Jaipur, Ajmer and JodhpurUttar Pradesh AllahabadUttarakhand BilaspurTelangana HyderabadWest Bengal Kolkata and Purulia
8
Lac, Plant Resins and Gums Statistics 2015 : At a Glance
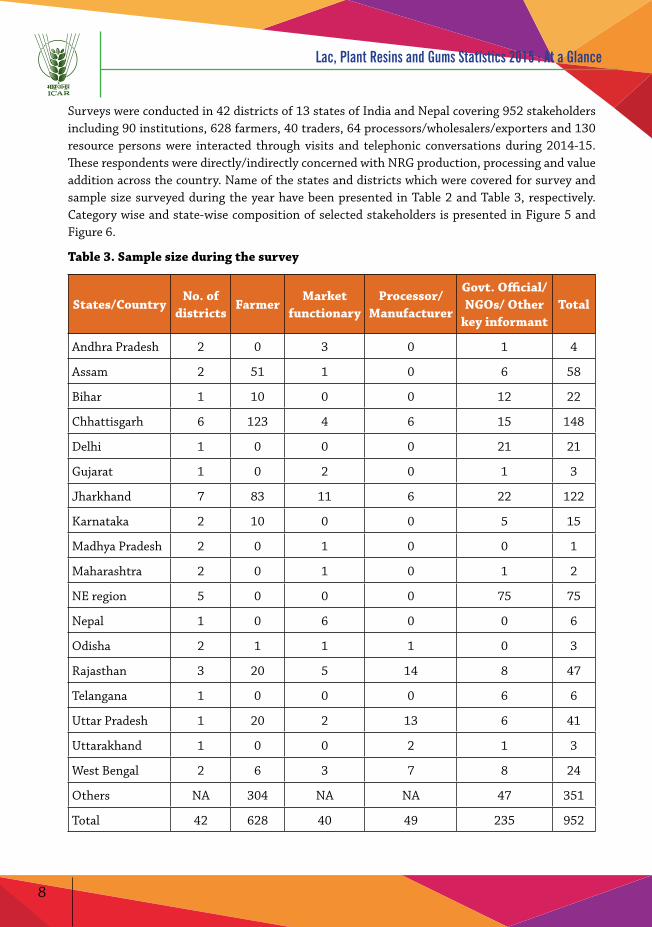
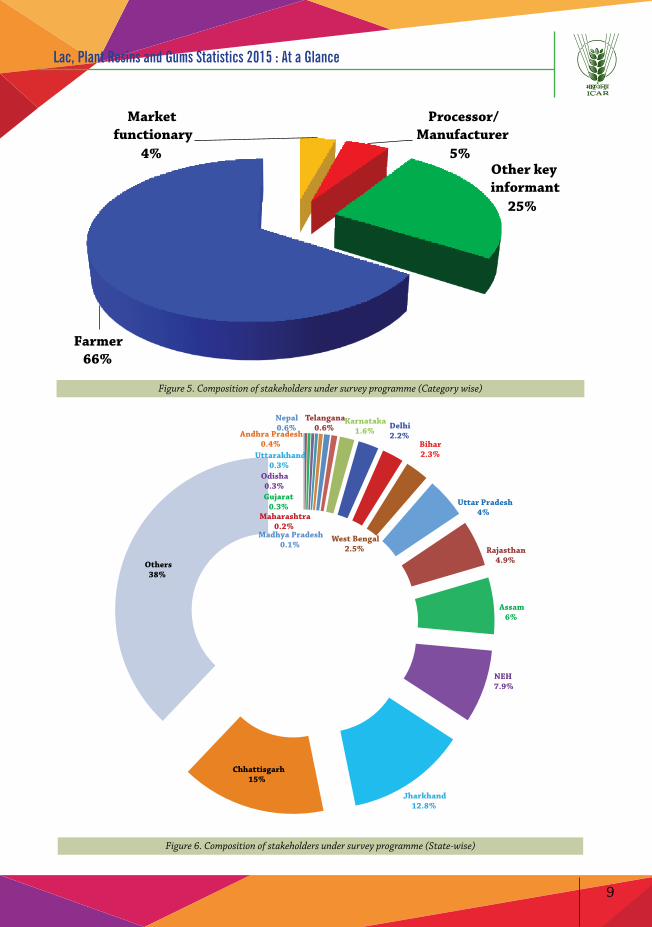
Surveys were conducted in 42 districts of 13 states of India and Nepal covering 952 stakeholders including 90 institutions, 628 farmers, 40 traders, 64 processors/wholesalers/exporters and 130 resource persons were interacted through visits and telephonic conversations during 2014-15. These respondents were directly/indirectly concerned with NRG production, processing and value addition across the country. Name of the states and districts which were covered for survey and sample size surveyed during the year have been presented in Table 2 and Table 3, respectively. Category wise and state-wise composition of selected stakeholders is presented in Figure 5 and Figure 6.
Table 3. Sample size during the survey
States/CountryNo. of
districts Farmer
Market functionary
Processor/Manufacturer
Govt. Official/ NGOs/ Other
key informantTotal
Andhra Pradesh 2 0 3 0 1 4
Assam 2 51 1 0 6 58
Bihar 1 10 0 0 12 22
Chhattisgarh 6 123 4 6 15 148
Delhi 1 0 0 0 21 21
Gujarat 1 0 2 0 1 3
Jharkhand 7 83 11 6 22 122
Karnataka 2 10 0 0 5 15
Madhya Pradesh 2 0 1 0 0 1
Maharashtra 2 0 1 0 1 2
NE region 5 0 0 0 75 75
Nepal 1 0 6 0 0 6
Odisha 2 1 1 1 0 3
Rajasthan 3 20 5 14 8 47
Telangana 1 0 0 0 6 6
Uttar Pradesh 1 20 2 13 6 41
Uttarakhand 1 0 0 2 1 3
West Bengal 2 6 3 7 8 24
Others NA 304 NA NA 47 351
Total 42 628 40 49 235 952
9
Lac, Plant Resins and Gums Statistics 2015 : At a Glance
Market functionary
4%
Processor/ Manufacturer
5% Other key informant
25%
Farmer 66%
Figure 5. Composition of stakeholders under survey programme (Category wise)
Madhya Pradesh 0.1%
Maharashtra 0.2%
Gujarat 0.3%
Odisha 0.3%
Uttarakhand 0.3%
Andhra Pradesh 0.4%
Nepal 0.6%
Telangana 0.6%
Karnataka 1.6% Delhi
2.2% Bihar 2.3%
West Bengal 2.5%
Uttar Pradesh 4%
Rajasthan 4.9%
Assam 6%
NEH 7.9%
Jharkhand 12.8%
Chhattisgarh 15%
Others 38%
Figure 6. Composition of stakeholders under survey programme (State-wise)
10
Lac, Plant Resins and Gums Statistics 2015 : At a Glance
PRODUCTION, PROCESSING AND TRADE IN NRGs
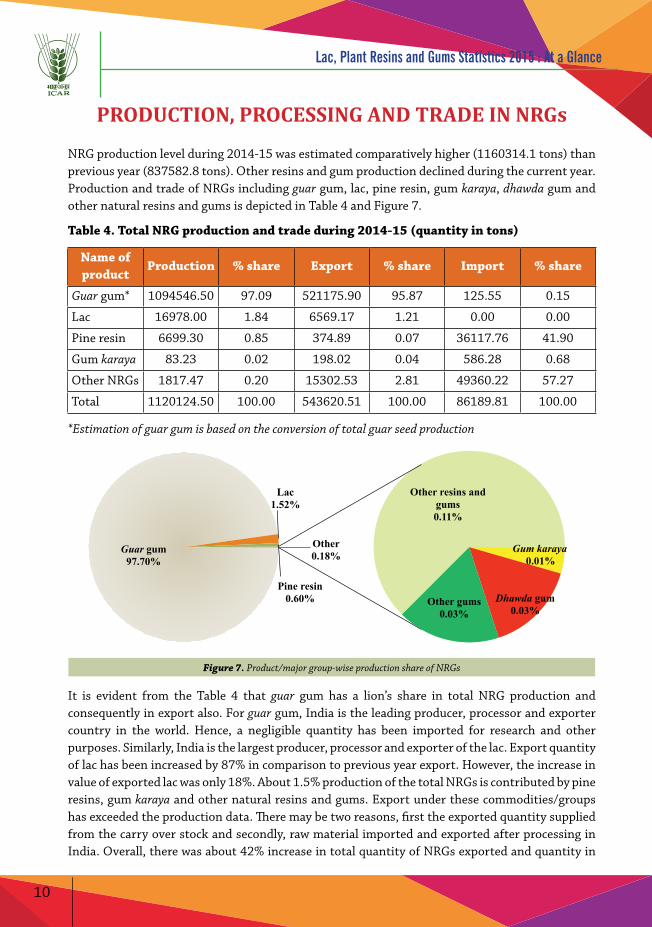
NRG production level during 2014-15 was estimated comparatively higher (1160314.1 tons) than previous year (837582.8 tons). Other resins and gum production declined during the current year. Production and trade of NRGs including guar gum, lac, pine resin, gum karaya, dhawda gum and other natural resins and gums is depicted in Table 4 and Figure 7.
Table 4. Total NRG production and trade during 2014-15 (quantity in tons)
Name of product
Production % share Export % share Import % share
Guar gum* 1094546.50 97.09 521175.90 95.87 125.55 0.15
Lac 16978.00 1.84 6569.17 1.21 0.00 0.00
Pine resin 6699.30 0.85 374.89 0.07 36117.76 41.90
Gum karaya 83.23 0.02 198.02 0.04 586.28 0.68
Other NRGs 1817.47 0.20 15302.53 2.81 49360.22 57.27
Total 1120124.50 100.00 543620.51 100.00 86189.81 100.00
*Estimation of guar gum is based on the conversion of total guar seed production
Guar gum 97.70%
Lac 1.52%
Pine resin 0.60%
Gum karaya0.01%
Dhawda gum 0.03%
Other gums 0.03%
Other resins and gums 0.11%
Other 0.18%
Figure 7. Product/major group-wise production share of NRGs
It is evident from the Table 4 that guar gum has a lion’s share in total NRG production and consequently in export also. For guar gum, India is the leading producer, processor and exporter country in the world. Hence, a negligible quantity has been imported for research and other purposes. Similarly, India is the largest producer, processor and exporter of the lac. Export quantity of lac has been increased by 87% in comparison to previous year export. However, the increase in value of exported lac was only 18%. About 1.5% production of the total NRGs is contributed by pine resins, gum karaya and other natural resins and gums. Export under these commodities/groups has exceeded the production data. There may be two reasons, first the exported quantity supplied from the carry over stock and secondly, raw material imported and exported after processing in India. Overall, there was about 42% increase in total quantity of NRGs exported and quantity in
11
Lac, Plant Resins and Gums Statistics 2015 : At a Glance
import basket was almost stable. But, price fall of guar gum in international market resulted with a decline in total foreign exchange earnings as comparison to 2012-13 and 2013-14. The detailed information about state-wise production processing and trade of natural resins (Lac, pine resin), natural gums (Gum karaya, guar gum, gum ghatti, gum arabic ) and natural gum resins (Olibanum, myrrh, asafoetida) is presented below.
A) Natural resins
Lac – a fauna based natural resin
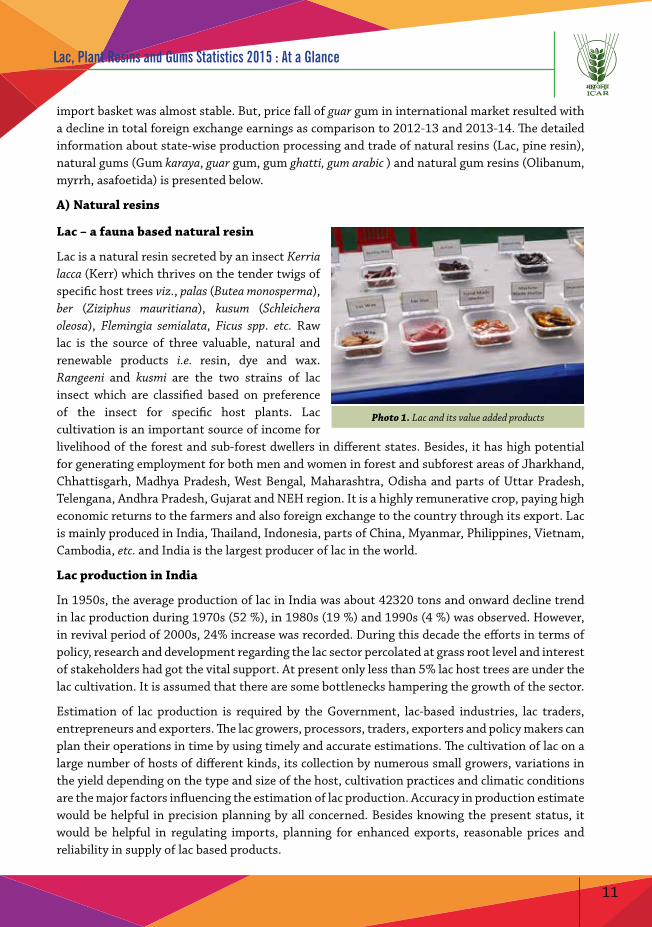
Lac is a natural resin secreted by an insect Kerria lacca (Kerr) which thrives on the tender twigs of specific host trees viz., palas (Butea monosperma), ber (Ziziphus mauritiana), kusum (Schleichera oleosa), Flemingia semialata, Ficus spp. etc. Raw lac is the source of three valuable, natural and renewable products i.e. resin, dye and wax. Rangeeni and kusmi are the two strains of lac insect which are classified based on preference of the insect for specific host plants. Lac cultivation is an important source of income for livelihood of the forest and sub-forest dwellers in different states. Besides, it has high potential for generating employment for both men and women in forest and subforest areas of Jharkhand, Chhattisgarh, Madhya Pradesh, West Bengal, Maharashtra, Odisha and parts of Uttar Pradesh, Telengana, Andhra Pradesh, Gujarat and NEH region. It is a highly remunerative crop, paying high economic returns to the farmers and also foreign exchange to the country through its export. Lac is mainly produced in India, Thailand, Indonesia, parts of China, Myanmar, Philippines, Vietnam, Cambodia, etc. and India is the largest producer of lac in the world.
Lac production in India
In 1950s, the average production of lac in India was about 42320 tons and onward decline trend in lac production during 1970s (52 %), in 1980s (19 %) and 1990s (4 %) was observed. However, in revival period of 2000s, 24% increase was recorded. During this decade the efforts in terms of policy, research and development regarding the lac sector percolated at grass root level and interest of stakeholders had got the vital support. At present only less than 5% lac host trees are under the lac cultivation. It is assumed that there are some bottlenecks hampering the growth of the sector.
Estimation of lac production is required by the Government, lac-based industries, lac traders, entrepreneurs and exporters. The lac growers, processors, traders, exporters and policy makers can plan their operations in time by using timely and accurate estimations. The cultivation of lac on a large number of hosts of different kinds, its collection by numerous small growers, variations in the yield depending on the type and size of the host, cultivation practices and climatic conditions are the major factors influencing the estimation of lac production. Accuracy in production estimate would be helpful in precision planning by all concerned. Besides knowing the present status, it would be helpful in regulating imports, planning for enhanced exports, reasonable prices and reliability in supply of lac based products.
Photo 1. Lac and its value added products
12
Lac, Plant Resins and Gums Statistics 2015 : At a Glance
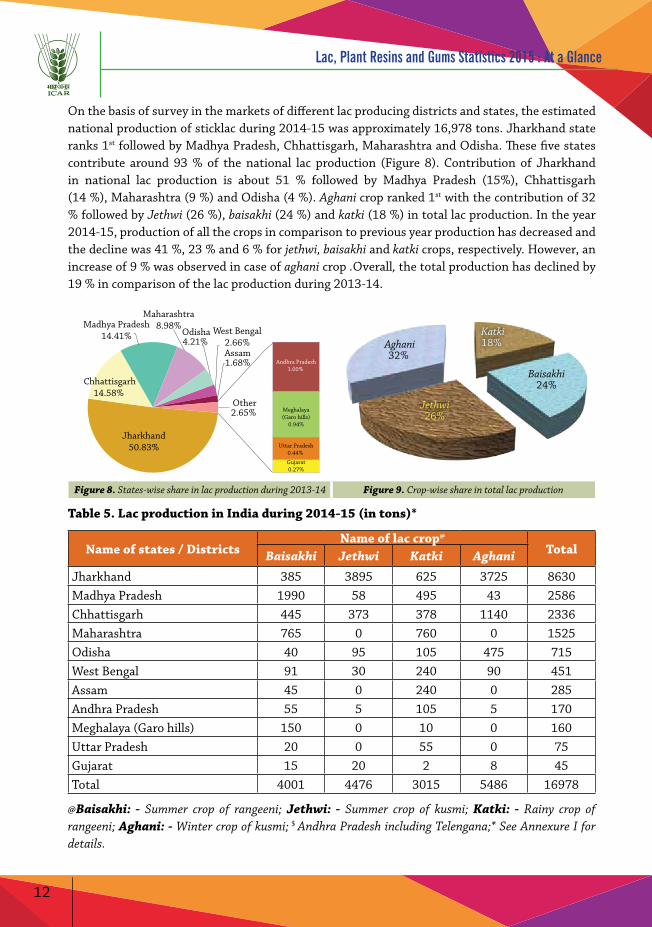
On the basis of survey in the markets of different lac producing districts and states, the estimated national production of sticklac during 2014-15 was approximately 16,978 tons. Jharkhand state ranks 1st followed by Madhya Pradesh, Chhattisgarh, Maharashtra and Odisha. These five states contribute around 93 % of the national lac production (Figure 8). Contribution of Jharkhand in national lac production is about 51 % followed by Madhya Pradesh (15%), Chhattisgarh (14 %), Maharashtra (9 %) and Odisha (4 %). Aghani crop ranked 1st with the contribution of 32 % followed by Jethwi (26 %), baisakhi (24 %) and katki (18 %) in total lac production. In the year 2014-15, production of all the crops in comparison to previous year production has decreased and the decline was 41 %, 23 % and 6 % for jethwi, baisakhi and katki crops, respectively. However, an increase of 9 % was observed in case of aghani crop .Overall, the total production has declined by 19 % in comparison of the lac production during 2013-14.
Jharkhand50.83%
Chhattisgarh14.58%
Madhya Pradesh14.41%
Maharashtra8.98%
Odisha4.21%
West Bengal2.66%Assam1.68% Andhra Pradesh
1.00%
Meghalaya(Garo hills)
0.94%
Uttar Pradesh0.44%
Gujarat0.27%
Other2.65%
Katki18%
Baisakhi24%
Jethwi26%
Aghani32%
Figure 8. States-wise share in lac production during 2013-14 Figure 9. Crop-wise share in total lac production
Table 5. Lac production in India during 2014-15 (in tons)*
Name of states / Districts Name of lac crop@
TotalBaisakhi Jethwi Katki Aghani
Jharkhand 385 3895 625 3725 8630Madhya Pradesh 1990 58 495 43 2586Chhattisgarh 445 373 378 1140 2336Maharashtra 765 0 760 0 1525Odisha 40 95 105 475 715West Bengal 91 30 240 90 451Assam 45 0 240 0 285Andhra Pradesh 55 5 105 5 170Meghalaya (Garo hills) 150 0 10 0 160Uttar Pradesh 20 0 55 0 75Gujarat 15 20 2 8 45Total 4001 4476 3015 5486 16978
@Baisakhi: - Summer crop of rangeeni; Jethwi: - Summer crop of kusmi; Katki: - Rainy crop of rangeeni; Aghani: - Winter crop of kusmi; $ Andhra Pradesh including Telengana;* See Annexure I for details.
13
Lac, Plant Resins and Gums Statistics 2015 : At a Glance
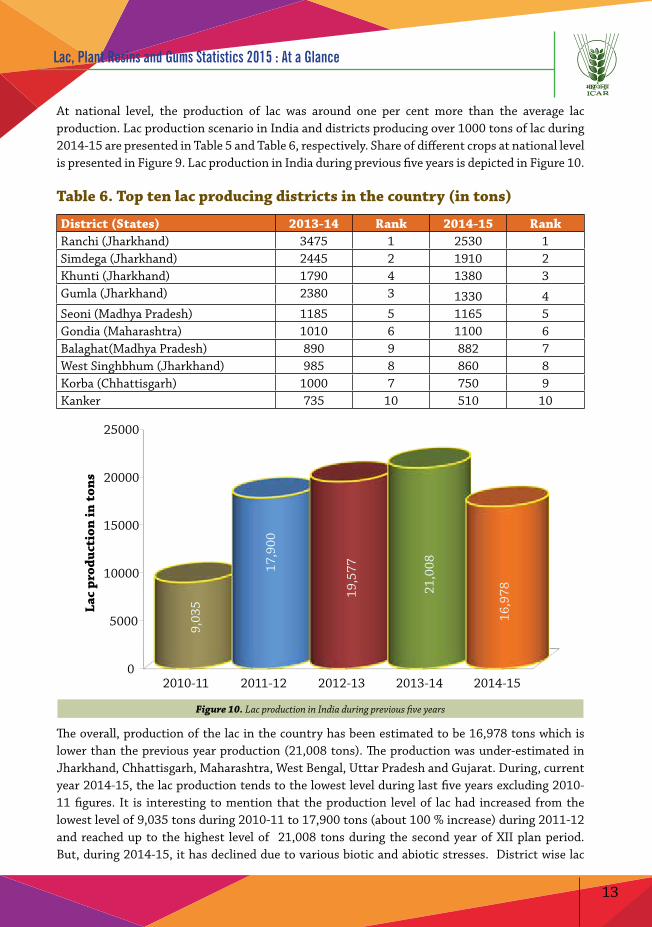
At national level, the production of lac was around one per cent more than the average lac production. Lac production scenario in India and districts producing over 1000 tons of lac during 2014-15 are presented in Table 5 and Table 6, respectively. Share of different crops at national level is presented in Figure 9. Lac production in India during previous five years is depicted in Figure 10.
Table 6. Top ten lac producing districts in the country (in tons)
District (States) 2013-14 Rank 2014-15 RankRanchi (Jharkhand) 3475 1 2530 1Simdega (Jharkhand) 2445 2 1910 2Khunti (Jharkhand) 1790 4 1380 3Gumla (Jharkhand) 2380 3 1330 4Seoni (Madhya Pradesh) 1185 5 1165 5Gondia (Maharashtra) 1010 6 1100 6Balaghat(Madhya Pradesh) 890 9 882 7West Singhbhum (Jharkhand) 985 8 860 8Korba (Chhattisgarh) 1000 7 750 9Kanker 735 10 510 10
0
5000
10000
15000
20000
25000
2010-11 2011-12 2012-13 2013-14 2014-15
9,03
5
17,9
00
19,5
77
21,0
08
16,9
78
Lac
prod
ucti
on in
ton
s
Figure 10. Lac production in India during previous five years
The overall, production of the lac in the country has been estimated to be 16,978 tons which is lower than the previous year production (21,008 tons). The production was under-estimated in Jharkhand, Chhattisgarh, Maharashtra, West Bengal, Uttar Pradesh and Gujarat. During, current year 2014-15, the lac production tends to the lowest level during last five years excluding 2010-11 figures. It is interesting to mention that the production level of lac had increased from the lowest level of 9,035 tons during 2010-11 to 17,900 tons (about 100 % increase) during 2011-12 and reached up to the highest level of 21,008 tons during the second year of XII plan period. But, during 2014-15, it has declined due to various biotic and abiotic stresses. District wise lac
14
Lac, Plant Resins and Gums Statistics 2015 : At a Glance
production statistics and major lac producing areas in the country are presented in Annexure I and Annexure II, respectively.
Lac processing and value addition in India
Sticklac in small quantity or lots is generally sold in the rural markets (haats) by the lac growers. Rural markets (haat) in remote lac growing areas operate once or twice in a week. Lac growers, after harvesting sticklac sell to paikars (primary purchasers). Lac growers, nearer to lac processing units, also sell their produce directly to processing units. The paikars after collecting, whatever quantity they get in the course of the market day, sell it to the wholesaler in the same market or nearby manufacturing centers in bigger lots. Simultaneously, the wholesalers sell the produce to manufacturers at different lac processing centers. After processing, lac is sold for internal consumption within the country or exported by lac exporters.
West Bengal 44%
Jharkhand 28%
Chhattisgarh 16%
Maharashtra 10%
Others 1%
Madhya Pradesh 1%
Other 2%
Figure 11. States-wise share in lac processing during 2014-15
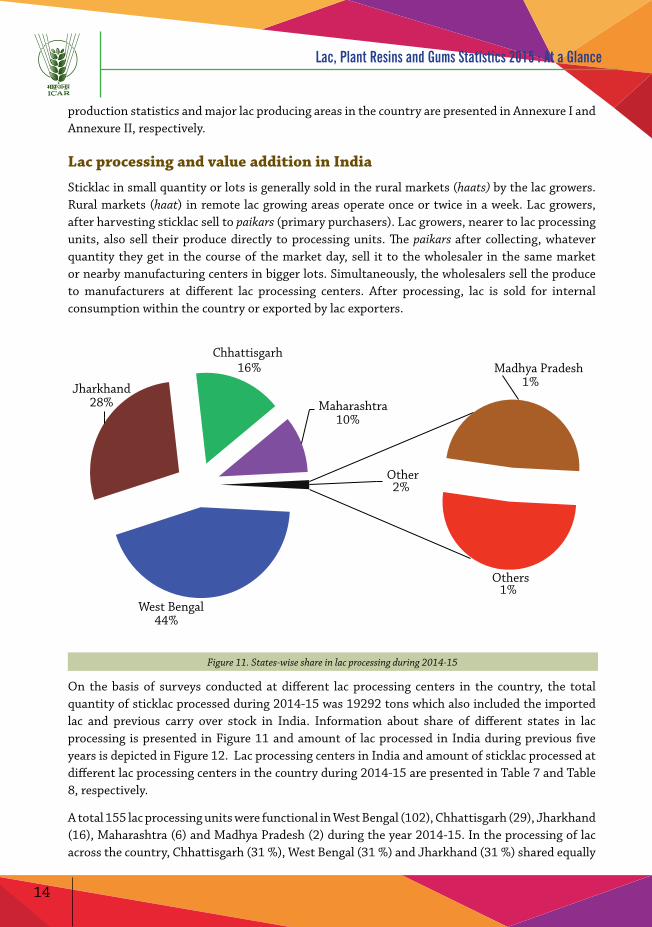
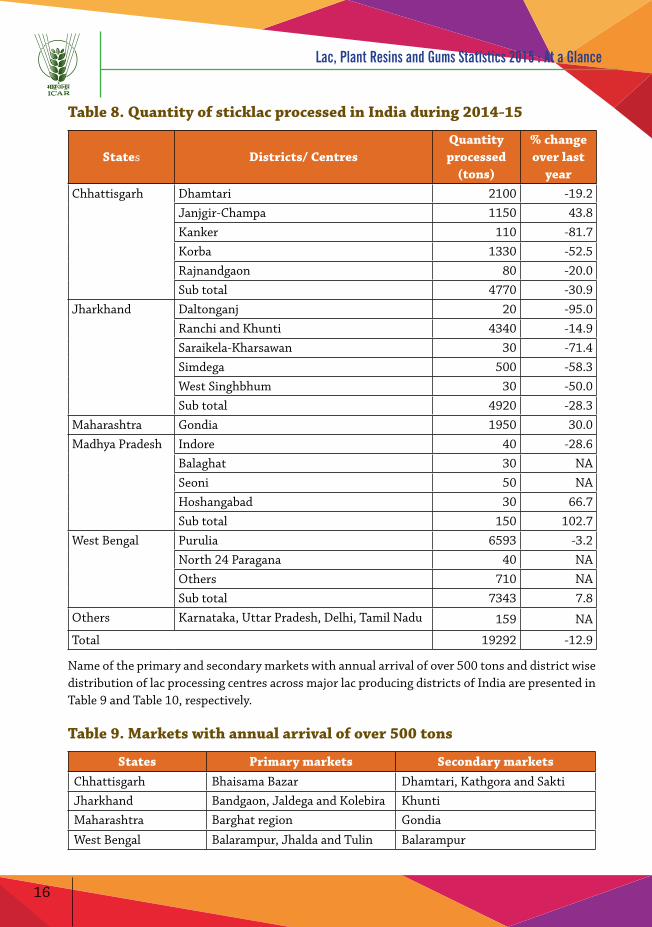
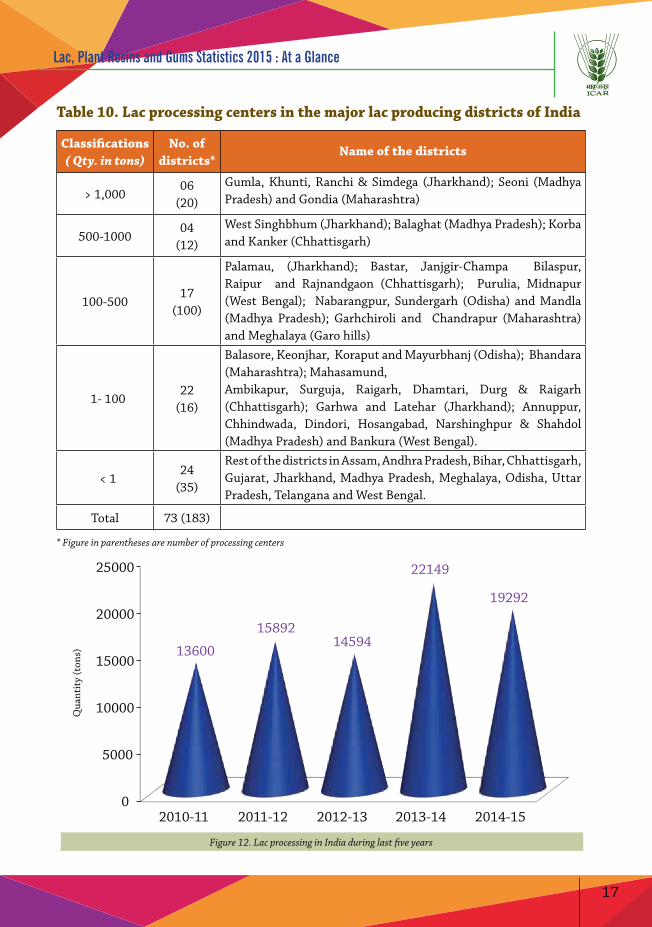
On the basis of surveys conducted at different lac processing centers in the country, the total quantity of sticklac processed during 2014-15 was 19292 tons which also included the imported lac and previous carry over stock in India. Information about share of different states in lac processing is presented in Figure 11 and amount of lac processed in India during previous five years is depicted in Figure 12. Lac processing centers in India and amount of sticklac processed at different lac processing centers in the country during 2014-15 are presented in Table 7 and Table 8, respectively.
A total 155 lac processing units were functional in West Bengal (102), Chhattisgarh (29), Jharkhand (16), Maharashtra (6) and Madhya Pradesh (2) during the year 2014-15. In the processing of lac across the country, Chhattisgarh (31 %), West Bengal (31 %) and Jharkhand (31 %) shared equally
15
Lac, Plant Resins and Gums Statistics 2015 : At a Glance
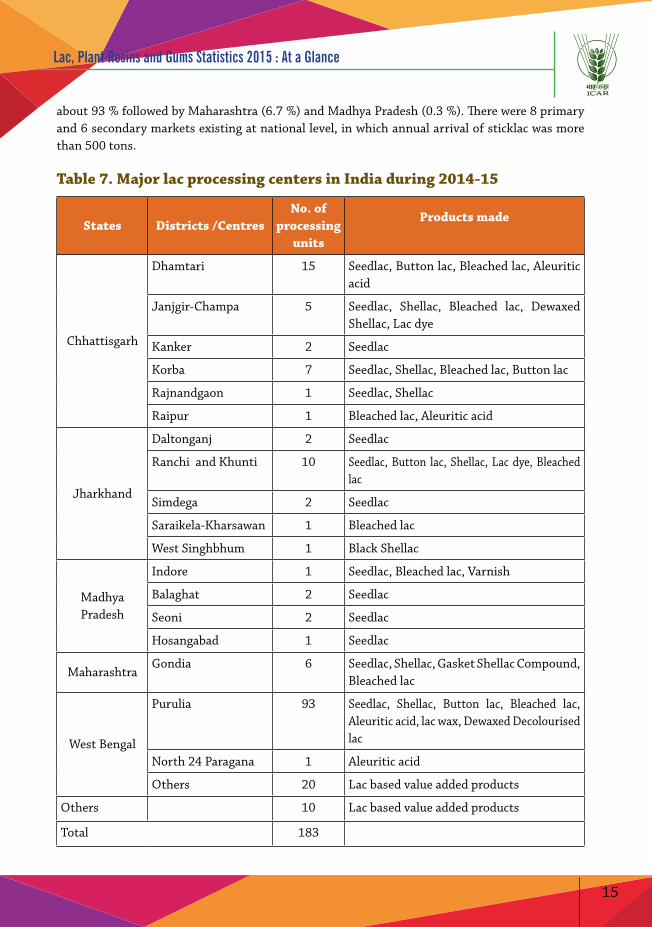
about 93 % followed by Maharashtra (6.7 %) and Madhya Pradesh (0.3 %). There were 8 primary and 6 secondary markets existing at national level, in which annual arrival of sticklac was more than 500 tons.
Table 7. Major lac processing centers in India during 2014-15
States Districts /CentresNo. of
processing units
Products made
Chhattisgarh
Dhamtari 15 Seedlac, Button lac, Bleached lac, Aleuritic acid
Janjgir-Champa 5 Seedlac, Shellac, Bleached lac, Dewaxed Shellac, Lac dye
Kanker 2 Seedlac
Korba 7 Seedlac, Shellac, Bleached lac, Button lac
Rajnandgaon 1 Seedlac, Shellac
Raipur 1 Bleached lac, Aleuritic acid
Jharkhand
Daltonganj 2 Seedlac
Ranchi and Khunti 10 Seedlac, Button lac, Shellac, Lac dye, Bleached lac
Simdega 2 Seedlac
Saraikela-Kharsawan 1 Bleached lac
West Singhbhum 1 Black Shellac
Madhya Pradesh
Indore 1 Seedlac, Bleached lac, Varnish
Balaghat 2 Seedlac
Seoni 2 Seedlac
Hosangabad 1 Seedlac
MaharashtraGondia 6 Seedlac, Shellac, Gasket Shellac Compound,
Bleached lac
West Bengal
Purulia 93 Seedlac, Shellac, Button lac, Bleached lac, Aleuritic acid, lac wax, Dewaxed Decolourised lac
North 24 Paragana 1 Aleuritic acid
Others 20 Lac based value added products
Others 10 Lac based value added products
Total 183
16
Lac, Plant Resins and Gums Statistics 2015 : At a Glance
Table 8. Quantity of sticklac processed in India during 2014-15
States Districts/ CentresQuantity processed
(tons)
% change over last
year Chhattisgarh Dhamtari 2100 -19.2
Janjgir-Champa 1150 43.8Kanker 110 -81.7Korba 1330 -52.5Rajnandgaon 80 -20.0Sub total 4770 -30.9
Jharkhand Daltonganj 20 -95.0Ranchi and Khunti 4340 -14.9Saraikela-Kharsawan 30 -71.4Simdega 500 -58.3West Singhbhum 30 -50.0Sub total 4920 -28.3
Maharashtra Gondia 1950 30.0Madhya Pradesh Indore 40 -28.6
Balaghat 30 NASeoni 50 NAHoshangabad 30 66.7Sub total 150 102.7
West Bengal Purulia 6593 -3.2North 24 Paragana 40 NAOthers 710 NASub total 7343 7.8
Others Karnataka, Uttar Pradesh, Delhi, Tamil Nadu 159 NA
Total 19292 -12.9
Name of the primary and secondary markets with annual arrival of over 500 tons and district wise distribution of lac processing centres across major lac producing districts of India are presented in Table 9 and Table 10, respectively.
Table 9. Markets with annual arrival of over 500 tons
States Primary markets Secondary marketsChhattisgarh Bhaisama Bazar Dhamtari, Kathgora and Sakti Jharkhand Bandgaon, Jaldega and Kolebira KhuntiMaharashtra Barghat region Gondia
West Bengal Balarampur, Jhalda and Tulin Balarampur
17
Lac, Plant Resins and Gums Statistics 2015 : At a Glance
Table 10. Lac processing centers in the major lac producing districts of India
Classifications( Qty. in tons)
No. of districts*
Name of the districts
> 1,000 06
(20)
Gumla, Khunti, Ranchi & Simdega (Jharkhand); Seoni (Madhya Pradesh) and Gondia (Maharashtra)
500-100004
(12)
West Singhbhum (Jharkhand); Balaghat (Madhya Pradesh); Korba and Kanker (Chhattisgarh)
100-50017
(100)
Palamau, (Jharkhand); Bastar, Janjgir-Champa Bilaspur, Raipur and Rajnandgaon (Chhattisgarh); Purulia, Midnapur (West Bengal); Nabarangpur, Sundergarh (Odisha) and Mandla (Madhya Pradesh); Garhchiroli and Chandrapur (Maharashtra) and Meghalaya (Garo hills)
1- 10022
(16)
Balasore, Keonjhar, Koraput and Mayurbhanj (Odisha); Bhandara (Maharashtra); Mahasamund, Ambikapur, Surguja, Raigarh, Dhamtari, Durg & Raigarh (Chhattisgarh); Garhwa and Latehar (Jharkhand); Annuppur, Chhindwada, Dindori, Hosangabad, Narshinghpur & Shahdol (Madhya Pradesh) and Bankura (West Bengal).
< 124
(35)
Rest of the districts in Assam, Andhra Pradesh, Bihar, Chhattisgarh, Gujarat, Jharkhand, Madhya Pradesh, Meghalaya, Odisha, Uttar Pradesh, Telangana and West Bengal.
Total 73 (183)
* Figure in parentheses are number of processing centers
0
5000
10000
15000
20000
25000
2010-11 2011-12 2012-13 2013-14 2014-15
13600
15892 14594
22149
19292
Qua
ntit
y (t
ons)
Figure 12. Lac processing in India during last five years
18
Lac, Plant Resins and Gums Statistics 2015 : At a Glance
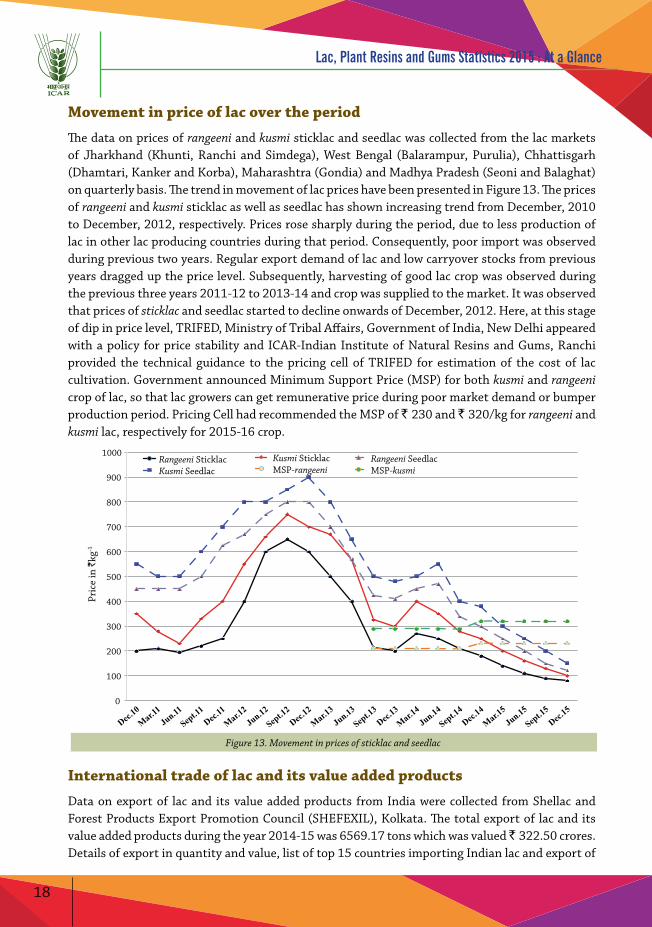
Movement in price of lac over the period
The data on prices of rangeeni and kusmi sticklac and seedlac was collected from the lac markets of Jharkhand (Khunti, Ranchi and Simdega), West Bengal (Balarampur, Purulia), Chhattisgarh (Dhamtari, Kanker and Korba), Maharashtra (Gondia) and Madhya Pradesh (Seoni and Balaghat) on quarterly basis. The trend in movement of lac prices have been presented in Figure 13. The prices of rangeeni and kusmi sticklac as well as seedlac has shown increasing trend from December, 2010 to December, 2012, respectively. Prices rose sharply during the period, due to less production of lac in other lac producing countries during that period. Consequently, poor import was observed during previous two years. Regular export demand of lac and low carryover stocks from previous years dragged up the price level. Subsequently, harvesting of good lac crop was observed during the previous three years 2011-12 to 2013-14 and crop was supplied to the market. It was observed that prices of sticklac and seedlac started to decline onwards of December, 2012. Here, at this stage of dip in price level, TRIFED, Ministry of Tribal Affairs, Government of India, New Delhi appeared with a policy for price stability and ICAR-Indian Institute of Natural Resins and Gums, Ranchi provided the technical guidance to the pricing cell of TRIFED for estimation of the cost of lac cultivation. Government announced Minimum Support Price (MSP) for both kusmi and rangeeni crop of lac, so that lac growers can get remunerative price during poor market demand or bumper production period. Pricing Cell had recommended the MSP of ` 230 and ` 320/kg for rangeeni and kusmi lac, respectively for 2015-16 crop.
0
100
200
300
400
500
600
700
800
900
1000
Pric
e in
`kg
-1
Rangeeni Sticklac Kusmi Seedlac
Kusmi Sticklac MSP-rangeeni
Rangeeni Seedlac MSP-kusmi
Figure 13. Movement in prices of sticklac and seedlac
International trade of lac and its value added products
Data on export of lac and its value added products from India were collected from Shellac and Forest Products Export Promotion Council (SHEFEXIL), Kolkata. The total export of lac and its value added products during the year 2014-15 was 6569.17 tons which was valued ̀ 322.50 crores. Details of export in quantity and value, list of top 15 countries importing Indian lac and export of
19
Lac, Plant Resins and Gums Statistics 2015 : At a Glance
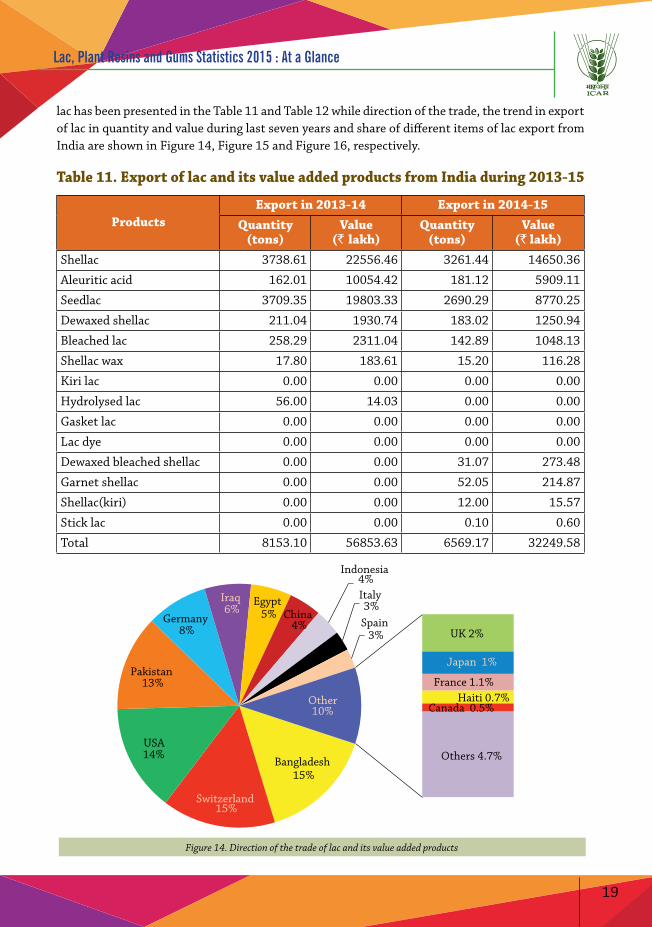
lac has been presented in the Table 11 and Table 12 while direction of the trade, the trend in export of lac in quantity and value during last seven years and share of different items of lac export from India are shown in Figure 14, Figure 15 and Figure 16, respectively.
Table 11. Export of lac and its value added products from India during 2013-15
ProductsExport in 2013-14 Export in 2014-15
Quantity (tons)
Value (` lakh)
Quantity (tons)
Value(` lakh)
Shellac 3738.61 22556.46 3261.44 14650.36
Aleuritic acid 162.01 10054.42 181.12 5909.11
Seedlac 3709.35 19803.33 2690.29 8770.25
Dewaxed shellac 211.04 1930.74 183.02 1250.94
Bleached lac 258.29 2311.04 142.89 1048.13
Shellac wax 17.80 183.61 15.20 116.28
Kiri lac 0.00 0.00 0.00 0.00
Hydrolysed lac 56.00 14.03 0.00 0.00
Gasket lac 0.00 0.00 0.00 0.00
Lac dye 0.00 0.00 0.00 0.00
Dewaxed bleached shellac 0.00 0.00 31.07 273.48
Garnet shellac 0.00 0.00 52.05 214.87
Shellac(kiri) 0.00 0.00 12.00 15.57
Stick lac 0.00 0.00 0.10 0.60
Total 8153.10 56853.63 6569.17 32249.58
Bangladesh 15%
Switzerland 15%
USA 14%
Pakistan 13%
Germany 8%
Iraq 6%
Egypt 5% China
4%
Indonesia 4% Italy 3%
Spain 3% UK 2%
Japan 1%
France 1.1% Haiti 0.7%
Canada 0.5%
Others 4.7%
Other 10%
Figure 14. Direction of the trade of lac and its value added products
20
Lac, Plant Resins and Gums Statistics 2015 : At a Glance
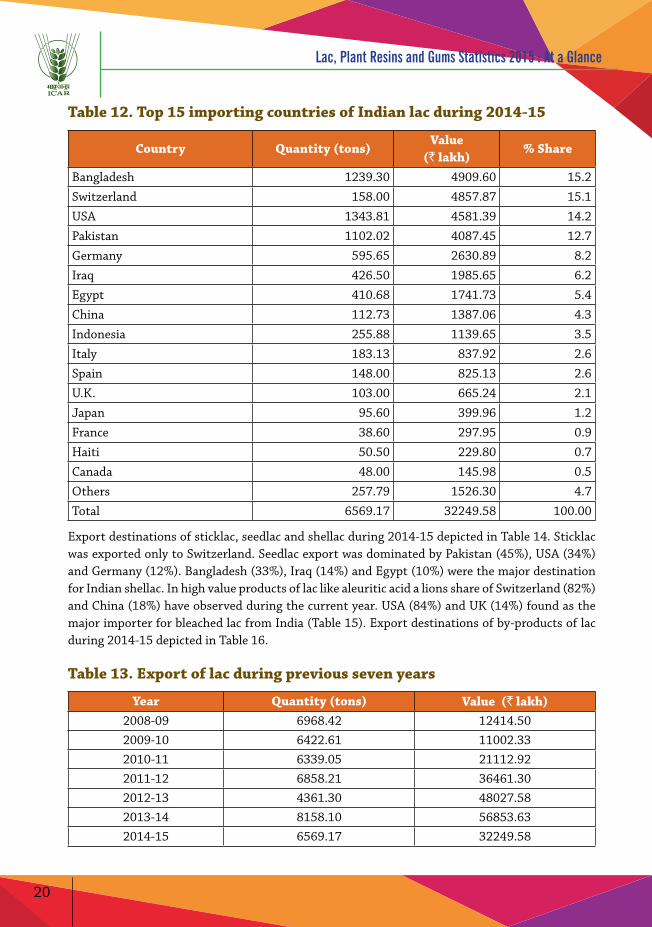
Table 12. Top 15 importing countries of Indian lac during 2014-15
Country Quantity (tons)Value
(` lakh)% Share
Bangladesh 1239.30 4909.60 15.2Switzerland 158.00 4857.87 15.1USA 1343.81 4581.39 14.2Pakistan 1102.02 4087.45 12.7Germany 595.65 2630.89 8.2Iraq 426.50 1985.65 6.2Egypt 410.68 1741.73 5.4China 112.73 1387.06 4.3Indonesia 255.88 1139.65 3.5Italy 183.13 837.92 2.6Spain 148.00 825.13 2.6U.K. 103.00 665.24 2.1Japan 95.60 399.96 1.2France 38.60 297.95 0.9Haiti 50.50 229.80 0.7Canada 48.00 145.98 0.5Others 257.79 1526.30 4.7Total 6569.17 32249.58 100.00
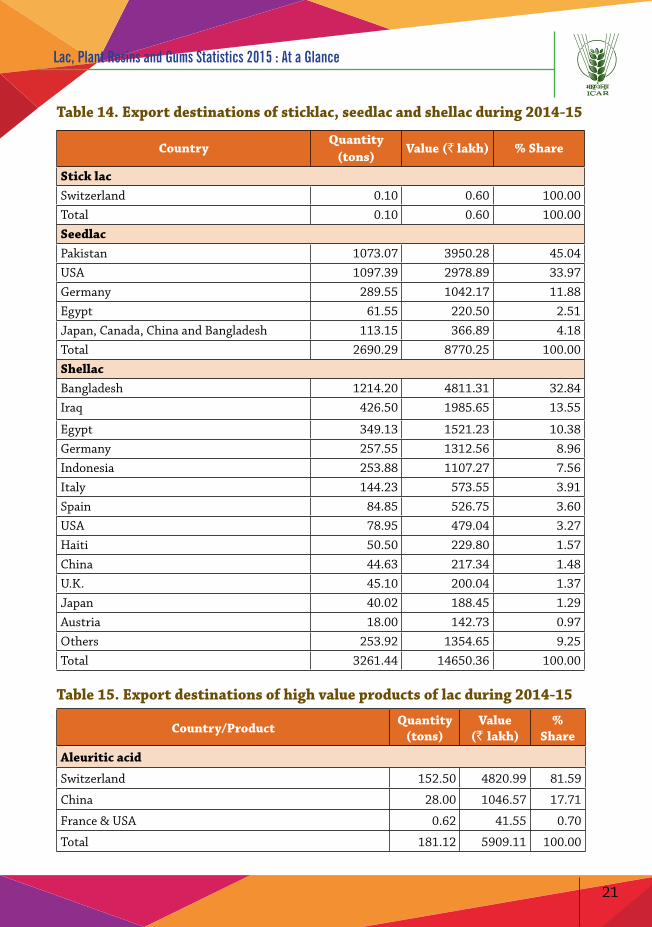
Export destinations of sticklac, seedlac and shellac during 2014-15 depicted in Table 14. Sticklac was exported only to Switzerland. Seedlac export was dominated by Pakistan (45%), USA (34%) and Germany (12%). Bangladesh (33%), Iraq (14%) and Egypt (10%) were the major destination for Indian shellac. In high value products of lac like aleuritic acid a lions share of Switzerland (82%) and China (18%) have observed during the current year. USA (84%) and UK (14%) found as the major importer for bleached lac from India (Table 15). Export destinations of by-products of lac during 2014-15 depicted in Table 16.
Table 13. Export of lac during previous seven years
Year Quantity (tons) Value (` lakh)2008-09 6968.42 12414.502009-10 6422.61 11002.332010-11 6339.05 21112.922011-12 6858.21 36461.302012-13 4361.30 48027.582013-14 8158.10 56853.632014-15 6569.17 32249.58
21
Lac, Plant Resins and Gums Statistics 2015 : At a Glance
Table 14. Export destinations of sticklac, seedlac and shellac during 2014-15
CountryQuantity
(tons)Value (` lakh) % Share
Stick lacSwitzerland 0.10 0.60 100.00Total 0.10 0.60 100.00SeedlacPakistan 1073.07 3950.28 45.04USA 1097.39 2978.89 33.97Germany 289.55 1042.17 11.88Egypt 61.55 220.50 2.51Japan, Canada, China and Bangladesh 113.15 366.89 4.18Total 2690.29 8770.25 100.00ShellacBangladesh 1214.20 4811.31 32.84Iraq 426.50 1985.65 13.55
Egypt 349.13 1521.23 10.38Germany 257.55 1312.56 8.96Indonesia 253.88 1107.27 7.56Italy 144.23 573.55 3.91Spain 84.85 526.75 3.60USA 78.95 479.04 3.27Haiti 50.50 229.80 1.57China 44.63 217.34 1.48U.K. 45.10 200.04 1.37Japan 40.02 188.45 1.29Austria 18.00 142.73 0.97Others 253.92 1354.65 9.25Total 3261.44 14650.36 100.00
Table 15. Export destinations of high value products of lac during 2014-15
Country/Product Quantity (tons)
Value(` lakh)
% Share
Aleuritic acid
Switzerland 152.50 4820.99 81.59
China 28.00 1046.57 17.71
France & USA 0.62 41.55 0.70
Total 181.12 5909.11 100.00
22
Lac, Plant Resins and Gums Statistics 2015 : At a Glance
Country/Product Quantity (tons)
Value(` lakh)
% Share
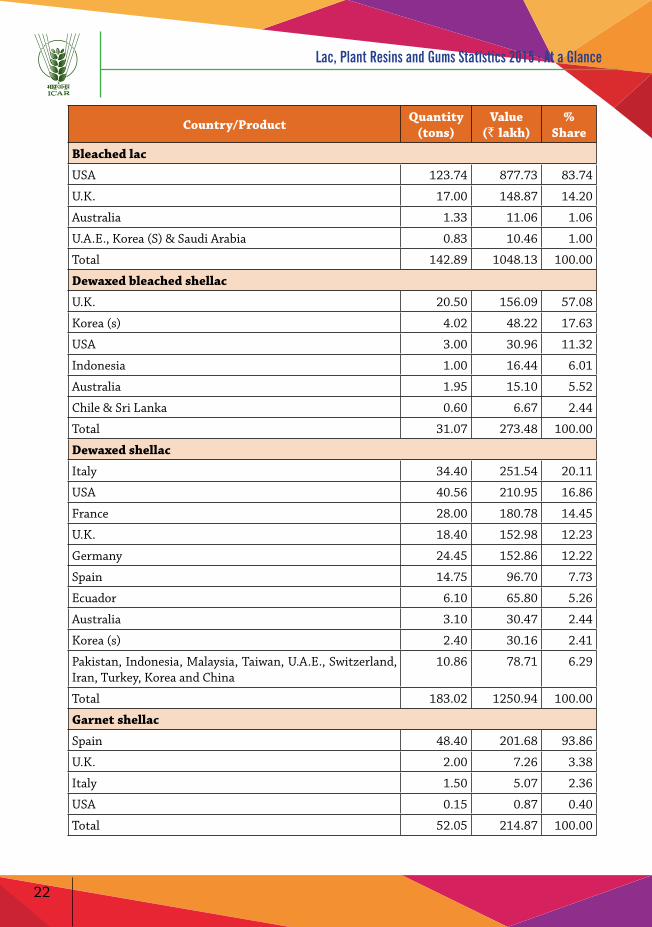
Bleached lac
USA 123.74 877.73 83.74
U.K. 17.00 148.87 14.20
Australia 1.33 11.06 1.06
U.A.E., Korea (S) & Saudi Arabia 0.83 10.46 1.00
Total 142.89 1048.13 100.00
Dewaxed bleached shellac
U.K. 20.50 156.09 57.08
Korea (s) 4.02 48.22 17.63
USA 3.00 30.96 11.32
Indonesia 1.00 16.44 6.01
Australia 1.95 15.10 5.52
Chile & Sri Lanka 0.60 6.67 2.44
Total 31.07 273.48 100.00
Dewaxed shellac
Italy 34.40 251.54 20.11
USA 40.56 210.95 16.86
France 28.00 180.78 14.45
U.K. 18.40 152.98 12.23
Germany 24.45 152.86 12.22
Spain 14.75 96.70 7.73
Ecuador 6.10 65.80 5.26
Australia 3.10 30.47 2.44
Korea (s) 2.40 30.16 2.41
Pakistan, Indonesia, Malaysia, Taiwan, U.A.E., Switzerland, Iran, Turkey, Korea and China
10.86 78.71 6.29
Total 183.02 1250.94 100.00
Garnet shellac
Spain 48.40 201.68 93.86
U.K. 2.00 7.26 3.38
Italy 1.50 5.07 2.36
USA 0.15 0.87 0.40
Total 52.05 214.87 100.00
23
Lac, Plant Resins and Gums Statistics 2015 : At a Glance
Table 16. Export destinations of by-products of lac during 2014-15
Country/ProductQuantity
(tons)Value
(` lakh)% Share
Shellac wax
Germany 12.10 107.73 92.65
Italy 3.00 7.77 6.68
Australia 0.10 0.78 0.67
Total 15.20 116.28 100.00
Shellac(kiri)
Germany 12.00 15.57 100.00
Total 12.00 15.57 100.00
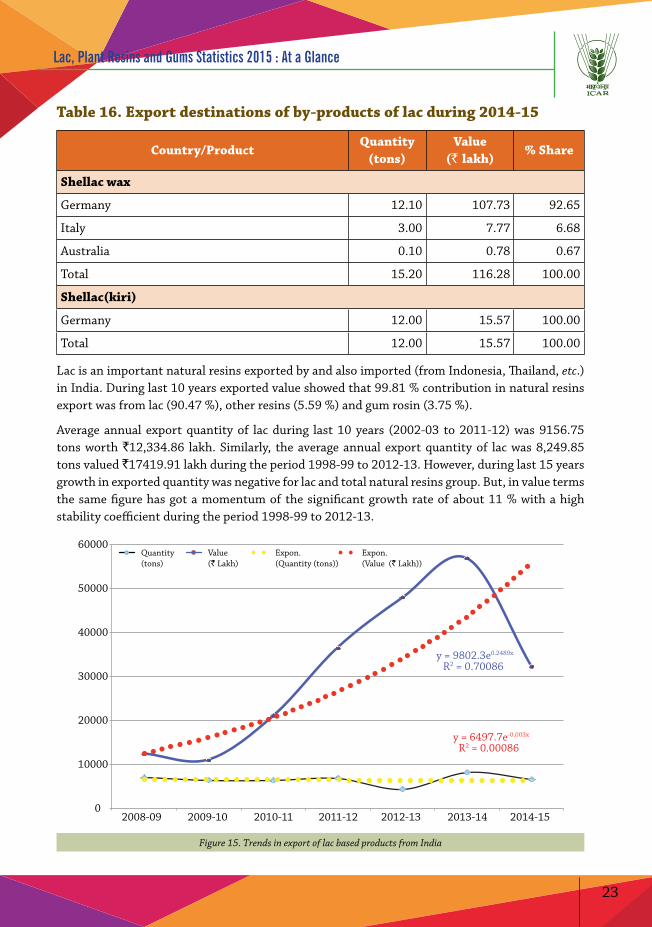
Lac is an important natural resins exported by and also imported (from Indonesia, Thailand, etc.) in India. During last 10 years exported value showed that 99.81 % contribution in natural resins export was from lac (90.47 %), other resins (5.59 %) and gum rosin (3.75 %).
Average annual export quantity of lac during last 10 years (2002-03 to 2011-12) was 9156.75 tons worth `12,334.86 lakh. Similarly, the average annual export quantity of lac was 8,249.85 tons valued `17419.91 lakh during the period 1998-99 to 2012-13. However, during last 15 years growth in exported quantity was negative for lac and total natural resins group. But, in value terms the same figure has got a momentum of the significant growth rate of about 11 % with a high stability coefficient during the period 1998-99 to 2012-13.
0
10000
20000
30000
40000
50000
60000
2008-09 2009-10 2010-11 2011-12 2012-13 2013-14 2014-15
Quantity(tons)
Value(` Lakh)
Expon.(Quantity (tons))
Expon. (Value (` Lakh))
y = 6497.7e-0.003x R2 = 0.00086
y = 9802.3e0.2489x R2 = 0.70086
Figure 15. Trends in export of lac based products from India
24
Lac, Plant Resins and Gums Statistics 2015 : At a Glance
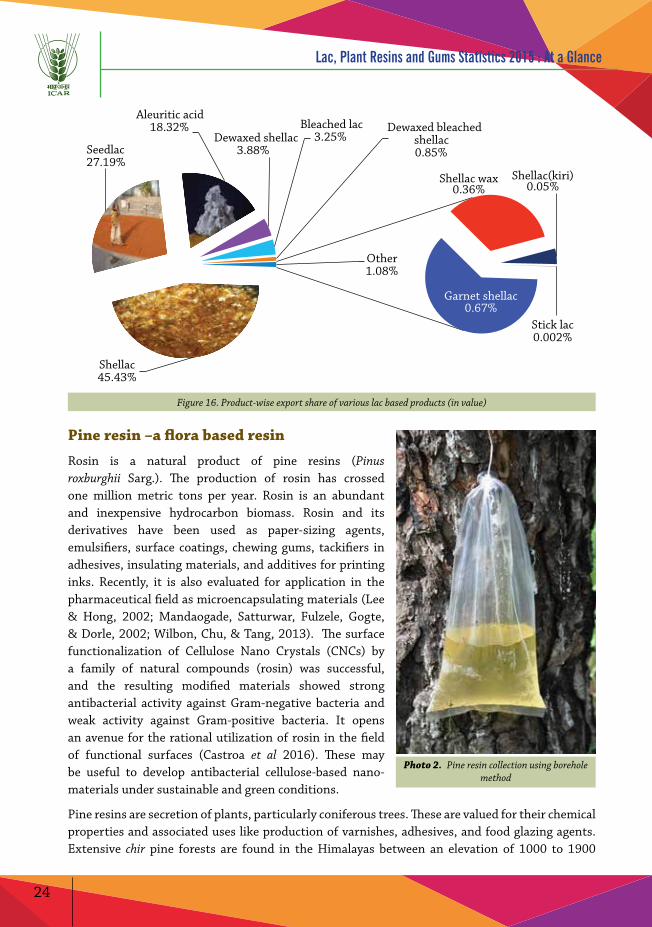
Shellac 45.43%
Seedlac 27.19%
Aleuritic acid 18.32%
Dewaxed shellac 3.88%
Bleached lac 3.25%
Dewaxed bleached shellac 0.85%
Garnet shellac 0.67%
Shellac wax 0.36%
Shellac(kiri) 0.05%
Stick lac 0.002%
Other 1.08%
Figure 16. Product-wise export share of various lac based products (in value)
Pine resin –a flora based resin
Rosin is a natural product of pine resins (Pinus roxburghii Sarg.). The production of rosin has crossed one million metric tons per year. Rosin is an abundant and inexpensive hydrocarbon biomass. Rosin and its derivatives have been used as paper-sizing agents, emulsifiers, surface coatings, chewing gums, tackifiers in adhesives, insulating materials, and additives for printing inks. Recently, it is also evaluated for application in the pharmaceutical field as microencapsulating materials (Lee & Hong, 2002; Mandaogade, Satturwar, Fulzele, Gogte, & Dorle, 2002; Wilbon, Chu, & Tang, 2013). The surface functionalization of Cellulose Nano Crystals (CNCs) by a family of natural compounds (rosin) was successful, and the resulting modified materials showed strong antibacterial activity against Gram-negative bacteria and weak activity against Gram-positive bacteria. It opens an avenue for the rational utilization of rosin in the field of functional surfaces (Castroa et al 2016). These may be useful to develop antibacterial cellulose-based nano-materials under sustainable and green conditions.
Pine resins are secretion of plants, particularly coniferous trees. These are valued for their chemical properties and associated uses like production of varnishes, adhesives, and food glazing agents. Extensive chir pine forests are found in the Himalayas between an elevation of 1000 to 1900
Photo 2. Pine resin collection using borehole method
25
Lac, Plant Resins and Gums Statistics 2015 : At a Glance
m. Chir pine yields commercially important oleo-resin which forms the raw material for rosin and turpentine oil industry in India. Chir pine is widely tapped for resin on commercial basis, particularly in the hills of Himachal Pradesh, Uttarakhand, Jammu & Kashmir and north-eastern states. The northern hill states annually produces around 8,000 to 9,000 tonnes of raw rosin extracted from pine trees.
Major share of resin production comes from Himachal Pradesh and Uttarakhand. Commercially tapped sources of pine resin are depicted in Table 17. The production of resin in the states during the year 2013-14 was about 8000 tons and about 85 % of this raw material is processed in the Rosin and Turpentine oil Factories (RTFs). Indonesia is also supplying rosin to Indian industries but China was the major supplier of imported product. Indonesian rosin costs around the same as the Chinese product. Both China and Indonesia have captured more than 50% of the Indian market. After the global recession, China had dropped its prices in the Indian market. The annual requirement of rosin in the country was 40,000-50,000 tons.
Table 17. Commercially tapped sources of pine resin: species and country of production
Sl. No. Species Producing country1. Pinus caribaea Morelet Venezuela, South Africa, Kenya2. P. halepensis Miller Greece3. P. kesiya Royale ex Gordon People’s Republic of China4. P. massoniana D. Don People’s Republic of China5. P. merkusii Jungh. & Vriese Indonesia, Viet Nam6. P. oocarpa Schiede Mexico, Honduras7. P. pinaster Aiton Portugal8. P. radiata D. Don Kenya9. P. roxburghii Sarg. India, Pakistan
10. P. sylvestris L. Russia11. P. elliottii Engelm. Brazil, Argentina, South Africa, USA, Kenya
Source: FAO, Rome, Italy
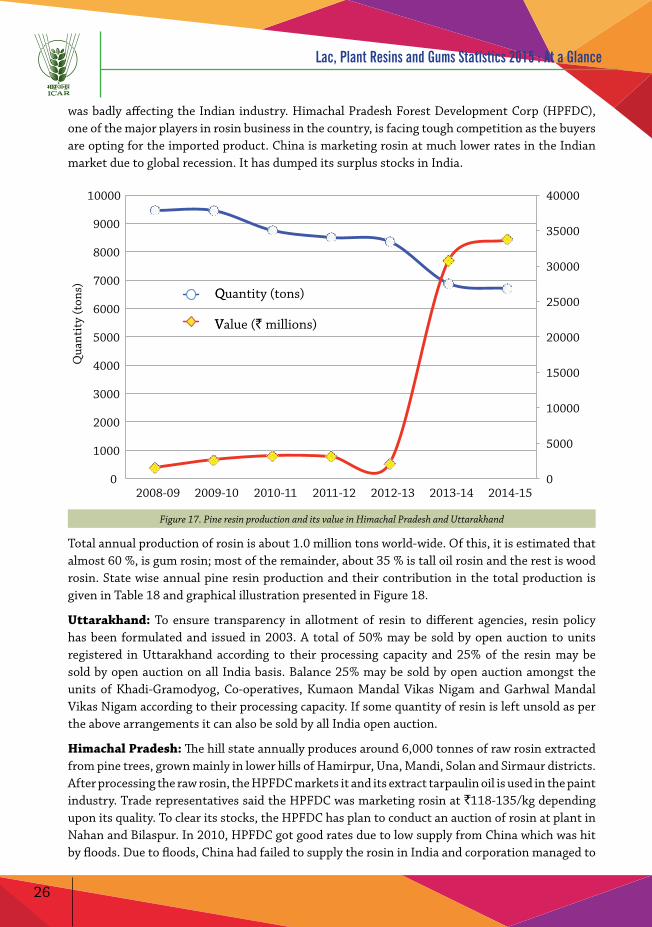
Pine resin production World production of turpentine is approximately 3.3 lakh tons from all sources; an almost 1.0 lakh tons (30%) is estimated to be gum turpentine, and the bulk of the remainder is sulphate turpentine. In India resin production and its value during 2007-08 to 2014-15 is depicted in Figure 17.
Resin production policyIn 2010-11, the cheap Chinese rosin, a solid form of resin obtained from pines and conifers, has flooded the Indian market and is threatening the profit margins of the rosin business in India. China had supplied the solid or semi-solid viscous substance at much lower rates as compared to the domestic product. When the global demand for rosin nosedived following the recession in Europe, China started dumping its surplus stock in India. Imported rosin, especially from China,
26
Lac, Plant Resins and Gums Statistics 2015 : At a Glance
was badly affecting the Indian industry. Himachal Pradesh Forest Development Corp (HPFDC), one of the major players in rosin business in the country, is facing tough competition as the buyers are opting for the imported product. China is marketing rosin at much lower rates in the Indian market due to global recession. It has dumped its surplus stocks in India.
0
5000
10000
15000
20000
25000
30000
35000
40000
0
1000
2000
3000
4000
5000
6000
7000
8000
9000
10000
2008-09 2009-10 2010-11 2011-12 2012-13 2013-14 2014-15
Qua
ntit
y (t
ons)
QQuantity (tons)
VValue (` millions)
Figure 17. Pine resin production and its value in Himachal Pradesh and Uttarakhand
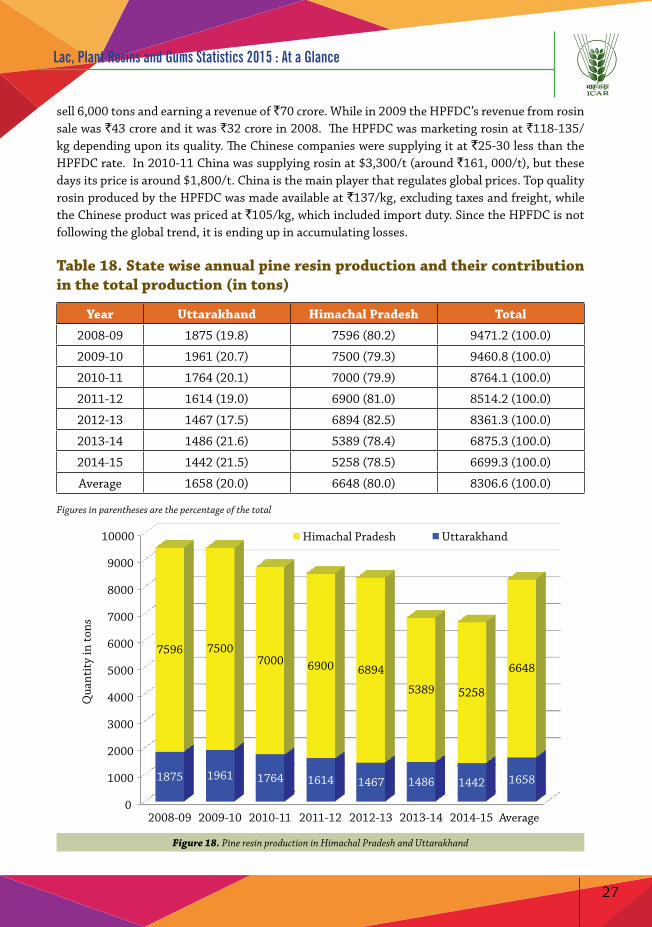
Total annual production of rosin is about 1.0 million tons world-wide. Of this, it is estimated that almost 60 %, is gum rosin; most of the remainder, about 35 % is tall oil rosin and the rest is wood rosin. State wise annual pine resin production and their contribution in the total production is given in Table 18 and graphical illustration presented in Figure 18.
Uttarakhand: To ensure transparency in allotment of resin to different agencies, resin policy has been formulated and issued in 2003. A total of 50% may be sold by open auction to units registered in Uttarakhand according to their processing capacity and 25% of the resin may be sold by open auction on all India basis. Balance 25% may be sold by open auction amongst the units of Khadi-Gramodyog, Co-operatives, Kumaon Mandal Vikas Nigam and Garhwal Mandal Vikas Nigam according to their processing capacity. If some quantity of resin is left unsold as per the above arrangements it can also be sold by all India open auction.
Himachal Pradesh: The hill state annually produces around 6,000 tonnes of raw rosin extracted from pine trees, grown mainly in lower hills of Hamirpur, Una, Mandi, Solan and Sirmaur districts. After processing the raw rosin, the HPFDC markets it and its extract tarpaulin oil is used in the paint industry. Trade representatives said the HPFDC was marketing rosin at `118-135/kg depending upon its quality. To clear its stocks, the HPFDC has plan to conduct an auction of rosin at plant in Nahan and Bilaspur. In 2010, HPFDC got good rates due to low supply from China which was hit by floods. Due to floods, China had failed to supply the rosin in India and corporation managed to
27
Lac, Plant Resins and Gums Statistics 2015 : At a Glance
sell 6,000 tons and earning a revenue of `70 crore. While in 2009 the HPFDC’s revenue from rosin sale was `43 crore and it was `32 crore in 2008. The HPFDC was marketing rosin at `118-135/kg depending upon its quality. The Chinese companies were supplying it at `25-30 less than the HPFDC rate. In 2010-11 China was supplying rosin at $3,300/t (around `161, 000/t), but these days its price is around $1,800/t. China is the main player that regulates global prices. Top quality rosin produced by the HPFDC was made available at `137/kg, excluding taxes and freight, while the Chinese product was priced at `105/kg, which included import duty. Since the HPFDC is not following the global trend, it is ending up in accumulating losses.
Table 18. State wise annual pine resin production and their contribution in the total production (in tons)
Year Uttarakhand Himachal Pradesh Total
2008-09 1875 (19.8) 7596 (80.2) 9471.2 (100.0)
2009-10 1961 (20.7) 7500 (79.3) 9460.8 (100.0)
2010-11 1764 (20.1) 7000 (79.9) 8764.1 (100.0)
2011-12 1614 (19.0) 6900 (81.0) 8514.2 (100.0)
2012-13 1467 (17.5) 6894 (82.5) 8361.3 (100.0)
2013-14 1486 (21.6) 5389 (78.4) 6875.3 (100.0)
2014-15 1442 (21.5) 5258 (78.5) 6699.3 (100.0)
Average 1658 (20.0) 6648 (80.0) 8306.6 (100.0)
Figures in parentheses are the percentage of the total
0
1000
2000
3000
4000
5000
6000
7000
8000
9000
10000
2008-09 2009-10 2010-11 2011-12 2012-13 2013-14 2014-15 Average
1875 1961 1764 1614 1467 1486 1442 1658
7596 7500 7000 6900 6894
5389 5258
6648
Qua
ntit
y in
tons
Himachal Pradesh Uttarakhand
Figure 18. Pine resin production in Himachal Pradesh and Uttarakhand
28
Lac, Plant Resins and Gums Statistics 2015 : At a Glance
Pine resin processing in India
Himachal Pradesh State Forest Development Corporation Limited, an Undertaking of the Himachal Pradesh government, came into existence on 25th of March 1974. This Corporation deals mainly with marketing of timber, fuel wood, pulpwood, bamboo, khair and resin. The entire government resin tapping work is being done by the Corporation, through modern techniques (Rill method as of now). It is graded and sold on the basis of colour, the palest shades of yellow-brown being the better quality. Quality criteria and specifications are described in Table 19.
The two Resin & Turpentine Oil Factories, located at Bilaspur and Nahan operational since four decades, have both skilled and unskilled workers to undertake resin processing and other diversification activities. Rosin and turpentine oil and other subsidiary products like phenyl, varnish, black japan etc. are produced from the collected resin. Rosin is the major product obtained from pine resin. It remains behind as the residue after distillation of the turpentine oil. It is a brittle, transparent, glassy solid. It is insoluble in water but soluble in many organic solvents.
Table 19. Quality criteria for different grades of the rosinRosin Grade Full Name
Pale
X Extra WhiteWW Water WhiteWG Window GlassN Nancy
MediumM MaryK KittyH Harry
DarkD DarkB Black
Pine resin market and priceIn any analysis of world production and trade in gum naval stores, the volume of trade taking place in crude resin needs to be estimated. Until recently, this did not need to be considered as all resin was processed at origin and rosin and turpentine were the primary products of trade. However, trade in crude resin has developed over years as the capacity for tapping has fallen in some of the traditional producing countries, notably Portugal and India. These countries have excess processing capacity which can be brought back into production if an economic, external source of crude resin is found. The absence of capital costs therefore enables the processors of imported resin to sell the outputs (gum rosin and turpentine) at a price which only need covers raw material and processing costs, freight, drums and profit.
The sale of crude resin also allows producing countries with a surplus to earn extra revenue without investing in additional capacity for processing. Price of turpentine oil (vegetable) per litre (naked) ex-factory on cash basis ranged from ` 87 to ` 88. The price of per kg rosin is given in Table 20 and graphically shown in Figure 19. This price is an ex-factory price including packing charges excluding taxes and duties, etc.
29
Lac, Plant Resins and Gums Statistics 2015 : At a Glance
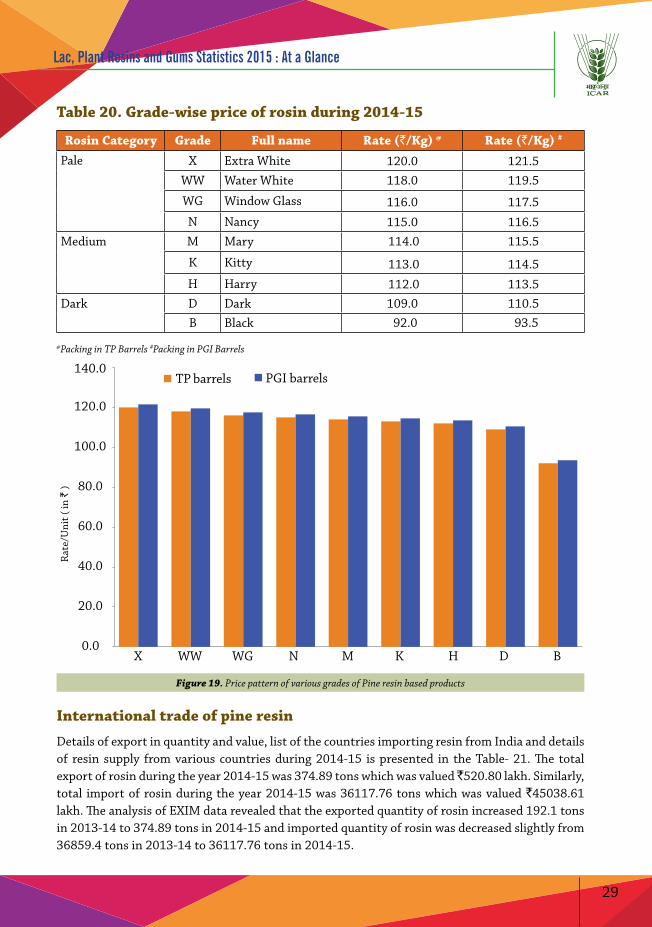
Table 20. Grade-wise price of rosin during 2014-15
Rosin Category Grade Full name Rate (`/Kg) @ Rate (`/Kg) #
Pale X Extra White 120.0 121.5WW Water White 118.0 119.5
WG Window Glass 116.0 117.5N Nancy 115.0 116.5
Medium M Mary 114.0 115.5
K Kitty 113.0 114.5H Harry 112.0 113.5
Dark D Dark 109.0 110.5B Black 92.0 93.5
@Packing in TP Barrels #Packing in PGI Barrels
0.0
20.0
40.0
60.0
80.0
100.0
120.0
140.0
X WW WG N M K H D B
Rat
e/U
nit (
in `
)
TP barrels PGI barrels
Figure 19. Price pattern of various grades of Pine resin based products
International trade of pine resin
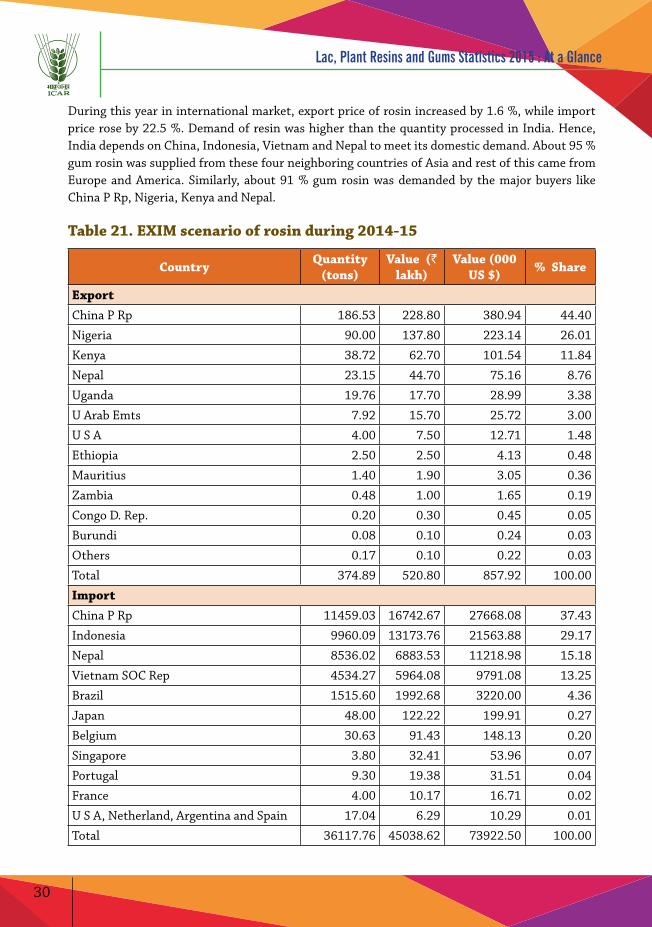
Details of export in quantity and value, list of the countries importing resin from India and details of resin supply from various countries during 2014-15 is presented in the Table- 21. The total export of rosin during the year 2014-15 was 374.89 tons which was valued ̀ 520.80 lakh. Similarly, total import of rosin during the year 2014-15 was 36117.76 tons which was valued `45038.61 lakh. The analysis of EXIM data revealed that the exported quantity of rosin increased 192.1 tons in 2013-14 to 374.89 tons in 2014-15 and imported quantity of rosin was decreased slightly from 36859.4 tons in 2013-14 to 36117.76 tons in 2014-15.
30
Lac, Plant Resins and Gums Statistics 2015 : At a Glance
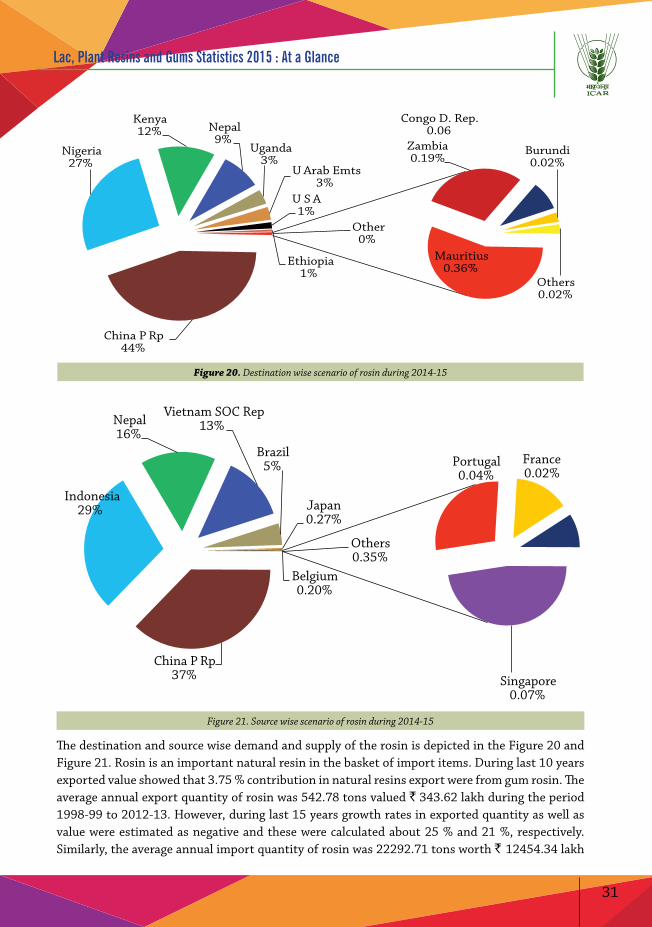
During this year in international market, export price of rosin increased by 1.6 %, while import price rose by 22.5 %. Demand of resin was higher than the quantity processed in India. Hence, India depends on China, Indonesia, Vietnam and Nepal to meet its domestic demand. About 95 % gum rosin was supplied from these four neighboring countries of Asia and rest of this came from Europe and America. Similarly, about 91 % gum rosin was demanded by the major buyers like China P Rp, Nigeria, Kenya and Nepal.
Table 21. EXIM scenario of rosin during 2014-15
Country Quantity (tons)
Value (` lakh)
Value (000 US $) % Share
ExportChina P Rp 186.53 228.80 380.94 44.40
Nigeria 90.00 137.80 223.14 26.01
Kenya 38.72 62.70 101.54 11.84
Nepal 23.15 44.70 75.16 8.76
Uganda 19.76 17.70 28.99 3.38
U Arab Emts 7.92 15.70 25.72 3.00
U S A 4.00 7.50 12.71 1.48
Ethiopia 2.50 2.50 4.13 0.48
Mauritius 1.40 1.90 3.05 0.36
Zambia 0.48 1.00 1.65 0.19
Congo D. Rep. 0.20 0.30 0.45 0.05
Burundi 0.08 0.10 0.24 0.03
Others 0.17 0.10 0.22 0.03
Total 374.89 520.80 857.92 100.00
ImportChina P Rp 11459.03 16742.67 27668.08 37.43
Indonesia 9960.09 13173.76 21563.88 29.17
Nepal 8536.02 6883.53 11218.98 15.18
Vietnam SOC Rep 4534.27 5964.08 9791.08 13.25
Brazil 1515.60 1992.68 3220.00 4.36
Japan 48.00 122.22 199.91 0.27
Belgium 30.63 91.43 148.13 0.20
Singapore 3.80 32.41 53.96 0.07
Portugal 9.30 19.38 31.51 0.04
France 4.00 10.17 16.71 0.02
U S A, Netherland, Argentina and Spain 17.04 6.29 10.29 0.01
Total 36117.76 45038.62 73922.50 100.00
31
Lac, Plant Resins and Gums Statistics 2015 : At a Glance
China P Rp 44%
Nigeria 27%
Kenya 12% Nepal
9% Uganda
3% U Arab Emts
3% U S A 1%
Ethiopia 1%
Mauritius 0.36%
Zambia 0.19%
Congo D. Rep. 0.06
Burundi 0.02%
Others 0.02%
Other 0%
Figure 20. Destination wise scenario of rosin during 2014-15
China P Rp 37%
Indonesia 29%
Nepal 16%
Vietnam SOC Rep 13%
Brazil 5%
Japan 0.27%
Belgium 0.20%
Singapore 0.07%
Portugal 0.04%
France 0.02%
Others 0.35%
Figure 21. Source wise scenario of rosin during 2014-15
The destination and source wise demand and supply of the rosin is depicted in the Figure 20 and Figure 21. Rosin is an important natural resin in the basket of import items. During last 10 years exported value showed that 3.75 % contribution in natural resins export were from gum rosin. The average annual export quantity of rosin was 542.78 tons valued ` 343.62 lakh during the period 1998-99 to 2012-13. However, during last 15 years growth rates in exported quantity as well as value were estimated as negative and these were calculated about 25 % and 21 %, respectively. Similarly, the average annual import quantity of rosin was 22292.71 tons worth ` 12454.34 lakh
32
Lac, Plant Resins and Gums Statistics 2015 : At a Glance
during the period 1998-99 to 2012-13. Its import had a very high stability with growth rates in import quantity (10.65 %) as well as value (26.41 %).
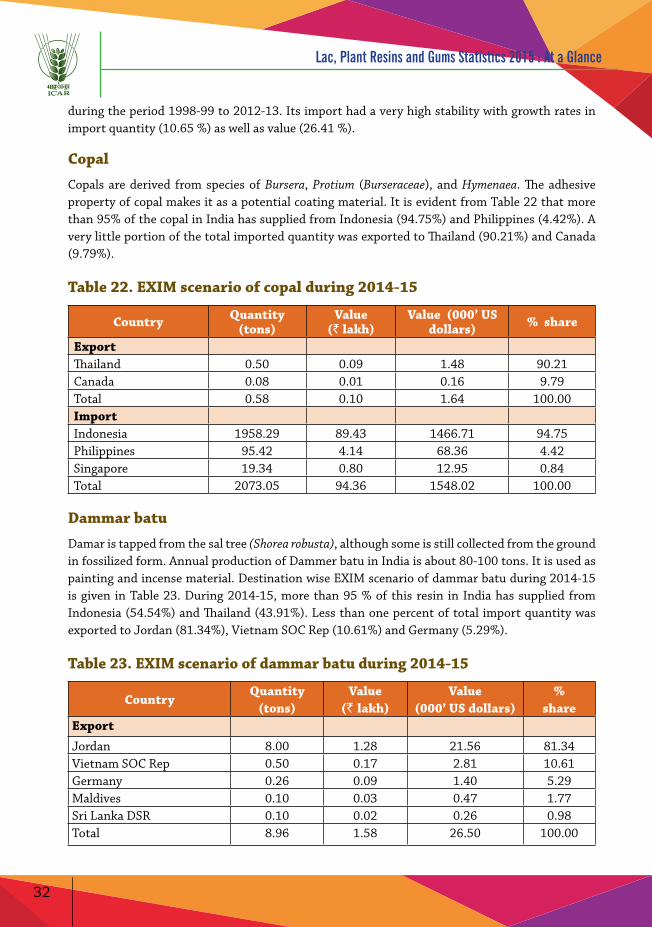
Copal
Copals are derived from species of Bursera, Protium (Burseraceae), and Hymenaea. The adhesive property of copal makes it as a potential coating material. It is evident from Table 22 that more than 95% of the copal in India has supplied from Indonesia (94.75%) and Philippines (4.42%). A very little portion of the total imported quantity was exported to Thailand (90.21%) and Canada (9.79%).
Table 22. EXIM scenario of copal during 2014-15
Country Quantity (tons)
Value(` lakh)
Value (000’ US dollars) % share
Export Thailand 0.50 0.09 1.48 90.21Canada 0.08 0.01 0.16 9.79Total 0.58 0.10 1.64 100.00Import Indonesia 1958.29 89.43 1466.71 94.75Philippines 95.42 4.14 68.36 4.42Singapore 19.34 0.80 12.95 0.84Total 2073.05 94.36 1548.02 100.00
Dammar batu
Damar is tapped from the sal tree (Shorea robusta), although some is still collected from the ground in fossilized form. Annual production of Dammer batu in India is about 80-100 tons. It is used as painting and incense material. Destination wise EXIM scenario of dammar batu during 2014-15 is given in Table 23. During 2014-15, more than 95 % of this resin in India has supplied from Indonesia (54.54%) and Thailand (43.91%). Less than one percent of total import quantity was exported to Jordan (81.34%), Vietnam SOC Rep (10.61%) and Germany (5.29%).
Table 23. EXIM scenario of dammar batu during 2014-15
CountryQuantity
(tons)Value
(` lakh)Value
(000’ US dollars)%
shareExport
Jordan 8.00 1.28 21.56 81.34Vietnam SOC Rep 0.50 0.17 2.81 10.61Germany 0.26 0.09 1.40 5.29Maldives 0.10 0.03 0.47 1.77Sri Lanka DSR 0.10 0.02 0.26 0.98Total 8.96 1.58 26.50 100.00
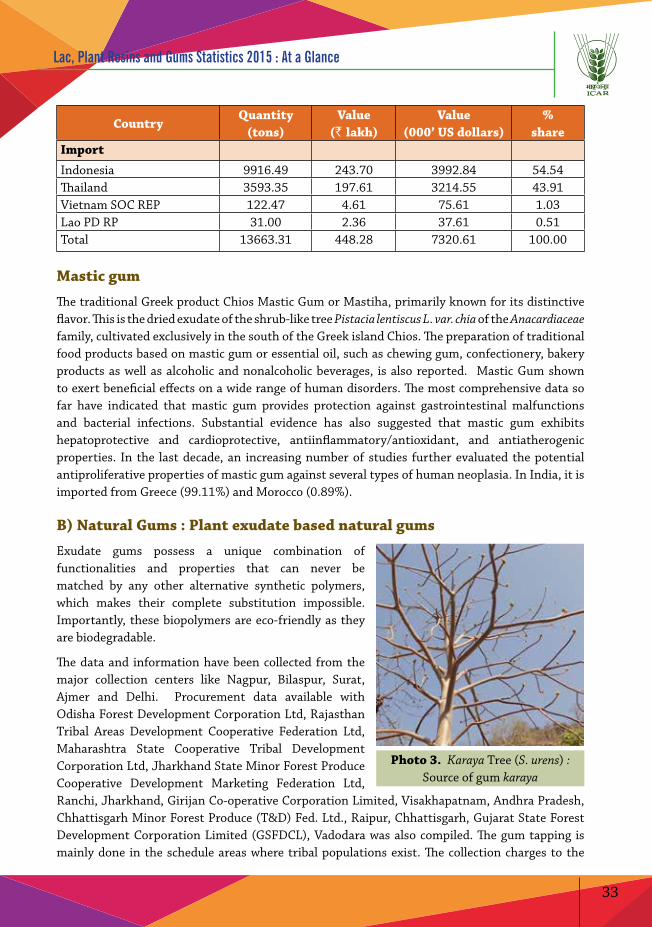
33
Lac, Plant Resins and Gums Statistics 2015 : At a Glance
CountryQuantity
(tons)Value
(` lakh)Value
(000’ US dollars)%
shareImport
Indonesia 9916.49 243.70 3992.84 54.54Thailand 3593.35 197.61 3214.55 43.91Vietnam SOC REP 122.47 4.61 75.61 1.03Lao PD RP 31.00 2.36 37.61 0.51Total 13663.31 448.28 7320.61 100.00
Mastic gum
The traditional Greek product Chios Mastic Gum or Mastiha, primarily known for its distinctive flavor. This is the dried exudate of the shrub-like tree Pistacia lentiscus L. var. chia of the Anacardiaceae family, cultivated exclusively in the south of the Greek island Chios. The preparation of traditional food products based on mastic gum or essential oil, such as chewing gum, confectionery, bakery products as well as alcoholic and nonalcoholic beverages, is also reported. Mastic Gum shown to exert beneficial effects on a wide range of human disorders. The most comprehensive data so far have indicated that mastic gum provides protection against gastrointestinal malfunctions and bacterial infections. Substantial evidence has also suggested that mastic gum exhibits hepatoprotective and cardioprotective, antiinflammatory/antioxidant, and antiatherogenic properties. In the last decade, an increasing number of studies further evaluated the potential antiproliferative properties of mastic gum against several types of human neoplasia. In India, it is imported from Greece (99.11%) and Morocco (0.89%).
B) Natural Gums : Plant exudate based natural gums
Exudate gums possess a unique combination of functionalities and properties that can never be matched by any other alternative synthetic polymers, which makes their complete substitution impossible. Importantly, these biopolymers are eco-friendly as they are biodegradable.
The data and information have been collected from the major collection centers like Nagpur, Bilaspur, Surat, Ajmer and Delhi. Procurement data available with Odisha Forest Development Corporation Ltd, Rajasthan Tribal Areas Development Cooperative Federation Ltd, Maharashtra State Cooperative Tribal Development Corporation Ltd, Jharkhand State Minor Forest Produce Cooperative Development Marketing Federation Ltd, Ranchi, Jharkhand, Girijan Co-operative Corporation Limited, Visakhapatnam, Andhra Pradesh, Chhattisgarh Minor Forest Produce (T&D) Fed. Ltd., Raipur, Chhattisgarh, Gujarat State Forest Development Corporation Limited (GSFDCL), Vadodara was also compiled. The gum tapping is mainly done in the schedule areas where tribal populations exist. The collection charges to the
Photo 3. Karaya Tree (S. urens) : Source of gum karaya
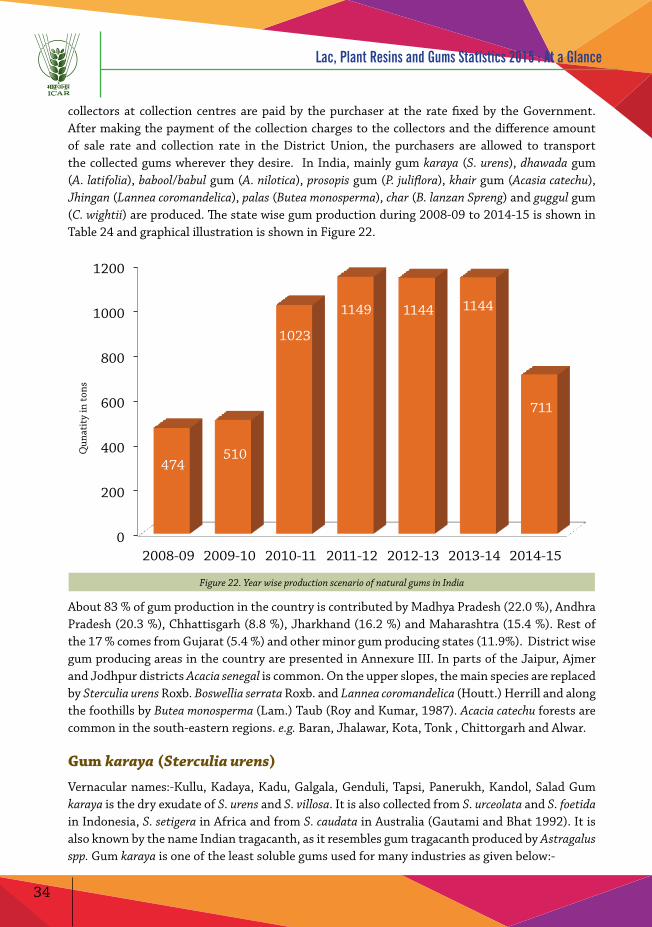
34
Lac, Plant Resins and Gums Statistics 2015 : At a Glance
collectors at collection centres are paid by the purchaser at the rate fixed by the Government. After making the payment of the collection charges to the collectors and the difference amount of sale rate and collection rate in the District Union, the purchasers are allowed to transport the collected gums wherever they desire. In India, mainly gum karaya (S. urens), dhawada gum (A. latifolia), babool/babul gum (A. nilotica), prosopis gum (P. juliflora), khair gum (Acasia catechu), Jhingan (Lannea coromandelica), palas (Butea monosperma), char (B. lanzan Spreng) and guggul gum (C. wightii) are produced. The state wise gum production during 2008-09 to 2014-15 is shown in Table 24 and graphical illustration is shown in Figure 22.
0
200
400
600
800
1000
1200
2008-09 2009-10 2010-11 2011-12 2012-13 2013-14 2014-15
474 510
1023
1149 1144 1144
711
Qun
atit
y in
tons
Figure 22. Year wise production scenario of natural gums in India
About 83 % of gum production in the country is contributed by Madhya Pradesh (22.0 %), Andhra Pradesh (20.3 %), Chhattisgarh (8.8 %), Jharkhand (16.2 %) and Maharashtra (15.4 %). Rest of the 17 % comes from Gujarat (5.4 %) and other minor gum producing states (11.9%). District wise gum producing areas in the country are presented in Annexure III. In parts of the Jaipur, Ajmer and Jodhpur districts Acacia senegal is common. On the upper slopes, the main species are replaced by Sterculia urens Roxb. Boswellia serrata Roxb. and Lannea coromandelica (Houtt.) Herrill and along the foothills by Butea monosperma (Lam.) Taub (Roy and Kumar, 1987). Acacia catechu forests are common in the south-eastern regions. e.g. Baran, Jhalawar, Kota, Tonk , Chittorgarh and Alwar.
Gum karaya (Sterculia urens)
Vernacular names:-Kullu, Kadaya, Kadu, Galgala, Genduli, Tapsi, Panerukh, Kandol, Salad Gum karaya is the dry exudate of S. urens and S. villosa. It is also collected from S. urceolata and S. foetida in Indonesia, S. setigera in Africa and from S. caudata in Australia (Gautami and Bhat 1992). It is also known by the name Indian tragacanth, as it resembles gum tragacanth produced by Astragalus spp. Gum karaya is one of the least soluble gums used for many industries as given below:-
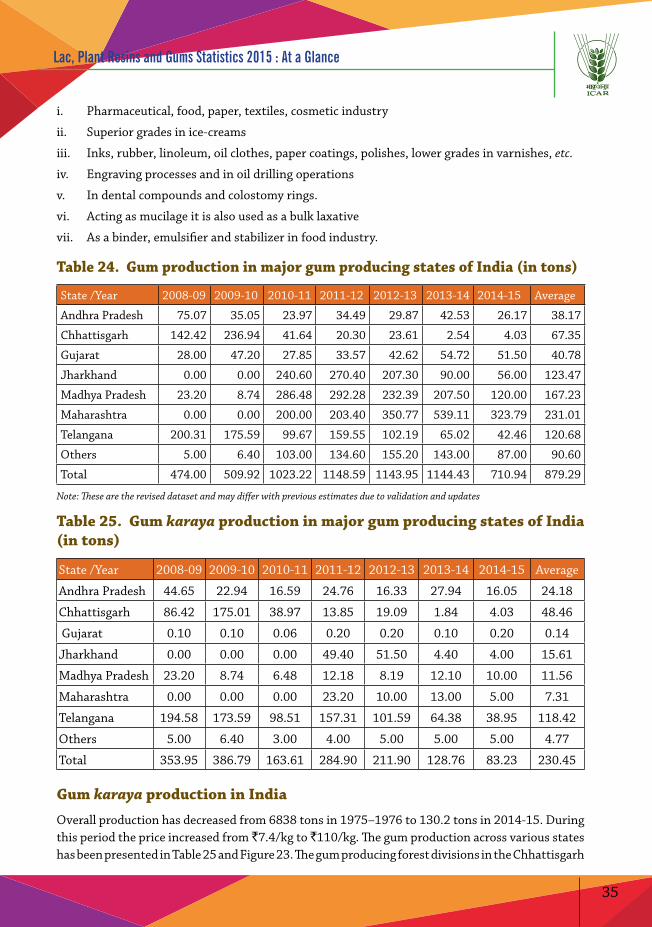
35
Lac, Plant Resins and Gums Statistics 2015 : At a Glance
i. Pharmaceutical, food, paper, textiles, cosmetic industry
ii. Superior grades in ice-creams
iii. Inks, rubber, linoleum, oil clothes, paper coatings, polishes, lower grades in varnishes, etc.
iv. Engraving processes and in oil drilling operations
v. In dental compounds and colostomy rings.
vi. Acting as mucilage it is also used as a bulk laxative
vii. As a binder, emulsifier and stabilizer in food industry.
Table 24. Gum production in major gum producing states of India (in tons)
State /Year 2008-09 2009-10 2010-11 2011-12 2012-13 2013-14 2014-15 Average
Andhra Pradesh 75.07 35.05 23.97 34.49 29.87 42.53 26.17 38.17
Chhattisgarh 142.42 236.94 41.64 20.30 23.61 2.54 4.03 67.35
Gujarat 28.00 47.20 27.85 33.57 42.62 54.72 51.50 40.78
Jharkhand 0.00 0.00 240.60 270.40 207.30 90.00 56.00 123.47
Madhya Pradesh 23.20 8.74 286.48 292.28 232.39 207.50 120.00 167.23
Maharashtra 0.00 0.00 200.00 203.40 350.77 539.11 323.79 231.01
Telangana 200.31 175.59 99.67 159.55 102.19 65.02 42.46 120.68
Others 5.00 6.40 103.00 134.60 155.20 143.00 87.00 90.60
Total 474.00 509.92 1023.22 1148.59 1143.95 1144.43 710.94 879.29
Note: These are the revised dataset and may differ with previous estimates due to validation and updates
Table 25. Gum karaya production in major gum producing states of India (in tons)
State /Year 2008-09 2009-10 2010-11 2011-12 2012-13 2013-14 2014-15 Average
Andhra Pradesh 44.65 22.94 16.59 24.76 16.33 27.94 16.05 24.18
Chhattisgarh 86.42 175.01 38.97 13.85 19.09 1.84 4.03 48.46
Gujarat 0.10 0.10 0.06 0.20 0.20 0.10 0.20 0.14
Jharkhand 0.00 0.00 0.00 49.40 51.50 4.40 4.00 15.61
Madhya Pradesh 23.20 8.74 6.48 12.18 8.19 12.10 10.00 11.56
Maharashtra 0.00 0.00 0.00 23.20 10.00 13.00 5.00 7.31
Telangana 194.58 173.59 98.51 157.31 101.59 64.38 38.95 118.42
Others 5.00 6.40 3.00 4.00 5.00 5.00 5.00 4.77
Total 353.95 386.79 163.61 284.90 211.90 128.76 83.23 230.45
Gum karaya production in India
Overall production has decreased from 6838 tons in 1975–1976 to 130.2 tons in 2014-15. During this period the price increased from `7.4/kg to `110/kg. The gum production across various states has been presented in Table 25 and Figure 23. The gum producing forest divisions in the Chhattisgarh
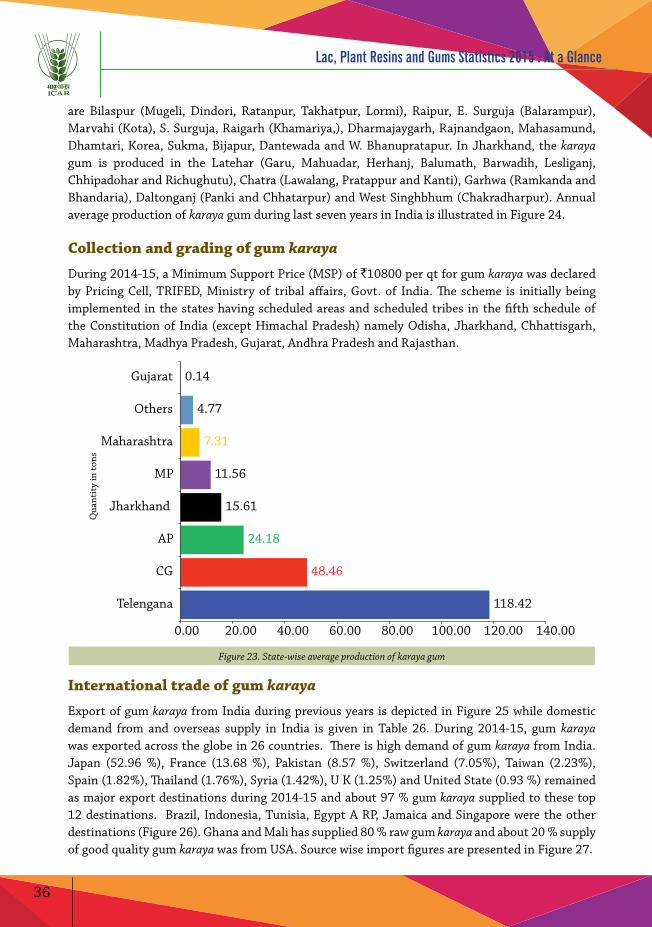
36
Lac, Plant Resins and Gums Statistics 2015 : At a Glance
are Bilaspur (Mugeli, Dindori, Ratanpur, Takhatpur, Lormi), Raipur, E. Surguja (Balarampur), Marvahi (Kota), S. Surguja, Raigarh (Khamariya,), Dharmajaygarh, Rajnandgaon, Mahasamund, Dhamtari, Korea, Sukma, Bijapur, Dantewada and W. Bhanupratapur. In Jharkhand, the karaya gum is produced in the Latehar (Garu, Mahuadar, Herhanj, Balumath, Barwadih, Lesliganj, Chhipadohar and Richughutu), Chatra (Lawalang, Pratappur and Kanti), Garhwa (Ramkanda and Bhandaria), Daltonganj (Panki and Chhatarpur) and West Singhbhum (Chakradharpur). Annual average production of karaya gum during last seven years in India is illustrated in Figure 24.
Collection and grading of gum karaya
During 2014-15, a Minimum Support Price (MSP) of `10800 per qt for gum karaya was declared by Pricing Cell, TRIFED, Ministry of tribal affairs, Govt. of India. The scheme is initially being implemented in the states having scheduled areas and scheduled tribes in the fifth schedule of the Constitution of India (except Himachal Pradesh) namely Odisha, Jharkhand, Chhattisgarh, Maharashtra, Madhya Pradesh, Gujarat, Andhra Pradesh and Rajasthan.
118.42
48.46
24.18
15.61
11.56
7.31
4.77
0.14
0.00 20.00 40.00 60.00 80.00 100.00 120.00 140.00
Telengana
CG
AP
Jharkhand
MP
Maharashtra
Others
Gujarat
Qua
ntit
y in
tons
Figure 23. State-wise average production of karaya gum
International trade of gum karaya
Export of gum karaya from India during previous years is depicted in Figure 25 while domestic demand from and overseas supply in India is given in Table 26. During 2014-15, gum karaya was exported across the globe in 26 countries. There is high demand of gum karaya from India. Japan (52.96 %), France (13.68 %), Pakistan (8.57 %), Switzerland (7.05%), Taiwan (2.23%), Spain (1.82%), Thailand (1.76%), Syria (1.42%), U K (1.25%) and United State (0.93 %) remained as major export destinations during 2014-15 and about 97 % gum karaya supplied to these top 12 destinations. Brazil, Indonesia, Tunisia, Egypt A RP, Jamaica and Singapore were the other destinations (Figure 26). Ghana and Mali has supplied 80 % raw gum karaya and about 20 % supply of good quality gum karaya was from USA. Source wise import figures are presented in Figure 27.
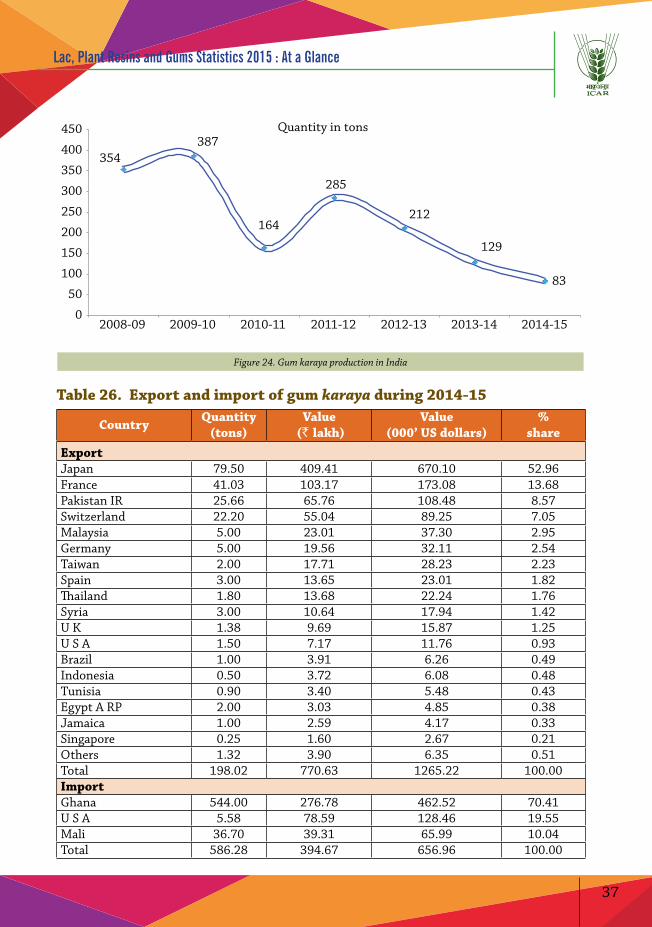
37
Lac, Plant Resins and Gums Statistics 2015 : At a Glance
354 387
164
285
212
129
83
0
50
100
150
200
250
300
350
400
450
2008-09 2009-10 2010-11 2011-12 2012-13 2013-14 2014-15
Quantity in tons
Figure 24. Gum karaya production in India
Table 26. Export and import of gum karaya during 2014-15
Country Quantity (tons)
Value (` lakh)
Value (000’ US dollars)
% share
ExportJapan 79.50 409.41 670.10 52.96France 41.03 103.17 173.08 13.68Pakistan IR 25.66 65.76 108.48 8.57Switzerland 22.20 55.04 89.25 7.05Malaysia 5.00 23.01 37.30 2.95Germany 5.00 19.56 32.11 2.54Taiwan 2.00 17.71 28.23 2.23Spain 3.00 13.65 23.01 1.82Thailand 1.80 13.68 22.24 1.76Syria 3.00 10.64 17.94 1.42U K 1.38 9.69 15.87 1.25U S A 1.50 7.17 11.76 0.93Brazil 1.00 3.91 6.26 0.49Indonesia 0.50 3.72 6.08 0.48Tunisia 0.90 3.40 5.48 0.43Egypt A RP 2.00 3.03 4.85 0.38Jamaica 1.00 2.59 4.17 0.33Singapore 0.25 1.60 2.67 0.21Others 1.32 3.90 6.35 0.51Total 198.02 770.63 1265.22 100.00ImportGhana 544.00 276.78 462.52 70.41U S A 5.58 78.59 128.46 19.55Mali 36.70 39.31 65.99 10.04Total 586.28 394.67 656.96 100.00

38
Lac, Plant Resins and Gums Statistics 2015 : At a Glance
0
500
1000
1500
2000
2500
3000
3500
4000
4500
2010-11 2011-12 2012-13 2013-14 2014-15
Qty (tons) Value (` Lakh)
Figure 25. Export of gum karaya from India
Japan 53%France 13%
Pakistan IR 9%
Switzerland 7%
Malaysia 3%
Germany 3%Taiwan 2%
Spain 2%�ailand 2%
Syria 1% U K 1%U S A 1%
Others 3%
Ghana70%
U S A20%
Mali10%
Figure 26. Destination wise scenario of gum karaya during 2014-15 Figure 27. Source wise scenario of gum karaya during 2014-15
Dhawda gum/Gum Ghatti (A. latifolia)
Vernacular names :- Gum Ghatti, Dhauda, Dhaura, Bakli, Tirman, Vekkali, Dhanda, Damado
Dhawda gum is the dry exudate of A. latifolia. It has a glassy fracture and occurs in rounded tears which are normally less than 1 cm in diameter. It often occurs in larger vermiform masses. The colour of the exudate varies from light to dark brown; the lighter the colour the better the quality. Dhawda gum is used by many industries. It is used as an emulsifier and stabilizer in beverages and butter containing table syrups; flavour fixative for specific applications; to prepare powdered, stable, oil-soluble vitamins; as a binder in long-fibered light weight papers; as an emulsifier of petroleum and non petroleum waxes to form liquid and wax paste emulsions; to prepare uniform and discrete prills of cross-linked polystyrene; used as drilling mud conditioner and the acidizing of oil wells and also used in powdered explosives to improve resistance to water damage.
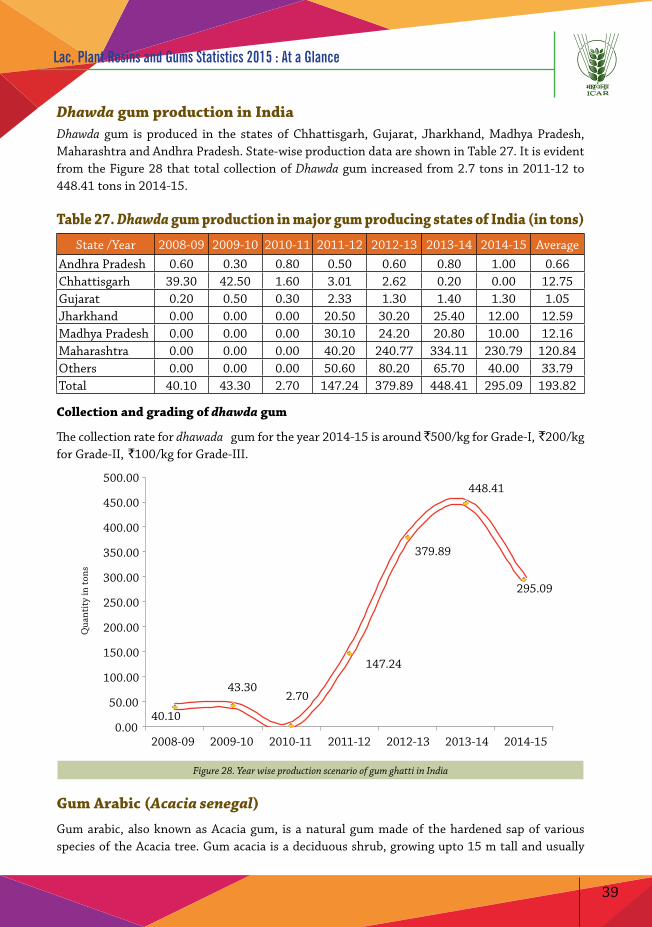
39
Lac, Plant Resins and Gums Statistics 2015 : At a Glance
Dhawda gum production in IndiaDhawda gum is produced in the states of Chhattisgarh, Gujarat, Jharkhand, Madhya Pradesh, Maharashtra and Andhra Pradesh. State-wise production data are shown in Table 27. It is evident from the Figure 28 that total collection of Dhawda gum increased from 2.7 tons in 2011-12 to 448.41 tons in 2014-15.
Table 27. Dhawda gum production in major gum producing states of India (in tons)
State /Year 2008-09 2009-10 2010-11 2011-12 2012-13 2013-14 2014-15 AverageAndhra Pradesh 0.60 0.30 0.80 0.50 0.60 0.80 1.00 0.66Chhattisgarh 39.30 42.50 1.60 3.01 2.62 0.20 0.00 12.75Gujarat 0.20 0.50 0.30 2.33 1.30 1.40 1.30 1.05Jharkhand 0.00 0.00 0.00 20.50 30.20 25.40 12.00 12.59Madhya Pradesh 0.00 0.00 0.00 30.10 24.20 20.80 10.00 12.16Maharashtra 0.00 0.00 0.00 40.20 240.77 334.11 230.79 120.84Others 0.00 0.00 0.00 50.60 80.20 65.70 40.00 33.79Total 40.10 43.30 2.70 147.24 379.89 448.41 295.09 193.82
Collection and grading of dhawda gum
The collection rate for dhawada gum for the year 2014-15 is around `500/kg for Grade-I, `200/kg for Grade-II, `100/kg for Grade-III.
40.10
43.30 2.70
147.24
379.89
448.41
295.09
0.00
50.00
100.00
150.00
200.00
250.00
300.00
350.00
400.00
450.00
500.00
2008-09 2009-10 2010-11 2011-12 2012-13 2013-14 2014-15
Qua
ntit
y in
tons
Figure 28. Year wise production scenario of gum ghatti in India
Gum Arabic (Acacia senegal)
Gum arabic, also known as Acacia gum, is a natural gum made of the hardened sap of various species of the Acacia tree. Gum acacia is a deciduous shrub, growing upto 15 m tall and usually
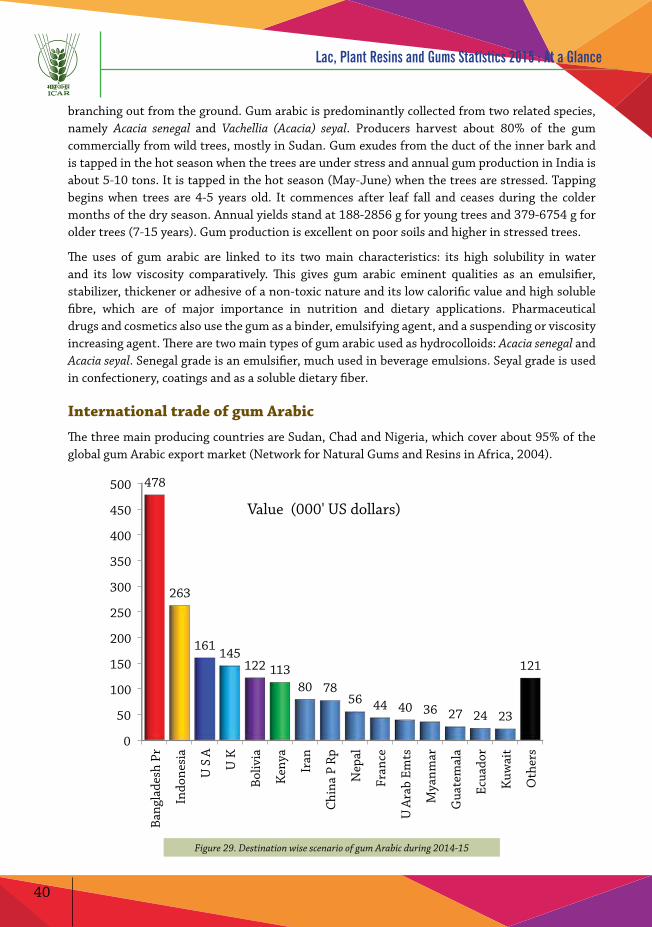
40
Lac, Plant Resins and Gums Statistics 2015 : At a Glance
branching out from the ground. Gum arabic is predominantly collected from two related species, namely Acacia senegal and Vachellia (Acacia) seyal. Producers harvest about 80% of the gum commercially from wild trees, mostly in Sudan. Gum exudes from the duct of the inner bark and is tapped in the hot season when the trees are under stress and annual gum production in India is about 5-10 tons. It is tapped in the hot season (May-June) when the trees are stressed. Tapping begins when trees are 4-5 years old. It commences after leaf fall and ceases during the colder months of the dry season. Annual yields stand at 188-2856 g for young trees and 379-6754 g for older trees (7-15 years). Gum production is excellent on poor soils and higher in stressed trees.
The uses of gum arabic are linked to its two main characteristics: its high solubility in water and its low viscosity comparatively. This gives gum arabic eminent qualities as an emulsifier, stabilizer, thickener or adhesive of a non-toxic nature and its low calorific value and high soluble fibre, which are of major importance in nutrition and dietary applications. Pharmaceutical drugs and cosmetics also use the gum as a binder, emulsifying agent, and a suspending or viscosity increasing agent. There are two main types of gum arabic used as hydrocolloids: Acacia senegal and Acacia seyal. Senegal grade is an emulsifier, much used in beverage emulsions. Seyal grade is used in confectionery, coatings and as a soluble dietary fiber.
International trade of gum Arabic
The three main producing countries are Sudan, Chad and Nigeria, which cover about 95% of the global gum Arabic export market (Network for Natural Gums and Resins in Africa, 2004).
0
50
100
150
200
250
300
350
400
450
500
Bang
lade
sh P
r
Indo
nesi
a
U S
A
U K
Boliv
ia
Ken
ya
Iran
Chin
a P
Rp
Nep
al
Fran
ce
U A
rab
Emts
Mya
nmar
Gua
tem
ala
Ecua
dor
Kuw
ait
Oth
ers
478
263
161 145 122 113
80 78 56 44 40 36 27 24 23
121
Value (000' US dollars)
Figure 29. Destination wise scenario of gum Arabic during 2014-15
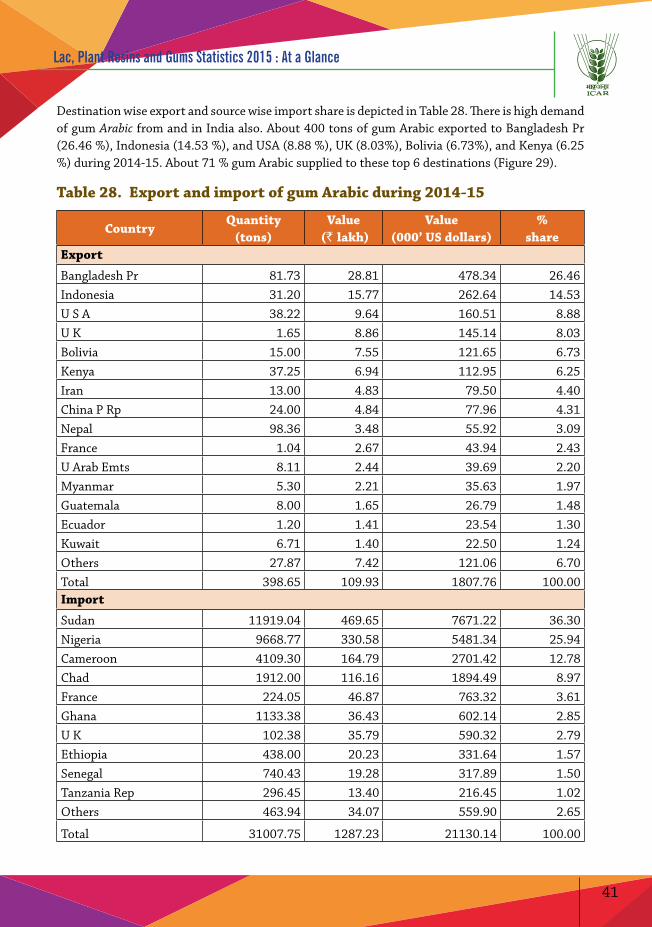
41
Lac, Plant Resins and Gums Statistics 2015 : At a Glance
Destination wise export and source wise import share is depicted in Table 28. There is high demand of gum Arabic from and in India also. About 400 tons of gum Arabic exported to Bangladesh Pr (26.46 %), Indonesia (14.53 %), and USA (8.88 %), UK (8.03%), Bolivia (6.73%), and Kenya (6.25 %) during 2014-15. About 71 % gum Arabic supplied to these top 6 destinations (Figure 29).
Table 28. Export and import of gum Arabic during 2014-15
CountryQuantity
(tons)Value
(` lakh)Value
(000’ US dollars)%
shareExport
Bangladesh Pr 81.73 28.81 478.34 26.46Indonesia 31.20 15.77 262.64 14.53U S A 38.22 9.64 160.51 8.88U K 1.65 8.86 145.14 8.03Bolivia 15.00 7.55 121.65 6.73Kenya 37.25 6.94 112.95 6.25Iran 13.00 4.83 79.50 4.40China P Rp 24.00 4.84 77.96 4.31Nepal 98.36 3.48 55.92 3.09France 1.04 2.67 43.94 2.43U Arab Emts 8.11 2.44 39.69 2.20Myanmar 5.30 2.21 35.63 1.97Guatemala 8.00 1.65 26.79 1.48Ecuador 1.20 1.41 23.54 1.30Kuwait 6.71 1.40 22.50 1.24Others 27.87 7.42 121.06 6.70Total 398.65 109.93 1807.76 100.00Import
Sudan 11919.04 469.65 7671.22 36.30Nigeria 9668.77 330.58 5481.34 25.94Cameroon 4109.30 164.79 2701.42 12.78Chad 1912.00 116.16 1894.49 8.97France 224.05 46.87 763.32 3.61Ghana 1133.38 36.43 602.14 2.85U K 102.38 35.79 590.32 2.79Ethiopia 438.00 20.23 331.64 1.57Senegal 740.43 19.28 317.89 1.50Tanzania Rep 296.45 13.40 216.45 1.02Others 463.94 34.07 559.90 2.65
Total 31007.75 1287.23 21130.14 100.00
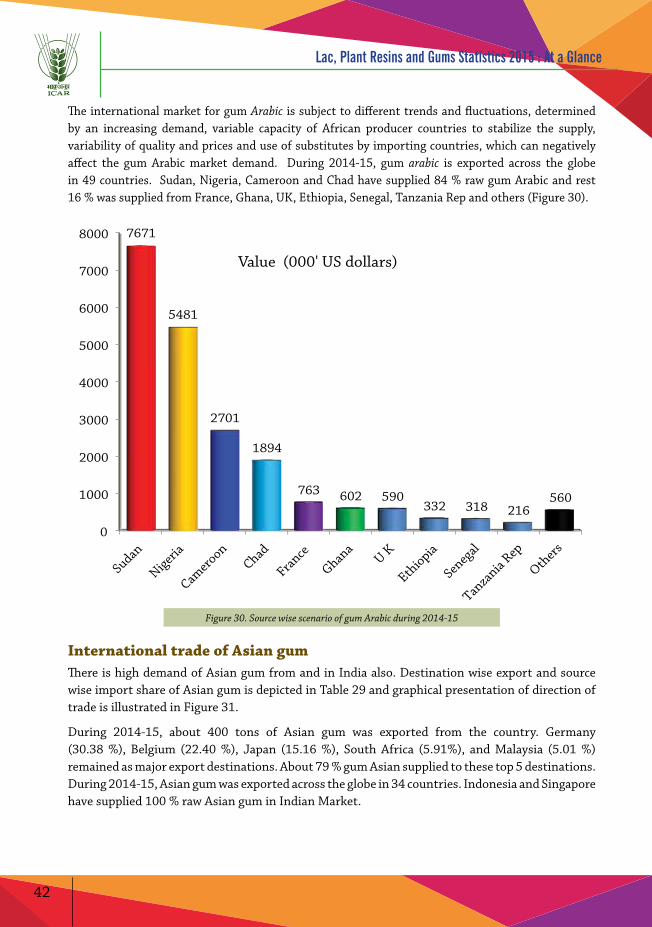
42
Lac, Plant Resins and Gums Statistics 2015 : At a Glance
The international market for gum Arabic is subject to different trends and fluctuations, determined by an increasing demand, variable capacity of African producer countries to stabilize the supply, variability of quality and prices and use of substitutes by importing countries, which can negatively affect the gum Arabic market demand. During 2014-15, gum arabic is exported across the globe in 49 countries. Sudan, Nigeria, Cameroon and Chad have supplied 84 % raw gum Arabic and rest 16 % was supplied from France, Ghana, UK, Ethiopia, Senegal, Tanzania Rep and others (Figure 30).
0
1000
Sudan
2000
3000
4000
5000
6000
7000
8000 7671
5481
2701
1894
763 602 590 332 318 216
560
Value (000' US dollars)
Nigeria
Camero
onChad
France
Ghana
U K
Ethiopia
Seneg
al
Tanza
nia Rep
Others
Figure 30. Source wise scenario of gum Arabic during 2014-15
International trade of Asian gum There is high demand of Asian gum from and in India also. Destination wise export and source wise import share of Asian gum is depicted in Table 29 and graphical presentation of direction of trade is illustrated in Figure 31.
During 2014-15, about 400 tons of Asian gum was exported from the country. Germany (30.38 %), Belgium (22.40 %), Japan (15.16 %), South Africa (5.91%), and Malaysia (5.01 %) remained as major export destinations. About 79 % gum Asian supplied to these top 5 destinations. During 2014-15, Asian gum was exported across the globe in 34 countries. Indonesia and Singapore have supplied 100 % raw Asian gum in Indian Market.
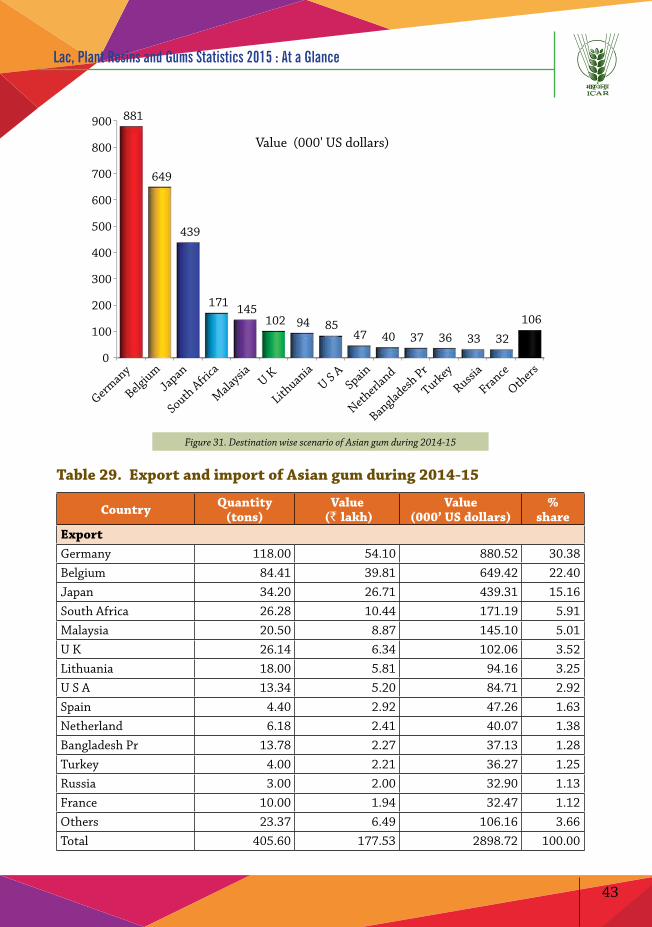
43
Lac, Plant Resins and Gums Statistics 2015 : At a Glance
0
100
200
300
400
500
600
700
800
900 881
649
439
171
Germany
Belgium
Japan
South Afri
ca
Malaysia U K
U S ASpain
Netherl
and
Bangladesh Pr
Turkey
Russia
France
Others
Lithuania
145 102 94 85
47 40 37 36 33 32
106
Value (000' US dollars)
Figure 31. Destination wise scenario of Asian gum during 2014-15
Table 29. Export and import of Asian gum during 2014-15
Country Quantity (tons)
Value (` lakh)
Value (000’ US dollars)
% share
ExportGermany 118.00 54.10 880.52 30.38Belgium 84.41 39.81 649.42 22.40Japan 34.20 26.71 439.31 15.16South Africa 26.28 10.44 171.19 5.91Malaysia 20.50 8.87 145.10 5.01U K 26.14 6.34 102.06 3.52Lithuania 18.00 5.81 94.16 3.25U S A 13.34 5.20 84.71 2.92Spain 4.40 2.92 47.26 1.63Netherland 6.18 2.41 40.07 1.38Bangladesh Pr 13.78 2.27 37.13 1.28Turkey 4.00 2.21 36.27 1.25Russia 3.00 2.00 32.90 1.13France 10.00 1.94 32.47 1.12Others 23.37 6.49 106.16 3.66Total 405.60 177.53 2898.72 100.00
44
Lac, Plant Resins and Gums Statistics 2015 : At a Glance
Country Quantity (tons)
Value (` lakh)
Value (000’ US dollars)
% share
Import
Indonesia 25.00 1.98 32.58 63.10
Singapore 21.97 1.17 19.05 36.90
Total 46.97 3.15 51.63 100.00
International trade of African gum In India, African gum is supplied from Chad (63.66%) and Senegal (36.34%). It is evident from the Table 30 that Kenya (98.38%) and Uganda (1.62%) are the major export destination of African gum.
Table 30. Export and import of African gum during 2014-15
CountryQuantity
(tons)Value
(` lakh)Value
(000’ US dollars)%
share
Export
Kenya 0.49 0.08 1.28 98.38
Uganda 0.01 0.00 0.02 1.62
Total 0.50 0.08 1.30 100.00
Import
Chad 205.00 5.90 97.98 63.66
Senegal 110.00 3.39 55.92 36.34
Total 315.00 9.29 153.91 100.00
Jhingan gum (Lannea coromandelica)
Lannea coromandelica (Jhingan, Indian Ash Tree, Moi tree) is a deciduous tree which grows upto 14 m height. Jhingan gum is mostly obtained from natural exudation and sometimes by tapping and annual gum production is about 60-80 tons in India. It is used as an alternative to gum arabic in food and other purposes. It was found that the emulsion containing jhingan gum produced more stable emulsion at a much lower amount as compared to the emulsion stabilized by gum acacia.
Production and export performance of agarbathi industry depends on availability of forest based raw materials. Indiscriminate collection is leading to overexploitation and shortage of raw materials particularly, the basic binding material which is the bark (Jigat) of slow growing evergreen tree Machilus macrantha. Amongst the various plant materials screened, Lannea coromandelica syn. Odina wodier (Moyna or Jinghan) gum in combination with Jigat in 1:1 ratio was found to be a good partial substitute and agarbathis rolled using this mixture cost 20% less than those rolled with pure jigat.
45
Lac, Plant Resins and Gums Statistics 2015 : At a Glance
Saja (Terminalia tomentosa)
Terminalia tomentosa (Saja, Saj) is a tree growing upto 30 m tall, with a trunk upto diameter of 1 m. A copious transparent gum exudes in large globular tears from the trunk. In India, the annual gum production is about 30-40 tons. It is used as incense and cosmetic. Terminalia tomentosa has a remarkable attribute as some members of the species store water in the dry season.
Tragacanth (Adracanth) (Astragalus gummifer)
Tragacanth gum (TG) is a natural and acidic polysaccharide that secretes spontaneously or with a scratch on the different species of Astragalus plant. Astragalus gummifer is the most famous species of this plant. TG obtained in two different forms: ribbon and flake. The name tragacanth is originated from two Greek words of tragos (goat) and akantha (thorn) showing its curved shape. TG is almost insoluble in water, but swells to form a stiff gel due to its structure. TG has been accepted since 1961 as generally recognized as safe (GRAS) at the level of 0.2–1.3% and in Europe has E-number E413 on the list of additives approved by the Scientific Committee for Food of the European Community. TG is widely used in various fields such as food, pharmaceuticals and cosmetics industries acting as the stabilizer, emulsifier, thickener, fat replacer and cross-linking agent. In recent years, several works are reported on the application of TG in the wound and burn dressing, synthesis of silver nanoparticles, hydrogel membranes, superabsorbent hydrogel, matrix of verapamil hydrochloride tablets, matrix for cell immobilization and drug encapsulation. Encapsulation is a technique of preparing the tiny package materials such as pharmaceuticals, enzymes, dyes and flavorsto protect from the external environment. EXIM scenario of Tragacanth (Adracanth) during 2014-15 is given in Table 31.
Table 31. Export and import of Tragacanth (Adracanth) during 2014-15
CountryQuantity
(tons)Value
(` lakh)Value
(000’ US dollars)%
share
ExportTanzania Rep 0.10 0.01 0.24 60.05U S A 0.02 0.01 0.15 37.40Israel 0.00 0.00 0.01 2.54
Total 0.12 0.02 0.39 100.00
ImportU A E 2.32 0.16 2.74 53.66Germany 0.02 0.15 2.37 46.34Total 2.35 0.31 5.11 100.00
Xanthun gum
Xanthan gum is a polysaccharide secreted by the bacterium Xanthomonas campestris, used as a food additive and rheology modifier, commonly used as a food thickening agent. Xanthan gum was discovered by Allene Rosalind Jeanes. It was brought into commercial production under the
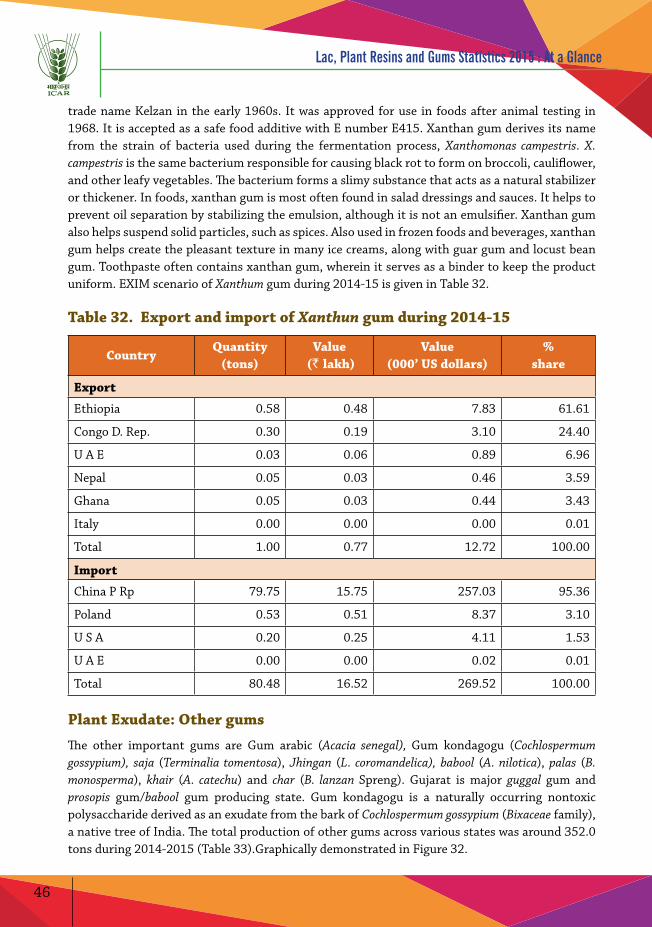
46
Lac, Plant Resins and Gums Statistics 2015 : At a Glance
trade name Kelzan in the early 1960s. It was approved for use in foods after animal testing in 1968. It is accepted as a safe food additive with E number E415. Xanthan gum derives its name from the strain of bacteria used during the fermentation process, Xanthomonas campestris. X. campestris is the same bacterium responsible for causing black rot to form on broccoli, cauliflower, and other leafy vegetables. The bacterium forms a slimy substance that acts as a natural stabilizer or thickener. In foods, xanthan gum is most often found in salad dressings and sauces. It helps to prevent oil separation by stabilizing the emulsion, although it is not an emulsifier. Xanthan gum also helps suspend solid particles, such as spices. Also used in frozen foods and beverages, xanthan gum helps create the pleasant texture in many ice creams, along with guar gum and locust bean gum. Toothpaste often contains xanthan gum, wherein it serves as a binder to keep the product uniform. EXIM scenario of Xanthum gum during 2014-15 is given in Table 32.
Table 32. Export and import of Xanthun gum during 2014-15
CountryQuantity
(tons)Value
(` lakh)Value
(000’ US dollars)%
share
Export
Ethiopia 0.58 0.48 7.83 61.61
Congo D. Rep. 0.30 0.19 3.10 24.40
U A E 0.03 0.06 0.89 6.96
Nepal 0.05 0.03 0.46 3.59
Ghana 0.05 0.03 0.44 3.43
Italy 0.00 0.00 0.00 0.01
Total 1.00 0.77 12.72 100.00
Import
China P Rp 79.75 15.75 257.03 95.36
Poland 0.53 0.51 8.37 3.10
U S A 0.20 0.25 4.11 1.53
U A E 0.00 0.00 0.02 0.01
Total 80.48 16.52 269.52 100.00
Plant Exudate: Other gums
The other important gums are Gum arabic (Acacia senegal), Gum kondagogu (Cochlospermum gossypium), saja (Terminalia tomentosa), Jhingan (L. coromandelica), babool (A. nilotica), palas (B. monosperma), khair (A. catechu) and char (B. lanzan Spreng). Gujarat is major guggal gum and prosopis gum/babool gum producing state. Gum kondagogu is a naturally occurring nontoxic polysaccharide derived as an exudate from the bark of Cochlospermum gossypium (Bixaceae family), a native tree of India. The total production of other gums across various states was around 352.0 tons during 2014-2015 (Table 33).Graphically demonstrated in Figure 32.
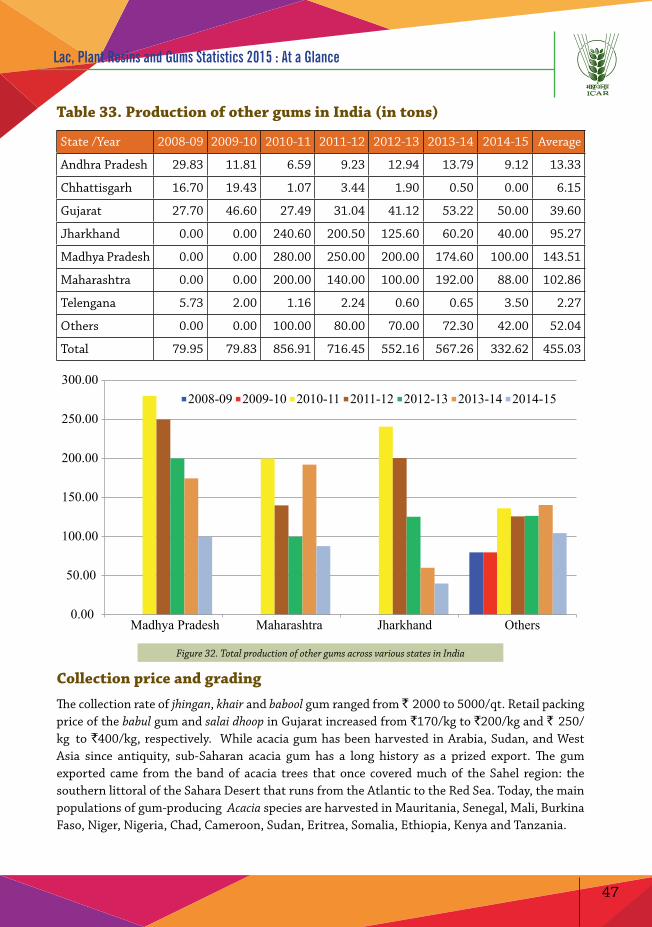
47
Lac, Plant Resins and Gums Statistics 2015 : At a Glance
Table 33. Production of other gums in India (in tons)
State /Year 2008-09 2009-10 2010-11 2011-12 2012-13 2013-14 2014-15 Average
Andhra Pradesh 29.83 11.81 6.59 9.23 12.94 13.79 9.12 13.33
Chhattisgarh 16.70 19.43 1.07 3.44 1.90 0.50 0.00 6.15
Gujarat 27.70 46.60 27.49 31.04 41.12 53.22 50.00 39.60
Jharkhand 0.00 0.00 240.60 200.50 125.60 60.20 40.00 95.27
Madhya Pradesh 0.00 0.00 280.00 250.00 200.00 174.60 100.00 143.51
Maharashtra 0.00 0.00 200.00 140.00 100.00 192.00 88.00 102.86
Telengana 5.73 2.00 1.16 2.24 0.60 0.65 3.50 2.27
Others 0.00 0.00 100.00 80.00 70.00 72.30 42.00 52.04
Total 79.95 79.83 856.91 716.45 552.16 567.26 332.62 455.03
0.00
50.00
100.00
150.00
200.00
250.00
300.00
Madhya Pradesh Maharashtra Jharkhand Others
2008-09 2009-10 2010-11 2011-12 2012-13 2013-14 2014-15
Figure 32. Total production of other gums across various states in India
Collection price and grading
The collection rate of jhingan, khair and babool gum ranged from ` 2000 to 5000/qt. Retail packing price of the babul gum and salai dhoop in Gujarat increased from `170/kg to `200/kg and ` 250/kg to `400/kg, respectively. While acacia gum has been harvested in Arabia, Sudan, and West Asia since antiquity, sub-Saharan acacia gum has a long history as a prized export. The gum exported came from the band of acacia trees that once covered much of the Sahel region: the southern littoral of the Sahara Desert that runs from the Atlantic to the Red Sea. Today, the main populations of gum-producing Acacia species are harvested in Mauritania, Senegal, Mali, Burkina Faso, Niger, Nigeria, Chad, Cameroon, Sudan, Eritrea, Somalia, Ethiopia, Kenya and Tanzania.
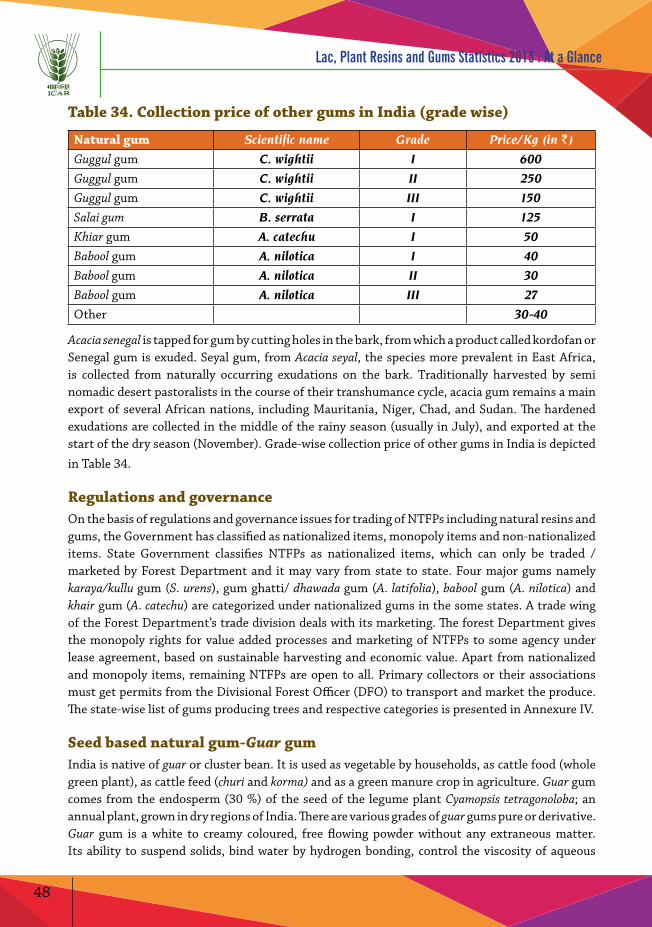
48
Lac, Plant Resins and Gums Statistics 2015 : At a Glance
Table 34. Collection price of other gums in India (grade wise)
Natural gum Scientific name Grade Price/Kg (in `)
Guggul gum C. wightii I 600
Guggul gum C. wightii II 250
Guggul gum C. wightii III 150
Salai gum B. serrata I 125
Khiar gum A. catechu I 50
Babool gum A. nilotica I 40
Babool gum A. nilotica II 30
Babool gum A. nilotica III 27
Other 30-40
Acacia senegal is tapped for gum by cutting holes in the bark, from which a product called kordofan or Senegal gum is exuded. Seyal gum, from Acacia seyal, the species more prevalent in East Africa, is collected from naturally occurring exudations on the bark. Traditionally harvested by semi nomadic desert pastoralists in the course of their transhumance cycle, acacia gum remains a main export of several African nations, including Mauritania, Niger, Chad, and Sudan. The hardened exudations are collected in the middle of the rainy season (usually in July), and exported at the start of the dry season (November). Grade-wise collection price of other gums in India is depicted
in Table 34.
Regulations and governanceOn the basis of regulations and governance issues for trading of NTFPs including natural resins and gums, the Government has classified as nationalized items, monopoly items and non-nationalized items. State Government classifies NTFPs as nationalized items, which can only be traded / marketed by Forest Department and it may vary from state to state. Four major gums namely karaya/kullu gum (S. urens), gum ghatti/ dhawada gum (A. latifolia), babool gum (A. nilotica) and khair gum (A. catechu) are categorized under nationalized gums in the some states. A trade wing of the Forest Department’s trade division deals with its marketing. The forest Department gives the monopoly rights for value added processes and marketing of NTFPs to some agency under lease agreement, based on sustainable harvesting and economic value. Apart from nationalized and monopoly items, remaining NTFPs are open to all. Primary collectors or their associations must get permits from the Divisional Forest Officer (DFO) to transport and market the produce. The state-wise list of gums producing trees and respective categories is presented in Annexure IV.
Seed based natural gum-Guar gumIndia is native of guar or cluster bean. It is used as vegetable by households, as cattle food (whole green plant), as cattle feed (churi and korma) and as a green manure crop in agriculture. Guar gum comes from the endosperm (30 %) of the seed of the legume plant Cyamopsis tetragonoloba; an annual plant, grown in dry regions of India. There are various grades of guar gums pure or derivative. Guar gum is a white to creamy coloured, free flowing powder without any extraneous matter. Its ability to suspend solids, bind water by hydrogen bonding, control the viscosity of aqueous
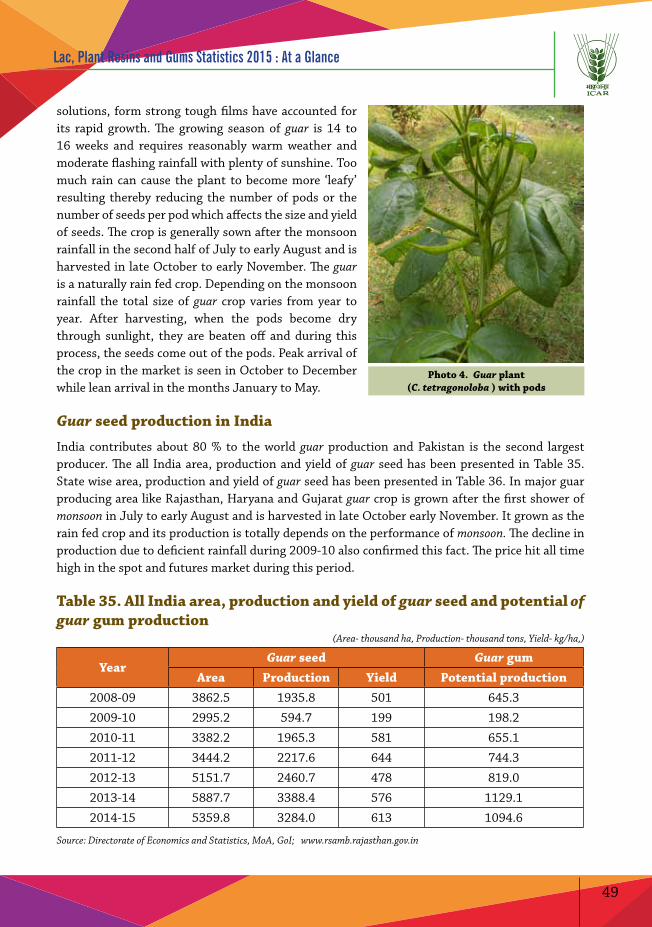
49
Lac, Plant Resins and Gums Statistics 2015 : At a Glance
solutions, form strong tough films have accounted for its rapid growth. The growing season of guar is 14 to 16 weeks and requires reasonably warm weather and moderate flashing rainfall with plenty of sunshine. Too much rain can cause the plant to become more ‘leafy’ resulting thereby reducing the number of pods or the number of seeds per pod which affects the size and yield of seeds. The crop is generally sown after the monsoon rainfall in the second half of July to early August and is harvested in late October to early November. The guar is a naturally rain fed crop. Depending on the monsoon rainfall the total size of guar crop varies from year to year. After harvesting, when the pods become dry through sunlight, they are beaten off and during this process, the seeds come out of the pods. Peak arrival of the crop in the market is seen in October to December while lean arrival in the months January to May.
Guar seed production in India
India contributes about 80 % to the world guar production and Pakistan is the second largest producer. The all India area, production and yield of guar seed has been presented in Table 35. State wise area, production and yield of guar seed has been presented in Table 36. In major guar producing area like Rajasthan, Haryana and Gujarat guar crop is grown after the first shower of monsoon in July to early August and is harvested in late October early November. It grown as the rain fed crop and its production is totally depends on the performance of monsoon. The decline in production due to deficient rainfall during 2009-10 also confirmed this fact. The price hit all time high in the spot and futures market during this period.
Table 35. All India area, production and yield of guar seed and potential of guar gum production
(Area- thousand ha, Production- thousand tons, Yield- kg/ha,)
YearGuar seed Guar gum
Area Production Yield Potential production 2008-09 3862.5 1935.8 501 645.3
2009-10 2995.2 594.7 199 198.2
2010-11 3382.2 1965.3 581 655.1
2011-12 3444.2 2217.6 644 744.3
2012-13 5151.7 2460.7 478 819.0
2013-14 5887.7 3388.4 576 1129.1
2014-15 5359.8 3284.0 613 1094.6
Source: Directorate of Economics and Statistics, MoA, GoI; www.rsamb.rajasthan.gov.in
Photo 4. Guar plant (C. tetragonoloba ) with pods
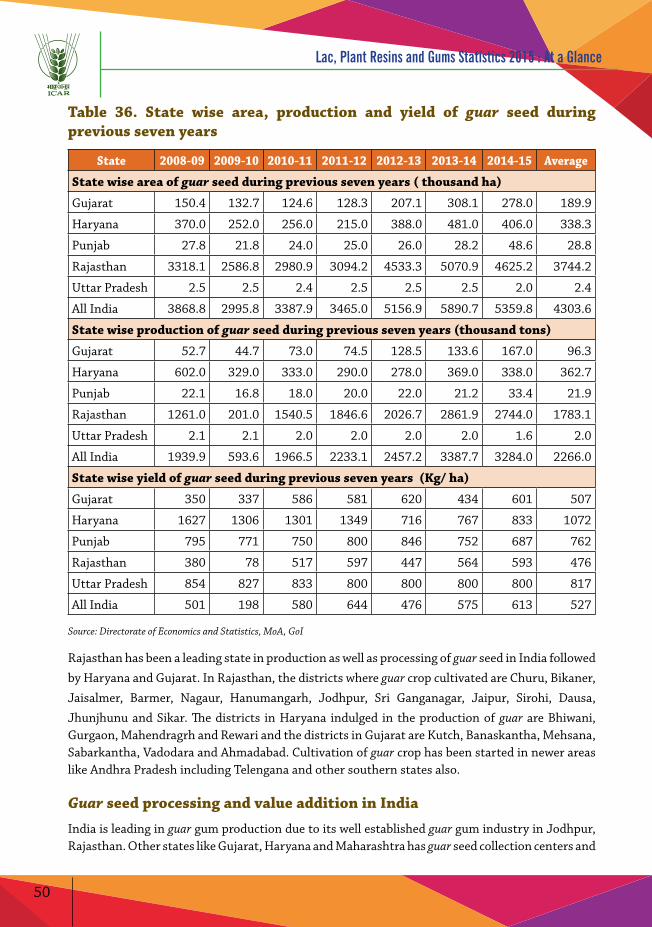
50
Lac, Plant Resins and Gums Statistics 2015 : At a Glance
Table 36. State wise area, production and yield of guar seed during previous seven years
State 2008-09 2009-10 2010-11 2011-12 2012-13 2013-14 2014-15 Average
State wise area of guar seed during previous seven years ( thousand ha)
Gujarat 150.4 132.7 124.6 128.3 207.1 308.1 278.0 189.9
Haryana 370.0 252.0 256.0 215.0 388.0 481.0 406.0 338.3
Punjab 27.8 21.8 24.0 25.0 26.0 28.2 48.6 28.8
Rajasthan 3318.1 2586.8 2980.9 3094.2 4533.3 5070.9 4625.2 3744.2
Uttar Pradesh 2.5 2.5 2.4 2.5 2.5 2.5 2.0 2.4
All India 3868.8 2995.8 3387.9 3465.0 5156.9 5890.7 5359.8 4303.6
State wise production of guar seed during previous seven years (thousand tons)
Gujarat 52.7 44.7 73.0 74.5 128.5 133.6 167.0 96.3
Haryana 602.0 329.0 333.0 290.0 278.0 369.0 338.0 362.7
Punjab 22.1 16.8 18.0 20.0 22.0 21.2 33.4 21.9
Rajasthan 1261.0 201.0 1540.5 1846.6 2026.7 2861.9 2744.0 1783.1
Uttar Pradesh 2.1 2.1 2.0 2.0 2.0 2.0 1.6 2.0
All India 1939.9 593.6 1966.5 2233.1 2457.2 3387.7 3284.0 2266.0
State wise yield of guar seed during previous seven years (Kg/ ha)
Gujarat 350 337 586 581 620 434 601 507
Haryana 1627 1306 1301 1349 716 767 833 1072
Punjab 795 771 750 800 846 752 687 762
Rajasthan 380 78 517 597 447 564 593 476
Uttar Pradesh 854 827 833 800 800 800 800 817
All India 501 198 580 644 476 575 613 527
Source: Directorate of Economics and Statistics, MoA, GoI
Rajasthan has been a leading state in production as well as processing of guar seed in India followed
by Haryana and Gujarat. In Rajasthan, the districts where guar crop cultivated are Churu, Bikaner,
Jaisalmer, Barmer, Nagaur, Hanumangarh, Jodhpur, Sri Ganganagar, Jaipur, Sirohi, Dausa,
Jhunjhunu and Sikar. The districts in Haryana indulged in the production of guar are Bhiwani, Gurgaon, Mahendragrh and Rewari and the districts in Gujarat are Kutch, Banaskantha, Mehsana, Sabarkantha, Vadodara and Ahmadabad. Cultivation of guar crop has been started in newer areas like Andhra Pradesh including Telengana and other southern states also.
Guar seed processing and value addition in India
India is leading in guar gum production due to its well established guar gum industry in Jodhpur, Rajasthan. Other states like Gujarat, Haryana and Maharashtra has guar seed collection centers and
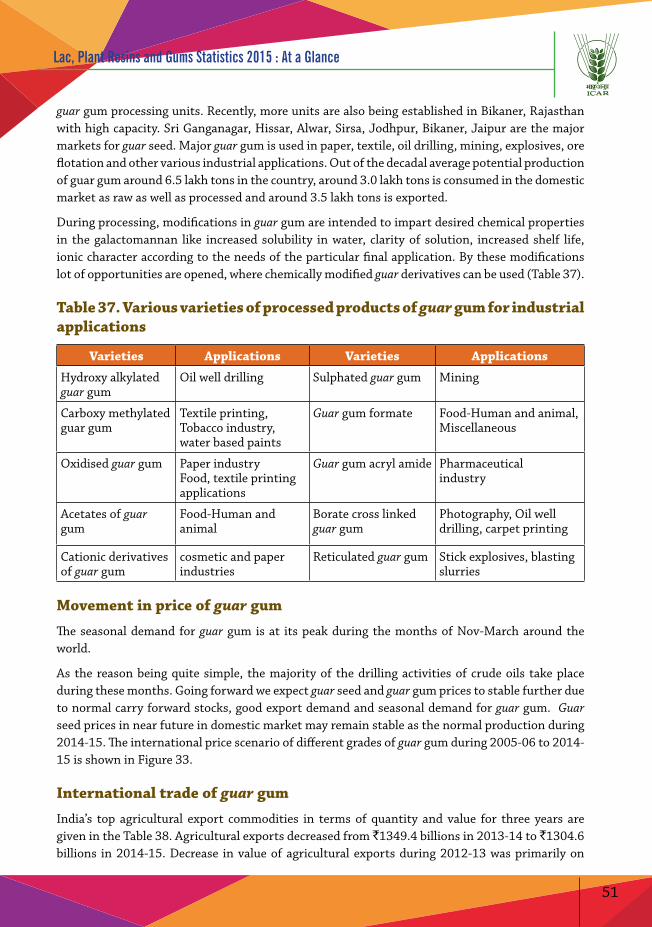
51
Lac, Plant Resins and Gums Statistics 2015 : At a Glance
guar gum processing units. Recently, more units are also being established in Bikaner, Rajasthan with high capacity. Sri Ganganagar, Hissar, Alwar, Sirsa, Jodhpur, Bikaner, Jaipur are the major markets for guar seed. Major guar gum is used in paper, textile, oil drilling, mining, explosives, ore flotation and other various industrial applications. Out of the decadal average potential production of guar gum around 6.5 lakh tons in the country, around 3.0 lakh tons is consumed in the domestic market as raw as well as processed and around 3.5 lakh tons is exported.
During processing, modifications in guar gum are intended to impart desired chemical properties in the galactomannan like increased solubility in water, clarity of solution, increased shelf life, ionic character according to the needs of the particular final application. By these modifications lot of opportunities are opened, where chemically modified guar derivatives can be used (Table 37).
Table 37. Various varieties of processed products of guar gum for industrial applications
Varieties Applications Varieties Applications
Hydroxy alkylated guar gum
Oil well drilling Sulphated guar gum Mining
Carboxy methylated guar gum
Textile printing, Tobacco industry, water based paints
Guar gum formate Food-Human and animal, Miscellaneous
Oxidised guar gum Paper industryFood, textile printing applications
Guar gum acryl amide Pharmaceuticalindustry
Acetates of guar gum
Food-Human and animal
Borate cross linked guar gum
Photography, Oil well drilling, carpet printing
Cationic derivatives of guar gum
cosmetic and paper industries
Reticulated guar gum Stick explosives, blasting slurries
Movement in price of guar gum
The seasonal demand for guar gum is at its peak during the months of Nov-March around the world.
As the reason being quite simple, the majority of the drilling activities of crude oils take place during these months. Going forward we expect guar seed and guar gum prices to stable further due to normal carry forward stocks, good export demand and seasonal demand for guar gum. Guar seed prices in near future in domestic market may remain stable as the normal production during 2014-15. The international price scenario of different grades of guar gum during 2005-06 to 2014-15 is shown in Figure 33.
International trade of guar gum
India’s top agricultural export commodities in terms of quantity and value for three years are given in the Table 38. Agricultural exports decreased from `1349.4 billions in 2013-14 to `1304.6 billions in 2014-15. Decrease in value of agricultural exports during 2012-13 was primarily on
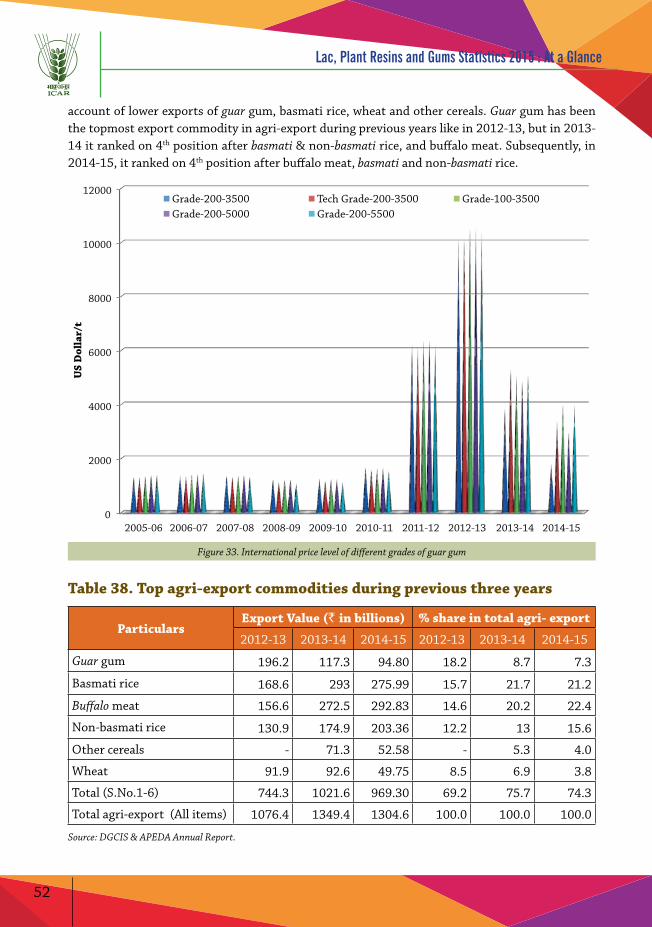
52
Lac, Plant Resins and Gums Statistics 2015 : At a Glance
account of lower exports of guar gum, basmati rice, wheat and other cereals. Guar gum has been the topmost export commodity in agri-export during previous years like in 2012-13, but in 2013-14 it ranked on 4th position after basmati & non-basmati rice, and buffalo meat. Subsequently, in 2014-15, it ranked on 4th position after buffalo meat, basmati and non-basmati rice.
0
2000
4000
6000
8000
10000
12000
2005-06 2006-07 2007-08 2008-09 2009-10 2010-11 2011-12 2012-13 2013-14 2014-15
US
Dol
lar/
t
Grade-200-3500 Tech Grade-200-3500 Grade-100-3500 Grade-200-5000 Grade-200-5500
Figure 33. International price level of different grades of guar gum
Table 38. Top agri-export commodities during previous three years
ParticularsExport Value (` in billions) % share in total agri- export
2012-13 2013-14 2014-15 2012-13 2013-14 2014-15
Guar gum 196.2 117.3 94.80 18.2 8.7 7.3
Basmati rice 168.6 293 275.99 15.7 21.7 21.2
Buffalo meat 156.6 272.5 292.83 14.6 20.2 22.4
Non-basmati rice 130.9 174.9 203.36 12.2 13 15.6
Other cereals - 71.3 52.58 - 5.3 4.0
Wheat 91.9 92.6 49.75 8.5 6.9 3.8
Total (S.No.1-6) 744.3 1021.6 969.30 69.2 75.7 74.3
Total agri-export (All items) 1076.4 1349.4 1304.6 100.0 100.0 100.0
Source: DGCIS & APEDA Annual Report.
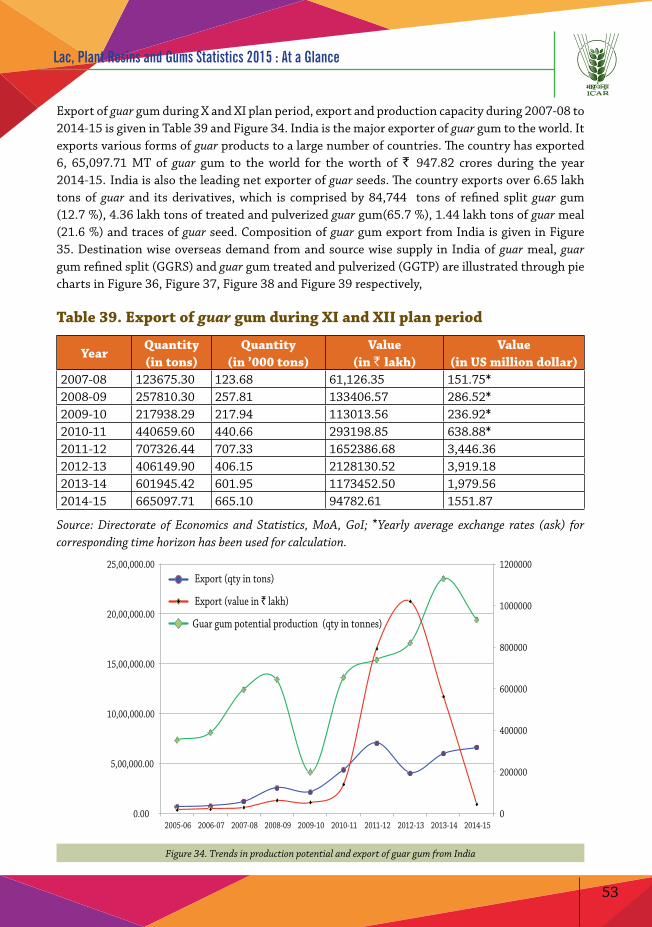
53
Lac, Plant Resins and Gums Statistics 2015 : At a Glance
Export of guar gum during X and XI plan period, export and production capacity during 2007-08 to 2014-15 is given in Table 39 and Figure 34. India is the major exporter of guar gum to the world. It exports various forms of guar products to a large number of countries. The country has exported 6, 65,097.71 MT of guar gum to the world for the worth of ` 947.82 crores during the year 2014-15. India is also the leading net exporter of guar seeds. The country exports over 6.65 lakh tons of guar and its derivatives, which is comprised by 84,744 tons of refined split guar gum (12.7 %), 4.36 lakh tons of treated and pulverized guar gum(65.7 %), 1.44 lakh tons of guar meal (21.6 %) and traces of guar seed. Composition of guar gum export from India is given in Figure 35. Destination wise overseas demand from and source wise supply in India of guar meal, guar gum refined split (GGRS) and guar gum treated and pulverized (GGTP) are illustrated through pie charts in Figure 36, Figure 37, Figure 38 and Figure 39 respectively,
Table 39. Export of guar gum during XI and XII plan period
YearQuantity(in tons)
Quantity(in ’000 tons)
Value(in ` lakh)
Value(in US million dollar)
2007-08 123675.30 123.68 61,126.35 151.75*2008-09 257810.30 257.81 133406.57 286.52*2009-10 217938.29 217.94 113013.56 236.92*2010-11 440659.60 440.66 293198.85 638.88*2011-12 707326.44 707.33 1652386.68 3,446.362012-13 406149.90 406.15 2128130.52 3,919.182013-14 601945.42 601.95 1173452.50 1,979.562014-15 665097.71 665.10 94782.61 1551.87
Source: Directorate of Economics and Statistics, MoA, GoI; *Yearly average exchange rates (ask) for corresponding time horizon has been used for calculation.
0
200000
400000
600000
800000
1000000
1200000
0.00
5,00,000.00
10,00,000.00
15,00,000.00
20,00,000.00
25,00,000.00
2005-06 2006-07 2007-08 2008-09 2009-10 2010-11 2011-12 2012-13 2013-14 2014-15
Export (qty in tons)
Export (value in ` lakh)
Guar gum potential production (qty in tonnes)
Figure 34. Trends in production potential and export of guar gum from India
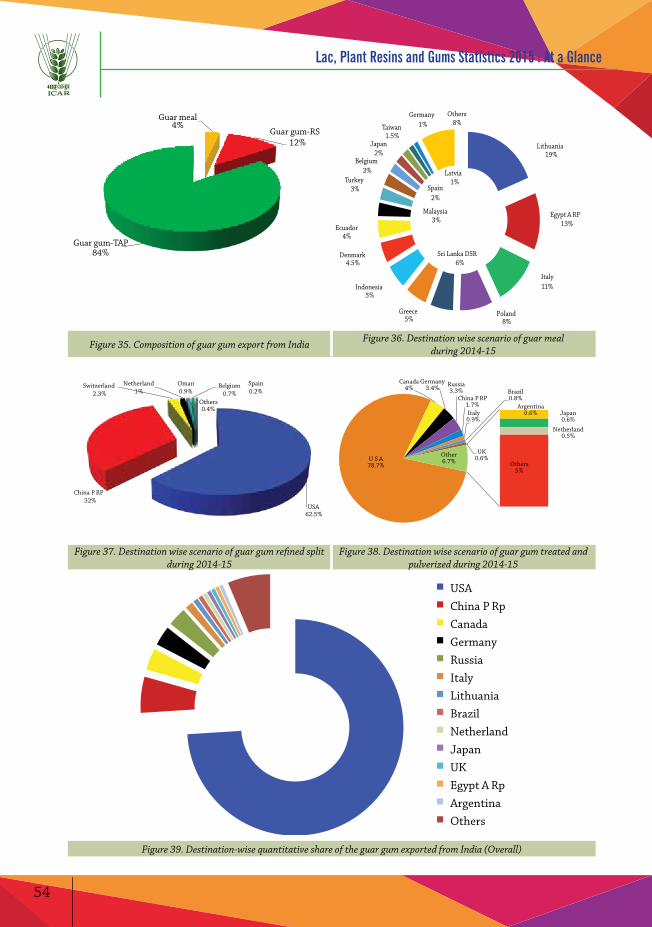
54
Lac, Plant Resins and Gums Statistics 2015 : At a Glance
Guar meal 4%
Guar gum-RS 12%
Guar gum-TAP 84%
Lithuania 19%
Egypt A RP 13%
Italy 11%
Poland 8%
Sri Lanka DSR 6%
Greece 5%
Indonesia 5%
Denmark 4.5%
Ecuador 4%
Malaysia 3%
Turkey 3%
Belgium 3%
Spain 2%
Japan 2%
Taiwan 1.5%
Latvia 1%
Germany 1%
Others 8%
Figure 35. Composition of guar gum export from IndiaFigure 36. Destination wise scenario of guar meal
during 2014-15
USA 62.5%
China P RP 32%
Switzerland 2.3%
Netherland 1%
Oman 0.9%
Belgium 0.7%
Spain 0.2%
Others 0.4%
U S A78.7%
Canada4%
Germany3.4% Russia
3.3%China P RP
1.7%Italy0.9%
Brazil0.8%
UK0.6%
Argentina0.6% Japan
0.6%
Netherland0.5%
Others5%
Other6.7%
Figure 37. Destination wise scenario of guar gum refined split during 2014-15
Figure 38. Destination wise scenario of guar gum treated and pulverized during 2014-15
USA China P Rp Canada Germany Russia Italy Lithuania Brazil Netherland Japan UK Egypt A Rp Argentina Others
Figure 39. Destination-wise quantitative share of the guar gum exported from India (Overall)
55
Lac, Plant Resins and Gums Statistics 2015 : At a Glance
United States, China, Canada, Germany, Russia, Italy, Lithuania, Brazil, Netherland, Japan and UK remained as major export destinations in 2014-15. Canada, Lithuania, Egypt and Argentina were the new entrants in top export destinations during 2014-15. During 2014-15, guar gum was exported across the globe to 103 countries. About 94 % was exported to top 13 countries and rest 6 % was exported to 90 countries around the world. Other countries are Poland, Korea, Netherland, Lithuania, U.K., Brazil, Philippines, Japan, Thailand, Argentina, U.A.E., Belgium, Australia, Switzerland, South Africa, Bulgaria, Mexico, Denmark, Ecuador, Iran, France, Cyprus, Chile, Bangladesh, Spain, Singapore, Vietnam, Saudi Arabia, Colombia, Nigeria, Pakistan, etc. Destination wise export share is depicted in Figure 20.
C) Natural gum resins
Under this category, asafoetida, salai gum and myrrh are the major gum resins. About 11000 tons of the gum resins exported from the country and `630 million earned as a foreign exchange.
Salai gum
Salai gum (Boswellia serrata) Frankincense, also known as Olibanum, is an aromatic oleogum resin obtained as pale yellow to red tears from the bark of trees belonging to the genera Boswellia of the Burseraceae family thriving in arid regions in the horn of Africa and southern Arabia. There are 43 different reported species in India, Arabian Peninsula and North Africa. Olibanum is produced in a restricted geographical area from uncultivated trees, and usually collected by small nomadic groups; the name is derived from the Arab word “al Luban”, which means milk and is references to the milky sap that, exudes from the tree upon incision. Appreciated by ancient civilizations, Boswellia resins ranked along with gold and ivory, spices and textiles as valuables for trading and barter. It is generally composed of 5–9% essential oil, 65–85% alcohol-soluble resin and the remaining water-soluble gums. The essential oil of frankincense is produced by steam distillation of the tree resin.
Extracts from B. serrata resin are currently used in India for the treatment of rheumatic diseases and ulcerative colitis. Furthermore, the extracts and essential oils of frankincense have been used as antiseptic agents in mouthwash, in the treatment of cough and asthma and as a fixative in perfumes, soaps, creams, lotions and detergents. Today frankincense is widely employed in aromatherapy, Catholic Christian ceremonies as well as other religious and secular traditions (Camarda at al 2016). Recently, increasing interest in natural dietary and therapeutic preparations used as dietary supplements has been observed. One of them is frankincense. This traditional medicine of the East is believed to have anti-inflammatory, expectorant, antiseptic, and even anxiolytic and anti-neurotic effects. The main component of frankincense is oil (60%). It contains mono- (13%) and diterpenes (40%) as well as ethyl acetate (21.4%), octyl acetate (13.4%) and methylanisole (7.6%).
Production
Boswellia serrata (Family: Burseraceae) is a deciduous middle sized tree, which is mostly concentrated in tropical; parts of Asia and Africa. In India it occurs in dry hilly forests of Rajasthan, Madhya Pradesh, Gujarat, Bihar, Assam, Orrisa as well as central penisular regions of Andhra
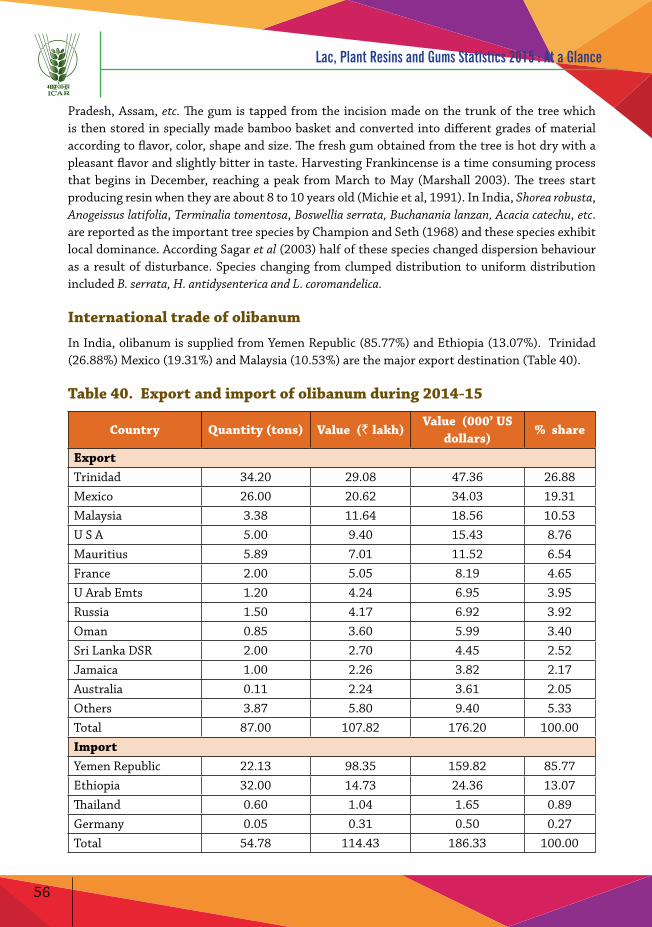
56
Lac, Plant Resins and Gums Statistics 2015 : At a Glance
Pradesh, Assam, etc. The gum is tapped from the incision made on the trunk of the tree which is then stored in specially made bamboo basket and converted into different grades of material according to flavor, color, shape and size. The fresh gum obtained from the tree is hot dry with a pleasant flavor and slightly bitter in taste. Harvesting Frankincense is a time consuming process that begins in December, reaching a peak from March to May (Marshall 2003). The trees start producing resin when they are about 8 to 10 years old (Michie et al, 1991). In India, Shorea robusta, Anogeissus latifolia, Terminalia tomentosa, Boswellia serrata, Buchanania lanzan, Acacia catechu, etc. are reported as the important tree species by Champion and Seth (1968) and these species exhibit local dominance. According Sagar et al (2003) half of these species changed dispersion behaviour as a result of disturbance. Species changing from clumped distribution to uniform distribution included B. serrata, H. antidysenterica and L. coromandelica.
International trade of olibanum
In India, olibanum is supplied from Yemen Republic (85.77%) and Ethiopia (13.07%). Trinidad (26.88%) Mexico (19.31%) and Malaysia (10.53%) are the major export destination (Table 40).
Table 40. Export and import of olibanum during 2014-15
Country Quantity (tons) Value (` lakh)Value (000’ US
dollars)% share
ExportTrinidad 34.20 29.08 47.36 26.88Mexico 26.00 20.62 34.03 19.31Malaysia 3.38 11.64 18.56 10.53U S A 5.00 9.40 15.43 8.76Mauritius 5.89 7.01 11.52 6.54France 2.00 5.05 8.19 4.65U Arab Emts 1.20 4.24 6.95 3.95Russia 1.50 4.17 6.92 3.92Oman 0.85 3.60 5.99 3.40Sri Lanka DSR 2.00 2.70 4.45 2.52Jamaica 1.00 2.26 3.82 2.17Australia 0.11 2.24 3.61 2.05Others 3.87 5.80 9.40 5.33Total 87.00 107.82 176.20 100.00ImportYemen Republic 22.13 98.35 159.82 85.77Ethiopia 32.00 14.73 24.36 13.07Thailand 0.60 1.04 1.65 0.89Germany 0.05 0.31 0.50 0.27Total 54.78 114.43 186.33 100.00

57
Lac, Plant Resins and Gums Statistics 2015 : At a Glance
Trinidad
Mexico
Malaysia
U S A
Mauritius
France
U Arab Emts
Russia
Oman
Sri Lanka DSR
Jamaica
Australia
Others
Figure 40. Destination-wise quantitative share of the olibanum exported from India
Myrrh
Myrrh comes from a small, thorny tree. Commiphora myrrha is the most species-rich genus of flowering plants in the frankincense and myrrh family, Burseraceae, which was cultivated in ancient times in the Arabian Peninsula. The grower made a small cut in the bark, where the resin would leak out. It was then collected and stored for about three months until it hardened into fragrant globules. Myrrh was used raw or crushed and mixed with oil to make perfume. Myrrh oil, which is steam distilled directly from the myrrh resin, has an aroma that is woody, earthy and a bit balsamic. Also, myrrh is occasionally used as a flavoring agent. Somalia and Ethiopia are major producers of the substance.
International trade of myrrh
In India, myrrh is supplied from Yemen Republic (94.07%) and Kenya (4.16%). Korea RP (81.74%), UK (4.85%) and Lebanon (4.36%) are the major export destination of myrrh (Table 41).
Asafoetida (Hing)
Asafoetida or asafetida (Ferula anthrax and F. foetida) also know as “Food of the Gods”, “Stinking Gum”, “Devil’s Dung” is the dried latex prepared from the rhizome of several Ferula species occurring in Asia and North Africa. It is popular spice used in daily food by Indians. It was found to contain mainly ferulic acid, umbellic acid and ketonic substance known as umbelliferone. Powder of Asafoetida is used as carminative, it is also used in fainting, flatulent colic and chronic bronchitis as well as it is used to treat asthma in adults (Kokate et al 2002). The drug is used as herbal remedy or spice especially in oriental countries since ancient times. In Germany the drug is known in mediaeval times. The spectrum of ingredients is characterized by a complex mixture
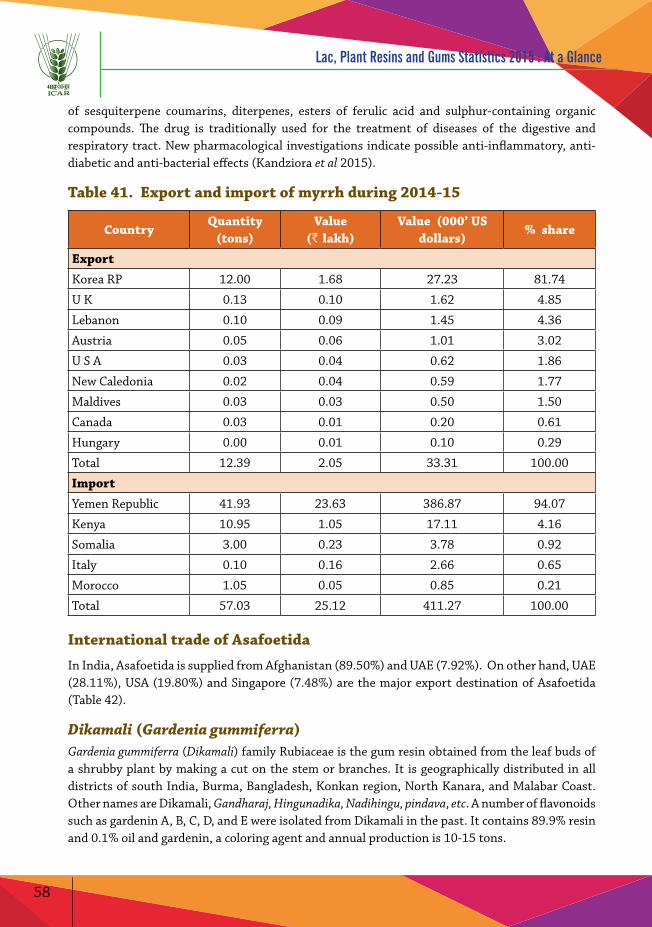
58
Lac, Plant Resins and Gums Statistics 2015 : At a Glance
of sesquiterpene coumarins, diterpenes, esters of ferulic acid and sulphur-containing organic compounds. The drug is traditionally used for the treatment of diseases of the digestive and respiratory tract. New pharmacological investigations indicate possible anti-inflammatory, anti-diabetic and anti-bacterial effects (Kandziora et al 2015).
Table 41. Export and import of myrrh during 2014-15
CountryQuantity
(tons)Value
(` lakh)Value (000’ US
dollars)% share
Export
Korea RP 12.00 1.68 27.23 81.74
U K 0.13 0.10 1.62 4.85
Lebanon 0.10 0.09 1.45 4.36
Austria 0.05 0.06 1.01 3.02
U S A 0.03 0.04 0.62 1.86
New Caledonia 0.02 0.04 0.59 1.77
Maldives 0.03 0.03 0.50 1.50
Canada 0.03 0.01 0.20 0.61
Hungary 0.00 0.01 0.10 0.29
Total 12.39 2.05 33.31 100.00
Import
Yemen Republic 41.93 23.63 386.87 94.07
Kenya 10.95 1.05 17.11 4.16
Somalia 3.00 0.23 3.78 0.92
Italy 0.10 0.16 2.66 0.65
Morocco 1.05 0.05 0.85 0.21
Total 57.03 25.12 411.27 100.00
International trade of Asafoetida
In India, Asafoetida is supplied from Afghanistan (89.50%) and UAE (7.92%). On other hand, UAE (28.11%), USA (19.80%) and Singapore (7.48%) are the major export destination of Asafoetida (Table 42).
Dikamali (Gardenia gummiferra)Gardenia gummiferra (Dikamali) family Rubiaceae is the gum resin obtained from the leaf buds of a shrubby plant by making a cut on the stem or branches. It is geographically distributed in all districts of south India, Burma, Bangladesh, Konkan region, North Kanara, and Malabar Coast. Other names are Dikamali, Gandharaj, Hingunadika, Nadihingu, pindava, etc. A number of flavonoids such as gardenin A, B, C, D, and E were isolated from Dikamali in the past. It contains 89.9% resin and 0.1% oil and gardenin, a coloring agent and annual production is 10-15 tons.
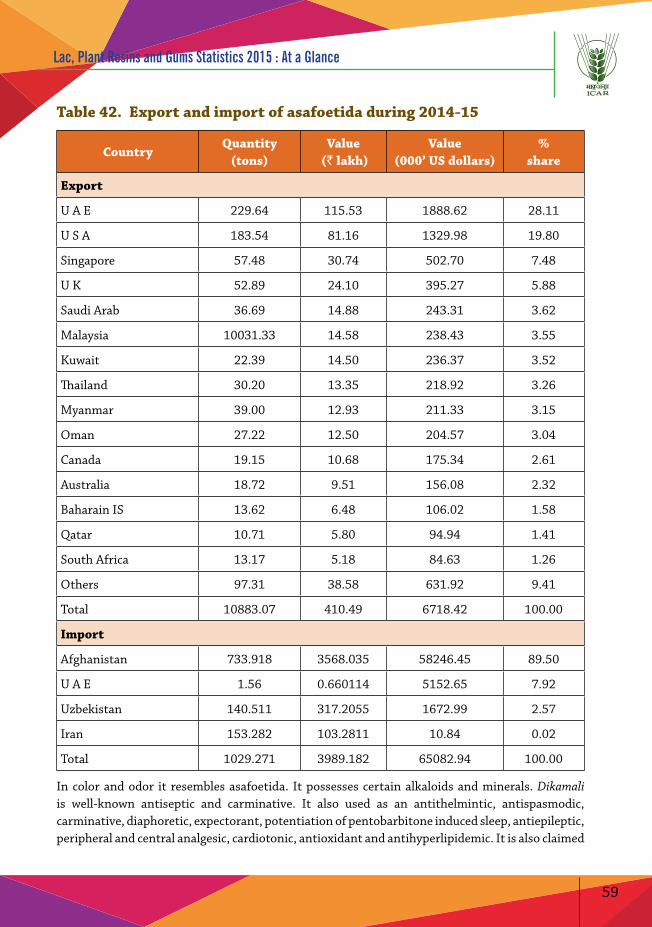
59
Lac, Plant Resins and Gums Statistics 2015 : At a Glance
Table 42. Export and import of asafoetida during 2014-15
CountryQuantity
(tons)Value
(` lakh)Value
(000’ US dollars)%
share
Export
U A E 229.64 115.53 1888.62 28.11
U S A 183.54 81.16 1329.98 19.80
Singapore 57.48 30.74 502.70 7.48
U K 52.89 24.10 395.27 5.88
Saudi Arab 36.69 14.88 243.31 3.62
Malaysia 10031.33 14.58 238.43 3.55
Kuwait 22.39 14.50 236.37 3.52
Thailand 30.20 13.35 218.92 3.26
Myanmar 39.00 12.93 211.33 3.15
Oman 27.22 12.50 204.57 3.04
Canada 19.15 10.68 175.34 2.61
Australia 18.72 9.51 156.08 2.32
Baharain IS 13.62 6.48 106.02 1.58
Qatar 10.71 5.80 94.94 1.41
South Africa 13.17 5.18 84.63 1.26
Others 97.31 38.58 631.92 9.41
Total 10883.07 410.49 6718.42 100.00
Import
Afghanistan 733.918 3568.035 58246.45 89.50
U A E 1.56 0.660114 5152.65 7.92
Uzbekistan 140.511 317.2055 1672.99 2.57
Iran 153.282 103.2811 10.84 0.02
Total 1029.271 3989.182 65082.94 100.00
In color and odor it resembles asafoetida. It possesses certain alkaloids and minerals. Dikamali is well-known antiseptic and carminative. It also used as an antithelmintic, antispasmodic, carminative, diaphoretic, expectorant, potentiation of pentobarbitone induced sleep, antiepileptic, peripheral and central analgesic, cardiotonic, antioxidant and antihyperlipidemic. It is also claimed
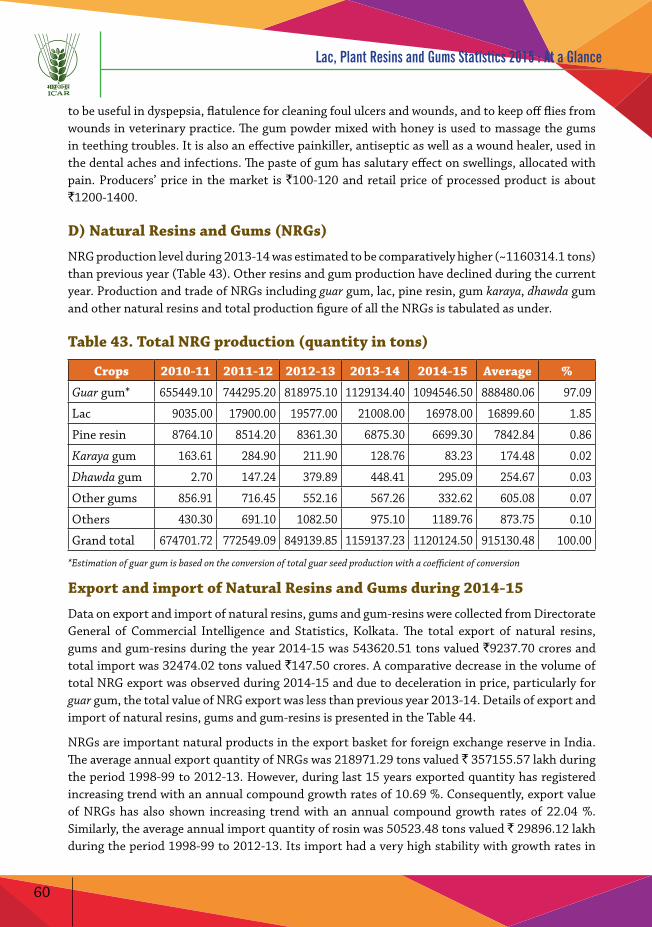
60
Lac, Plant Resins and Gums Statistics 2015 : At a Glance
to be useful in dyspepsia, flatulence for cleaning foul ulcers and wounds, and to keep off flies from wounds in veterinary practice. The gum powder mixed with honey is used to massage the gums in teething troubles. It is also an effective painkiller, antiseptic as well as a wound healer, used in the dental aches and infections. The paste of gum has salutary effect on swellings, allocated with pain. Producers’ price in the market is `100-120 and retail price of processed product is about `1200-1400.
D) Natural Resins and Gums (NRGs)
NRG production level during 2013-14 was estimated to be comparatively higher (~1160314.1 tons) than previous year (Table 43). Other resins and gum production have declined during the current year. Production and trade of NRGs including guar gum, lac, pine resin, gum karaya, dhawda gum and other natural resins and total production figure of all the NRGs is tabulated as under.
Table 43. Total NRG production (quantity in tons)
Crops 2010-11 2011-12 2012-13 2013-14 2014-15 Average %
Guar gum* 655449.10 744295.20 818975.10 1129134.40 1094546.50 888480.06 97.09
Lac 9035.00 17900.00 19577.00 21008.00 16978.00 16899.60 1.85
Pine resin 8764.10 8514.20 8361.30 6875.30 6699.30 7842.84 0.86
Karaya gum 163.61 284.90 211.90 128.76 83.23 174.48 0.02
Dhawda gum 2.70 147.24 379.89 448.41 295.09 254.67 0.03
Other gums 856.91 716.45 552.16 567.26 332.62 605.08 0.07
Others 430.30 691.10 1082.50 975.10 1189.76 873.75 0.10
Grand total 674701.72 772549.09 849139.85 1159137.23 1120124.50 915130.48 100.00
*Estimation of guar gum is based on the conversion of total guar seed production with a coefficient of conversion
Export and import of Natural Resins and Gums during 2014-15
Data on export and import of natural resins, gums and gum-resins were collected from Directorate General of Commercial Intelligence and Statistics, Kolkata. The total export of natural resins, gums and gum-resins during the year 2014-15 was 543620.51 tons valued `9237.70 crores and total import was 32474.02 tons valued `147.50 crores. A comparative decrease in the volume of total NRG export was observed during 2014-15 and due to deceleration in price, particularly for guar gum, the total value of NRG export was less than previous year 2013-14. Details of export and import of natural resins, gums and gum-resins is presented in the Table 44.
NRGs are important natural products in the export basket for foreign exchange reserve in India. The average annual export quantity of NRGs was 218971.29 tons valued ` 357155.57 lakh during the period 1998-99 to 2012-13. However, during last 15 years exported quantity has registered increasing trend with an annual compound growth rates of 10.69 %. Consequently, export value of NRGs has also shown increasing trend with an annual compound growth rates of 22.04 %. Similarly, the average annual import quantity of rosin was 50523.48 tons valued ` 29896.12 lakh during the period 1998-99 to 2012-13. Its import had a very high stability with growth rates in
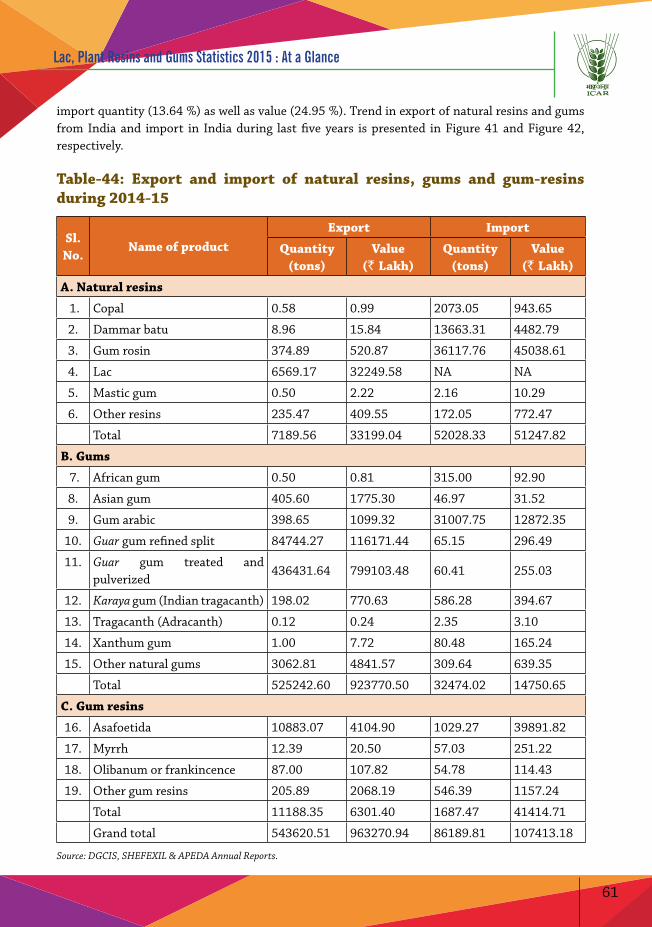
61
Lac, Plant Resins and Gums Statistics 2015 : At a Glance
import quantity (13.64 %) as well as value (24.95 %). Trend in export of natural resins and gums from India and import in India during last five years is presented in Figure 41 and Figure 42, respectively.
Table-44: Export and import of natural resins, gums and gum-resins during 2014-15
Sl. No.
Name of productExport Import
Quantity (tons)
Value(` Lakh)
Quantity (tons)
Value(` Lakh)
A. Natural resins
1. Copal 0.58 0.99 2073.05 943.65
2. Dammar batu 8.96 15.84 13663.31 4482.79
3. Gum rosin 374.89 520.87 36117.76 45038.61
4. Lac 6569.17 32249.58 NA NA
5. Mastic gum 0.50 2.22 2.16 10.29
6. Other resins 235.47 409.55 172.05 772.47
Total 7189.56 33199.04 52028.33 51247.82
B. Gums
7. African gum 0.50 0.81 315.00 92.90
8. Asian gum 405.60 1775.30 46.97 31.52
9. Gum arabic 398.65 1099.32 31007.75 12872.35
10. Guar gum refined split 84744.27 116171.44 65.15 296.49
11. Guar gum treated and pulverized
436431.64 799103.48 60.41 255.03
12. Karaya gum (Indian tragacanth) 198.02 770.63 586.28 394.67
13. Tragacanth (Adracanth) 0.12 0.24 2.35 3.10
14. Xanthum gum 1.00 7.72 80.48 165.24
15. Other natural gums 3062.81 4841.57 309.64 639.35
Total 525242.60 923770.50 32474.02 14750.65
C. Gum resins
16. Asafoetida 10883.07 4104.90 1029.27 39891.82
17. Myrrh 12.39 20.50 57.03 251.22
18. Olibanum or frankincence 87.00 107.82 54.78 114.43
19. Other gum resins 205.89 2068.19 546.39 1157.24
Total 11188.35 6301.40 1687.47 41414.71
Grand total 543620.51 963270.94 86189.81 107413.18
Source: DGCIS, SHEFEXIL & APEDA Annual Reports.
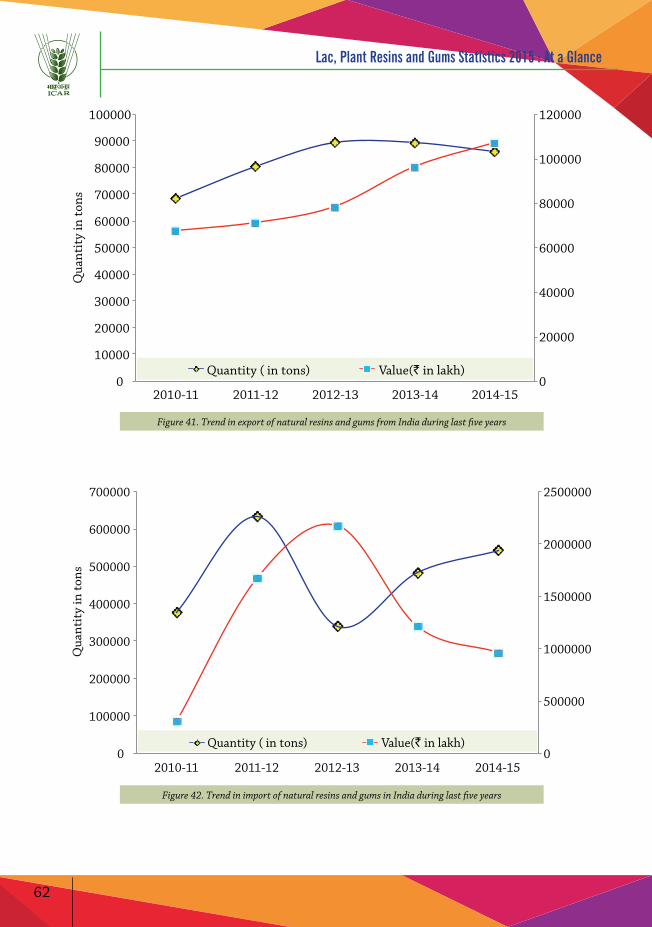
62
Lac, Plant Resins and Gums Statistics 2015 : At a Glance
0
20000
40000
60000
80000
100000
120000
0
10000
20000
30000
40000
50000
60000
70000
80000
90000
100000
2010-11 2011-12 2012-13 2013-14 2014-15
Qua
ntit
y in
tons
Quantity ( in tons) Value(` in lakh)
Figure 41. Trend in export of natural resins and gums from India during last five years
0
500000
1000000
1500000
2000000
2500000
0
100000
200000
300000
400000
500000
600000
700000
2010-11 2011-12 2012-13 2013-14 2014-15
Qua
ntit
y in
tons
Quantity ( in tons) Value(` in lakh)
Figure 42. Trend in import of natural resins and gums in India during last five years

63
Lac, Plant Resins and Gums Statistics 2015 : At a Glance
POLICY INTERVENTIONS
The present practices adopted by different States for fixation of price for different MFPs were on the basis of market prices by reducing all the overheads and the second methodology for arriving at procurement price is to follow cost plus method in which cost of collection can be calculated for MFPs in different States. Therefore, government has taken the initiatives under the scheme for MFPs.
Mechanism for marketing of Minor Forest Produce through Minimum Support Price and development of Value Chain for MFP
A Pricing Cell was constituted pursuant to the Ministry of Tribal Affairs, Government of India and notified vide TRIFED’s to recommend Minimum Support Price for Minor Forest Produce under the scheme “Mechanism for marketing of Minor Forest Produce through Minimum Support Price and development of Value Chain for MFP” To determination fair and remunerative MSP for lac and gum karaya the deliberations of the Pricing Cell with State Procurement Agencies (SPAs) and federations were conducted. Computation of cost of production of gum karaya and lac for MSP was furnished by ICAR-Indian Institute of Natural Resins & Gums (ICAR-IINRG). The Pricing Cell analysed the above information furnished by the SPAs and observed the wide variation in the data on the related parameters from State to State. Following decisions were made in the context of price stabilizing policy for MFPs.
A. Recommendations of Minimum Support Price of gum karaya for the 2014 crop
It was noted that major quantity of gum karaya is procured in Andhra Pradesh, Madhya Pradesh, Jharkhand, Chhattisgarh and Maharashtra. Gum karaya is procured from gum pickers in three grades and procurement prices are also announced grade wise. However, Gum karaya of grade III accounts for approximately 70 % of the total quantity purchased by GCC in Andhra Pradesh. Similar status was confirmed by other states regarding grade wise procurement. It was also noted that gum karaya is a nationalized item or is under monopoly system of procurement in most of the states except Gujarat, Jharkhand & Maharashtra. Despite announcement of procurement price in Gujarat hardly any quantity of gum karaya was procured. Similarly in Jharkhand and Maharashtra also, the quantity procured was very low. The Pricing Cell also considered the computation of the cost of production of gum karaya as calculated and furnished by ICAR-IINRG, Ranchi. Representative explained the details of the cost worked out by for gum karaya, which is calculated on the basis of collection of gum karya in a scientific manner. The method used by them is to calculate the direct cost associated in collecting gum karaya independent of the minimum wage method. At the same time, members observed that IINRG, an institution engaged in research and training for NRGs, has calculated the cost that appears to be more reliable as they have arrived at this cost after studying various aspects of collection over a period. Finally, the Pricing Cell felt it appropriate to determine MSP on the basis of the cost of production as calculated by ICAR-IINRG plus 10 % increase thereon. Accordingly, the Pricing Cell recommended MSP of ` 108/- per kg. for gum karaya Grade-III for the current procurement season. However, the Pricing Cell underlined the need of initiating a study to collect relevant data to calculate cost of collection so that the MSP
64
Lac, Plant Resins and Gums Statistics 2015 : At a Glance
is fixed in pursuance of the spirit of the scheme. It requires field visits, primary data collection and hands-on work to study various factors affecting cost of collection for MFPs. However, this may take a long time as the survey can be conducted only during the harvesting season. The Pricing Cell recommended that a study be immediately initiated so that relevant data to calculate cost of collection for 12 MFPs in 8 States can be collected.
B. Recommendations of Minimum Support Price of lac for the 2014 crop
The two varieties of lac rangeeni variety (harvesting season is May-June & October-November) and kusumi variety (harvesting season is January-February & July-Aug) cultivated mainly by tribals. Its production is mainly dependent upon inoculation of broodlac by tribals on the lac host trees in time. Major quantity of lac is available in the State of Jharkhand followed by Chhattisgarh, M.P. & Odisha. Accordingly, based on the inputs provided by IINRG, Pricing Cell had recommended a Minimum Support Price (MSP) of `210 and `290/ kg for rangeeni and kusumi lac, respectively for 2014 crop (applicable up to November 2014 as the cost of the production may vary depending upon the cost of broodlac during the next season).
C. Recommendations of Minimum Support Price of lac for the 2015 crop
Normally the lac price is dominated by processors but farmers / primary collectors should get the price based on the cost of the production which may vary depending upon the cost of broodlac for the season. During the current year, the Lac Cultivators have used brood Lac of July 2014 crop in their cultivation when the prices were ranging between `300-350/kg, hence cost of production of lac will be higher during harvesting season in December and January. IINRG submitted a detailed cost sheet for determining the cost of production for each variety of lac. The Pricing Cell recommended enhancing the current MSP by 10 %. Pricing Cell had recommended a Minimum Support Price (MSP) of `230 and `320/kg for rangeeni and kusumi lac, respectively for 2015 crop.
65
Lac, Plant Resins and Gums Statistics 2015 : At a Glance
CONCLUSIONS
Value addition in lac based products has an encouraging market scenario as the export of Aleuritic acid is increasing since last two years. New and young entrepreneurs have entered in lac sector with big investments for production of high value products like Aleuritic acid and isoambrettolide. To meet the domestic demand Pine resin processing infrastructure is needed to be revamped. Both the units are functional at under capacity level. Production and procurement of some gums is declining during last two years. MSPs for NWFP may be key intervention for procurement, marketing and value chain establishment. It will be helpful to stabilize the price fluctuation particularly in case of lac. Copal, damar batu, mastic gum, gum rosin, lac and others are natural resins exported and imported in India. Gum arabic, asian gum, african gum, karaya gum, tragacanth, guar gum (refined split and treated pulverized), xanthun gum and others are natural gums exported and imported in India. Asafoetida, myrrh, oilbanum and others are gum-resins exported and imported in India. The exported quantity of natural resins and gums during 2014-15 was 543620.51 tons valued ` 963270.94 lakh while imported quantity was 86189.81tons valued ` 107413.18lakh.These figures are on higher side of the normal EXIM scenario of NRGs.
Although resins discussed have proved to be popular alternative or complementary medicine used in the treatment of many diseases, clinical trial evaluation of these claims using currently accepted protocols is needed. The reported resins offer huge potential as a possible pharmacological application but its necessary a further investigation to verify whether purified compounds isolated may have better therapeutic potential as compared to crude extracts. These new chemicals will serve to enhance the continued usefulness of higher plants and their products as renewable resources of chemicals.
This report presents an overview of quantity and values for selected forest products and services from Indian forests. Results highlight a strong concentration of value in guar gum production. The economic value of NWFPs however is only partly reflected on the market and recorded by official statistics. Underestimation by existing statistics might be due to several reasons, including: (i) the public-good nature of many products/services and consequent difficulties in estimating them; (ii) the fact that data recorded for official statistics are not always complete (for example they do not always cover all the region as in the case of NWFPs); and (iii) the fact that a certain proportion of the NRGs is not mirrored by official data because some products are traded through informal channels and markets. Enhancing the offer of Indian market products and increasing their role in the rural economy could help to reduce the costs of forest protection: a well-structured forest economy able to provide stable flows of incomes can provide a fundamental set of public non-market services and social values to both local people and the whole community. Understanding the true value of natural resources, for both land users and policymakers, is an essential step for promoting their protection and sustainable use. Since markets do not reflect all values flowing from NWFPs, further research is needed to better understand the link between ecosystem functioning and the delivery of services, as well as their appropriate economic evaluation. As a final point, we are aware that synergies and trade-offs exist between market products and nonmarket services,
66
Lac, Plant Resins and Gums Statistics 2015 : At a Glance
as well as among different ecosystem services. Estimations would significantly contribute to the identification of management conditions and choices, as well as the setting of priorities that allow a social optimum to be achieved.
The constraints related to export of natural resins and gums were small and scattered quantity of produce, fluctuation in domestic production and prices, adulteration in raw material, limited export promotional measures, improper international market information, lack of future trading and prior agreement as expressed by the exporter. India has a great potential in production and export of natural resins and gums because of availability of resins and gums yielding trees, manpower, favorable climate and R&D support. The proper attention and action for intensification of effort for increasing natural resins and gums production will definitely improve the export earning of the country. Major gums and resins of international commerce produced and traded in and from India include Guar gum, lac, gum karaya, gum Arabic from Acacia species, and myrrh, asafoetida, Rosin and olibanum from Commiphora species. Scientific inoculation and gum tapping methods would produce more NRGs than traditional method because they have been practiced successfully by innovative/progressive farmers during last few years. It would be preferable to consider scientific inoculation and gum tapping methods to get better quality and yield, and to change the economic standards of cultivators of India.
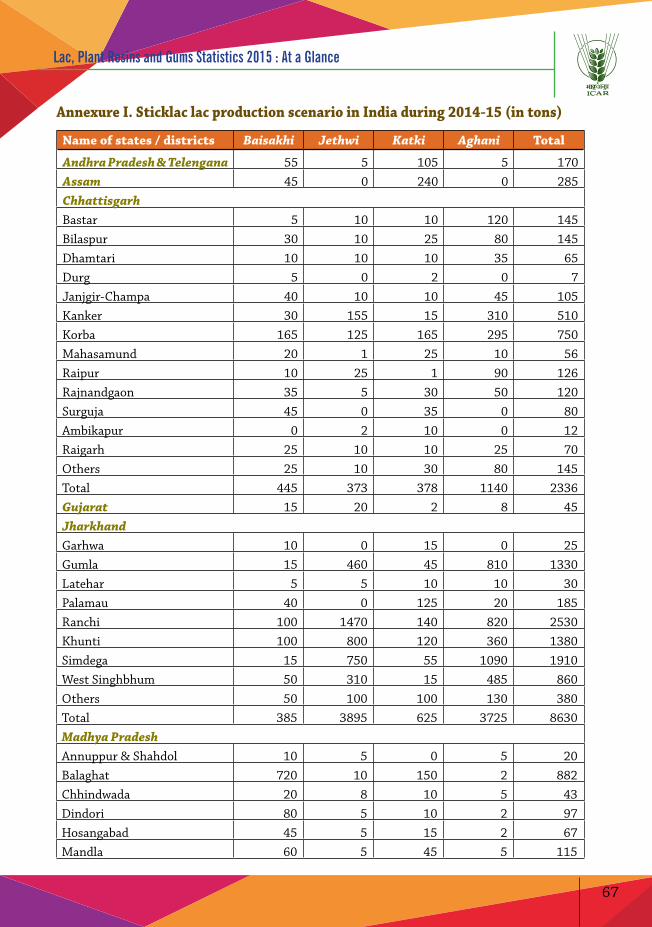
67
Lac, Plant Resins and Gums Statistics 2015 : At a Glance
Annexure I. Sticklac lac production scenario in India during 2014-15 (in tons)
Name of states / districts Baisakhi Jethwi Katki Aghani Total
Andhra Pradesh & Telengana 55 5 105 5 170Assam 45 0 240 0 285ChhattisgarhBastar 5 10 10 120 145Bilaspur 30 10 25 80 145Dhamtari 10 10 10 35 65Durg 5 0 2 0 7Janjgir-Champa 40 10 10 45 105Kanker 30 155 15 310 510Korba 165 125 165 295 750Mahasamund 20 1 25 10 56Raipur 10 25 1 90 126Rajnandgaon 35 5 30 50 120Surguja 45 0 35 0 80Ambikapur 0 2 10 0 12Raigarh 25 10 10 25 70Others 25 10 30 80 145Total 445 373 378 1140 2336Gujarat 15 20 2 8 45JharkhandGarhwa 10 0 15 0 25Gumla 15 460 45 810 1330Latehar 5 5 10 10 30Palamau 40 0 125 20 185Ranchi 100 1470 140 820 2530Khunti 100 800 120 360 1380Simdega 15 750 55 1090 1910West Singhbhum 50 310 15 485 860Others 50 100 100 130 380Total 385 3895 625 3725 8630Madhya PradeshAnnuppur & Shahdol 10 5 0 5 20Balaghat 720 10 150 2 882Chhindwada 20 8 10 5 43Dindori 80 5 10 2 97Hosangabad 45 5 15 2 67Mandla 60 5 45 5 115
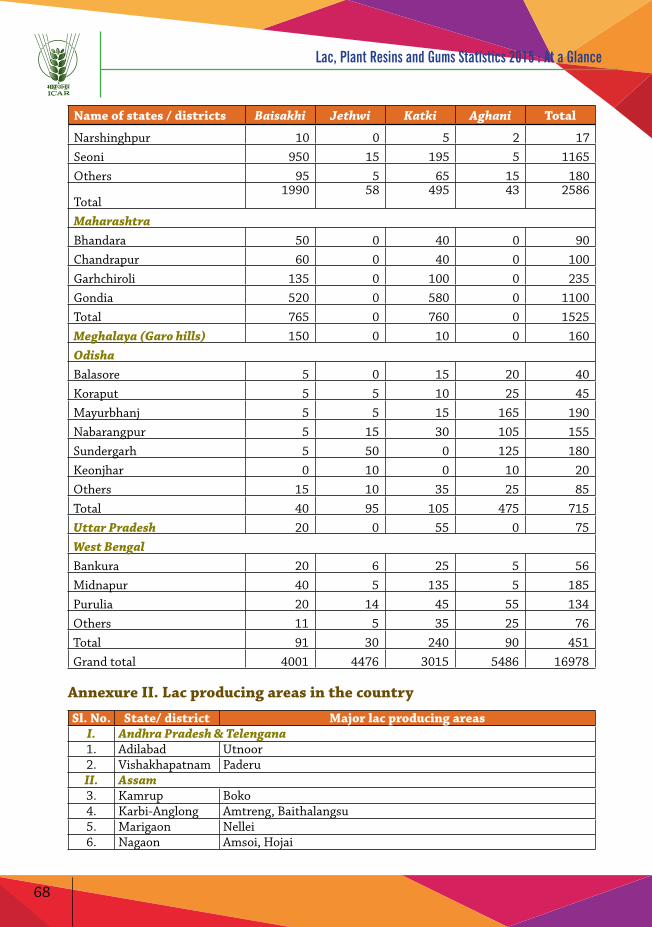
68
Lac, Plant Resins and Gums Statistics 2015 : At a Glance
Name of states / districts Baisakhi Jethwi Katki Aghani Total
Narshinghpur 10 0 5 2 17Seoni 950 15 195 5 1165Others 95 5 65 15 180
Total1990 58 495 43 2586
MaharashtraBhandara 50 0 40 0 90Chandrapur 60 0 40 0 100Garhchiroli 135 0 100 0 235Gondia 520 0 580 0 1100Total 765 0 760 0 1525Meghalaya (Garo hills) 150 0 10 0 160OdishaBalasore 5 0 15 20 40Koraput 5 5 10 25 45Mayurbhanj 5 5 15 165 190Nabarangpur 5 15 30 105 155Sundergarh 5 50 0 125 180Keonjhar 0 10 0 10 20Others 15 10 35 25 85Total 40 95 105 475 715Uttar Pradesh 20 0 55 0 75West BengalBankura 20 6 25 5 56Midnapur 40 5 135 5 185Purulia 20 14 45 55 134Others 11 5 35 25 76Total 91 30 240 90 451Grand total 4001 4476 3015 5486 16978
Annexure II. Lac producing areas in the country
Sl. No. State/ district Major lac producing areasI. Andhra Pradesh & Telengana1. Adilabad Utnoor 2. Vishakhapatnam PaderuII. Assam3. Kamrup Boko4. Karbi-Anglong Amtreng, Baithalangsu5. Marigaon Nellei6. Nagaon Amsoi, Hojai

69
Lac, Plant Resins and Gums Statistics 2015 : At a Glance
Sl. No. State/ district Major lac producing areasIII. Bihar7. Gaya Raniganj8. Jehanabad Malichak
IV. Chhattisgarh9. Balrampur Chando, Dharmi, Wandrafnagar
10. Bastar Keshkal11. Bilaspur Gaurella, Kota, Lorami, Pendra12. Dhamtari Gatta Silli, Nagri, Sihawa13. Durg Balod, Daudi, Dondi-Lohara, Kusumkasa14. Gariyaband Amlipadar, Chhaila, Chhura Gariyaband, Indagaon, Mainpur, Udanti15. Janjgir-Champa Sakti, Saragaon16. Kanker Antagarh, Bhanupratapur, Biragaon, Kondagaon, Korar, Narharpur,
Sambalpur17. Korba Bhaisama Bazar, Chaitama, Chhuri, Haldi Bazar, Kartala, Katghora,
Korbi, Madanpur, Pali, Pasan, Pasarkhet18. Korea Bhartarpur, Kusmi19. Mahasamund Bagbahara, Basana, Khalari, Mahasamund, Pithora, Tendukona20. Narayanpur Narainpur21. Raigarh Dharmjaigarh, Lailunga, Pathalgaon,Tamnar22. Raipur Abhanpur23. Rajnandgaon Aawadhi, Bharitola, Khardi, Manpur, Mohala-chowki24. Sarguja Chalgi, Mainpat, Pasta, Pratappur, Premnagar, Raghunathnagar, Ramanujganj, V. Gujarat25. Panchamahal Dakor, Godhara, Ghoghamba, Nadiad and Santrampur26. Vadodara Chhota Udepur, Devhant, Jambaguda, Jatpurpavi, Jhonjh, Kawant,
Keori, Kundal Ghata, Tejgadh and ZozVI. Jharkhand27. Chatra Tandwa28. Garhwa Bargarh, Garhwa, Godarmana, Rakshi, Ramganga, Ramkonda, Ranka 29. Gumla Chainpur, Dumari, Kanshir, Palkot, Patratoli, Raidih30. Khunti Murhu, Soeko Torpa, Karra, Rania,Tapkara31. Latehar Balumath, Barwadih Brahmani, Chandwa, Garu Latehar, Manika,
Sarju, Satbarwa 32. Palamu Matalong, Panki, Raj Chaipur, 33. Ranchi Angara, Banta, Birbanki, Bundu, Jonha, Namkum, Ormanjhi, Silli,
Maranghada, Sonahatu, Tamar34. Simdega Bano, Hating hode, Jaldega, Kolebira, Lachragarh35. West Singhbhum Anandpur, Bandgaon, Baskata, Chaibasa, Chakradharpur, Goelkera,
Lodai, Manoharpur, Sonuwa, Toklo VII. Madhya Pradesh36. Anuppur Jaitahari, Keshwahi, Kotma, Venkatnagar 37. Balaghat Baihar, Katangi, Lalbarra, Lamta, Langi, Parashwada, Waraseoni38. Chhindawada Damoa39. Dindori Bazak, Bhanupur, Karanjia, Ramnagar, Rampur 40. Hosangabad Bankhedi, Babai, Daggrai, Darawpadaw, Hapa, Jonahata, Kekra,
Lokamti, Pipariya41. Mandla Bichhia, Chabbi, Ghughari, Kalpi, Mahegaon, Mavai, Nainpur,
Narainganj, Navas-Bablia
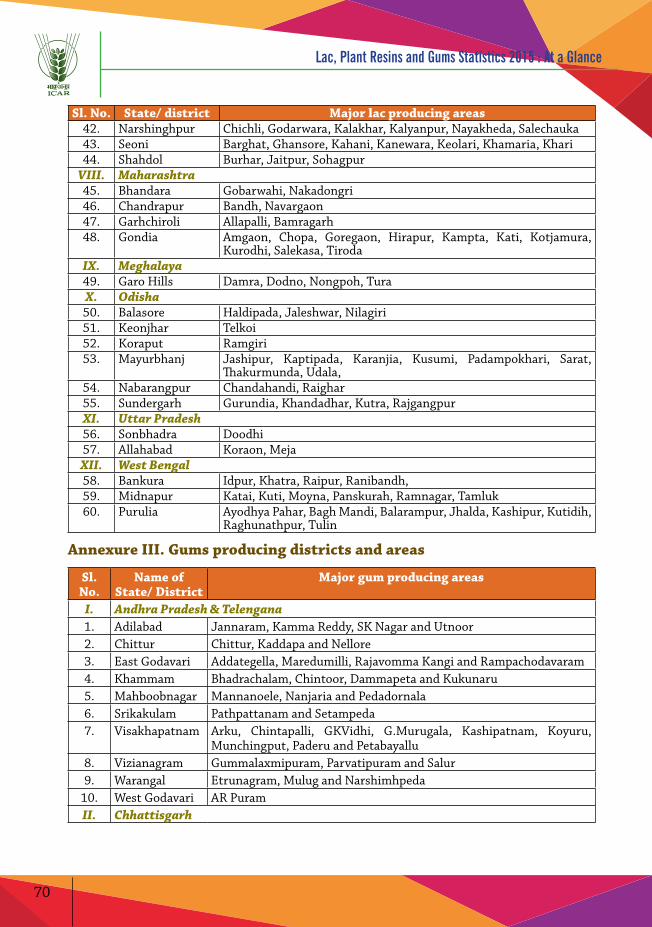
70
Lac, Plant Resins and Gums Statistics 2015 : At a Glance
Sl. No. State/ district Major lac producing areas42. Narshinghpur Chichli, Godarwara, Kalakhar, Kalyanpur, Nayakheda, Salechauka 43. Seoni Barghat, Ghansore, Kahani, Kanewara, Keolari, Khamaria, Khari 44. Shahdol Burhar, Jaitpur, Sohagpur
VIII. Maharashtra 45. Bhandara Gobarwahi, Nakadongri46. Chandrapur Bandh, Navargaon47. Garhchiroli Allapalli, Bamragarh48. Gondia Amgaon, Chopa, Goregaon, Hirapur, Kampta, Kati, Kotjamura,
Kurodhi, Salekasa, Tiroda IX. Meghalaya49. Garo Hills Damra, Dodno, Nongpoh, Tura X. Odisha50. Balasore Haldipada, Jaleshwar, Nilagiri 51. Keonjhar Telkoi52. Koraput Ramgiri53. Mayurbhanj Jashipur, Kaptipada, Karanjia, Kusumi, Padampokhari, Sarat,
Thakurmunda, Udala,54. Nabarangpur Chandahandi, Raighar55. Sundergarh Gurundia, Khandadhar, Kutra, RajgangpurXI. Uttar Pradesh56. Sonbhadra Doodhi57. Allahabad Koraon, Meja
XII. West Bengal58. Bankura Idpur, Khatra, Raipur, Ranibandh, 59. Midnapur Katai, Kuti, Moyna, Panskurah, Ramnagar, Tamluk60. Purulia Ayodhya Pahar, Bagh Mandi, Balarampur, Jhalda, Kashipur, Kutidih,
Raghunathpur, Tulin
Annexure III. Gums producing districts and areas
Sl. No.
Name of State/ District
Major gum producing areas
I. Andhra Pradesh & Telengana1. Adilabad Jannaram, Kamma Reddy, SK Nagar and Utnoor2. Chittur Chittur, Kaddapa and Nellore3. East Godavari Addategella, Maredumilli, Rajavomma Kangi and Rampachodavaram4. Khammam Bhadrachalam, Chintoor, Dammapeta and Kukunaru5. Mahboobnagar Mannanoele, Nanjaria and Pedadornala6. Srikakulam Pathpattanam and Setampeda7. Visakhapatnam Arku, Chintapalli, GKVidhi, G.Murugala, Kashipatnam, Koyuru,
Munchingput, Paderu and Petabayallu8. Vizianagram Gummalaxmipuram, Parvatipuram and Salur9. Warangal Etrunagram, Mulug and Narshimhpeda
10. West Godavari AR PuramII. Chhattisgarh
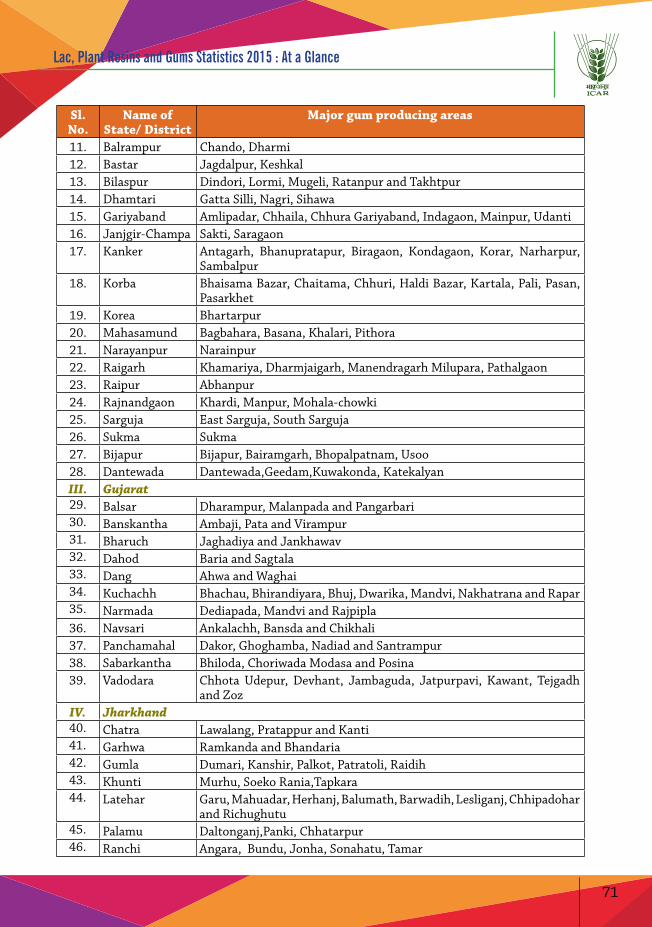
71
Lac, Plant Resins and Gums Statistics 2015 : At a Glance
Sl. No.
Name of State/ District
Major gum producing areas
11. Balrampur Chando, Dharmi12. Bastar Jagdalpur, Keshkal13. Bilaspur Dindori, Lormi, Mugeli, Ratanpur and Takhtpur 14. Dhamtari Gatta Silli, Nagri, Sihawa15. Gariyaband Amlipadar, Chhaila, Chhura Gariyaband, Indagaon, Mainpur, Udanti16. Janjgir-Champa Sakti, Saragaon17. Kanker Antagarh, Bhanupratapur, Biragaon, Kondagaon, Korar, Narharpur,
Sambalpur18. Korba Bhaisama Bazar, Chaitama, Chhuri, Haldi Bazar, Kartala, Pali, Pasan,
Pasarkhet19. Korea Bhartarpur20. Mahasamund Bagbahara, Basana, Khalari, Pithora21. Narayanpur Narainpur22. Raigarh Khamariya, Dharmjaigarh, Manendragarh Milupara, Pathalgaon23. Raipur Abhanpur24. Rajnandgaon Khardi, Manpur, Mohala-chowki25. Sarguja East Sarguja, South Sarguja26. Sukma Sukma27. Bijapur Bijapur, Bairamgarh, Bhopalpatnam, Usoo28. Dantewada Dantewada,Geedam,Kuwakonda, KatekalyanIII. Gujarat29. Balsar Dharampur, Malanpada and Pangarbari 30. Banskantha Ambaji, Pata and Virampur31. Bharuch Jaghadiya and Jankhawav32. Dahod Baria and Sagtala33. Dang Ahwa and Waghai34. Kuchachh Bhachau, Bhirandiyara, Bhuj, Dwarika, Mandvi, Nakhatrana and Rapar35. Narmada Dediapada, Mandvi and Rajpipla36. Navsari Ankalachh, Bansda and Chikhali37. Panchamahal Dakor, Ghoghamba, Nadiad and Santrampur38. Sabarkantha Bhiloda, Choriwada Modasa and Posina39. Vadodara Chhota Udepur, Devhant, Jambaguda, Jatpurpavi, Kawant, Tejgadh
and ZozIV. Jharkhand40. Chatra Lawalang, Pratappur and Kanti41. Garhwa Ramkanda and Bhandaria42. Gumla Dumari, Kanshir, Palkot, Patratoli, Raidih43. Khunti Murhu, Soeko Rania,Tapkara44. Latehar Garu, Mahuadar, Herhanj, Balumath, Barwadih, Lesliganj, Chhipadohar
and Richughutu45. Palamu Daltonganj,Panki, Chhatarpur46. Ranchi Angara, Bundu, Jonha, Sonahatu, Tamar
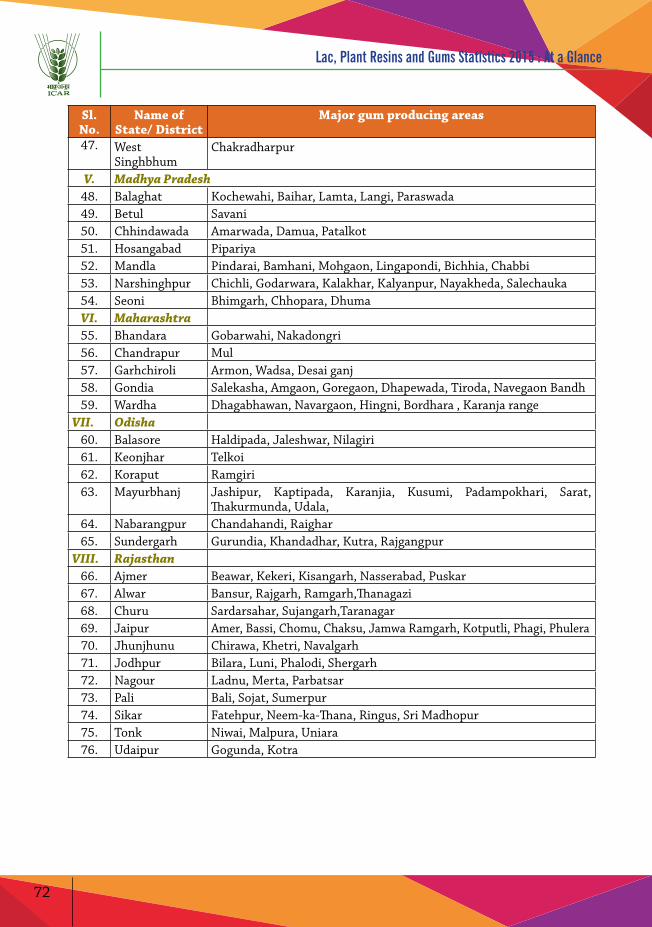
72
Lac, Plant Resins and Gums Statistics 2015 : At a Glance
Sl. No.
Name of State/ District
Major gum producing areas
47. West Singhbhum
Chakradharpur
V. Madhya Pradesh48. Balaghat Kochewahi, Baihar, Lamta, Langi, Paraswada49. Betul Savani50. Chhindawada Amarwada, Damua, Patalkot51. Hosangabad Pipariya52. Mandla Pindarai, Bamhani, Mohgaon, Lingapondi, Bichhia, Chabbi53. Narshinghpur Chichli, Godarwara, Kalakhar, Kalyanpur, Nayakheda, Salechauka 54. Seoni Bhimgarh, Chhopara, DhumaVI. Maharashtra 55. Bhandara Gobarwahi, Nakadongri56. Chandrapur Mul57. Garhchiroli Armon, Wadsa, Desai ganj58. Gondia Salekasha, Amgaon, Goregaon, Dhapewada, Tiroda, Navegaon Bandh59. Wardha Dhagabhawan, Navargaon, Hingni, Bordhara , Karanja range
VII. Odisha60. Balasore Haldipada, Jaleshwar, Nilagiri 61. Keonjhar Telkoi62. Koraput Ramgiri63. Mayurbhanj Jashipur, Kaptipada, Karanjia, Kusumi, Padampokhari, Sarat,
Thakurmunda, Udala,64. Nabarangpur Chandahandi, Raighar65. Sundergarh Gurundia, Khandadhar, Kutra, Rajgangpur
VIII. Rajasthan66. Ajmer Beawar, Kekeri, Kisangarh, Nasserabad, Puskar 67. Alwar Bansur, Rajgarh, Ramgarh,Thanagazi68. Churu Sardarsahar, Sujangarh,Taranagar69. Jaipur Amer, Bassi, Chomu, Chaksu, Jamwa Ramgarh, Kotputli, Phagi, Phulera70. Jhunjhunu Chirawa, Khetri, Navalgarh 71. Jodhpur Bilara, Luni, Phalodi, Shergarh72. Nagour Ladnu, Merta, Parbatsar73. Pali Bali, Sojat, Sumerpur74. Sikar Fatehpur, Neem-ka-Thana, Ringus, Sri Madhopur75. Tonk Niwai, Malpura, Uniara76. Udaipur Gogunda, Kotra

ICAR-Indian Institute of Natural Resins and GumsNamkum, Ranchi-834 010, Jharkhand (India)
Phone No.: 0651-2261154, Fax : 0651-2260202Email : [email protected]
Visit us : http://ilri.ernet.in
1067
/03/
17/w
ww
.kai
lash
pape
r.org


