
It pays to be nice
Partner choice as an informal punishment mechanism
by
Nina Serdarevic
Master`s thesis
The thesis completes the following degree
Master in Economics
University of Bergen, Department of Economics
June.01.2016

ii
Preface
This thesis is the final work of my Master`s degree at the University of Bergen. The person whose
valuable comments and excellent guidance I could not have done this without is my supervisor Sigve
Tjøtta. I also want to thank co-supervisor Eirik A. Strømland for programing the experiment and for
sharing his knowledge of econometrics and the experimental literature with me. Thank you both for
always making time to teach me how to improve my academic work, and for igniting my interest in the
field of experimental economics. I thank Statoil`s Academia Agreement and the Norwegian Citizen panel
for financial support.
I am grateful to Elisabeth Ivarsflaten and the Norwegian Citizen panel for the Master`s scholarship and
for including me in an interesting and inspiring research environment.
Of my fellow students, I thank Linn Magritt Skotnes who helped me carry out the experiment. I also
thank Hans Rognlien and Knut Johannes Hartveit for helpful discussions and comments.
I thank my wonderful parents, grandmother, Magne and Grete for their endless love and support. Last
but certainly not the least, I want to thank Lars for making me laugh every day.
Nina Serdarevic, Bergen. June.01.2016
iii
It pays to be nice
Partner choice as an informal punishment mechanism
By
Nina Serdarevic
University of Bergen, June.01.2016
Supervisors: Sigve Tjøtta and Eirik A. Strømland
Abstract
Two mechanisms that have been shown to facilitate cooperation are partner choice and punishment, but
can partner choice be employed as an informal punishment mechanism? To examine this question I
conduct two experiments. The first experiment studies a two-person repeated Prisoner`s Dilemma game.
Each individual is allowed to choose one person from a fixed group of five subjects they wish to be paired
with. The individual who fails to find a partner is excluded from the group. Moreover, and most
importantly, I elicit individual cooperative dispositions prior to the two-person repeated Prisoner`s
Dilemma game and examine how different types of individuals perform when allowed to choose a
partner. Results show that partner choice does not increase the overall efficiency. However, there appear
to be interesting differences in the performance of individuals who exhibit heterogeneous cooperative
dispositions. Cooperative individuals outperform non-cooperators when allowed to choose a partner.
The second experiment is conducted in the Norwegian Citizen panel and attempts to distinguish between
the social and the monetary cost associated with exclusion. I study a one-shot continuous Prisoner`s
Dilemma game where exclusion is the consequence of being the lowest contributor in a group of three
individuals. The monetary outside option is varied to examine which cost of exclusion individuals value
the most. The results of the survey experiment show that the social cost of exclusion increases
cooperation significantly, regardless of the size of the monetary cost linked to exclusion.
The lab experiment is computerized with the experimental program z-Tree 3.3.8 (Fischbacher, 2007).
Results of both experiments are analysed with the statistical software STATA/IC 14.1 and Microsoft
Excel 2016.
iv
Table of contents Preface ............................................................................................................................................................... ii
Abstract ............................................................................................................................................................ iii
Chapter 1: Introduction .................................................................................................................................. 1
Chapter 2: Related literature .......................................................................................................................... 5
2.1 Cooperative types ......................................................................................................................................... 5
2.2 Partner choice ............................................................................................................................................... 8
2.3 Punishment mechanisms .............................................................................................................................. 9
Chapter 3: A lab experiment ......................................................................................................................... 12
3.1 Experimental design ................................................................................................................................... 12
3.2 The First part: Elicitation of cooperative types ......................................................................................... 13
3.3 The Second part: Partner choice in a repeated Prisoner`s Dilemma game ................................................. 15
3.3.1 Sample selection bias .............................................................................................................................. 20
3.4 Experimental procedures ............................................................................................................................ 21
3.5 Classification of types ................................................................................................................................ 23
3.6 Results ........................................................................................................................................................ 26
3.6.1 It pays to be nice ...................................................................................................................................... 26
3.6.2 Robustness checks ................................................................................................................................... 31
3.6.3 Excluding non-cooperators ...................................................................................................................... 33
3.6.4 Mimicking cooperative behavior ............................................................................................................. 36
3.6.5 Partner choice as a regrouping device ..................................................................................................... 39
Chapter 4: The Norwegian Citizen panel experiment ............................................................................... 42
The “Exclusion” and “Random” conditions ..................................................................................................... 43
The “Lose” and “Keep” conditions .................................................................................................................. 44
4.1 Results ........................................................................................................................................................ 44
4.1.1 The aggregate effect of exclusion ............................................................................................................ 44
Chapter 5: Concluding remarks ................................................................................................................... 47
Literature .......................................................................................................................................................... 48
Appendix A: Instructions for the lab experiment ............................................................................................ 52
Appendix B: Supplementary regression results .............................................................................................. 60
Appendix C: Invitation mail ............................................................................................................................ 63
Appendix D: Instruction for the Norwegian Citizen panel experiment ........................................................... 64
v
List of tables and figures
Table 1: Main features of the lab experiment. ...................................................................................... 15
Table 2: Classification of types with the median and average conditional contributions. .................... 23
Table 3: OLS regressions. Payoff (%) conditional on type, by treatment. ........................................... 30
Table 4: OLS regressions. Payoff (%) with a continuous type measure, by treatment. ....................... 32
Table 5: OLS regressions. Estimated probability of exclusion conditional on type, by treatment. ...... 35
Table 6: Contribution (%) in the first period conditional on type, by treatment. ................................. 38
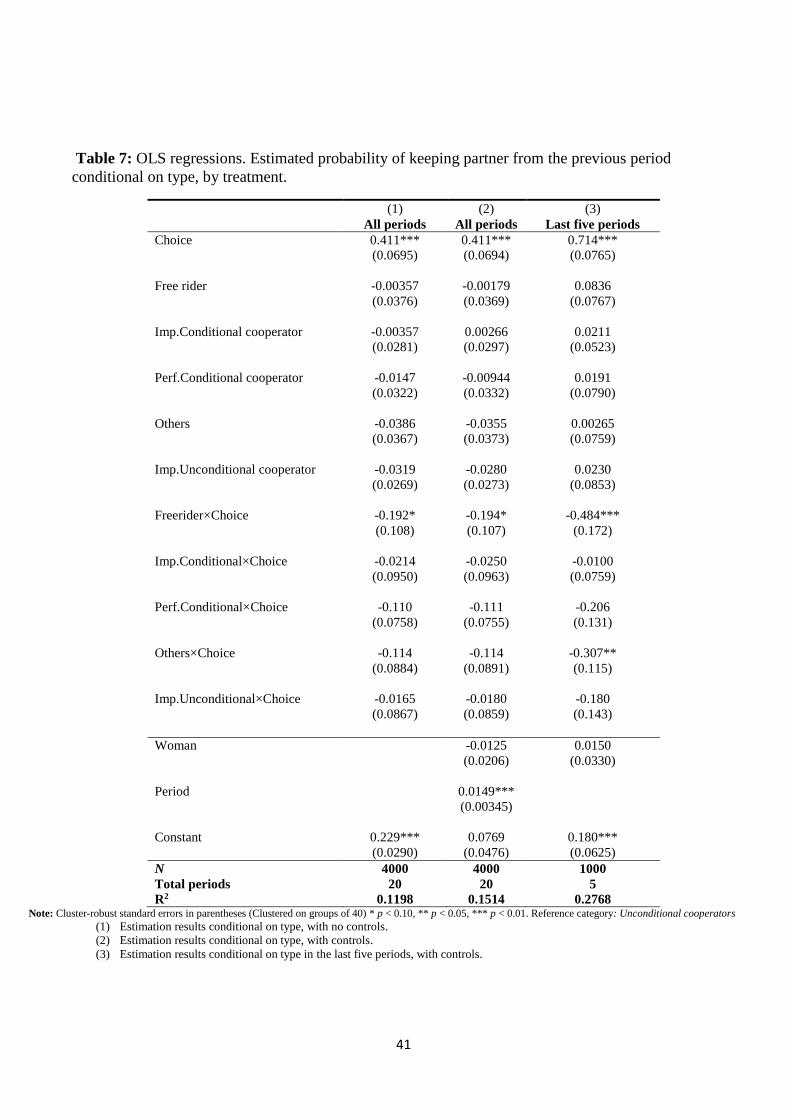
Table 7: OLS regressions. Estimated probability of keeping partner from the previous period
conditional on type, by treatment. ......................................................................................................... 41
Table 8: Main features of the survey experiment. ................................................................................ 43
Table 9: OLS regressions. Individual contributions in NOK, by treatment. ........................................ 46
Table 10: OLS regressions. Payoff (%) conditional on type, by treatment. ......................................... 60
Table 11: Contribution (%) after exclusion in the previous period, by treatment. ............................... 61
Figure 1: Conditional contribution table for the second decision. ....................................................... 14
Figure 2: The matching process in the "Choice" condition. ................................................................. 17
Figure 3: The matching process in the "Random" condition................................................................ 19
Figure 4: Conditional contribution patterns from the First part of the experiment. ............................. 25
Figure 5: Contribution (%) in the first period, by treatment. ................................................................ 26
Figure 6: Average individual payoff (%) conditional on type, by treatment. ...................................... 28
Figure 7: Frequency of exclusion conditional on type, by treatment. .................................................. 33
Figure 8: Contribution (%) in the first period conditional on type, by treatment. ................................ 36
Figure 9: Frequency of keeping partner from the previous period, by treatment. ................................ 39
Figure 10: Individual contributions in NOK, by treatment. ................................................................. 45
Figure 11: Contribution (%) after exclusion in the previous period conditional on type, by treatment.
............................................................................................................................................................... 62

1
Chapter 1: Introduction
“Your goal as an individual is to interact with someone who feels sympathy for your interests,
in the hope that such a person will be internally motivated to cooperate, even though he could
earn more by defecting” – Robert Frank (2004:10)
Many market interactions create a conflict between social and individual interests. However, as
people often rely on reputation rather than courts to resolve such dilemmas, it might pay to be
cooperative (Tullock, 1999). The untraditional emergence of the London stock exchange
market illustrates this point very well. Only successful brokers were provided membership to
coffeehouses that resembled private clubs. Those who could not conduct their dealings in an
acceptable manner were labeled as “Lame ducks” and excluded from an environment that was
worth being a part of, both in social and monetary terms (Smith, 1766: 538). Thus, honest
individuals can use partner choice to solicit future partnerships while indirectly making cheaters
worse off (Frank, 1987).
This thesis experimentally investigates how partner choice affects cooperation in an
environment where having no partner may lead to exclusion. I make an attempt to unify the
experimental literature on partner choice (Hauk & Nagel, 2001; Page et al., 2005) and
punishment (Guala, 2012; Dreber et al., 2008). Moreover, I examine whether it pays to be
predisposed to engage in cooperative behavior. That is, cooperative types may improve their
relative performance when partner choice is possible.
The thesis yields three fundamental contributions to the experimental literature on cooperation.
First, I link cooperative dispositions to performance by implementing a variant of the Strategy
method in a one-shot continuous Prisoner`s Dilemma game (Selten, 1967). As the cooperative
2
type measure is independent of the repeated game with partner choice, any cooperation in the
one-shot game is assumed to have other-regarding motivations (Gintis, 2005). Second, as
exclusion in the field rarely happens by explicitly excluding others, I examine if partner choice
can work as an informal punishment mechanism (Guala, 2012). Third, exclusion might evoke
different connotations to the actual cost of being the social outcast. The behavioural impact of
being excluded can be better understood if an attempt is made to examine the distinction
between the social and the monetary cost associated with exclusion.
Partner choice has been shown to positively influence cooperation and the efficiency in social
dilemmas (Page et al., 2005; Cinyabuguma et al., 2005, Andreoni & Croson, 2008). However,
the question of how partner choice affects the relative performance of cooperative individuals
compared to free riders, has to my knowledge not yet been examined in the experimental
literature. For example, brokers who cheat in environments which they cannot be excluded
from, can increase their commissions at the expense of brokers who have attracted profitable
clients by being honest. It is important to examine if all types of individuals increase their
relative performance when partner choice may lead to exclusion, or if the overall efficiency
increases at the expense of some types.
To address these essential questions, I conduct two experiments. The first experiment examines
the effect of partner choice. Individuals play a two-person repeated Prisoner`s Dilemma game
in fixed groups of five. Each individual can choose one person to produce a fictitious item with.
The asymmetry between the supply and demand of partners makes it possible to study
punishment as a function of partner choice. The individual with no partner is excluded from the
interaction rather than randomly assigned to an available person (Strømland et al., 2016). The
novelty of this experimental design is that I conduct a one-shot continuous Prisoner`s Dilemma
game prior to the repeated partner choice game (Fischbacher et al., 2001; Fischbacher &
3
Gächter, 2010). This is done to elicit cooperative dispositions and to examine if cooperative
individuals can outperform free riders when allowed to choose a partner.
The lab experiment yields the following findings. Partner choice does not increase the overall
efficiency. However, when examining how different types of individuals perform when allowed
to choose a partner, I find that cooperators are granted significantly higher payoffs than non-
cooperators. Also, cooperators face a reduced estimated probability of being excluded. Thus,
the results show that cooperative individuals with no intention to maximize their material payoff
end up doing so anyway. The paradox is that in order to maximize payoff, one has to stop caring
about it (Frank, 1987).
The second experiment is conducted in the Norwegian Citizen panel and investigates how
exclusion is looked upon in both social and monetary terms. Related experimental studies have
suggested that exclusion increases cooperation in social dilemmas (Rigaud et al.,2010; Feinberg
et al.,2014; Cinyabuguma et al., 2005). However, what remains unclear is which cost of
exclusion motivates individuals to cooperate more, the social or the monetary cost? I study a
one-shot continuous Prisoner`s Dilemma game where exclusion is the consequence of being
the lowest contributor in a group. Contrary to the controlled lab experiment, I vary the monetary
outside option.
The results of the Norwegian Citizen panel experiment show that exclusion increases
contributions significantly, and that the result is purely driven by the social cost of exclusion.
One would expect individuals to act fully selfish in such an experimental environment. After
all, they are granted full anonymity and the experiment is web-based. Nothing suggests that the
interaction is repeated. However, being labelled as an outsider seems to motivate individuals to
cooperate more, regardless of the monetary cost associated with exclusion.

4
The rest of this thesis proceeds as follows. Chapter 2 presents the related experimental literature.
Chapter 3 provides the experimental design and procedures of the controlled lab experiment.
The chapter finally summarizes the results. Chapter 4 contains the experimental design of the
experiment conducted in the Norwegian Citizen panel. The main findings of this experiment
are presented in the same chapter. Chapter 5 contains the summary and concluding remarks.

5
Chapter 2: Related literature
2.1 Cooperative types
Theoretical considerations
By establishing that individuals exhibit different cooperative dispositions one can better understand how
different types of individuals perform in an environment where partner choice is linked to exclusion. The
importance of differences in cooperative dispositions has been examined by Frank (1987). He attempts
to answer the following question; what preferences would a selfish person choose with respect to long
run maximization of payoff? In Frank`s (1987) model individuals are treated as if they were either honest
or dishonest. To be honest means to refrain from cheating, even when cheating cannot be punished. A
dishonest person on the other hand engages in reputational mimicking of honest individuals if there are
incentives to do so. The model highlights that if the rules of the game provide an opportunity to choose
whom to associate with, the honest individuals who signal cooperative intents will be preferred as
partners. The dishonest types are often made worse off. Thus, the reason why individuals characterized
as being selfish, often do act cooperatively, is because there are gains from acting non- selfishly under
certain rules of the game. However, and most importantly, having cooperative preferences that yield no
self-serving long run outcomes can be viewed as a beneficial commitment device (Frank, 1987).
Moreover, Alger and Weibull (2013) present a model suggesting that there exists a link between
preference heterogeneity and assortative matching. On one end of the spectrum we find the theory of the
Homo economicus who is assumed to be entirely selfish. On the other side we find individuals with
altruistic preferences that always incentivise behaviour which minimize the inequality between them and
others. In between these preference types, we find a preference type who is guided by moral, Homo
moralis. Different circumstances might overthrow the morally guided person to one of the two extremes.
The matching process in their model is exogenous. The model of Alger and Weibull (2013) predicts that
individuals who seek to maximize their own payoffs do well in the absence of assortative matching.

6
However, deviations from selfish preferences are stable as long as the there is some degree of assortativity
in the process whereby individuals are matched to interact.
Empirical estimation of cooperative types
Fischbacher et al. (2001) show empirically that individuals` cooperative preferences differ in a social
dilemma. They perform an experiment that directly elicits subjects` willingness for conditional
cooperation. They use a variant of the “Strategy method” (Selten, 1967) and design a public goods game
where the subjects` main task is to choose for each average contribution level of other group members,
how much to contribute to the public good. The degree of heterogeneity in their sample is presented in
the figure below. One-third of the individuals are classified as free riders, whereas 50 percent are in some
form conditionally cooperative. Their results suggest that the often observed decay of cooperation in
repeated public goods games can be explained as a reaction to other individuals` contributions.
(Fischbacher et al., 2001)
7
In addition, Fischbacher and Gächter (2006) provide a direct test of the role of social preferences in
voluntary cooperation. They test if individuals behave consistently with their elicited preferences. Two
experiments are conducted. In the first experiment a variant of the Strategy method is applied (Selten,
1967). This is done to elicit people`s contribution preferences in a public goods game. In the second
experiment subjects make actual contribution choices in a ten period Public goods environment. All
subjects play both types of experiments, but not in the same sequence. The results show clear cut evidence
of different “types” in the game. Moreover, expressed contribution preferences and actual contribution
behavior are on average consistent with one another. They suggest that the interaction of heterogeneous
types can explain a large part of dynamics of free riding.
Brandts and Charness (2011) compare two elicitation methods that are often used to elicit different types
of behavior. They compare the Strategy method with the Direct response method. In the Strategy method
the responder makes conditional contributions for each possible information set. In the Direct response
method on the other hand, individuals learn the actions of the first mover and then choose a response.
Their results suggest that the Direct response method may appear to be a more natural procedure, since
individuals usually do not have to formulate complete strategies in everyday life. However, what they
emphasize, is that in the Direct response method individuals might consult with peers and have more
time to think in a systematic manner. Thus, this approach might not capture this kind of behavior. The
Strategy method may be a more effective approach to model the reflective behavior in the laboratory,
and it is very useful for gathering data at nodes that are only reached occasionally in the game. By
analyzing individuals` complete strategies, one gains valuable insights into the motives underlying their
decisions. The survey study of Brandts and Charness (2011) show that though the results are mixed, the
Strategy method yields similar results to those induced by the Direct-response method.

8
2.2 Partner choice
Multiple experimental studies have empirically established that some form of influence over who one
associates with increases cooperation (Page et al., 2005; Gunnthorsdottir et al., 2007; Hauk & Nagel,
2001). For instance, Page et al. (2005) links preference rankings to voluntary group formation, and show
that this leads to an increase in contributions in a public goods game. They compare a group with fixed
matching to a group with a regrouping treatment. In the regrouping treatment subjects express their
preferences by ranking all preferred subjects on a scale from 1 to 15. A computer algorithm then matches
the subjects together in groups of four based on these rankings. They also compare regrouping with
punishment and find that regrouping is significantly more efficient than the punishment treatment.
Moreover, the combined treatment yields the highest levels of contributions compared to all conditions.
They find that cooperative individuals sort into partnerships with others who are cooperative, while non
cooperators are left with non-cooperators.
Coricelli et al. (2004) provide participants the opportunity to select their future interaction partner in a
two-person public good game. In the two control conditions partners are randomly determined, while in
the treatment conditions partner matching is either done with a one-sided selection mechanism or a
mutual selection mechanism. The one-sided selection mechanism works by giving a part of one`s
endowment to have the right to bid on a preferred partner, whereas money that is not used for bidding is
added to one`s payoff. The mutual selection mechanism on the other hand, works by allocating a part of
the endowment according to the willingness of finding a partner. A computer maximizing mechanism
then matches a pair when two participants allocate a substantial part of their available amount to each
other. Results indicate an increase in cooperation, especially with one-sided partner selection compared
to mutual partner selection and random matching. The monetary cost of choosing a partner is substantial,
showing the importance of deliberately choosing a relationship with another individual.
9
In the study of Page et al. (2005) individuals rank preferred subjects they wish to interact with. The final
matching of individuals into groups is however decided by an algorithm. Thus, individuals do have a
saying in who they wish to associate with, buy they are not allowed to directly choose their preferred
groups members. Furthermore, linking monetary costs to partner choice as in the study of Coricelli et al.
(2004) might not only express preferences of preferred partners but also preferences for money.
Individuals in these studies are allowed only indirect influence of who they interact with. Strømland et
al. (2016) address these issues in more detail.
As a practical manner, instead of letting the experimenter “run” the matching process like in the studies
presented above, I examine if nice guys intentionally pair with co-operators while avoiding free riders.
The novelty of the experimental design is that cooperative dispositions are elicited before actually
allowing individuals to choose a partner. This allows for a clean identification of the link between one`s
type and who they wish to interact with in the game. Thus, this thesis puts the aspect of mutual partner
choice into a sharper focus compared to related studies on partner choice.
2.3 Punishment mechanisms
The most important contribution which separates this thesis from other studies on punishment is that it
examines if partner choice can work as an informal punishment mechanism. Individuals in the lab
experiment are not instructed to exclude anyone per se, but only to choose a partner. Exclusion is thus
the mere consequence of not being chosen by others.
The interesting thing with punishment mechanisms employed in most of the experimental literature is
that they are of an explicit character. Individuals are informed that they can exclude others by voting
(Feinberg et al., 2014; Rigaud et al., 2010). Individuals are thus only given one mean to attain their
objectives. A majority of these studies report positive effects on cooperation. However, as Guala (2012)
importantly points out, it is doubtful that costly punishment is the main mechanism through which co-
10
operators discipline free riders in real-life social dilemmas. These points raise the further question of the
external validity of experiments of this character. It also emphasizes the need to revisit the prevalence of
explicit punishment mechanisms in the literature.
Would punishment result in a setting where there are other available options through which goals may
be achieved? The experiment in this thesis supplements the argument of Guala (2012), because
punishment is the outcome of an intentional process of partner choice. Punishment arises, but not because
the experiment is constructed to provide punishment as the only way of disciplining defectors.
Comparable to Guala`s (2012) argument, Dreber et al. (2008) show that the option of costly punishment
increases the amount of cooperation, but not the average payoff of the group. They find a strong negative
correlation between total payoff and costly punishment. Individuals who gain the highest payoff do not
use costly punishment. Costly punishment disfavors the individual who uses it. Thus, winners do not
punish as punishment is found to be a maladaptive strategy.
Furthermore, Cinyabuguma et al. (2006) show that perverse punishment of high contributors is an
important reason why experiments in which individuals have the opportunity to sanction one another,
fail to increase efficiency. While endogenously imposed sanctions lead to higher contributions, the lack
of efficiency gains can be attributed to the fact that costly punishment is at time misdirected towards high
contributors.
Barclay and Raihani (2015) study a modified Prisoner`s Dilemma to examine cooperation and
punishment when partner choice is possible and when it is not. They predict that punishment is more
common when individuals cannot leave bad partners, whereas partner choice is useful when one can
switch to a better partner. Results show that cooperation is higher when individuals can leave bad partners
compared to when they cannot. Also, punishment levels are higher when switching partner is possible.
The reason is that cooperators desert defectors they just had punished. Most importantly, punishment
does not increase cooperation levels of defectors.

11
The findings of Dreber et al. (2008) and Barclay and Raihani (2015) support the claim that explicit
punishment mechanisms are often maladaptive. When evaluating the external validity of explicit
punishment mechanisms, it might be valuable to distinguish between the short and long run consequences
of exclusion. Costly punishment has proven to increase contributions in the short run (Fehr & Gächter,
2002). However, as most interactions in the field are repeated, costly punishment might not yield efficient
outcomes over time (Cinyabuguma et al., 2006).
12
Chapter 3: A lab experiment
3.1 Experimental design
This thesis examines three research questions. First, how does partner choice affect the payoff of different
types of individuals? Second, can partner choice work as an informal punishment mechanism of the least
cooperative individuals? Third, how does partner choice influence the overall efficiency and cooperation
in a social dilemma? To address these three questions, I conduct a controlled lab experiment.
The experiment consists of two parts:
1) The First part: To elicit individuals` cooperative dispositions I conduct a one-shot continuous
Prisoner`s Dilemma game. The essence of the elicitation procedure is a variant of the Strategy
method that examines how individuals reciprocate others` contribution choices (Selten, 1967;
Fischbacher et al., 2001). The anonymity and one-shot feature of this elicitation procedure allows
me to isolate other regarding motivations.
2) The Second part: I examine if partner choice can work as an informal punishment mechanism
by conducting a two-person repeated Prisoner`s Dilemma game. Individuals are assigned to fixed
groups of five subjects. Only two pairs from each group can continue to a production stage. The
individual with no partner is excluded from the game. Partner choice is thus directly linked to
exclusion.
The core of both parts of the experiment is a Prisoner`s Dilemma game. Each individual is endowed with
10 blue (private good) experimental currency units (ECU) that can be used to produce a fictitious red
unit (public good) with another person. The number of produced red units (i.e. the size of the public
13
good) is given by the total amount of contributions 𝑥𝑖 to it. The blue and red units are each worth 30 øre.
The marginal payoff of a contribution to the production of red units is set to equal 0,7.
The payoff function for each individual is as follows:
𝜋𝑖 = 10 − 𝑥𝑖 + 0,7(𝑥𝑖 + 𝑥𝑗) [1]
Hence, the standard behavioural baseline prediction assumes complete free riding by all individuals,
provided they are selfish and rational.
All subjects are fully informed about the rules of the game. Before the experiment starts they answer
control questions to ensure that the payoff structure is understood. This is done to disentangle individual
preferences from confusion. Individuals who fail to answer a control question correctly are provided with
a help screen on the computer that gives them the correct calculation of the payoff.
3. 2 The First part: Elicitation of cooperative types
The decision situation of the continuous one-shot Prisoner`s Dilemma game is comparable to the study
of Fischbacher et al. (2001). Individuals are asked to make two decisions without knowing the choices
made by the other subjects. The first decision is to decide how much of the initial 10 blue units each
individual wishes to contribute to a common pool, unconditional of others` contributions.
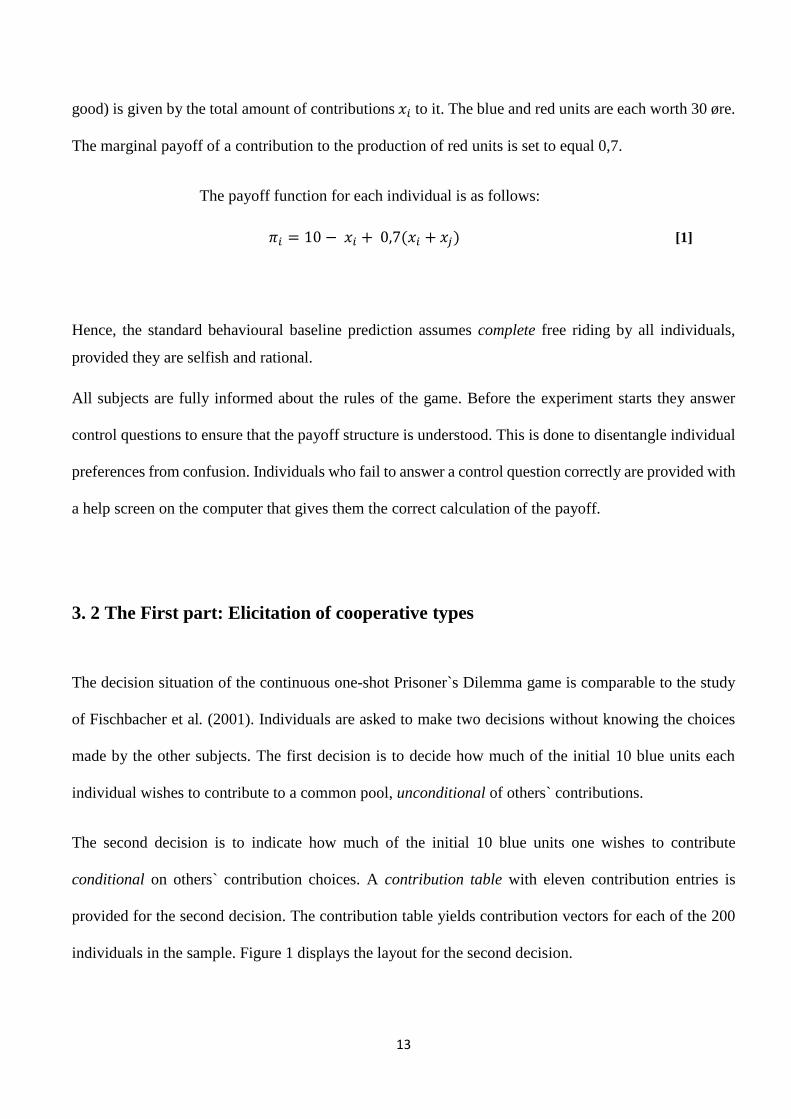
The second decision is to indicate how much of the initial 10 blue units one wishes to contribute
conditional on others` contribution choices. A contribution table with eleven contribution entries is
provided for the second decision. The contribution table yields contribution vectors for each of the 200
individuals in the sample. Figure 1 displays the layout for the second decision.
14
Figure 1: Conditional contribution table for the second decision.
To ensure that the unconditional and the conditional decision is weighed equally, I inform all subjects
that a random mechanism will determine which of the two decisions will be relevant for their actual
payoff. To understand how the decisions are incentivized, assume the following. Individual A contributes
5 experimental currency units in the unconditional decision. Individual B is randomly drawn to be the
partner of individual A and contributes 10 experimental currency units in all eleven entries of the
conditional contribution table. According to the payoff function [1], individual A earns 15.5 experimental
currency units.
There are mainly two reasons why elicitation of cooperative dispositions is conducted prior to the two-
person repeated Prisoner`s Dilemma game. First, there exists convincing theoretical and empirical
evidence that individuals differ in their cooperative dispositions (Selten, 1967; Frank, 1987; Fischbacher
et al., 2001). As one of the main research questions of this thesis is to examine how different types of
15
individuals perform when allowed to choose a partner, eliciting cooperative dispositions is an essential
part of the experimental design.
Second, elicitation of cooperative dispositions after being exposed to the treatment would potentially
yield endogenous preference measures. In this case I could not use cooperative dispositions to control or
to interact the treatment variable with.
3.3 The Second part: Partner choice in a repeated Prisoner`s Dilemma game
To examine if partner choice can work as an informal punishment mechanism, I conduct a two-person
repeated Prisoner`s Dilemma game. The main features of the experimental design are displayed in Table
1.
Table 1: Main features of the lab experiment.
In both the “Choice” and the “Random” condition individuals are randomly assigned to fixed groups of
five subjects. Individuals in their respective groups are anonymous and identified with a number ranging
from 1 to 5. They are informed that their identity and group composition is fixed throughout the entire
experiment. The experiment consists of 20 periods in total.
In each period of the game individuals are endowed with 10 blue units (private good) that can be used in
the production of red units (public good). The default choice is set to zero contributions.
Each individual can produce red units with one of the five persons from their group. However, only two
pairs from each group can proceed to the production stage. This means that one individual will be left
Treatments
Choice 20 groups, 100 subjects, 10 sessions
Random 20 groups, 100 subjects, 10 sessions
16
without a partner1 in each period of the game. The individual with no partner to produce with faces the
threat of exclusion. The individual that ends up being excluded loses the initial endowment of 10 blue
units in both the “Choice” and “Random” condition. He also misses out on the opportunity to participate
in the production stage.
All group members are informed that no communication is allowed, and that actions and choices can
only be observed when two individuals are paired together. The only way of communicating is by
signalling one`s type once paired with someone. Before each production stage individuals are informed
about the identity number of their partner. When the production stage is over each individual views a
private screen on the computer that contains their history of personal contribution choices and
partnerships.
I have chosen a group size of five subjects. The optimal size of a group is an empirical question. If the
group consists of too many subjects, individuals might get the impression that their actions are not
identifiable. In this case the threat of exclusion might not be perceived as real. The study of Isaac and
Walker (2006) shows that large groups experience more difficulties providing public goods than smaller
groups, as free riding is more prominent in groups with many individuals.
A small group with only three or fewer subjects might have the opposite effect. In a group of three
individuals there is a 1
3 chance of being excluded. This leads to three important implications. First, one
individual might get “stuck” as the one being constantly excluded. If the same person fails to find a
partner throughout the game, then this provides little variation in who is being excluded and why. Second,
this individual might get discouraged and not want to participate in future experiments. This could in
turn harm the future recruitment of participants. Third, the possibility of learning the game is also easier
if the group consists of few subjects.
1 I use the word person instead of partner in the instructions. This is done to avoid priming effects. See Appendix A for
details about the instructions.
17
Some phenomena do not affect observations individually, but uniformly within each group (Wooldridge,
2009: 495). Although individuals in the lab experiment are randomly assigned to groups, data is unlikely
to be independent across observations. It is therefore reasonable to assume that the data from the lab
experiment is clustered on the group level. Considering the maximum number of clusters, three subjects
in each group would produce more clusters than a group of seven or more subjects. However, given the
design concerns mentioned above, one can think of a group consisting of five subjects as being enough
to maximize the number of clusters.
The “Choice” condition
In the start of every period in the “Choice” condition each individual can choose one of the five persons
from the group to produce with. This is done by entering a number between 1 and 5 in a field on the
computer screen. As choices are made simultaneously, two individuals who mutually enter each other`s
identity tags are successfully matched and can continue to the production stage. The default partner
choice equals the individual`s own identity number. The mutual matching process is illustrated as the
right branch in Figure 2 below.
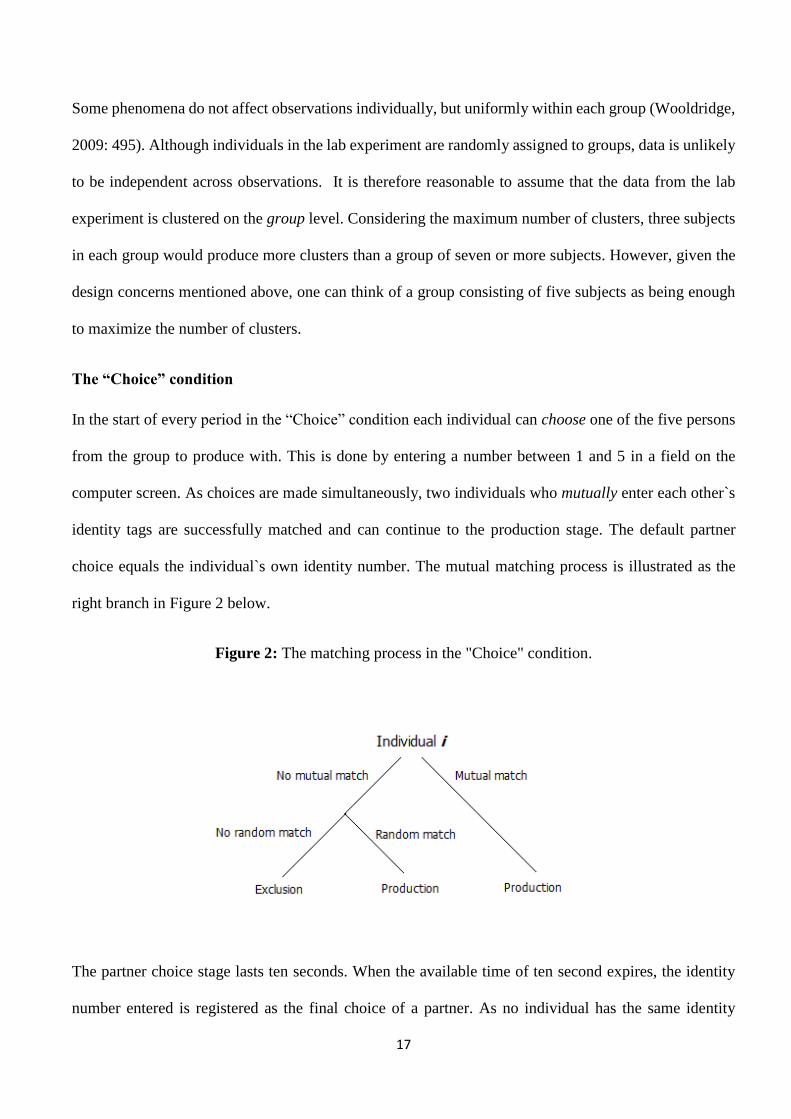
Figure 2: The matching process in the "Choice" condition.
The partner choice stage lasts ten seconds. When the available time of ten second expires, the identity
number entered is registered as the final choice of a partner. As no individual has the same identity
18
number, the matching algorithm ensures that all partnerships consist of only two individuals who have
mutually entered the identity number of one another.
Prior to the production stage individuals are informed if their preferred partner has chosen them or not,
and also their partners identity number. As individuals cannot observe the contribution choices of others
before actually being paired with another person, they are incentivized to signal cooperative intents to
maximize the probability of attracting a partner.
Subjects in the “Choice” condition are not instructed to exclude anyone, but only to choose a partner.
The individual that fails to find another person to produce with faces the threat of exclusion. If only one
individual fails to mutually match with another person, then this individual is excluded from the game in
the current period. Most importantly, only one individual is excluded from each period of the game. The
message given to the excluded individual is as follows: “The person you chose did not choose you. You
have to pass on the production stage in this period.”
However, if more than one individual fails to mutually match with another person, each is either
randomly paired with an available person from their respective group (they thus proceed to the production
stage) or excluded from the game. Note that only one individual ends up being excluded if this situation
arises. The left branch in Figure 2 illustrates this process in more detail.
There are two reasons why I employ random matching if more than one individual fails to find a partner.
First, by randomly matching those who cannot find a partner I avoid varying the number of excluded
individuals between the “Choice” and “Random” condition. Second, in the first periods of the game
exclusion is expected to be random. If all individuals who fail to find a partner early on in the game are
excluded, pairing with another person later on might be a coincidence rather than a real choice. Thus, by
being randomly matched in the first periods one gains the opportunity to actively engage in signalling
one`s type.
19
The “Random” condition
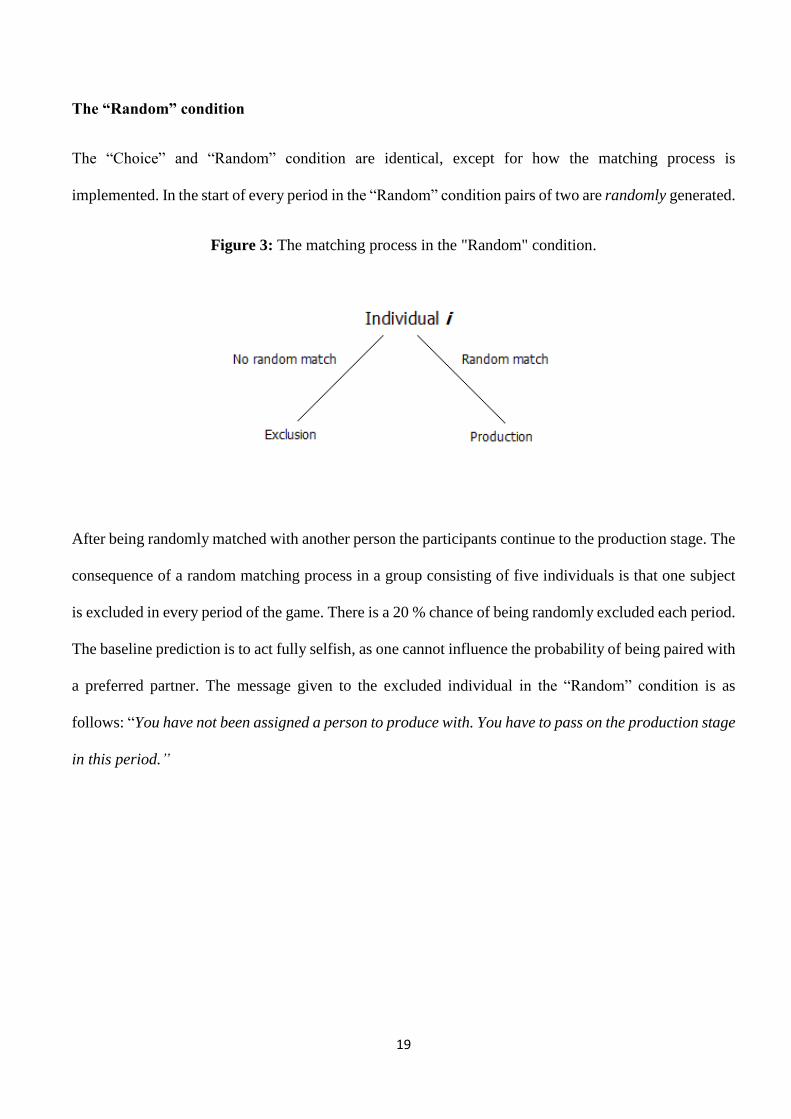
The “Choice” and “Random” condition are identical, except for how the matching process is
implemented. In the start of every period in the “Random” condition pairs of two are randomly generated.
Figure 3: The matching process in the "Random" condition.
After being randomly matched with another person the participants continue to the production stage. The
consequence of a random matching process in a group consisting of five individuals is that one subject
is excluded in every period of the game. There is a 20 % chance of being randomly excluded each period.
The baseline prediction is to act fully selfish, as one cannot influence the probability of being paired with
a preferred partner. The message given to the excluded individual in the “Random” condition is as
follows: “You have not been assigned a person to produce with. You have to pass on the production stage
in this period.”
20
3.3.1 Sample selection bias
Twenty percent of the individuals in the sample are always excluded throughout the experiment in each
experimental condition. If contribution is the dependent variable of interest, the experimental design
yields a selection bias by construction. A sample selection bias refers to situations where the dependent
variable is observed only for a restricted, nonrandom sample (Verbeek: 50, 2012). The consequence of a
selection bias is that only contributions of individuals who have a partner are observed.
However, the matching process in the first period of the experiment is random as there is no available
information to base one`s choice of partner on. I therefore also include the first period contributions in
the analysis. Whereas contributions are observed only for individuals with a partner, the payoff is
observed for all, including the excluded individuals. Individual payoffs are therefore the main object of
the statistical analysis.
21
3.4 Experimental procedures
The experiment was conducted using the program z- Tree 3.8.8 (Fischbacher, 2007), and consisted of 20
sessions. A total of 200 students2 participated, 100 in each condition. Each student could only participate
in one session. The sessions were run over three days, November 9, November 10 and November 11 at
a computer lab at the University of Bergen. One session consisted of 10 subjects who were randomly
divided into two groups of five subjects. The sessions were run at the same times on each day. Moreover,
both conditions were run in the same room on each day.
The recruitment of the participants was done through Expmotor3. An invitation mail was sent out to 5000
first and second year students that were registered for exams in Examen philosophicum at the University
of Bergen ten days prior to the experiment. The invitation e-mail informed all participants that they would
receive a show up fee of 100 NOK. This was done to incentivize the participants to show up for the
experiment. The day prior to each experiment I sent a text message to remind all participants that they
have signed up for an experiment and information about where to meet.
The randomization was done at an individual level within-session randomization by letting the
participants draw a letter from A to J before entering the experimental lab. By doing this, the participants
were unaware of which condition they participated in. The students were seated and separated by partition
walls to ensure that subjects from the same condition could not see the screens of one another, and which
treatment condition they belonged to.
The welcoming and recruitment of participants was conducted by a lab assistant. Each participant drew
a paper from an urn with letters from A to J. Each of these letters corresponded to a client computer in
the lab. This procedure was done to ensure the double blindness condition.
2 Of the 200 students 61 % were women and 39 % were men. 3 The recruitment platform Expmotor is provided by Erik Sørensen from the Norwegian School of Economics.

22
When the experiment was over, the participants filled out a questionnaire with their assigned letter so
that the earnings could be linked to the right individual. After the entire experiment was completed and
while the assistant prepared the earnings in a separate room, the experimenter gave the subjects a list that
they could sign up on if they wanted to receive an e-mail after the master`s thesis was finished. This
allowed the participants to read more about the research project and ensured that they knew the value of
their participation.
After everything was ready the assistant knocked on the door and handed the envelopes with the earnings.
Each individual handed in the paper with the assigned letter and received their earnings thereafter. On
average, the entire experiment lasted 30 minutes and the participants earned 202 NOK (25.30 USD) in
total. This equals an hourly pay of 404 NOK (48.6 USD) and is well above the average hourly pay of an
undergraduate student in Norway.
23
3.5 Classification of types
Recall that all individuals in the sample made eleven conditional contribution choices in the First part of
the experiment. Each individual decided how much to contribute given the contribution choices of
another person, for values ranging from zero to ten experimental currency units.
To classify types, I use the median of the eleven conditional contribution choices of each individual, and
create cut-off values that classify individuals into cooperative types4. The conditional contribution
choices of all individuals fall into six distinct type categories. Under the assumption that the elicited
preferences are stable (i.e. these do not change with experience) contributions in repeated interactions
are still expected to deteriorate over time (Fischbacher & Gächter, 2006). The details of the classification
procedure are described in Table 2 below.
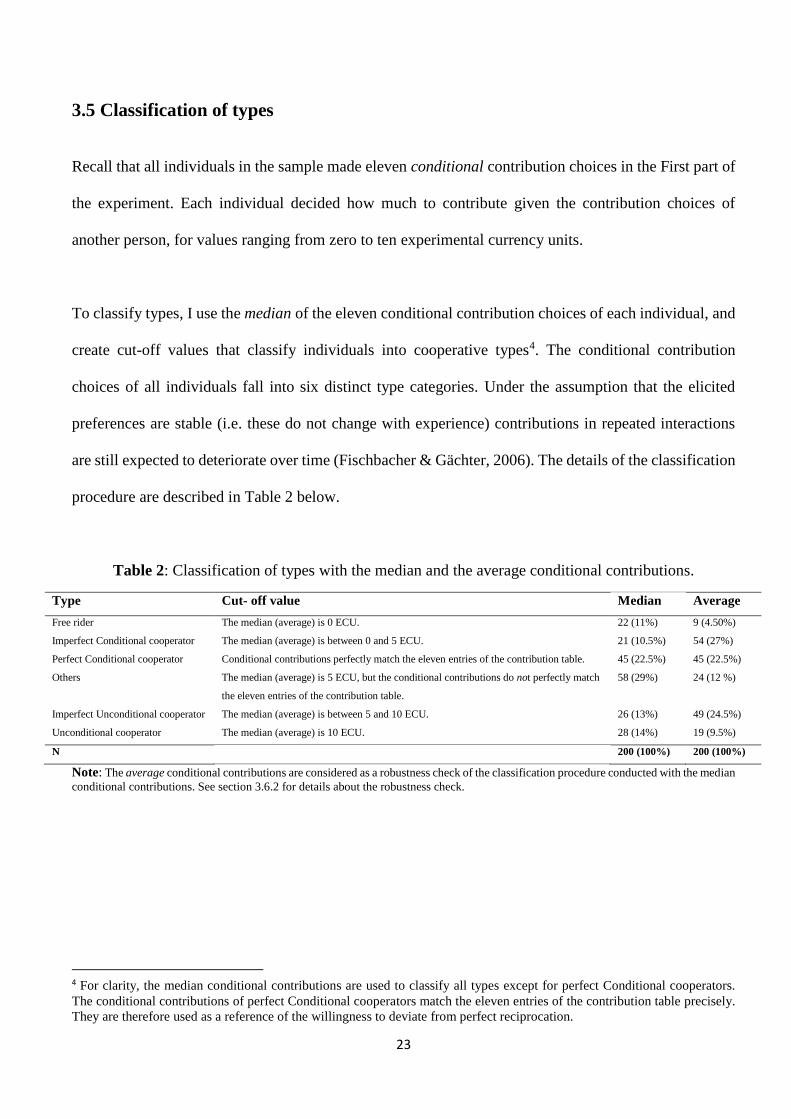
Table 2: Classification of types with the median and the average conditional contributions.
Note: The average conditional contributions are considered as a robustness check of the classification procedure conducted with the median
conditional contributions. See section 3.6.2 for details about the robustness check.
4 For clarity, the median conditional contributions are used to classify all types except for perfect Conditional cooperators.
The conditional contributions of perfect Conditional cooperators match the eleven entries of the contribution table precisely.
They are therefore used as a reference of the willingness to deviate from perfect reciprocation.
Type Cut- off value Median Average
Free rider The median (average) is 0 ECU. 22 (11%) 9 (4.50%)
Imperfect Conditional cooperator The median (average) is between 0 and 5 ECU. 21 (10.5%) 54 (27%)
Perfect Conditional cooperator Conditional contributions perfectly match the eleven entries of the contribution table. 45 (22.5%) 45 (22.5%)
Others The median (average) is 5 ECU, but the conditional contributions do not perfectly match
the eleven entries of the contribution table.
58 (29%) 24 (12 %)
Imperfect Unconditional cooperator The median (average) is between 5 and 10 ECU. 26 (13%) 49 (24.5%)
Unconditional cooperator The median (average) is 10 ECU. 28 (14%) 19 (9.5%)
N 200 (100%) 200 (100%)

24
Some individuals in the sample have contribution preferences that resemble a Homo economicus, who
always acts in a way that maximizes own expected utility. These individuals are classified as Free riders.
Individuals in the sample who contribute more than Free riders but less than perfect Conditional
cooperators are classified as Imperfect Conditional cooperators. These types of individuals display a bias
towards selfish behavior.
Perfect Conditional cooperators are individuals in the sample who precisely match the contributions of
others. In other words, they contribute more to the production of a public good the more others contribute.
However, as some individuals in the sample have contribution vectors that resemble perfect Conditional
cooperators, but not perfectly, I classify them as “Others”. This is done to ensure to some degree that the
conditional contributions of perfect Conditional cooperators are increasing and perfectly reciprocating
others` contribution choices.
A number of individuals in the sample indicate that they would contribute higher amounts for each of the
eleven entries of the contribution table. These types of individuals are assumed to have preferences for
unselfish behavior and are thus classified as Imperfect Unconditional cooperators. Last, the most
cooperative individuals in the sample are classified as Unconditional cooperators. They are willing to
contribute their entire endowment regardless of how others behave. If their contribution behavior is
applied as a general rule, this could maximize the social payoff.
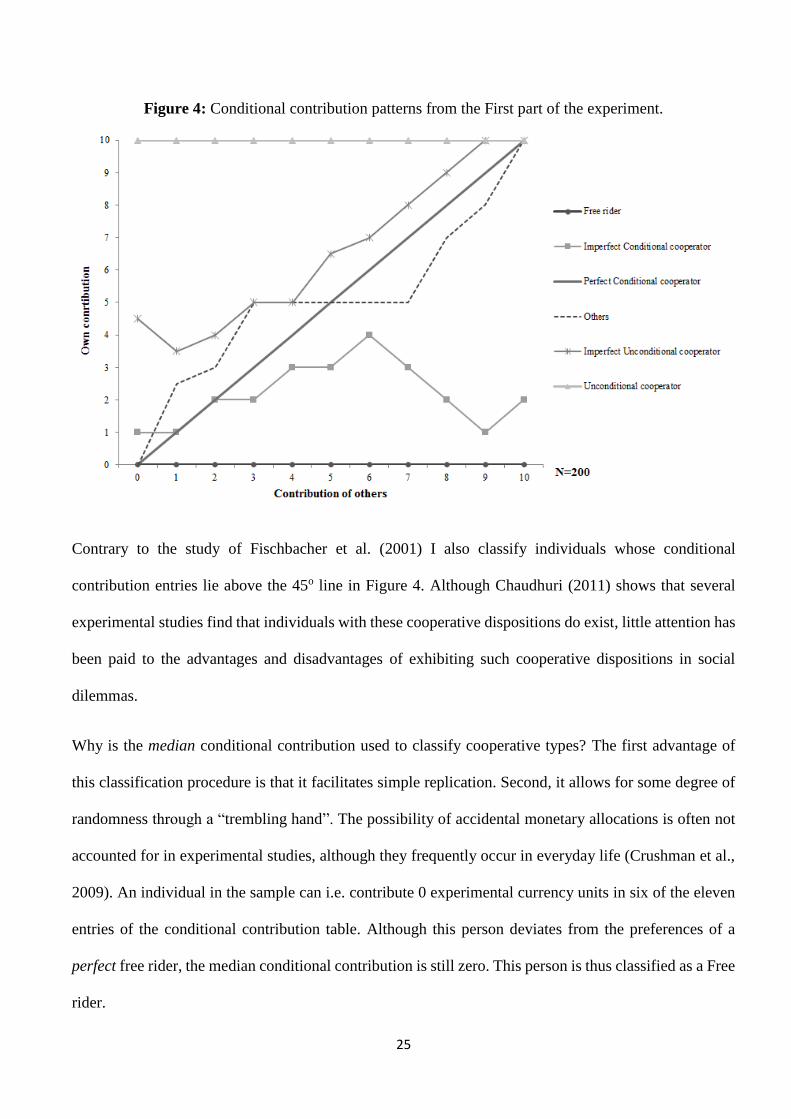
Figure 4 provides a visual overview of the conditional contribution patterns of the classified types. The
contribution patterns are based on the median of each of the eleven conditional contribution entries made
by the six types. That is, if the contribution of another person is 6 experimental currency units, the median
conditional contribution of Imperfect Conditional cooperators is expected to be 4 experimental currency
units.
25
Figure 4: Conditional contribution patterns from the First part of the experiment.
Contrary to the study of Fischbacher et al. (2001) I also classify individuals whose conditional
contribution entries lie above the 45o line in Figure 4. Although Chaudhuri (2011) shows that several
experimental studies find that individuals with these cooperative dispositions do exist, little attention has
been paid to the advantages and disadvantages of exhibiting such cooperative dispositions in social
dilemmas.
Why is the median conditional contribution used to classify cooperative types? The first advantage of
this classification procedure is that it facilitates simple replication. Second, it allows for some degree of
randomness through a “trembling hand”. The possibility of accidental monetary allocations is often not
accounted for in experimental studies, although they frequently occur in everyday life (Crushman et al.,
2009). An individual in the sample can i.e. contribute 0 experimental currency units in six of the eleven
entries of the conditional contribution table. Although this person deviates from the preferences of a
perfect free rider, the median conditional contribution is still zero. This person is thus classified as a Free
rider.
26
3.6 Results
3.6.1 It pays to be nice
Result 1: Partner choice does not increase the aggregate payoff and contribution levels.
Related experimental results suggest that partner choice motivates individuals to cooperate in social
dilemmas (Coricelli et al., 2004; Page et al., 2005; Brekke et al., 2011). Are these findings also present
in the partner choice experiment? Without considering the cooperative type measure, the results show
that partner choice does not increase the payoff on the aggregate level. The OLS5 analysis in column 1,
Table 3 indicates that partner choice increases the payoff by only 0.99 percentage points in the “Choice”
condition (p=0.23). The payoff is nearly identical in both conditions. Thus, in this thesis I find no support
for the hypothesis that partner choice increases the overall efficiency in social dilemmas.
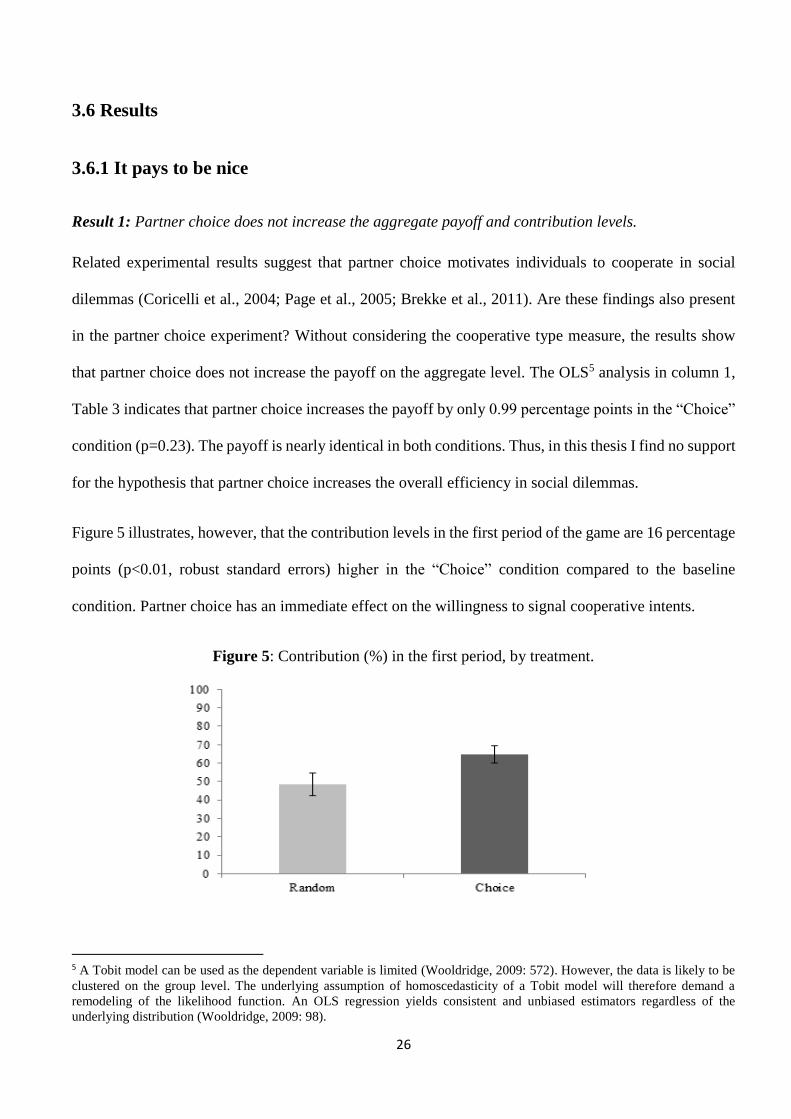
Figure 5 illustrates, however, that the contribution levels in the first period of the game are 16 percentage
points (p<0.01, robust standard errors) higher in the “Choice” condition compared to the baseline
condition. Partner choice has an immediate effect on the willingness to signal cooperative intents.
Figure 5: Contribution (%) in the first period, by treatment.
5 A Tobit model can be used as the dependent variable is limited (Wooldridge, 2009: 572). However, the data is likely to be
clustered on the group level. The underlying assumption of homoscedasticity of a Tobit model will therefore demand a
remodeling of the likelihood function. An OLS regression yields consistent and unbiased estimators regardless of the
underlying distribution (Wooldridge, 2009: 98).
27
While multiple studies provide convincing evidence of a positive behavioral impact of partner choice,
these results are not present when partner choice may lead to exclusion as in this thesis. Why is there a
missing effect of partner choice when the cooperative type measure is not considered?
The OLS analysis in Table 11, Appendix B shows that individuals in the “Choice” condition who have
been excluded in the previous period reduce their contributions by 1.17 percentage points (p<0.05)
compared to the baseline. Individuals who have not been excluded in the “Choice” condition increase
their contributions by 6.56 percentage points (p=0.161) compared to the baseline.
The puzzling results of partner choice might be attributed to the opportunity of retaliation6 against
individuals who have left a partnership. For instance, individuals in the “Random” condition might not
be willing to retaliate as they initially cannot influence who they interact with. In the “Choice” condition
on the other hand, individuals mutually choose one another. To be left by a partner may create distrust
that drives individuals to contribute less after being excluded.
Figure 11 in Appendix B provides a descriptive overview of how exclusion in the previous period affects
the contributions of different types of individuals. There exists an asymmetry in how exclusion in the
previous period affects the most and least cooperative individuals in the sample. The most cooperative
individuals reduce their contributions after being excluded in the “Choice” condition. The least
cooperative individuals in the “Choice” condition increase their contributions after being excluded in the
previous period. Thus, the results suggest that retaliation may arise even when punishment is of an
informal character. As this is only an exploratory observation, I will not pursue it in more detail.
6 Nikiforakis (2008) examines if punished individuals counter-punish. The results show that counter-punishment in social
dilemmas is driven partly by strategic considerations and partly by a desire to reciprocate punishment. When counter-
punishment opportunities exist, cooperators are less willing to punish free riders. This in turn leads to lower earnings in
comparison to a treatment where free riding is dominant, but where punishment is not allowed.
28
Result 2: Partner choice benefits cooperative individuals, whereas non-cooperators are made worse off.
The experimental design has allowed a clean identification of the link between cooperative dispositions
and mutual partner choice. Results show significant differences in earned payoffs between cooperative
and non-cooperative individuals when they are allowed to choose a partner.
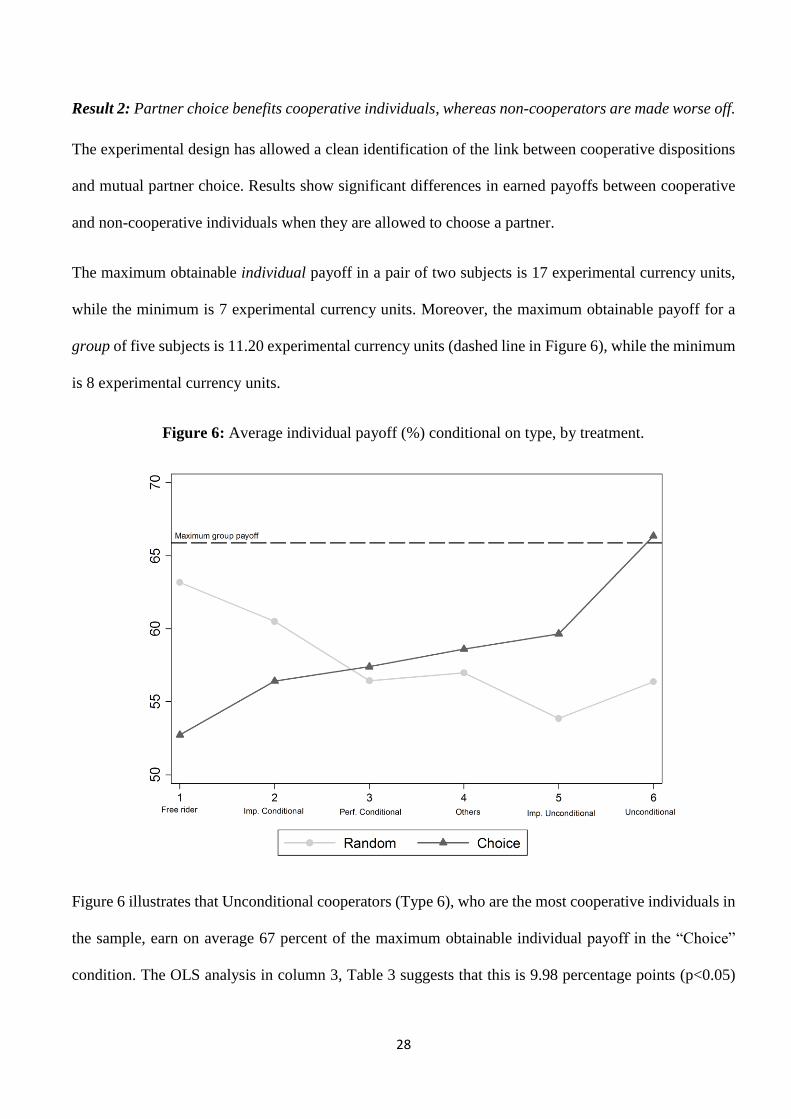
The maximum obtainable individual payoff in a pair of two subjects is 17 experimental currency units,
while the minimum is 7 experimental currency units. Moreover, the maximum obtainable payoff for a
group of five subjects is 11.20 experimental currency units (dashed line in Figure 6), while the minimum
is 8 experimental currency units.
Figure 6: Average individual payoff (%) conditional on type, by treatment.
Figure 6 illustrates that Unconditional cooperators (Type 6), who are the most cooperative individuals in
the sample, earn on average 67 percent of the maximum obtainable individual payoff in the “Choice”
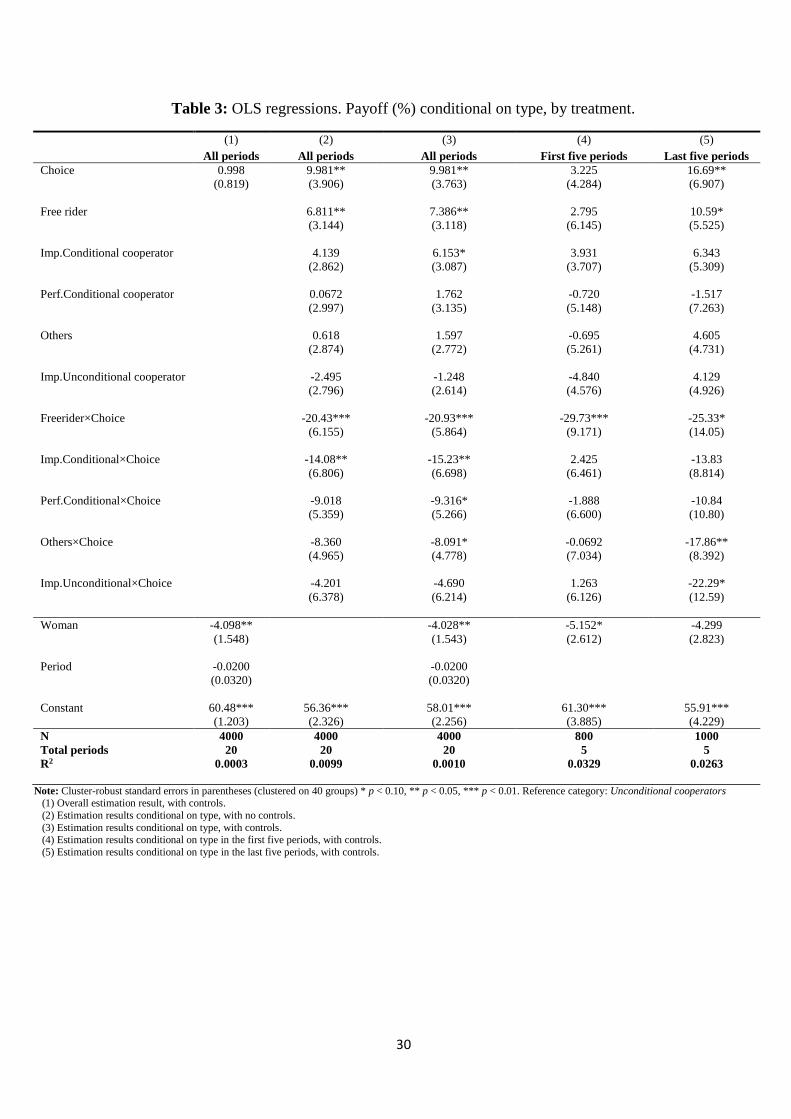
condition. The OLS analysis in column 3, Table 3 suggests that this is 9.98 percentage points (p<0.05)
29
more than in the baseline condition. Although not significant, Unconditional cooperators are also the
only type of individuals who earn more than the maximum obtainable group payoff.
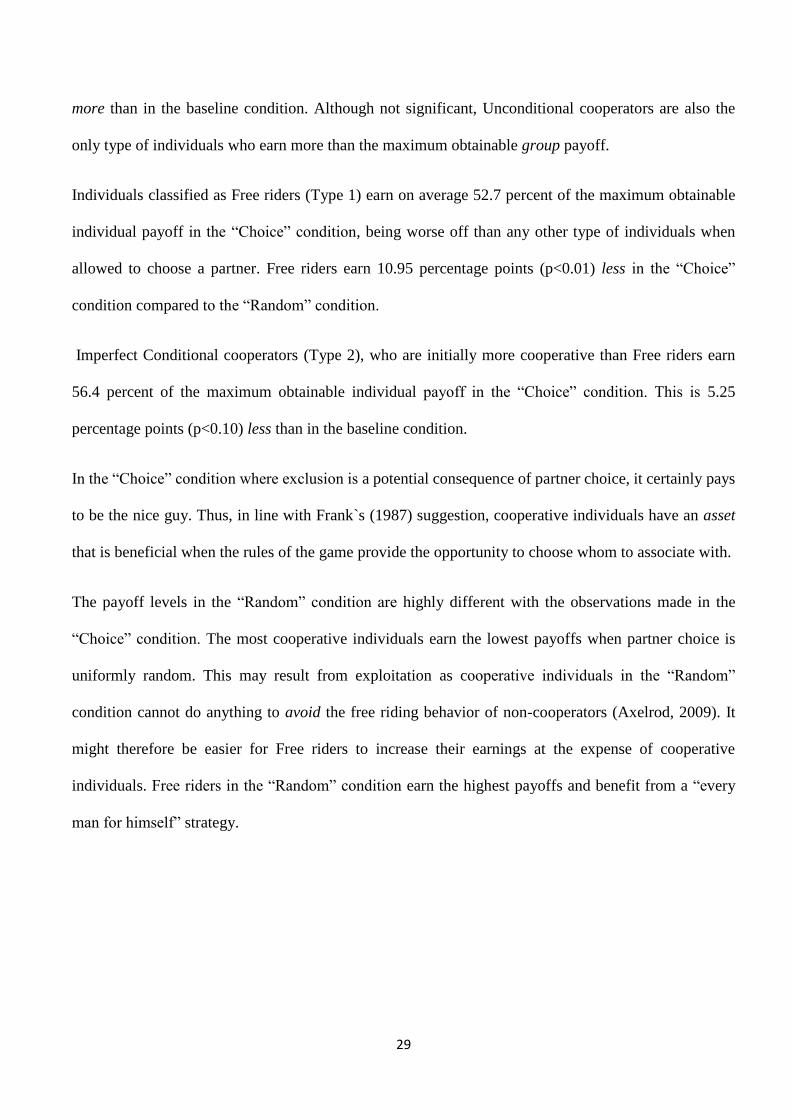
Individuals classified as Free riders (Type 1) earn on average 52.7 percent of the maximum obtainable
individual payoff in the “Choice” condition, being worse off than any other type of individuals when
allowed to choose a partner. Free riders earn 10.95 percentage points (p<0.01) less in the “Choice”
condition compared to the “Random” condition.
Imperfect Conditional cooperators (Type 2), who are initially more cooperative than Free riders earn
56.4 percent of the maximum obtainable individual payoff in the “Choice” condition. This is 5.25
percentage points (p<0.10) less than in the baseline condition.
In the “Choice” condition where exclusion is a potential consequence of partner choice, it certainly pays
to be the nice guy. Thus, in line with Frank`s (1987) suggestion, cooperative individuals have an asset
that is beneficial when the rules of the game provide the opportunity to choose whom to associate with.
The payoff levels in the “Random” condition are highly different with the observations made in the
“Choice” condition. The most cooperative individuals earn the lowest payoffs when partner choice is
uniformly random. This may result from exploitation as cooperative individuals in the “Random”
condition cannot do anything to avoid the free riding behavior of non-cooperators (Axelrod, 2009). It
might therefore be easier for Free riders to increase their earnings at the expense of cooperative
individuals. Free riders in the “Random” condition earn the highest payoffs and benefit from a “every
man for himself” strategy.
30
Table 3: OLS regressions. Payoff (%) conditional on type, by treatment.
(1) (2) (3) (4) (5)
All periods All periods All periods First five periods Last five periods
Choice 0.998 9.981** 9.981** 3.225 16.69**
(0.819) (3.906) (3.763) (4.284) (6.907)
Free rider 6.811** 7.386** 2.795 10.59*
(3.144) (3.118) (6.145) (5.525)
Imp.Conditional cooperator 4.139 6.153* 3.931 6.343
(2.862) (3.087) (3.707) (5.309)
Perf.Conditional cooperator 0.0672 1.762 -0.720 -1.517
(2.997) (3.135) (5.148) (7.263)
Others 0.618 1.597 -0.695 4.605
(2.874) (2.772) (5.261) (4.731)
Imp.Unconditional cooperator -2.495 -1.248 -4.840 4.129
(2.796) (2.614) (4.576) (4.926)
Freerider×Choice -20.43*** -20.93*** -29.73*** -25.33*
(6.155) (5.864) (9.171) (14.05)
Imp.Conditional×Choice -14.08** -15.23** 2.425 -13.83
(6.806) (6.698) (6.461) (8.814)
Perf.Conditional×Choice -9.018 -9.316* -1.888 -10.84
(5.359) (5.266) (6.600) (10.80)
Others×Choice -8.360 -8.091* -0.0692 -17.86**
(4.965) (4.778) (7.034) (8.392)
Imp.Unconditional×Choice -4.201 -4.690 1.263 -22.29*
(6.378) (6.214) (6.126) (12.59)
Woman -4.098** -4.028** -5.152* -4.299
(1.548) (1.543) (2.612) (2.823)
Period -0.0200 -0.0200
(0.0320) (0.0320)
Constant 60.48*** 56.36*** 58.01*** 61.30*** 55.91***
(1.203) (2.326) (2.256) (3.885) (4.229)
N
Total periods
R2
4000
20
0.0003
4000
20
0.0099
4000
20
0.0010
800
5
0.0329
1000
5
0.0263
Note: Cluster-robust standard errors in parentheses (clustered on 40 groups) * p < 0.10, ** p < 0.05, *** p < 0.01. Reference category: Unconditional cooperators (1) Overall estimation result, with controls.
(2) Estimation results conditional on type, with no controls.
(3) Estimation results conditional on type, with controls. (4) Estimation results conditional on type in the first five periods, with controls.
(5) Estimation results conditional on type in the last five periods, with controls.
31
3.6.2 Robustness checks
Robustness check 1: Cooperative types based on the average conditional contributions
As a robustness check and as an attempt to examine if the classification procedure in the former analysis
is responsible for some of the main results, I redefine the measure of cooperative types. Instead of using
the median conditional contributions from the “First part” of the experiment to classify types, I now use
the average conditional contributions. The cut-off values remain the same as in the previous classification
procedure. Table 2 displays the composition of types in the sample when the average conditional
contributions are used to classify types.
One drawback with classifying cooperative types by using the average conditional contribution is that it
is sensitive to deviations. For instance, to contribute on average 0.18 experimental currency units clearly
expresses that an individual is close to being a perfect Free rider. However, by using the same cut-off
values as in the previous classification procedure, this individual will be categorized as an Imperfect
Conditional cooperator. Still, as a robustness check of the previous results it is beneficial to alter the
measure of cooperative types to examine if the main results hold.
Does it still pay to be the nice guy? The OLS analysis in Table 10, Appendix B yields highly comparable
results to the previous analysis. Moreover, there appear to be higher differences in payoffs between the
“Choice” and baseline condition when the average conditional contributions are used to classify
cooperative types. Unconditional cooperators earn 14.8 percentage points (p<0.01) more in the “Choice”
condition compared to the baseline condition. Non-cooperators still earn the lowest payoffs when they
are allowed to choose a partner. More specifically, Free riders in the “Choice” condition earn 19.08
percentage points (p<0.01) less than in the “Random” condition. The results are comparable for the other
classified types as well.
32
Robustness check 2: Continuous type measure
Instead of creating cut-off values to classify cooperative types, I now consider a median and an average
continuous type measure. The median and average continuous type measure range from 0 to 10
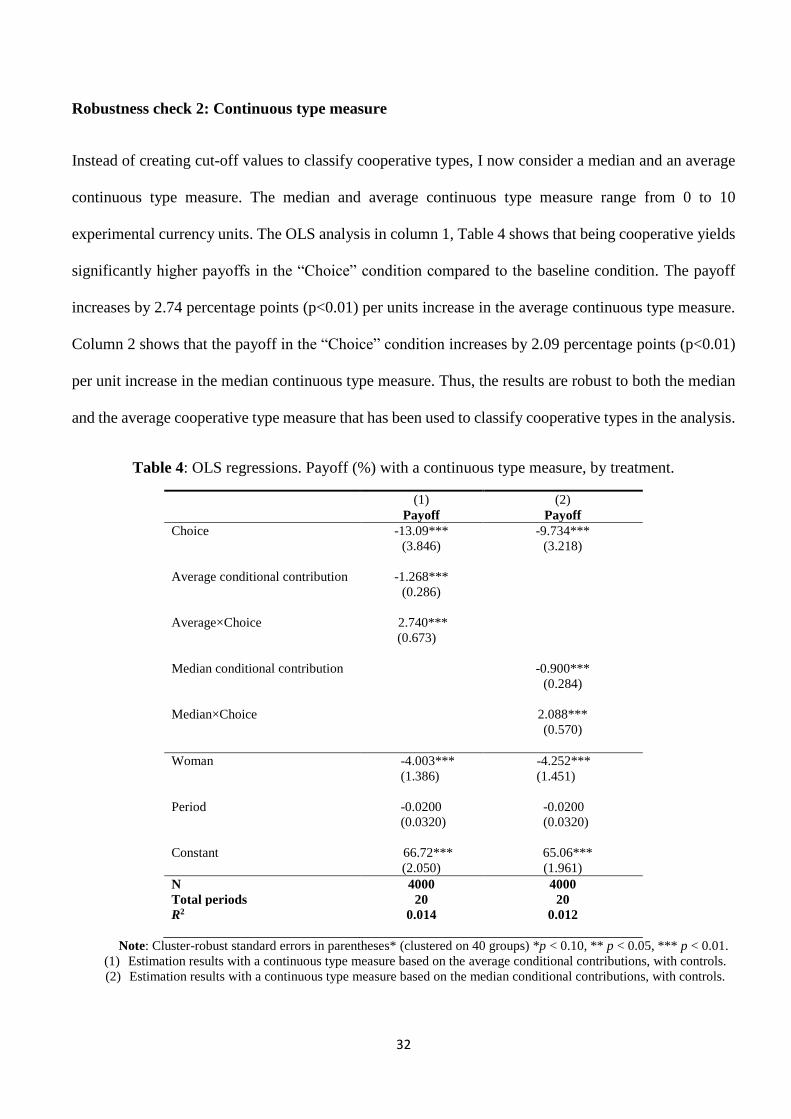
experimental currency units. The OLS analysis in column 1, Table 4 shows that being cooperative yields
significantly higher payoffs in the “Choice” condition compared to the baseline condition. The payoff
increases by 2.74 percentage points (p<0.01) per units increase in the average continuous type measure.
Column 2 shows that the payoff in the “Choice” condition increases by 2.09 percentage points (p<0.01)
per unit increase in the median continuous type measure. Thus, the results are robust to both the median
and the average cooperative type measure that has been used to classify cooperative types in the analysis.
Table 4: OLS regressions. Payoff (%) with a continuous type measure, by treatment.
(1) (2)
Payoff Payoff
Choice -13.09*** -9.734***
(3.846) (3.218)
Average conditional contribution -1.268***
(0.286)
Average×Choice 2.740***
(0.673)
Median conditional contribution -0.900***
(0.284)
Median×Choice 2.088***
(0.570)
Woman
Period
-4.003***
(1.386)
-0.0200
(0.0320)
-4.252***
(1.451)
-0.0200
(0.0320)
Constant 66.72*** 65.06***
(2.050) (1.961)
N
Total periods
4000
20
4000
20
R2 0.014 0.012
Note: Cluster-robust standard errors in parentheses* (clustered on 40 groups) *p < 0.10, ** p < 0.05, *** p < 0.01.
(1) Estimation results with a continuous type measure based on the average conditional contributions, with controls.
(2) Estimation results with a continuous type measure based on the median conditional contributions, with controls.
33
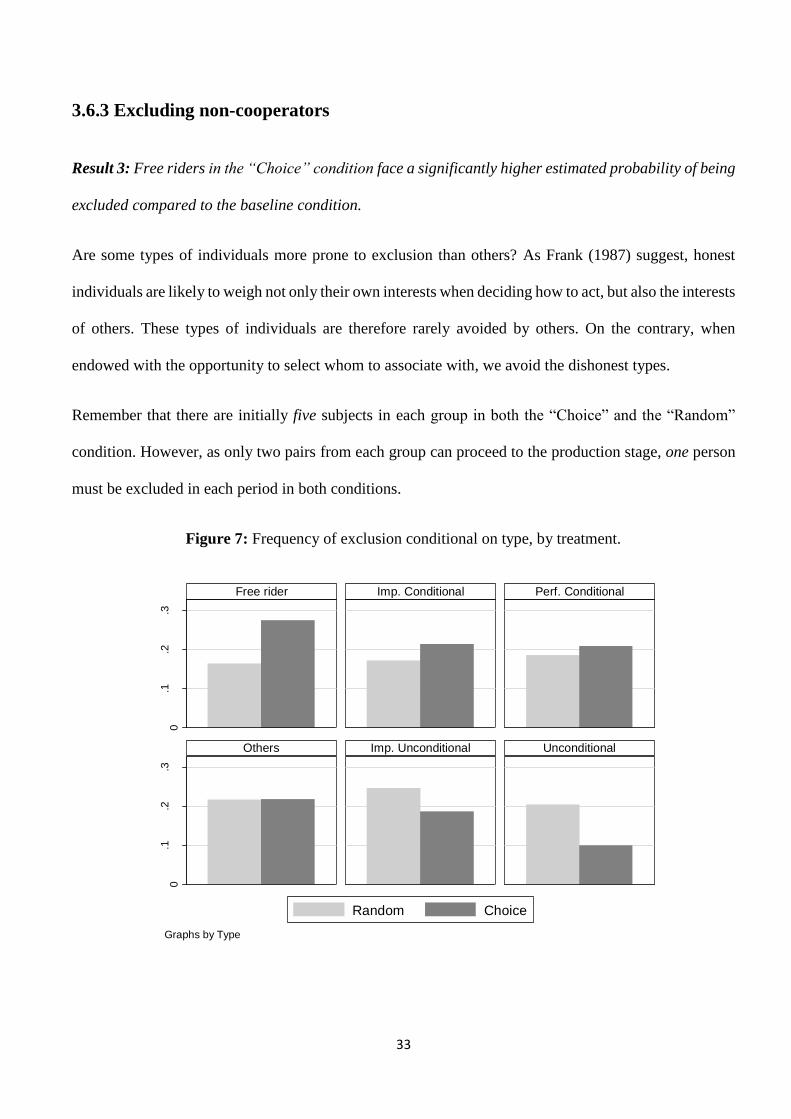
3.6.3 Excluding non-cooperators
Result 3: Free riders in the “Choice” condition face a significantly higher estimated probability of being
excluded compared to the baseline condition.
Are some types of individuals more prone to exclusion than others? As Frank (1987) suggest, honest
individuals are likely to weigh not only their own interests when deciding how to act, but also the interests
of others. These types of individuals are therefore rarely avoided by others. On the contrary, when
endowed with the opportunity to select whom to associate with, we avoid the dishonest types.
Remember that there are initially five subjects in each group in both the “Choice” and the “Random”
condition. However, as only two pairs from each group can proceed to the production stage, one person
must be excluded in each period in both conditions.
Figure 7: Frequency of exclusion conditional on type, by treatment.
0.1
.2.3
0.1
.2.3
Free rider Imp. Conditional Perf. Conditional
Others Imp. Unconditional Unconditional
Random Choice
Mea
n o
f e
xclu
sio
n
Graphs by Type
34
The probability of exclusion in the “Random” condition is by construction 20 %, and is as Figure 7 above
illustrates, quite evenly distributed. However, by observing exclusion in the “Choice” condition one can
see that the least cooperative individuals face the highest probability of exclusion when partner choice is
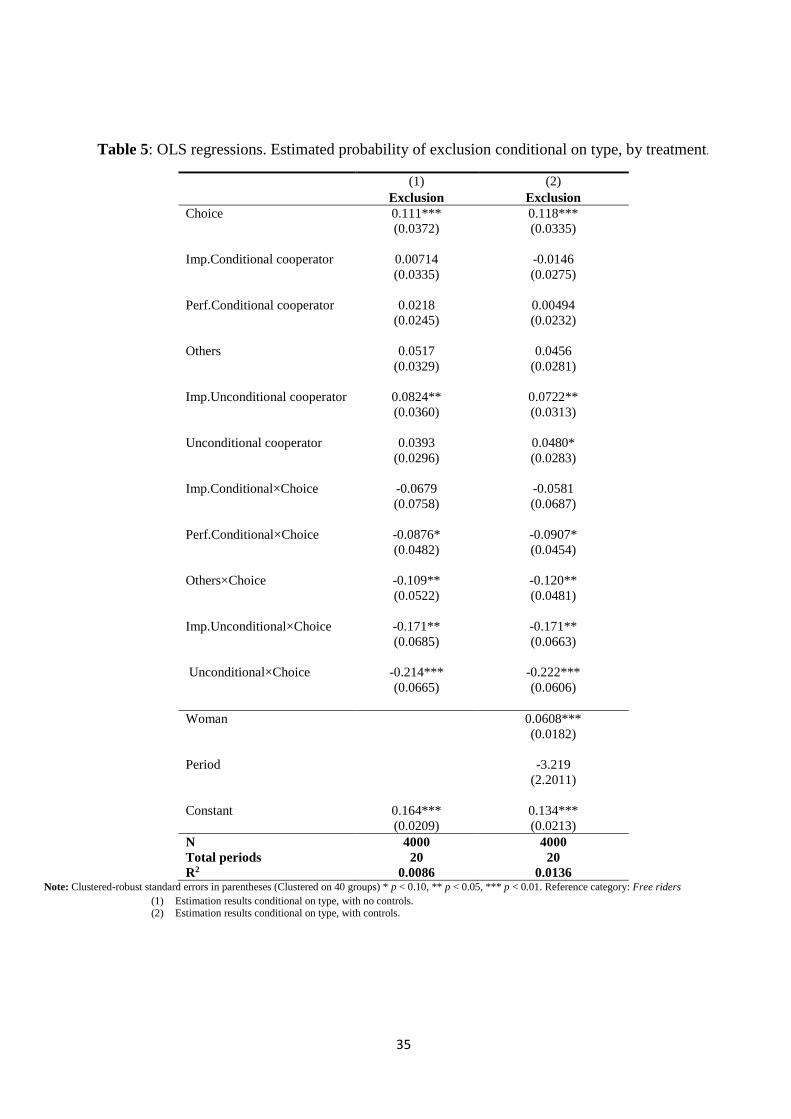
allowed. The results of the OLS analysis in column 2, Table 5 show that Free riders face a 11.8 percentage
points (p<0.01) higher estimated probability of exclusion in the “Choice” condition compared to the
“Random” condition. Thus, the results show that partner choice can work as an informal punishment
mechanism for the least cooperative individuals.
Individuals in the sample who are classified as being cooperative experience a reduced estimated
probability of exclusion when allowed to choose a partner. Unconditional cooperators in the “Choice”
condition face a 10.4 percentage points (p<0.01) lower estimated probability of exclusion compared to
the baseline condition. Individuals who are classified as Imperfect Unconditional cooperators are initially
less cooperative than Unconditional cooperators. Still, this type of individuals also experiences a 5.3
percentage points (p<0.05) lower estimated probability of exclusion when allowed to choose a partner.
35
Table 5: OLS regressions. Estimated probability of exclusion conditional on type, by treatment.
(1) (2)
Exclusion Exclusion
Choice 0.111*** 0.118***
(0.0372) (0.0335)
Imp.Conditional cooperator 0.00714 -0.0146
(0.0335) (0.0275)
Perf.Conditional cooperator 0.0218 0.00494
(0.0245) (0.0232)
Others 0.0517 0.0456
(0.0329) (0.0281)
Imp.Unconditional cooperator 0.0824** 0.0722**
(0.0360) (0.0313)
Unconditional cooperator 0.0393 0.0480*
(0.0296) (0.0283)
Imp.Conditional×Choice -0.0679 -0.0581
(0.0758) (0.0687)
Perf.Conditional×Choice -0.0876* -0.0907*
(0.0482) (0.0454)
Others×Choice -0.109** -0.120**
(0.0522) (0.0481)
Imp.Unconditional×Choice -0.171** -0.171**
(0.0685) (0.0663)
Unconditional×Choice -0.214*** -0.222***
(0.0665) (0.0606)
Woman 0.0608***
(0.0182)
Period -3.219
(2.2011)
Constant 0.164*** 0.134***
(0.0209) (0.0213)
N
Total periods
R2
4000
20
0.0086
4000
20
0.0136 Note: Clustered-robust standard errors in parentheses (Clustered on 40 groups) * p < 0.10, ** p < 0.05, *** p < 0.01. Reference category: Free riders
(1) Estimation results conditional on type, with no controls. (2) Estimation results conditional on type, with controls.
36
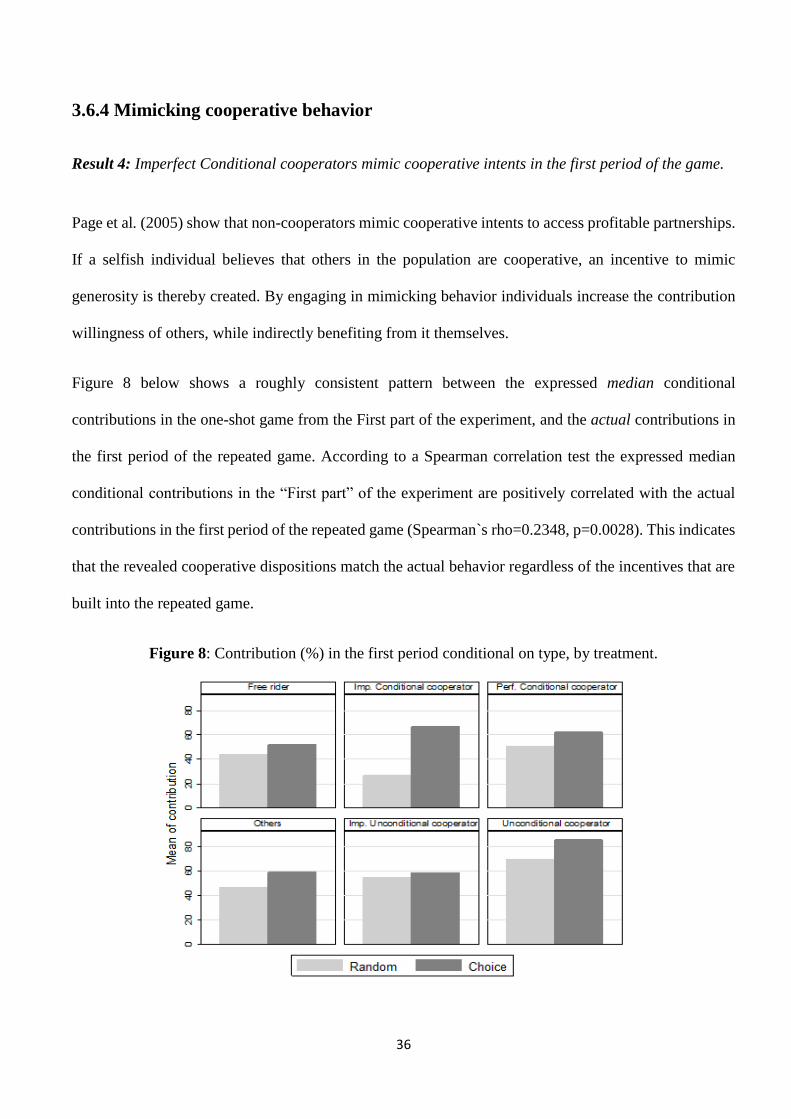
3.6.4 Mimicking cooperative behavior
Result 4: Imperfect Conditional cooperators mimic cooperative intents in the first period of the game.
Page et al. (2005) show that non-cooperators mimic cooperative intents to access profitable partnerships.
If a selfish individual believes that others in the population are cooperative, an incentive to mimic
generosity is thereby created. By engaging in mimicking behavior individuals increase the contribution
willingness of others, while indirectly benefiting from it themselves.
Figure 8 below shows a roughly consistent pattern between the expressed median conditional
contributions in the one-shot game from the First part of the experiment, and the actual contributions in
the first period of the repeated game. According to a Spearman correlation test the expressed median
conditional contributions in the “First part” of the experiment are positively correlated with the actual
contributions in the first period of the repeated game (Spearman`s rho=0.2348, p=0.0028). This indicates
that the revealed cooperative dispositions match the actual behavior regardless of the incentives that are
built into the repeated game.
Figure 8: Contribution (%) in the first period conditional on type, by treatment.
37
However, the results of a Wilcoxon-Mann-Whitney test show that the rank sum is higher than expected
in the “Choice” condition only for individuals classified as Imperfect Conditional cooperators (p=0.03,
Two tailed). Other types of individuals seem to exhibit consistent contribution preferences7.
Imperfect Conditional cooperators who initially have a bias towards selfish behavior are more prone to
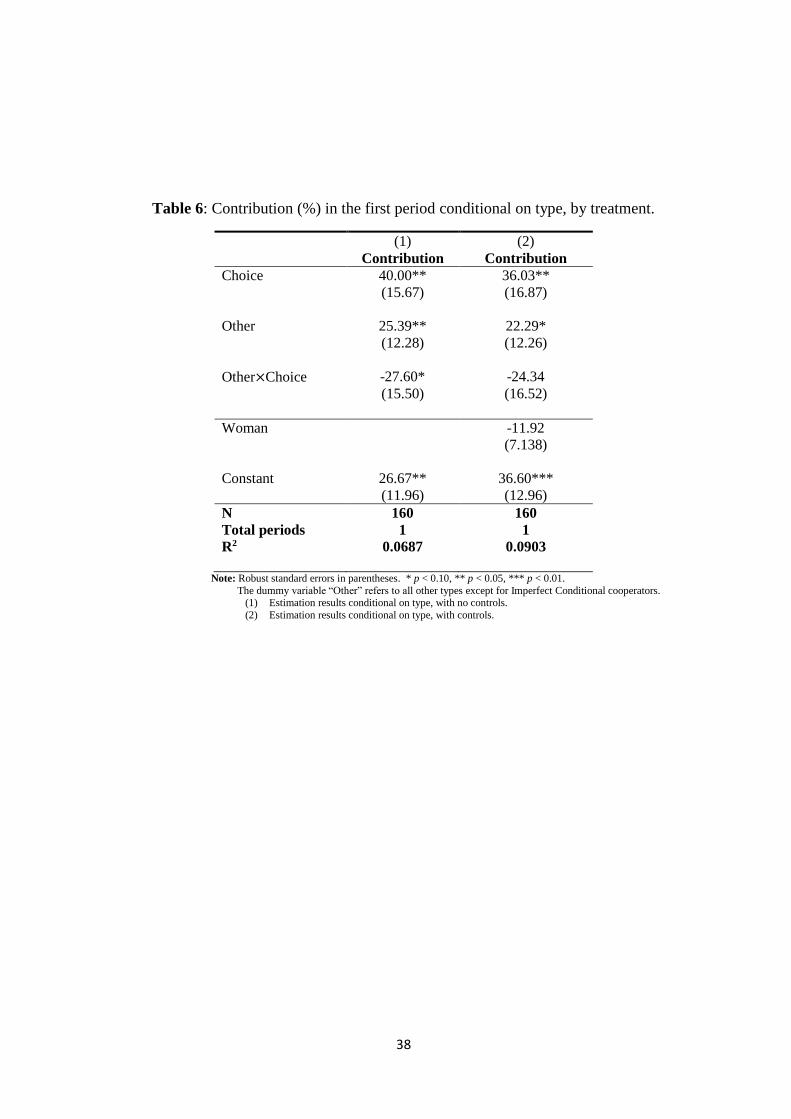
mimic cooperative intents when allowed to choose a partner. This type of individuals contributes 66.6 %
of their initial endowment in the first period in “Choice” condition, compared to only 26.6 % of their
endowment in the “Random” condition. The joint OLS analysis in column 1, Table 6 indicates that this
is a 40 percentage points (p<0.05) increase compared to the baseline condition. The five other classified
types increase their contributions by 12.4 percentage points (p<0.10) in the “Choice” condition compared
to the baseline condition. Imperfect Conditional cooperators seem to be more sensitive to the treatment
in the first period, compared to all other types. This contribution behavior can be attributed to mimicking
cooperative intents as a way of attracting potential partners.
7 As a robustness check I also test the correlation between the average conditional contributions in the one-shot game and the
actual contributions in the first period of the repeated game. Results show a positive and significant correlation between one`s
average contribution in the one-shot game and the contribution in the first period of the repeated game (Spearman`s rho=
0.2802, p=0.0003).
38
Table 6: Contribution (%) in the first period conditional on type, by treatment.
(1) (2)
Contribution Contribution
Choice 40.00** 36.03**
(15.67) (16.87)
Other 25.39** 22.29*
(12.28) (12.26)
Other×Choice -27.60* -24.34
(15.50) (16.52)
Woman -11.92
(7.138)
Constant 26.67** 36.60***
(11.96) (12.96)
N
Total periods
R2
160
1
0.0687
160
1
0.0903
Note: Robust standard errors in parentheses. * p < 0.10, ** p < 0.05, *** p < 0.01.
The dummy variable “Other” refers to all other types except for Imperfect Conditional cooperators. (1) Estimation results conditional on type, with no controls.
(2) Estimation results conditional on type, with controls.
39
3.6.5 Partner choice as a regrouping device
Result 5: When provided with the opportunity to choose a partner, individuals sort into stable
partnerships over time.
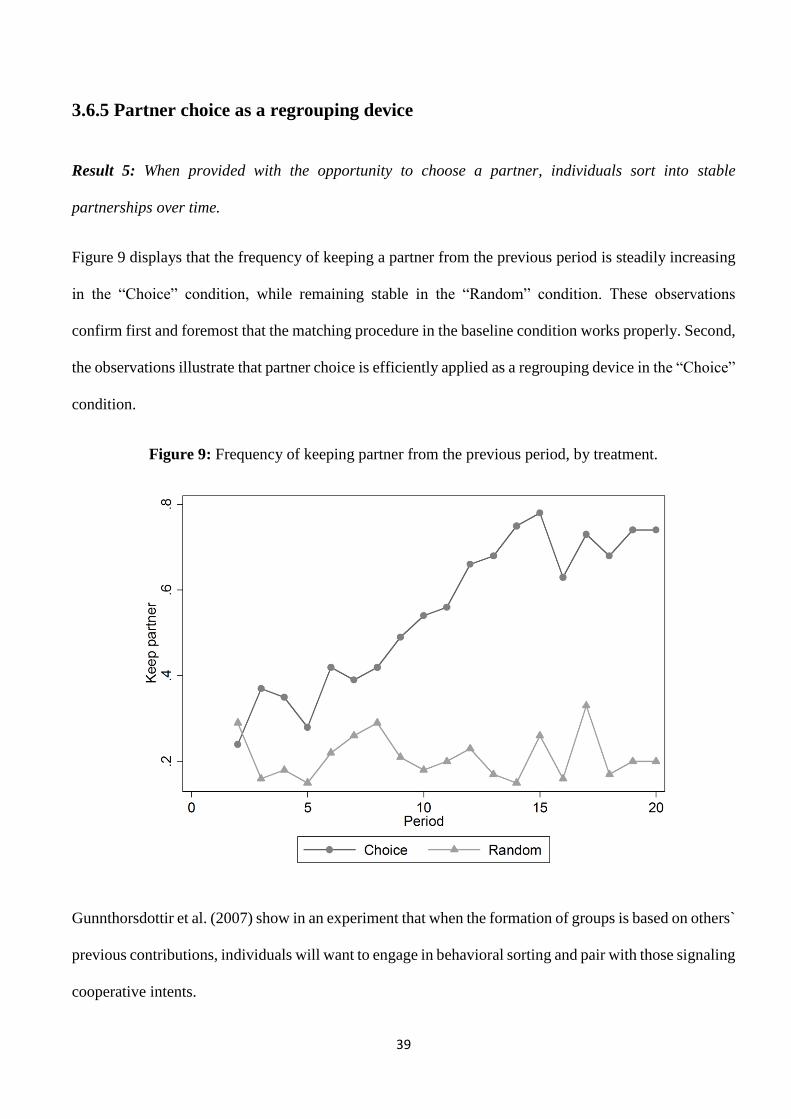
Figure 9 displays that the frequency of keeping a partner from the previous period is steadily increasing
in the “Choice” condition, while remaining stable in the “Random” condition. These observations
confirm first and foremost that the matching procedure in the baseline condition works properly. Second,
the observations illustrate that partner choice is efficiently applied as a regrouping device in the “Choice”
condition.
Figure 9: Frequency of keeping partner from the previous period, by treatment.
Gunnthorsdottir et al. (2007) show in an experiment that when the formation of groups is based on others`
previous contributions, individuals will want to engage in behavioral sorting and pair with those signaling
cooperative intents.
40
Does one`s type affect the estimated probability of keeping a partner from the previous period? The OLS
regression in column 1, Table 7 shows that Unconditional cooperators have a 41.1 percentage points
(p<0.01) higher estimated probability of keeping their previous partner in the “Choice” condition
compared to the baseline condition. Moreover, column 3 indicates that the estimated probability of
keeping a partner from the previous period is 71.4 percentage points (p<0.01) higher in the “Choice”
condition in the last five periods of the game.
Free riders have a 21.9 percentage points (p<0.10) higher estimated probability of keeping their previous
partner in the “Choice” condition compared to the baseline condition. The estimated probability increases
to 23 percentage points (p<0.01) in the last five periods of the game in the “Choice” condition.
In other words, when allowed to directly influence whom to associate with, the most cooperative
individuals are remarkably better at committing to partnerships than the least cooperative individuals.
41
Table 7: OLS regressions. Estimated probability of keeping partner from the previous period
conditional on type, by treatment.
(1) (2) (3)
All periods All periods Last five periods
Choice 0.411*** 0.411*** 0.714***
(0.0695) (0.0694) (0.0765)
Free rider -0.00357 -0.00179 0.0836
(0.0376) (0.0369) (0.0767)
Imp.Conditional cooperator -0.00357 0.00266 0.0211
(0.0281) (0.0297) (0.0523)
Perf.Conditional cooperator -0.0147 -0.00944 0.0191
(0.0322) (0.0332) (0.0790)
Others -0.0386 -0.0355 0.00265
(0.0367) (0.0373) (0.0759)
Imp.Unconditional cooperator -0.0319 -0.0280 0.0230
(0.0269) (0.0273) (0.0853)
Freerider×Choice -0.192* -0.194* -0.484***
(0.108) (0.107) (0.172)
Imp.Conditional×Choice -0.0214 -0.0250 -0.0100
(0.0950) (0.0963) (0.0759)
Perf.Conditional×Choice -0.110 -0.111 -0.206
(0.0758) (0.0755) (0.131)
Others×Choice -0.114 -0.114 -0.307**
(0.0884) (0.0891) (0.115)
Imp.Unconditional×Choice -0.0165 -0.0180 -0.180
(0.0867) (0.0859) (0.143)
Woman -0.0125 0.0150
(0.0206) (0.0330)
Period 0.0149***
(0.00345)
Constant 0.229*** 0.0769 0.180***
(0.0290) (0.0476) (0.0625)
N
Total periods
R2
4000
20
0.1198
4000
20
0.1514
1000
5
0.2768 Note: Cluster-robust standard errors in parentheses (Clustered on groups of 40) * p < 0.10, ** p < 0.05, *** p < 0.01. Reference category: Unconditional cooperators
(1) Estimation results conditional on type, with no controls.
(2) Estimation results conditional on type, with controls.
(3) Estimation results conditional on type in the last five periods, with controls.
42
Chapter 4: The Norwegian Citizen panel experiment
The main reason for excluding brokers from the private clubs of the London stock exchange market was
to include reliable and exclude unreliable ones. Although excluded brokers could work and earn money
outside the private clubs, membership was highly valued (Stringham, 2015). Which cost of exclusion
motivated brokers to be more honest, the social or the monetary?
Kerr (1999) examines a similar question in a resource dilemma game. Individuals are in groups of five
and they are fully identifiable. As only four individuals from the group can proceed to the next stage in
the game, each individual can cast a vote on the individual they wish to exclude from the group. The
individual with the most votes is excluded. The objective cost of exclusion is varied in both the treatment
and control condition. One of the main results show that individuals who are excluded and who get to
keep the average of others` payoff, maintain higher contribution levels compared to individuals who are
randomly excluded in the baseline condition. Thus, individuals prefer not to pay the social cost associated
with exclusion.
The social cost of exclusion is often highly valued because individuals care about the “shadow of the
future” (Blake et al., 2015). Throughout our upbringing we are taught that if we are nice to others, good
things will happen to us in the future. The important role of the future is incorporated in the way we think
and behave. This might explain why myopic behaviour is challenging in everyday life. It might pay to
gain a good reputation today as we cannot avoid subsequent interactions in the future.
To examine the distinction between the social and the monetary cost associated with exclusion, I conduct
a survey experiment in the Norwegian Citizen panel8. The key question of this experiment examines if
exclusion due to being the least contributor in a group increases cooperation in a social dilemma. The
8 The Norwegian Citizen panel is a web based survey of Norwegians` opinions toward societal matters. The participants are
randomly selected from the National Registry. The web survey is usually sent out every six months, and takes on average 20
minutes to complete.
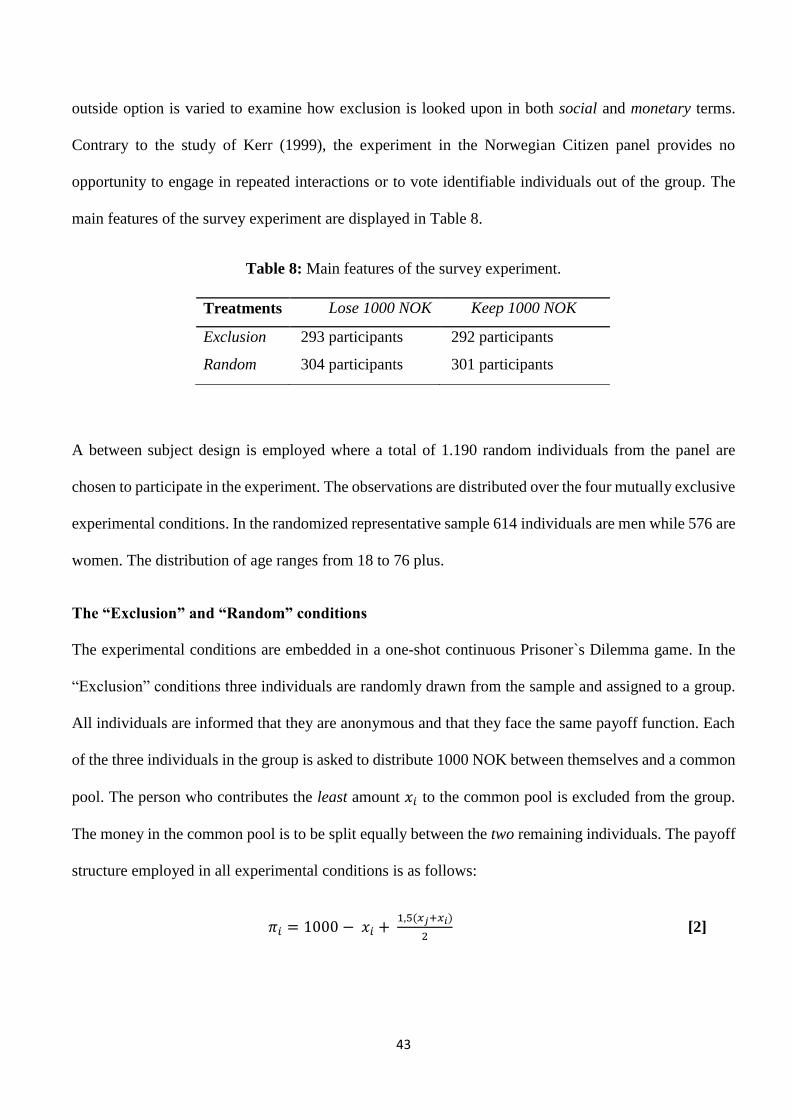
43
outside option is varied to examine how exclusion is looked upon in both social and monetary terms.
Contrary to the study of Kerr (1999), the experiment in the Norwegian Citizen panel provides no
opportunity to engage in repeated interactions or to vote identifiable individuals out of the group. The
main features of the survey experiment are displayed in Table 8.
Table 8: Main features of the survey experiment.
A between subject design is employed where a total of 1.190 random individuals from the panel are
chosen to participate in the experiment. The observations are distributed over the four mutually exclusive
experimental conditions. In the randomized representative sample 614 individuals are men while 576 are
women. The distribution of age ranges from 18 to 76 plus.
The “Exclusion” and “Random” conditions
The experimental conditions are embedded in a one-shot continuous Prisoner`s Dilemma game. In the
“Exclusion” conditions three individuals are randomly drawn from the sample and assigned to a group.
All individuals are informed that they are anonymous and that they face the same payoff function. Each
of the three individuals in the group is asked to distribute 1000 NOK between themselves and a common
pool. The person who contributes the least amount 𝑥𝑖 to the common pool is excluded from the group.
The money in the common pool is to be split equally between the two remaining individuals. The payoff
structure employed in all experimental conditions is as follows:
𝜋𝑖 = 1000 − 𝑥𝑖 + 1,5(𝑥𝑗+𝑥𝑖)
2 [2]
Treatments Lose 1000 NOK Keep 1000 NOK
Exclusion 293 participants 292 participants
Random 304 participants 301 participants
44
The decision situation in the baseline “Random” conditions is identical to the “Exclusion” conditions.
However, in the “Random” conditions all participants face the same probability of being excluded.
Individuals are informed that one of them will be randomly drawn and excluded from the group. As
exclusion is uniformly random, individuals cannot influence the probability of exclusion by increasing
their contribution levels.
The “Lose” and “Keep” conditions
I distinguish between a high and a low monetary cost associated with exclusion. In the “Lose” conditions
the excluded individual loses the entire initial endowment of 1000 NOK. There is thus a high monetary
cost associated with being excluded. In the “Keep” conditions the excluded individual keeps the 1000
NOK, but misses out on the opportunity to further participate in the group.
4.1 Results
4.1.1 The aggregate effect of exclusion
Result 1: Exclusion due to being the least contributor increases contributions significantly. The result is
purely driven by the social cost of exclusion.
Figure9 10 illustrates that individuals in the “Exclusion” conditions contribute higher amounts of the
initial 1000 NOK than in the “Random” conditions, especially for values above 500 NOK. That is,
individuals in the “Exclusion” conditions seem to be willing to sacrifice higher amounts of money to
avoid being excluded.
9 In total 60 individuals did not submit their answers to the experimental questions. In the “Exclusion Lose” conditions 0.3 %
observations are missing, in the “Exclusion Keep” 0.3 % observations are missing, in the “Random Lose” 0.5 % observations
are missing, while in the “Random Keep” conditions 0.2 % are missing.
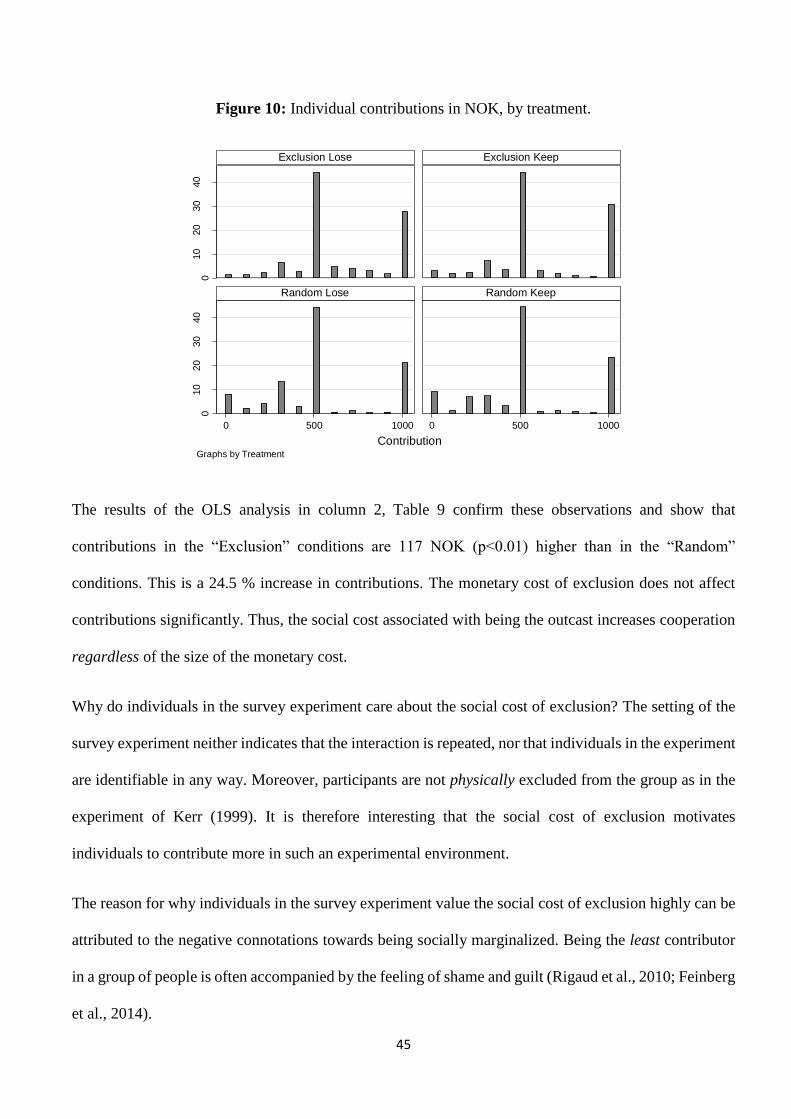
45
Figure 10: Individual contributions in NOK, by treatment.
The results of the OLS analysis in column 2, Table 9 confirm these observations and show that
contributions in the “Exclusion” conditions are 117 NOK (p<0.01) higher than in the “Random”
conditions. This is a 24.5 % increase in contributions. The monetary cost of exclusion does not affect
contributions significantly. Thus, the social cost associated with being the outcast increases cooperation
regardless of the size of the monetary cost.
Why do individuals in the survey experiment care about the social cost of exclusion? The setting of the
survey experiment neither indicates that the interaction is repeated, nor that individuals in the experiment
are identifiable in any way. Moreover, participants are not physically excluded from the group as in the
experiment of Kerr (1999). It is therefore interesting that the social cost of exclusion motivates
individuals to contribute more in such an experimental environment.
The reason for why individuals in the survey experiment value the social cost of exclusion highly can be
attributed to the negative connotations towards being socially marginalized. Being the least contributor
in a group of people is often accompanied by the feeling of shame and guilt (Rigaud et al., 2010; Feinberg
et al., 2014).
010
20
30
40
010
20
30
40
0 500 1000 0 500 1000
Exclusion Lose Exclusion Keep
Random Lose Random Keep
Perc
ent
ContributionGraphs by Treatment
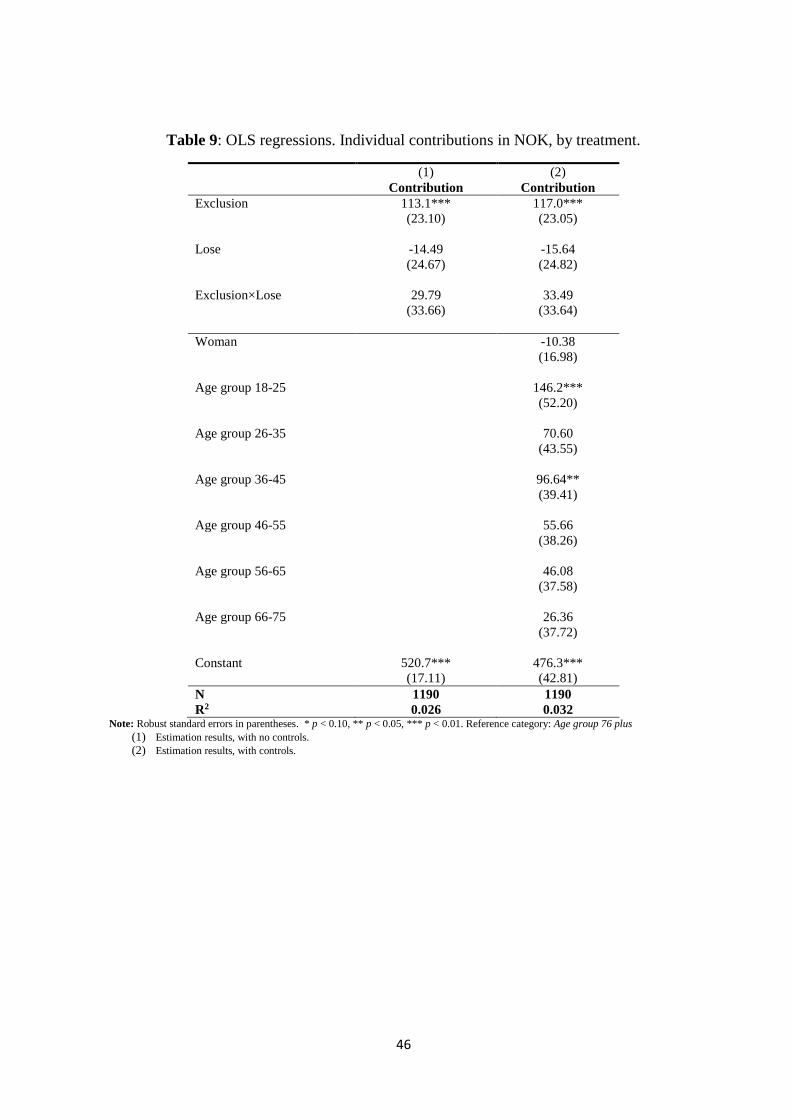
46
Table 9: OLS regressions. Individual contributions in NOK, by treatment.
(1) (2)
Contribution Contribution
Exclusion 113.1*** 117.0***
(23.10) (23.05)
Lose -14.49 -15.64
(24.67) (24.82)
Exclusion×Lose 29.79 33.49
(33.66) (33.64)
Woman -10.38
(16.98)
Age group 18-25 146.2***
(52.20)
Age group 26-35 70.60
(43.55)
Age group 36-45 96.64**
(39.41)
Age group 46-55 55.66
(38.26)
Age group 56-65 46.08
(37.58)
Age group 66-75 26.36
(37.72)
Constant 520.7*** 476.3***
(17.11) (42.81)
N
R2
1190
0.026
1190
0.032 Note: Robust standard errors in parentheses. * p < 0.10, ** p < 0.05, *** p < 0.01. Reference category: Age group 76 plus
(1) Estimation results, with no controls.
(2) Estimation results, with controls.
47
Chapter 5: Concluding remarks
Partner choice as an informal punishment mechanism
In the game of life it pays to be the nice guy. The results of the lab experiment illustrate that partner
choice can work as an informal punishment mechanism for the least cooperative individuals. Free riders
are avoided and resemble the “Lame ducks” of the London exchange market. The cooperative individuals
are preferred as partners and earn the highest payoffs in the game.
Contrary to other studies on partner choice, this thesis illustrates that partner choice can prevent non co-
operators of profiting at the expense of cooperative individuals. The novelty of these results is that they
show that it pays to be predisposed to cooperate, a question that has not received a lot of experimental
attention before. I address this question by allowing individuals to choose a partner and examine if it
helps cooperators gain an edge over free riders. Being nice to others without expecting anything back
has proven to be a beneficial commitment device that pays in the long run (Frank, 1987). These results
emphasize that doing good by engaging in prosocial behaviour can often be accompanied by doing well
in social and monetary terms.
The social cost of exclusion
The Norwegian Citizen panel experiment has shed light on the distinction between the social and the
monetary cost of exclusion. The survey experiment yields interesting results that show the importance of
the social cost when faced with exclusion. When the threat of excluding non-cooperators is perceived as
real, individuals are willing to refrain from material self-interested behaviour. These results echo
experiences most of us have had as members of teams, organizations and families. In some rules of the
game sustaining a good reputation and the feeling of belongingness is what matters the most.
48
Literature
Alger, I. & Weibull, W.J. (2013). Homo Moralis- Preference Evolution under Incomplete Information
and Assortative Matching. Econometrica ,81(6), p. 2269–2302.
Andreoni, J. & Croson, R. (2008). Partners versus strangers: Random Rematching in Public goods
Experiments. In: Plott,C & Smit, V.L, Handbook of Experimental Economics Results Volume 1,
p.776-783.
Axelrod, R (2009) The evolution of cooperation: Revisited Edition, Basics Books, p. 266.
Barclay, P. & Raihani, N. (2015). Partner choice versus punishment in human Prisoner`s Dilemmas.
Evolution and Human Behavior, Inn press.
Blake, P., Rand, G.D., Tingley, D. & Warneken, F. (2015). The shadow of the future promotes
cooperation in a repeated prisoner`s dilemma for children. Scientific Reports 5,p.1-9
Brandts, J. & Charness, G. (2011). The strategy versus the direct-response method: a first survey of
experimental comparisons. Experimental Economics, 14(3), p. 375-398.
Brekke, K.A., Hauge, K.E., Lind, J.T. & Nyborg, K. (2011). Playing with the good guys: A public
good game with endogenous group formation. Journal of Public Economics, 95(9), p.1111-
1118.
Chaudhuri, A. (2011) Sustaining cooperation in laboratory public goods experiments: a selective
survey of the literature. Experimental Economics, 14(1), p.47-83.
Cinyabuguma, M., Page, T. & Putterman, L. (2005). Cooperation under the threat of expulsion in a
public goods experiment. Journal of Public Economics, 89(8), p.1421-1435.
Cinyabuguma, M., Page, T. & Putterman, L. (2006). On Perverse and Second-Order Punishment in
Public Goods Experiments with Decentralized Sanctioning. Experimental Economics, 9(3),
p.265-279
49
Coricelli, G., Fehr, D. & Fellner, G. (2004). Partner selection in public goods experiments. Journal of
Conflict Resolution, 48(3), p. 356-378.
Crushman, F., Dreber, A., Wang, Y. & Costa, J. (2009). Accidental Outcomes Guide Punishment in a
“Trembling Hand” Game. PLOS ONE, 4(8), p.1-7.
Dreber, A., Rand, G.D., Fudenberg, D. & Nowak A.M. (2008). Winners don`t punish. Nature 452,
p.348-351.
Fehr, E. & Gächter, S. ( 2002). Altruistic Punishment in Humans, Nature, 415, p.137-140.
Feinberg, M., Willer, R. & Schultz, M. (2014). Gossip and Ostracism Promote Cooperation in Groups.
Psychological Science 25, p.1-9.
Fischbacher, U., Gächter, S. & Fehr, E. (2001). Are people conditionally cooperative? Evidence from a
public goods experiment. Economic Letters, 71(3), p.397-404.
Fischbacher, U. & Gächter, S. (2006). Heterogenous Social Preferences and the Dynamics of Free
Riding in Public Goods, IZA Duscussion Paper NO. 2011, p.1-33
Fischbacher, U. & Gächter, S. (2010). Social Preferences, Beliefs, and the Dynamics of Free Riding in
Public goods Experiments, American Economic Review, 100(1), p.541-556.
Fischbacher, U. (2007). z-Tree: Zurich Toolbox for Ready-made Economic Experiments. Experimental
Economics, 10(2), p.171-178.
Frank, R. (1987). If Homo economicus could choose his own utility function, would he want one with a
conscience? American Economic Review. 77(4), p.593-604.
Frank, R. (2004). What price the moral high ground, How to succeed without selling your soul.
Princeton University Press. p.199
Gintis, H. (2005). Behavioral ethics meet natural justice, Politics, Philosophy and Economics ,5(1),
p.5-32.
Guala, F. (2012). Reciprocity: weak or strong? What punishment experiments do (and do not)
demonstrate. Behavioral Brain Science, 35(1), p. 1-15.
50
Gunnthorsdottir, A., Houser, D. & McCabe, K. (2007). Disposition, history and contributions in public
goods experiments. Journal of Economic Behavior & Organization, 62(2), p.304-315.
Hauk, E. & Nagel, R. (2001). Choice of Partners in Multiple Two-Person Prisoner's Dilemma Games
An Experimental Study. Journal of conflict resolution, 45(6), p.770- 793.
Kerr, L.N. (1999) Anonymity and Social Control in social dilemmas, In: Foddy, M., Smithson, S., &
Hogg, A.M. Resolving Social Dilemmas: Dynamic, Structural, and Intergroup Aspects. Psychology
Press, Philadephia. p.448.
Isaac, R.M. & Walker, J. (2008). Group size effects in public goods provision: The voluntary
contributions mechanism. The Quarterly Journal of Economics, 103(1), p.179-199.
Nikiforakis, N. (2008). Punishment and counter-punishment in public goods experiments: Can we
really govern ourselves? Journal of Public Economics, 92(2008), p. 91-112.
Page, T., Putterman, L. & Unel, B. (2005 ). Voluntary association in public goods experiments:
Reciprocity, mimicry and efficiency. The Economic Journal, 115(506), p.1032-1053.
Rigaud Maier, F.P., Martinsson, P. & Staffiero, G. (2010). Ostracism and the provision of a public
good: experimental evidence. Journal of Economic Behavior and Organization 73, p.387-395.
Selten, R. (1967). Die Strategiemethode zur Efrorschung des eingeschränkt rationalen Verhaltens im
Rahmen eines Oligopolexperiments. Beiträge zur experimentellen Wirtschaftsforschung, p.136-
168.
Smith, A. (1766/1978). Lectures on Jurisprudence. Oxford University Press, p.610
Stringham, E. P. (2015) Private governance, Oxford University Press, p.296
Strømland, E., Tjøtta, S. & Torsvik, G. (2016). Reciprocity evolving: partner choice and
communication in a repeated prisoner`s dilemma. Working papers in economics No 1/16.
Tullock, G. (1999). Non-prisoner’s dilemma. Journal of Economic Behavior & Organization, 39(4),
p.455-458.

51
Verbeek, M. (2012). A Guide to Modern Econometrics, Chichester, John Wiley & Sons Ltd, p.497
Wooldridge, J.M. (2009). Introductory Econometrics: A Modern Approach. South-Western Cengage
Learning, p.878
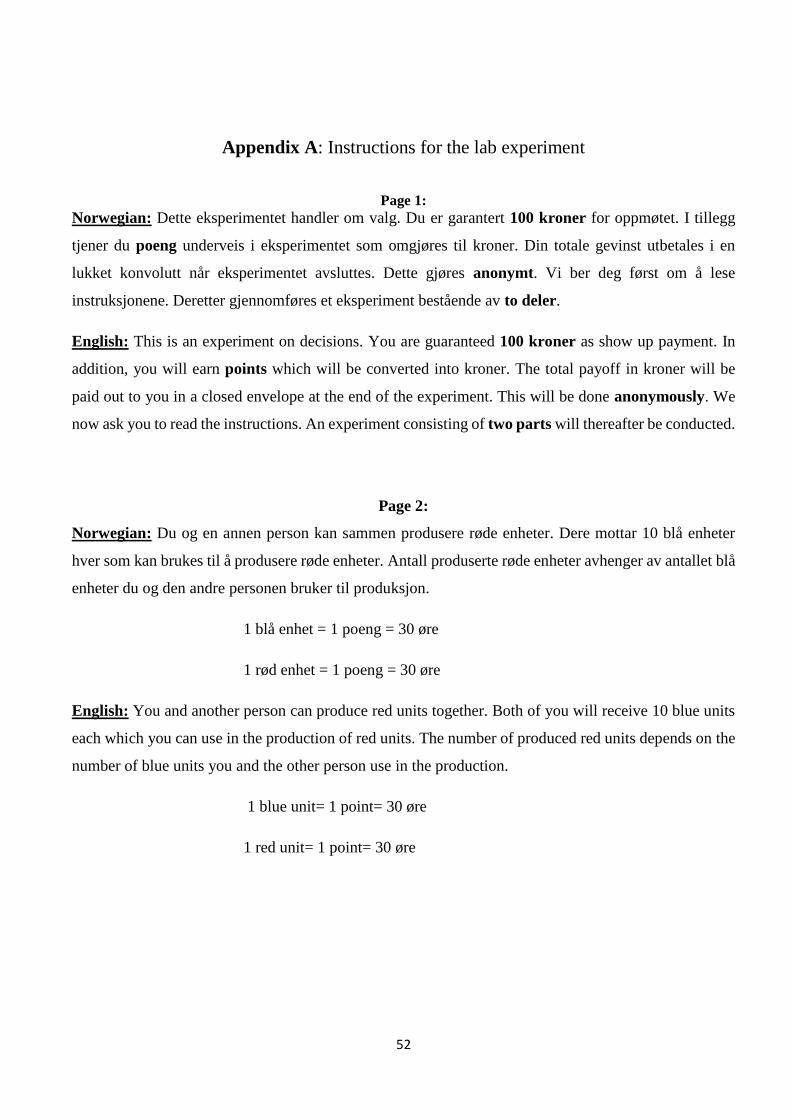
52
Appendix A: Instructions for the lab experiment
Page 1:
Norwegian: Dette eksperimentet handler om valg. Du er garantert 100 kroner for oppmøtet. I tillegg
tjener du poeng underveis i eksperimentet som omgjøres til kroner. Din totale gevinst utbetales i en
lukket konvolutt når eksperimentet avsluttes. Dette gjøres anonymt. Vi ber deg først om å lese
instruksjonene. Deretter gjennomføres et eksperiment bestående av to deler.
English: This is an experiment on decisions. You are guaranteed 100 kroner as show up payment. In
addition, you will earn points which will be converted into kroner. The total payoff in kroner will be
paid out to you in a closed envelope at the end of the experiment. This will be done anonymously. We
now ask you to read the instructions. An experiment consisting of two parts will thereafter be conducted.
Page 2:
Norwegian: Du og en annen person kan sammen produsere røde enheter. Dere mottar 10 blå enheter
hver som kan brukes til å produsere røde enheter. Antall produserte røde enheter avhenger av antallet blå
enheter du og den andre personen bruker til produksjon.
1 blå enhet = 1 poeng = 30 øre
1 rød enhet = 1 poeng = 30 øre
English: You and another person can produce red units together. Both of you will receive 10 blue units
each which you can use in the production of red units. The number of produced red units depends on the
number of blue units you and the other person use in the production.
1 blue unit= 1 point= 30 øre
1 red unit= 1 point= 30 øre
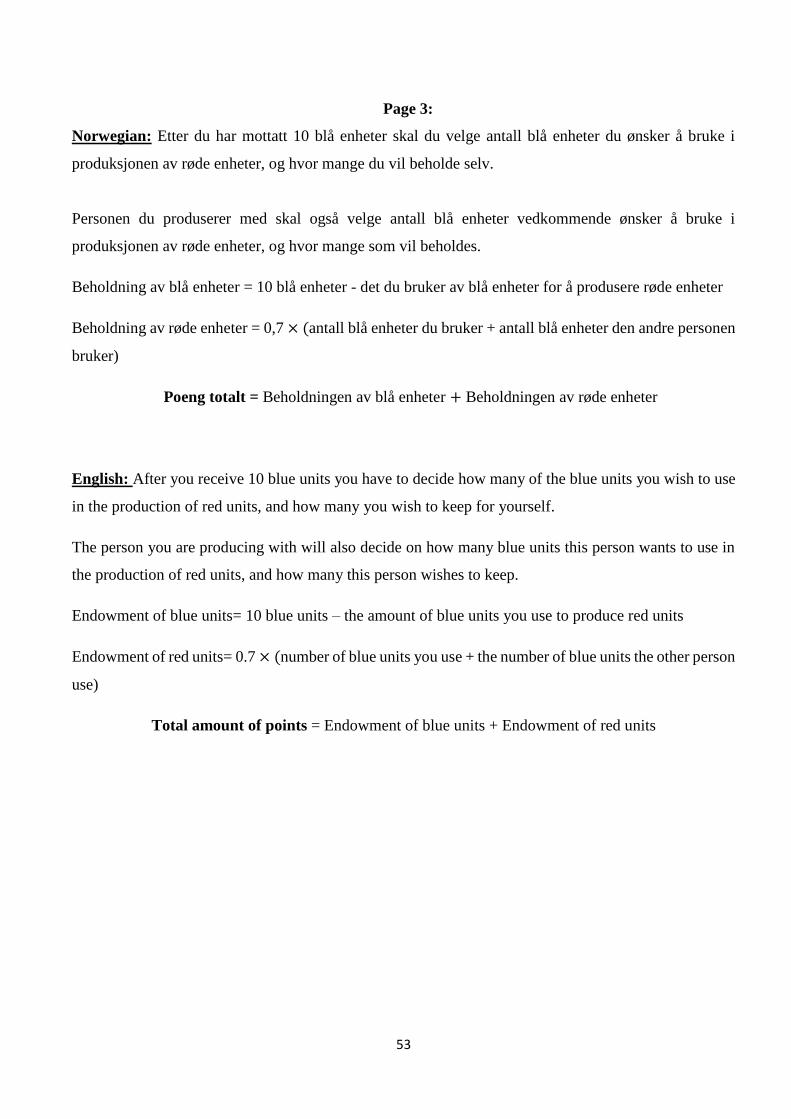
53
Page 3:
Norwegian: Etter du har mottatt 10 blå enheter skal du velge antall blå enheter du ønsker å bruke i
produksjonen av røde enheter, og hvor mange du vil beholde selv.
Personen du produserer med skal også velge antall blå enheter vedkommende ønsker å bruke i
produksjonen av røde enheter, og hvor mange som vil beholdes.
Beholdning av blå enheter = 10 blå enheter - det du bruker av blå enheter for å produsere røde enheter
Beholdning av røde enheter = 0,7 × (antall blå enheter du bruker + antall blå enheter den andre personen
bruker)
Poeng totalt = Beholdningen av blå enheter + Beholdningen av røde enheter
English: After you receive 10 blue units you have to decide how many of the blue units you wish to use
in the production of red units, and how many you wish to keep for yourself.
The person you are producing with will also decide on how many blue units this person wants to use in
the production of red units, and how many this person wishes to keep.
Endowment of blue units= 10 blue units – the amount of blue units you use to produce red units
Endowment of red units= 0.7 × (number of blue units you use + the number of blue units the other person
use)
Total amount of points = Endowment of blue units + Endowment of red units
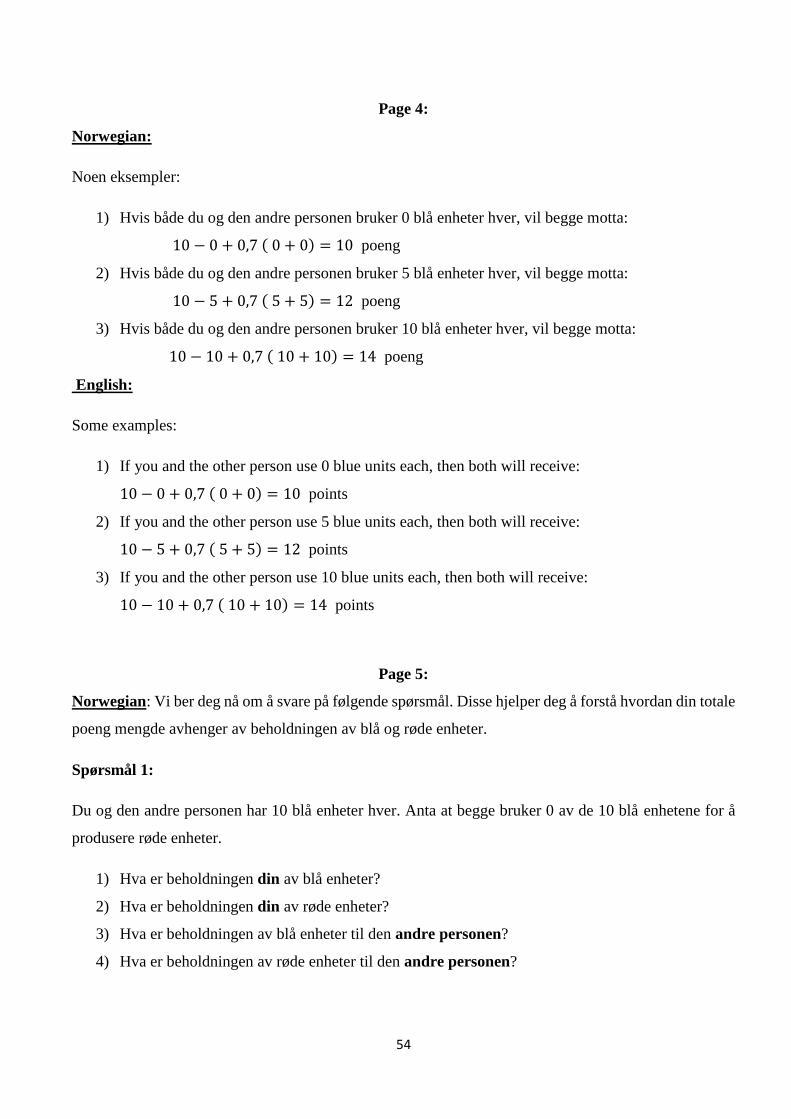
54
Page 4:
Norwegian:
Noen eksempler:
1) Hvis både du og den andre personen bruker 0 blå enheter hver, vil begge motta:
10 − 0 + 0,7 ( 0 + 0) = 10 poeng
2) Hvis både du og den andre personen bruker 5 blå enheter hver, vil begge motta:
10 − 5 + 0,7 ( 5 + 5) = 12 poeng
3) Hvis både du og den andre personen bruker 10 blå enheter hver, vil begge motta:
10 − 10 + 0,7 ( 10 + 10) = 14 poeng
English:
Some examples:
1) If you and the other person use 0 blue units each, then both will receive:
10 − 0 + 0,7 ( 0 + 0) = 10 points
2) If you and the other person use 5 blue units each, then both will receive:
10 − 5 + 0,7 ( 5 + 5) = 12 points
3) If you and the other person use 10 blue units each, then both will receive:
10 − 10 + 0,7 ( 10 + 10) = 14 points
Page 5:
Norwegian: Vi ber deg nå om å svare på følgende spørsmål. Disse hjelper deg å forstå hvordan din totale
poeng mengde avhenger av beholdningen av blå og røde enheter.
Spørsmål 1:
Du og den andre personen har 10 blå enheter hver. Anta at begge bruker 0 av de 10 blå enhetene for å
produsere røde enheter.
1) Hva er beholdningen din av blå enheter?
2) Hva er beholdningen din av røde enheter?
3) Hva er beholdningen av blå enheter til den andre personen?
4) Hva er beholdningen av røde enheter til den andre personen?

55
English: We now ask you to answer the following questions. These questions will help you understand
how the amount of total points is linked to the endowment of blue and red units.
Question 1:
You and the other person have 10 blue units each. Assume that both of you use 0 of the 10 blue units to
produce red units.
1) What is your total endowment of blue units?
2) What is your total endowment of red units?
3) What is the total endowment of blue units of the other person?
4) What is the total endowment of red units of the other person?
Page 6:
Norwegian:
Spørsmål 2: Du og den andre personen har 10 blå enheter hver. Anta at begge bruker 10 av de 10 blå
enhetene for å produsere røde enheter.
1) Hva er beholdningen din av blå enheter?
2) Hva er beholdningen din av røde enheter?
3) Hva er beholdningen av blå enheter til den andre personen?
4) Hva er beholdningen av røde enheter til den andre personen?
English:
Question 2: You and the other person have 10 blue units each. Assume that both of you use 10 of the 10
blue units to produce red units.
1) What is your total endowment of blue units?
2) What is your total endowment of red units?
3) What is the total endowment of blue units of the other person?
4) What is the total endowment of red units of the other person?

56
Page 7:
Norwegian:
Spørsmål 3:
Du og den andre personen har 10 blå enheter hver. Hvor mange røde enheter har du hvis du bruker:
1) 0 av blå enheter for å produsere røde, mens den andre personen bruker 10 blå enheter?
2) 10 av blå enheter for å produsere røde, mens den andre personen bruker 10 blå enheter?
English
Question 3:
You and the other person have 10 blue units each. How many red units do you have if you use:
1) 0 of the blue units to produce red units, while the other person uses 10 blue units?
2) 10 of the blue units to produce red units, while the other person uses 10 blue units?
Page 8:
Norwegian: Del 1
Dette er første del av eksperimentet, og består av kun én periode. Du er tilfeldig satt sammen med en
annen person som du kan produsere med. Du skal ta følgende beslutninger:
1) Du skal velge hvor mange av dine 10 blå enheter du ønsker å bruke for å produsere røde enheter.
2) Du skal velge hvor mange av dine 10 blå enheter du ønsker å bruke, gitt antall blå enheter
personen du produserer med velger å bruke.
Hvilken av beslutningene som gjelder for din totale poengsum, trekkes tilfeldig ut. Poeng fra denne delen
av eksperimentet legges til dine poeng i andre del av eksperimentet.
57
English: Part 1
This is the first part of the experiment. This part consists of only one period. You are randomly paired
with another person who you can produce with. We ask you to make the following decisions:
1) You have to choose how many of your 10 blue units you wish to use to produce red units.
2) You have to choose how many of your 10 blue units you wish to use conditional on the
contribution choices of the other person.
A random draw will decide which of the two decision will be relevant for your final payoff. The points
from this part of the experiment will be added to your points from the second part of the experiment.
Page 9:
Norwegian: Del 2
Dette er andre del av eksperimentet. Denne delen består av 20 perioder. Produksjonen i hver periode er
lik. I dette eksperimentet er du person i. Du beholder dette tallet hele eksperimentet. Du er tilfeldig
plassert i en gruppe bestående av deg og fire andre personer. Dere fem er i samme gruppe hele
eksperimentet. De andre gruppemedlemmene har også fått et tall mellom 1 og 5, og dette tallet tilhører
dem hele eksperimentet.
English: Part 2
This is the second part of the experiment. This part consists of 20 periods. The production is identical
in each period. You are person i. This number belongs to you throughout the entire experiment. You are
randomly assigned to a group which consists of you and four other people. The five of you will be in the
same group the entire experiment. The other group members have also been given a number ranging
from 1 to 5, and this number belongs to them throughout the entire experiment.
58
Page 10:
Norwegian: Produksjonen varer i 10 sekunder. På denne tiden må du velge hvor mange av dine 10 blå
enheter du ønsker å bruke for å produsere røde enheter.
Dette gjør du ved å skrive inn valget ditt i det blå området på skjermen. Du må trykke på Oppdater når
du har valgt hvor mange blå enheter du ønsker å bruke i produksjonen av røde enheter.
Produksjonen avsluttes automatisk etter 10 sekunder, og antallet blå enheter du har skrevet inn i feltet
regnes som din endelige avgjørelse.
I slutten av hver periode får du informasjon om din beholdning av blå og røde enheter, og hvem du har
produsert med. Andre deltakere på din gruppe får også tilsvarende informasjon om sine respektive
beholdninger, og hvem de har produsert med.
English: The production stage lasts 10 seconds. By this time you have to choose how many of your 10
blue units you wish to use to produce red units.
This is done by entering your contribution choice in the blue area on the screen. You have to click the
Update button when you have chosen how many blue units you wish to use to produce red units.
The production stage is automatically closed after 10 seconds, and the number of blue units you have
entered is registered as your final decision.
In the end of each period you will receive information about your total endowment of blue and red units,
and also who you have produced with. The other participants in your group will also receive this private
information about their endowments and production partner.
Page 11: Random condition
Norwegian: I hver periode tildeles du en tilfeldig person fra gruppen som du kan produsere med. Én
person trekkes tilfeldig ut til å stå over produksjonen. Den personen som må stå over produksjonen, får
poengsummen 0 denne perioden.
English: In each period you will be assigned to a random individual from your group that you can
produce with. One person will be randomly drawn and this individual has to pass on the production stage.
The person that has to pass on the production earns zero points in this period.
59
Page 11: Choice condition
Norwegian: I hver periode skal du velge hvem av de fire personene i gruppen du vil produsere med. Du
kan kun velge én person. Personen du velger må også velge deg for at dere skal produsere sammen.
Dersom alle bortsett fra én person har funnet noen å produsere med, vil denne personen stå over
produksjonen denne perioden. Dersom flere ikke finner en annen å produsere med, trekkes én person
tilfeldig ut til å stå over produksjonen. Den personen som må stå over produksjonen, får poengsummen
0 denne perioden. Resten tildeles en tilgjengelig person i gruppen. Dette gjelder også hvis du velger deg
selv.
English: In each period you have to choose which of the four people in the group you wish to produce
with. You can only choose one person. The person you choose must also choose you for you to produce
together.
If all but one person find another subject to produce with, then this person has to pass the production
stage in this period. However, if more than one person fails to find another person to produce with, then
one person will be randomly drawn and this person has to pass the production stage in this period. The
person that has to pass the production stage earns zero pints in this period. This also applies if you choose
yourself.
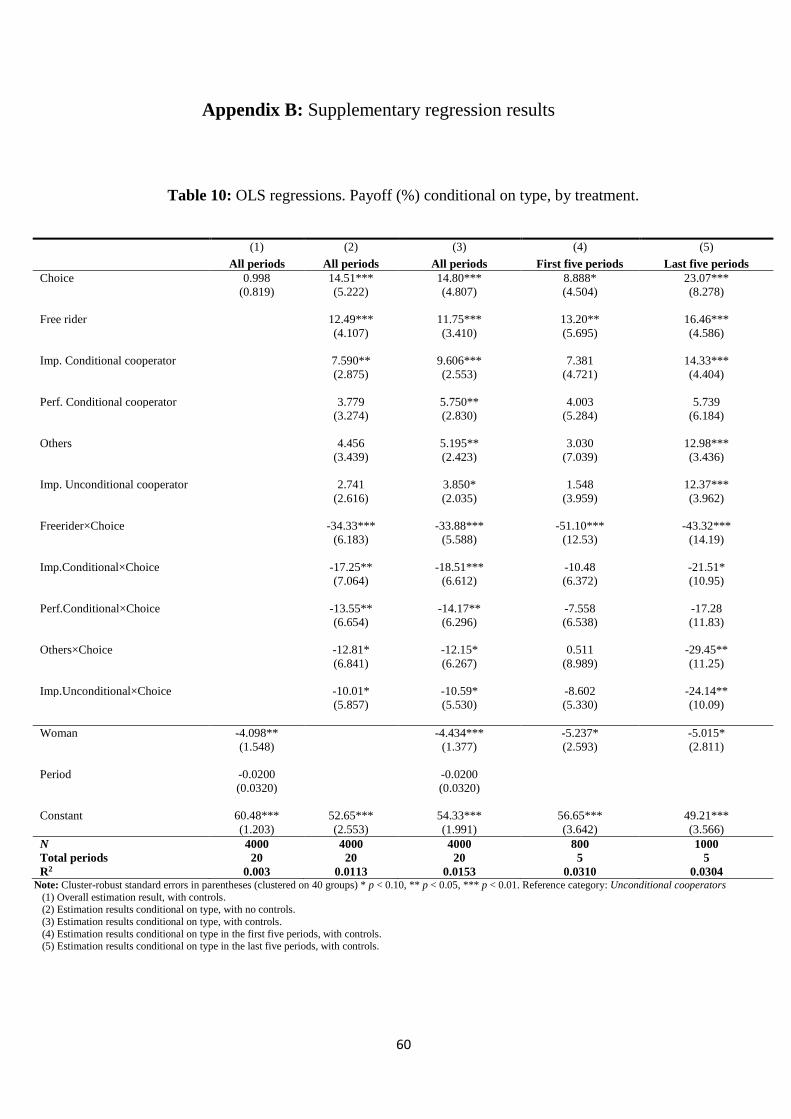
60
Appendix B: Supplementary regression results
Table 10: OLS regressions. Payoff (%) conditional on type, by treatment.
Note: Cluster-robust standard errors in parentheses (clustered on 40 groups) * p < 0.10, ** p < 0.05, *** p < 0.01. Reference category: Unconditional cooperators
(1) Overall estimation result, with controls. (2) Estimation results conditional on type, with no controls.
(3) Estimation results conditional on type, with controls.
(4) Estimation results conditional on type in the first five periods, with controls. (5) Estimation results conditional on type in the last five periods, with controls.
(1) (2) (3) (4) (5)
All periods All periods All periods First five periods Last five periods
Choice 0.998 14.51*** 14.80*** 8.888* 23.07***
(0.819) (5.222) (4.807) (4.504) (8.278)
Free rider 12.49*** 11.75*** 13.20** 16.46***
(4.107) (3.410) (5.695) (4.586)
Imp. Conditional cooperator 7.590** 9.606*** 7.381 14.33***
(2.875) (2.553) (4.721) (4.404)
Perf. Conditional cooperator 3.779 5.750** 4.003 5.739
(3.274) (2.830) (5.284) (6.184)
Others 4.456 5.195** 3.030 12.98***
(3.439) (2.423) (7.039) (3.436)
Imp. Unconditional cooperator 2.741 3.850* 1.548 12.37***
(2.616) (2.035) (3.959) (3.962)
Freerider×Choice -34.33*** -33.88*** -51.10*** -43.32***
(6.183) (5.588) (12.53) (14.19)
Imp.Conditional×Choice -17.25** -18.51*** -10.48 -21.51*
(7.064) (6.612) (6.372) (10.95)
Perf.Conditional×Choice -13.55** -14.17** -7.558 -17.28
(6.654) (6.296) (6.538) (11.83)
Others×Choice -12.81* -12.15* 0.511 -29.45**
(6.841) (6.267) (8.989) (11.25)
Imp.Unconditional×Choice -10.01* -10.59* -8.602 -24.14**
(5.857) (5.530) (5.330) (10.09)
Woman -4.098** -4.434*** -5.237* -5.015*
(1.548) (1.377) (2.593) (2.811)
Period -0.0200 -0.0200
(0.0320) (0.0320)
Constant 60.48*** 52.65*** 54.33*** 56.65*** 49.21***
(1.203) (2.553) (1.991) (3.642) (3.566)
N
Total periods
R2
4000
20
0.003
4000
20
0.0113
4000
20
0.0153
800
5
0.0310
1000
5
0.0304
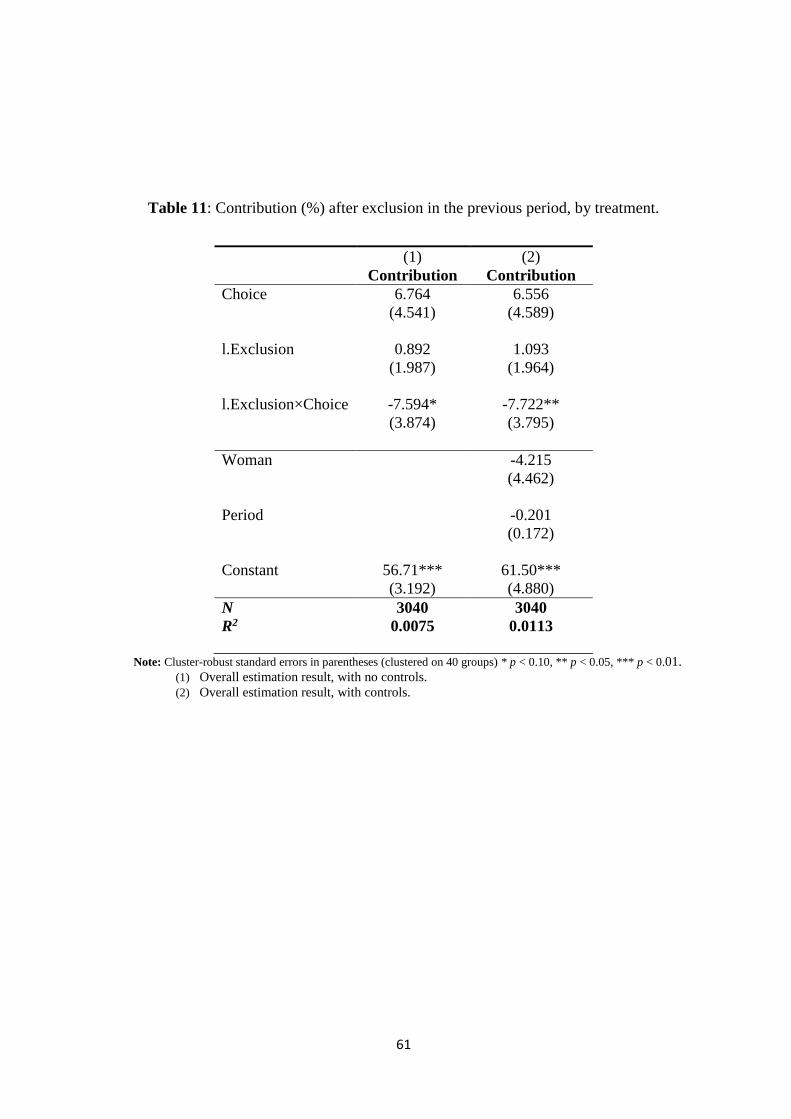
61
Table 11: Contribution (%) after exclusion in the previous period, by treatment.
(1) (2)
Contribution Contribution
Choice 6.764 6.556
(4.541) (4.589)
l.Exclusion 0.892 1.093
(1.987) (1.964)
l.Exclusion×Choice -7.594* -7.722**
(3.874) (3.795)
Woman -4.215
(4.462)
Period -0.201
(0.172)
Constant 56.71*** 61.50***
(3.192) (4.880)
N
R2
3040
0.0075
3040
0.0113
Note: Cluster-robust standard errors in parentheses (clustered on 40 groups) * p < 0.10, ** p < 0.05, *** p < 0.01.
(1) Overall estimation result, with no controls.
(2) Overall estimation result, with controls.
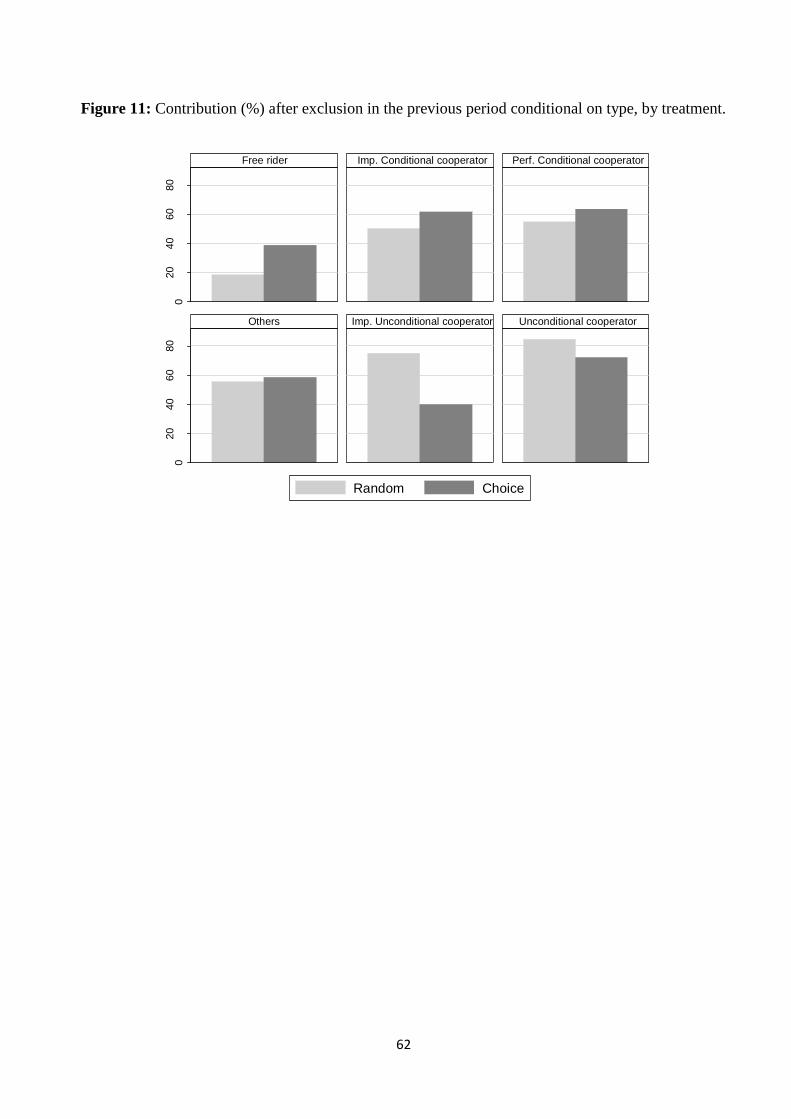
62
Figure 11: Contribution (%) after exclusion in the previous period conditional on type, by treatment.
020
40
60
80
020
40
60
80
Free rider Imp. Conditional cooperator Perf. Conditional cooperator
Others Imp. Unconditional cooperator Unconditional cooperator
Random Choice
Mea
n o
f co
ntr
ibutio
n

63
Appendix C: Invitation mail
Hei,
Du er invitert til å delta i et eksperiment. Du vil motta 100 kroner
for oppmøtet.
I tillegg til dette kan du tjene ytterliggere penger. Disse pengene
utbetales til deg når eksperimentet er over. Eksperimentet utføres
anonymt.
Eksperimentet går ut på å ta valg på en PC. Det kreves ingen
forkunnskaper for å kunne delta.
Hele eksperimentet tar omtrent 35 minutter, og vil holdes på rom 305
på Ulrikke Pihls Hus (Professor Keyers gate 1) i tredje etasje.
Ved å klikke på linken under kan du velge dag og tidspunkt som passer for deg:
http://thomas.nhh.no/dj/expmotor/new_participant/84/
Vel møtt!
Hilsen Nina Serdarevic

64
Appendix D: Instruction for the Norwegian Citizen panel experiment
Norwegian: Random Lose (Keep)
Tre deltakere i Medborgerpanelet trekkes ut til å vinne en ekstra pengepremie. Disse tre blir satt sammen
i en gruppe. Hver person i gruppen får i utgangspunktet 1000 kroner. Pengepremiens endelige størrelse
avhenger av valget personene i gruppen tar i beslutningen under.
Hver deltaker skal velge hvor mye av sine 1000 kroner de vil bidra med til en felleskasse for gruppen.
En tilfeldig person trekkes ut til å ekskluderes fra gruppen, og taper (beholder) sine 1000 kroner.
De to gjenværende personenes bidrag til felleskassen økes med 50 prosent, og deles deretter likt på de
to. Den endelige pengepremien er den enkeltes andel av felleskassen og pengene som ble beholdt.
Spørsmål: Dersom du trekkes ut til å vinne 1000 kr, hvor mye vil du bidra med til felleskassen?
English: Random Lose (Keep)
Three participants of the Norwegian Citizen Panel are chosen to receive an additional money prize of
1000 NOK. These three participants are placed together in a group. Each person is initially endowed with
1000 NOK. The final size of the money prize depends on the group members` decisions in the task below.
Each group member has to choose how much of the 1000 NOK they want to contribute to the group
common pool. One random person will be excluded from the group and lose (keep) their initial
endowment of 1000 NOK.
The two remaining group members` contributions to the common pool will increase by 50 percent, and
then be split equally between the two. The final cash prize is each subjects share from the common pool,
and the money that was kept in the decision stage.
Question: If you are one of the three participants that receive the 1000 NOK, how much do you want to
contribute to the common pool?

65
Norwegian: Exclusion Lose (Keep)
Tre deltakere i Medborgerpanelet trekkes ut til å vinne en ekstra pengepremie. Disse tre blir satt sammen
i en gruppe. Hver person i gruppen får i utgangspunktet 1000 kroner. Pengepremiens endelige størrelse
avhenger av valget personene i gruppen tar i beslutningen under.
Hver deltaker skal velge hvor mye av sine 1000 kroner de vil bidra med til en felleskasse for gruppen.
Personen i gruppen som bidrar med minst ekskluderes fra gruppen, og taper (beholder) sine 1000 kroner.
De to gjenværende personenes bidrag til felleskassen økes med 50 prosent, og deles deretter likt på de
to. Den endelige pengepremien er den enkeltes andel av felleskassen og pengene som ble beholdt.
Spørsmål: Dersom du trekkes ut til å vinne 1000 kr, hvor mye vil du bidra med til felleskassen?
English: Exclusion Lose (Keep)
Three participants of the Norwegian Citizen Panel are chosen to receive an additional money prize of
1000 NOK. These three participants are placed together in a group. Each person is initially endowed with
1000 NOK. The final size of the money prize depends on the group members` decisions in the task below.
Each group member has to choose how much of the 1000 NOK they want to contribute to the group
common pool. The person in the group that contributes the least amount of money will be excluded from
the group, and lose (keep) their initial endowment of 1000 NOK.
The two remaining group members` contributions to the common pool will increase by 50 percent, and
then be split equally between the two. The final cash prize is each subjects share from the common pool,
and the money that was kept in the decision stage.
Question: If you are one of the three participants that receive the 1000 NOK, how much do you want to
contribute to the common pool?


