
IVM Institute for Environmental Studies
Accredited under No. L476 (RvA)
7
Microplastic survey of the Dutch environment
Novel data set of microplastics in North Sea sediments, treated wastewater
effluents and marine biota
H.A. Leslie
M.J.M. van Velzen
A.D. Vethaak
Final Report R-13/11
9 September 2013
IVM Institute for Environmental Studies
This report is released by: Prof. Dr. J. de Boer
This report was commissioned by: Mr. A. (Lex) W.A. Oosterbaan, RWS Noordzee
It was internally reviewed by: Prof. Dr. Jacob de Boer
IVM
Institute for Environmental Studies
VU University Amsterdam
De Boelelaan 1087
1081 HV AMSTERDAM
The Netherlands
T +31-20-598 9555
F +31-20-598 9553
Mr. A.(Lex) W.A. Oosterbaan
Sr. Adviseur
Directie Water en Scheepvaart
RWS-Noordzee
Postbus 5807
2280 HV Rijswijk
The Netherlands
T 31 70 3366846
F 31 70 3194238
Copyright © 2013, Institute for Environmental Studies
All rights reserved. No part of this publication may be reproduced, stored in a retrieval system or
transmitted in any form or by any means, electronic, mechanical, photo-copying, recording or
otherwise without the prior written permission of the copyright holder
IVM Institute for Environmental Studies
Microplastic survey of the Dutch environment
Acknowledgement
This project was sponsored by the Ministry of Infrastructure and Environment of the
Netherlands. Rijkswaterstaat is acknowledged for providing the sediment samples and metadata.


IVM Institute for Environmental Studies
Microplastic survey of the Dutch environment
Contents
Abbreviations 7
Summary 9
1 Introduction 11
2 Sampling 13
2.1 Overview 13 2.2 Marine sediments 13 2.3 Wastewater treatment plant effluents 13 2.4 Marine invertebrate biota 14
3 Analytical method 17
3.1 Sediments 17 3.2 Wastewater treatment plant effluents 17 3.3 Biota 17
4 Results and discussion 19
4.1 Microplastics in marine sediments 19 4.2 Microplastic in treated wastewater effluents 21 4.3 Microplastic in marine biota 22
5 Concluding remarks 25
References 29

IVM Institute for Environmental Studies
Microplastic survey of the Dutch environment
Abbreviations
dw Dry weight
GES Good Environmental Status
IR Infrared (as in infrared techniques Fourier Transform IR and Raman)
LIMS Laboratory Information Management System
MBR Membrane reactor
MSFD European Marine Strategy Framework Directive
MWTL Dutch National Monitoring Program (Monitoring Waterstaatkundige Toestand des
Lands)
NaCl Sodium chloride
NaOH Sodium hydroxide
OS Oosterschelde Neeltje Jan outside
RE Rhine Estuary
RWS Rijkswaterstaat
SVHC Substances of very high concern
TNS Ter Heide North Sea coast
UNEP United Nations Environment Programme
WWTP Wastewater treatment plant


IVM Institute for Environmental Studies
Microplastic survey of the Dutch environment 9
Summary
Environmental contamination with microsized synthetic plastic particles, known as
‘microplastics’, is widely recognised as a threat to the marine ecosystems and the economies and
societal wellbeing that depend on these ecosystems. Microplastics are addressed under descriptor
10 of Good Environmental Status in the Marine Strategy Framework Directive (MSFD).
The Ministry of Infrastructure and the Environment commissioned an exploratory survey of
microplastics in the Dutch environment. The matrices selected for analysis included marine
sediments (coastal, offshore and estuaries), wastewater treatment plant effluents and marine
biota.
We report microplastic concentrations from 100 (min.) up to 3600 (max.) particles per kg dry
sediment, median 500 particles/kg dw, mean 840 particles/kg dry weight (dw) sediment,
collected at 15 Dutch National Monitoring Program (MWTL) and estuary locations representing
a range of coastal and offshore North Sea waters. The average number of microplastics in
sediment from the 12 sampling sites in the North Sea was 440 particles/kg dw sediment; in a
Wadden Sea sediment 770 particles/kg dw sediment were found, and the average for the Rhine
estuary locations was 3300 particles/kg dw sediment. These areas were identified as relative
‘hotspots’. In a Belgian study that examined a more limited size fraction (38 -1000 µm) of
microplastics in sediment than the present study, fewer microplastics were counted in Belgian
harbours (by about an order of magnitude).
In individual wastewater treatment plant effluents from sites that discharge effluents to the North
Sea, the Oude Maas River or the North Sea Canal, we found between 9 and 91 particles/L treated
effluent with mean concentrations across three different plants at about 52 particles/L treated
effluent. This provides further evidence that not all microplastics are captured in sewage sludge
of wastewater treatment plants (WWTPs).
In field collected biota from three locations along the Dutch coast, microplastics were also
detected in four of the five species investigated (analysis of pooled samples). Filter feeders such
as oysters and mussels had higher concentrations than common periwinkles and amphipods. In
pooled crab samples, no microplastics were detected in this survey. With the exception of the
crabs samples, the number of particles ranged from 11 particles per g dw (amphipods) to 105
particles per g dw (blue mussels). Both of these pooled samples were collected from the same
area, the Oosterschelde. The filter feeders with microplastic body residues in this study (oysters,
mussels) are common species for human consumption.
At present, there is no known way to accurately trace the origins of the tiny microplastic particles
detected in environmental samples from the field. In contrast, when plastic fragments are large,
they sometimes identifiable as the original object, in which case more information can be
collected regarding the origin of the material. The polymer type of plastics gathered in the field
can be identified in some cases, but there are limits to the current techniques that need to be
addressed, particularly when the fragments are in the low mm range, as found in this study.
This exploratory survey of microplastics in different environmental matrices shows the ubiquity
of these contaminants and represents a unique data set for the Dutch (marine) environment,
which can be used to further prioritize research and support future monitoring program design.
This report briefly discusses the huge potential for analytical method development in the
emerging field of environmental microplastic research. Further improvements may still be made
in the extraction steps, but also in the analytical techniques to identify plastic polymers, which
currently work best for large microplastics made of the one of the most common polymers
(copolymer blends are more difficult due to the large number of reference materials needed).
IVM Institute for Environmental Studies
10 Summary
The current extraction and analysis of microplastics is quite labour intensive. There is room to
improve microplastics method selectivity, sensitivity as well as infrastructure for quality control
and quality assessment of environmental microplastics data (tools, training, interlaboratory
studies, reference materials, etc.). These improvements would not only help advance the
scientific knowledge of microplastics in the environment but they also have practical applications
in environmental monitoring. The European Technical Subgroup on Marine Litter is
disseminating guidance based on current state-of-the-art knowledge and monitoring methods
with the recent online publication of the draft document entitled ‘Monitoring Guidance for
Marine Litter in European Seas’, available to all Member States and other interested groups.
CleanSea1, the European research project on marine litter led by IVM that runs from 2013-2015,
is also contributing to method development for microplastics research, monitoring and impact
assessments as well as policy options.
Future developments are expected to lead to identification of appropriate indicators for marine
microplastics and a better understanding of the toxicological consequences of exposure to
microplastics for both marine organisms, but also for human health. Besides the potential impact
of particle toxicity from microplastics there is concern for the chemicals associated with plastics
(e.g. toxic additives, residual monomers and sorbed contaminants). The implementation of the
EU MSFD brings with it the incentive for researchers and Member States to work towards
developing indicators for (marine) microplastics, to evaluate the ecological, social and economic
harm of microplastics in the marine environment, and to devise programmes of measures to
mitigate emissions.
1 www.cleansea-project.eu

IVM Institute for Environmental Studies
Microplastic survey of the Dutch environment 11
1 Introduction
The EU Marine Strategy Framework Directive (MSFD) came into effect on 15 July 2008 and is
being implemented in the Netherlands by the Ministry of Infrastructure and the Environment.
The MSFD aims to achieve good environmental status (GES) by 2020 in European seas and
coastal waters. Under the MSFD there are eleven descriptors for GES, one of which being that
marine litter has no detrimental effects on the environment (Descriptor 10).
Marine litter consists of large pieces of plastic, rubber, wood and other materials, but also of
microsized particles, including “microplastics” (synthetic polymer particles <5 mm). The items
reach the environment due to deliberate discards or unintentional losses to the sea either directly
or via wind and river transport. Microplastics can be emitted to the environment from various
sources but may also arise from macroplastic that fragments into smaller pieces when the
polymeric material weakens from ultraviolet light exposure, mechanical stress and/or leaching of
additives.
Member States of the European Union will be measuring various indicators of Descriptor 10 as
part of the MSFD implementation. Programs of measures due in 2015 are being currently
prepared and represent one of the key aspects of MSFD implementation. In the Netherlands
preparations for selecting measures began in 2012. Monitoring programs are being prepared for
the MSFD by Member States and are due in 2014. Monitoring programs may be used to measure
spatial and temporal trends of marine litter concentrations in the environment and to evaluate if
certain measures taken are effective for reducing marine litter during a given time frame. The
European Technical Subgroup on Marine Litter has just published an online draft of their
Monitoring Guidance for Marine Litter in European Seas (2013), to be finalized later in 2013.
The Ministry of Infrastructure and Environment has an interest in generating knowledge about
the presence and distribution of microplastics in the Dutch part of the North Sea. In cooperation
with Deltares, IVM has worked on these issues, producing a report on the state of knowledge on
microplastics in the North Sea (Leslie et al. 2011). To gain empirical evidence of microplastics in
the Dutch marine environment, this exploratory study examines levels of microplastic marine
litter in coastal, offshore and estuarine sediments, effluents from wastewater treatment plants, and
from marine biota species collected along the Dutch coast.

IVM Institute for Environmental Studies
Microplastic survey of the Dutch environment 13
2 Sampling
2.1 Overview
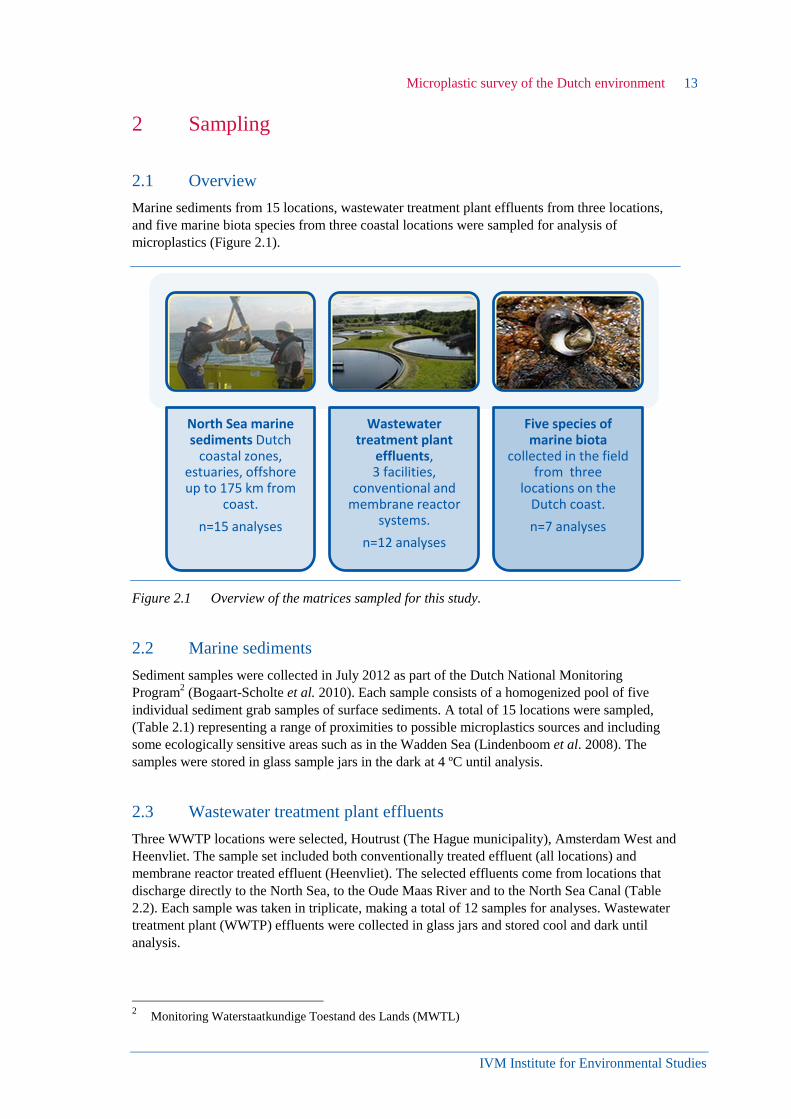
Marine sediments from 15 locations, wastewater treatment plant effluents from three locations,
and five marine biota species from three coastal locations were sampled for analysis of
microplastics (Figure 2.1).
Figure 2.1 Overview of the matrices sampled for this study.
2.2 Marine sediments
Sediment samples were collected in July 2012 as part of the Dutch National Monitoring
Program2 (Bogaart-Scholte et al. 2010). Each sample consists of a homogenized pool of five
individual sediment grab samples of surface sediments. A total of 15 locations were sampled,
(Table 2.1) representing a range of proximities to possible microplastics sources and including
some ecologically sensitive areas such as in the Wadden Sea (Lindenboom et al. 2008). The
samples were stored in glass sample jars in the dark at 4 ºC until analysis.
2.3 Wastewater treatment plant effluents
Three WWTP locations were selected, Houtrust (The Hague municipality), Amsterdam West and
Heenvliet. The sample set included both conventionally treated effluent (all locations) and
membrane reactor treated effluent (Heenvliet). The selected effluents come from locations that
discharge directly to the North Sea, to the Oude Maas River and to the North Sea Canal (Table
2.2). Each sample was taken in triplicate, making a total of 12 samples for analyses. Wastewater
treatment plant (WWTP) effluents were collected in glass jars and stored cool and dark until
analysis.
2 Monitoring Waterstaatkundige Toestand des Lands (MWTL)
North Sea marine sediments Dutch
coastal zones, estuaries, offshore up to 175 km from
coast.
n=15 analyses
Wastewater treatment plant
effluents, 3 facilities,
conventional and membrane reactor
systems.
n=12 analyses
Five species of marine biota
collected in the field from three
locations on the Dutch coast.
n=7 analyses
IVM Institute for Environmental Studies
14 Sampling
2.4 Marine invertebrate biota
Biota were collected from three littoral zone locations along the Dutch coast in March 2013 and
were preserved either frozen or in 70% isopropanol and (stored cool and dark) until analysis.
Five species were selected for this first screening of microplastics in field collected invertebrates
from the Dutch marine environment (Table 2.3). Samples were pooled for analysis.
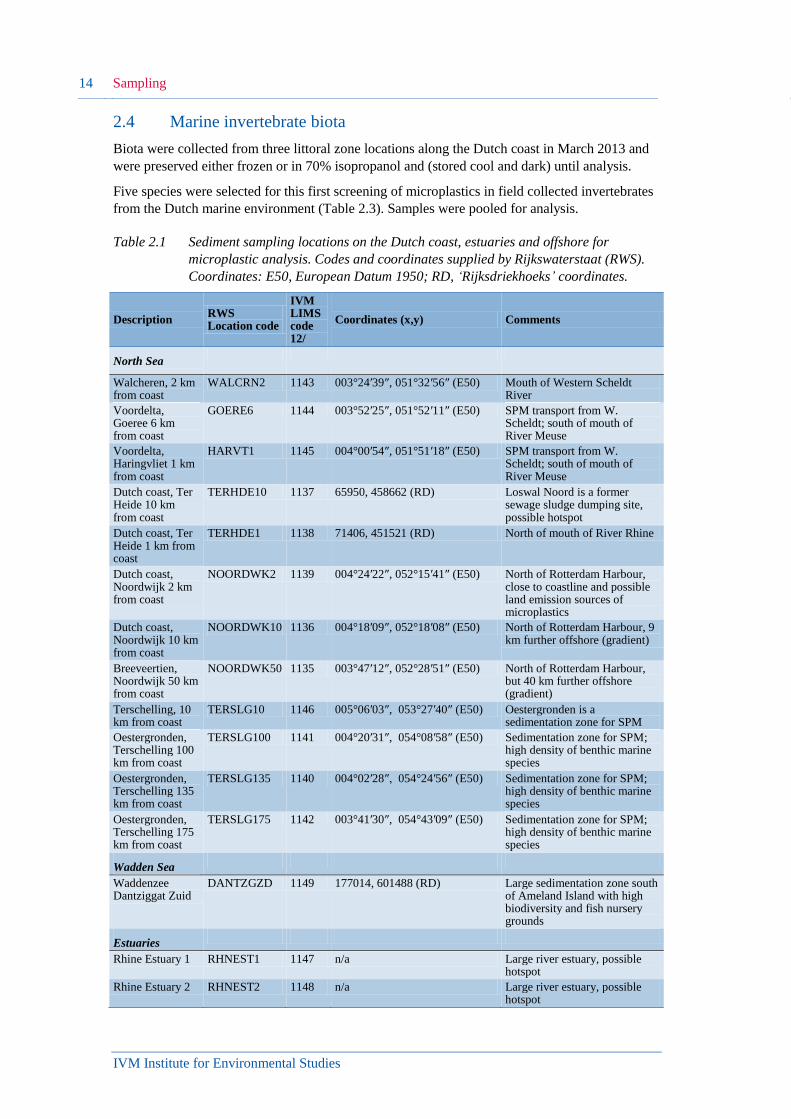
Table 2.1 Sediment sampling locations on the Dutch coast, estuaries and offshore for
microplastic analysis. Codes and coordinates supplied by Rijkswaterstaat (RWS).
Coordinates: E50, European Datum 1950; RD, ‘Rijksdriekhoeks’ coordinates.
Description RWS Location code
IVM LIMS code 12/
Coordinates (x,y) Comments
North Sea
Walcheren, 2 km from coast
WALCRN2 1143 003°24′39″, 051°32′56″ (E50) Mouth of Western Scheldt River
Voordelta, Goeree 6 km from coast
GOERE6 1144 003°52′25″, 051°52′11″ (E50) SPM transport from W. Scheldt; south of mouth of River Meuse
Voordelta, Haringvliet 1 km from coast
HARVT1 1145 004°00′54″, 051°51′18″ (E50) SPM transport from W. Scheldt; south of mouth of River Meuse
Dutch coast, Ter Heide 10 km from coast
TERHDE10 1137 65950, 458662 (RD) Loswal Noord is a former sewage sludge dumping site, possible hotspot
Dutch coast, Ter Heide 1 km from coast
TERHDE1 1138 71406, 451521 (RD) North of mouth of River Rhine
Dutch coast, Noordwijk 2 km from coast
NOORDWK2 1139 004°24′22″, 052°15′41″ (E50) North of Rotterdam Harbour, close to coastline and possible land emission sources of microplastics
Dutch coast, Noordwijk 10 km from coast
NOORDWK10 1136 004°18′09″, 052°18′08″ (E50) North of Rotterdam Harbour, 9 km further offshore (gradient)
Breeveertien, Noordwijk 50 km from coast
NOORDWK50 1135 003°47′12″, 052°28′51″ (E50) North of Rotterdam Harbour, but 40 km further offshore (gradient)
Terschelling, 10 km from coast
TERSLG10 1146 005°06′03″, 053°27′40″ (E50) Oestergronden is a sedimentation zone for SPM
Oestergronden, Terschelling 100 km from coast
TERSLG100 1141 004°20′31″, 054°08′58″ (E50) Sedimentation zone for SPM; high density of benthic marine species
Oestergronden, Terschelling 135 km from coast
TERSLG135 1140 004°02′28″, 054°24′56″ (E50) Sedimentation zone for SPM; high density of benthic marine species
Oestergronden, Terschelling 175 km from coast
TERSLG175 1142 003°41′30″, 054°43′09″ (E50) Sedimentation zone for SPM; high density of benthic marine species
Wadden Sea
Waddenzee Dantziggat Zuid
DANTZGZD 1149 177014, 601488 (RD) Large sedimentation zone south of Ameland Island with high biodiversity and fish nursery grounds
Estuaries
Rhine Estuary 1 RHNEST1 1147 n/a Large river estuary, possible hotspot
Rhine Estuary 2 RHNEST2 1148 n/a Large river estuary, possible hotspot
IVM Institute for Environmental Studies
Microplastic survey of the Dutch environment 15
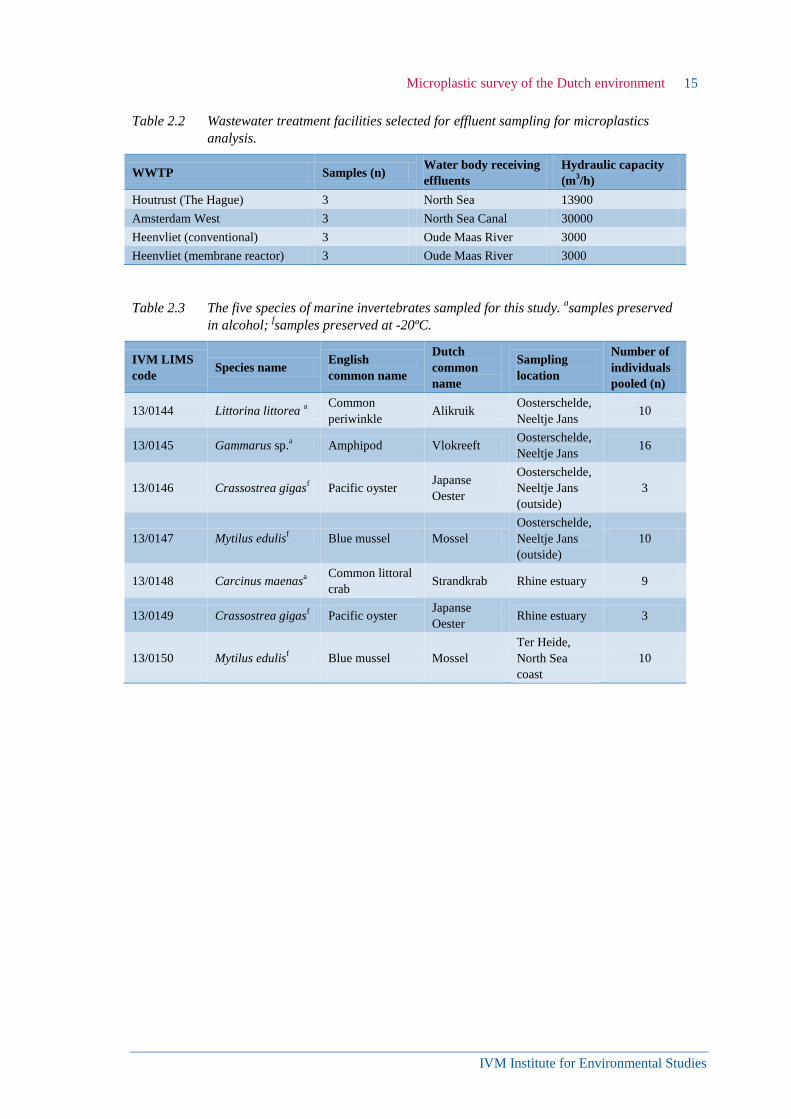
Table 2.2 Wastewater treatment facilities selected for effluent sampling for microplastics
analysis.
WWTP Samples (n) Water body receiving
effluents
Hydraulic capacity
(m3/h)
Houtrust (The Hague) 3 North Sea 13900
Amsterdam West 3 North Sea Canal 30000
Heenvliet (conventional) 3 Oude Maas River 3000
Heenvliet (membrane reactor) 3 Oude Maas River 3000
Table 2.3 The five species of marine invertebrates sampled for this study. asamples preserved
in alcohol; fsamples preserved at -20ºC.
IVM LIMS
code Species name
English
common name
Dutch
common
name
Sampling
location
Number of
individuals
pooled (n)
13/0144 Littorina littorea a
Common
periwinkle Alikruik
Oosterschelde,
Neeltje Jans 10
13/0145 Gammarus sp.a Amphipod Vlokreeft
Oosterschelde,
Neeltje Jans 16
13/0146 Crassostrea gigasf Pacific oyster
Japanse
Oester
Oosterschelde,
Neeltje Jans
(outside)
3
13/0147 Mytilus edulisf Blue mussel Mossel
Oosterschelde,
Neeltje Jans
(outside)
10
13/0148 Carcinus maenasa
Common littoral
crab Strandkrab Rhine estuary 9
13/0149 Crassostrea gigasf Pacific oyster
Japanse
Oester Rhine estuary 3
13/0150 Mytilus edulisf Blue mussel Mossel
Ter Heide,
North Sea
coast
10


IVM Institute for Environmental Studies
Microplastic survey of the Dutch environment 17
3 Analytical method
3.1 Sediments
Sediment samples were homogenized at the laboratory before taking subsamples for extraction
and analysis and for dry weight determination so that concentrations could be expressed as
number of particles per kg dry sediment.
For the extraction of microplastics the method of Thompson et al. (2004) was followed, in a
slightly adapted, miniaturized form. Briefly, 25 g sediment was added to an Erlenmeyer with
pure analytical grade water (milliQ) to which NaCl had been added (saturated solution, 1.2 kg
NaCl/L). The sediment was allowed to settle to the bottom of the Erlenmeyer flask while the
particles which were less dense than saturated salt solution were allowed to float at the top of the
water layer. The top water layer was filtered over a 0.7µm Whatman glass filter and observed by
light microscopy. The number of microplastic particles was counted and corrected for the low
and stable blank (control chart mean 2 microplastic particles per analysis). The concentrations
were expressed as number of particles per kg dry sediment. Particles were classified into two
broad size categories: particles between 1 and 300 µm and those between 300 and 5000 µm. (The
latter corresponds to particle sizes commonly targeted in seawater surface microplastic
sampling).
3.2 Wastewater treatment plant effluents
The wastewater treatment plant effluents were analysed in triplicate, and four different types of
samples were measured. The effluents were filtered similarly to the sediment samples. The
samples were well mixed immediately prior to taking aliquots from each effluent sample for
extraction, since microplastics are not in solution and most can be assumed not to be neutrally
buoyant.
3.3 Biota
The soft tissues of invertebrate biota species were dissected out of the shell or exoskeleton (with
the exception of the very small amphipods). The material was freeze dried and then homogenized
to a powder form. Between 3 and 16 individuals were pooled for the analysis (Table 2.3). An
aliquot (100 mg) of the pooled freeze-dried sample then underwent a nitric acid and microwave
destruction under conditions of high temperature and pressure in closed Teflon vessels, according
to a standard operating procedure at IVM (Van der Horst, 2013). Analytical grade water (milliQ)
was used for making solutions or for rinsing the filter. The extract was then neutralized with
NaOH solution, treated with hydrogen peroxide (30%), rinsed with MilliQ, and then examined by
light microscopy on the same 0.7 µm glass filters as for sediments.

IVM Institute for Environmental Studies
Microplastic survey of the Dutch environment 19
4 Results and discussion
4.1 Microplastics in marine sediments
Microplastics were detected in sediment samples from all 15 sediment sampling locations (Table
4.1). Procedural blanks, which are part of the quality control for background contamination
during sample preparation, extraction and analysis, were low and stable; when calculating the
total number of microplastics in a sample the background level was corrected for. The duplicate
sample gave identical results.
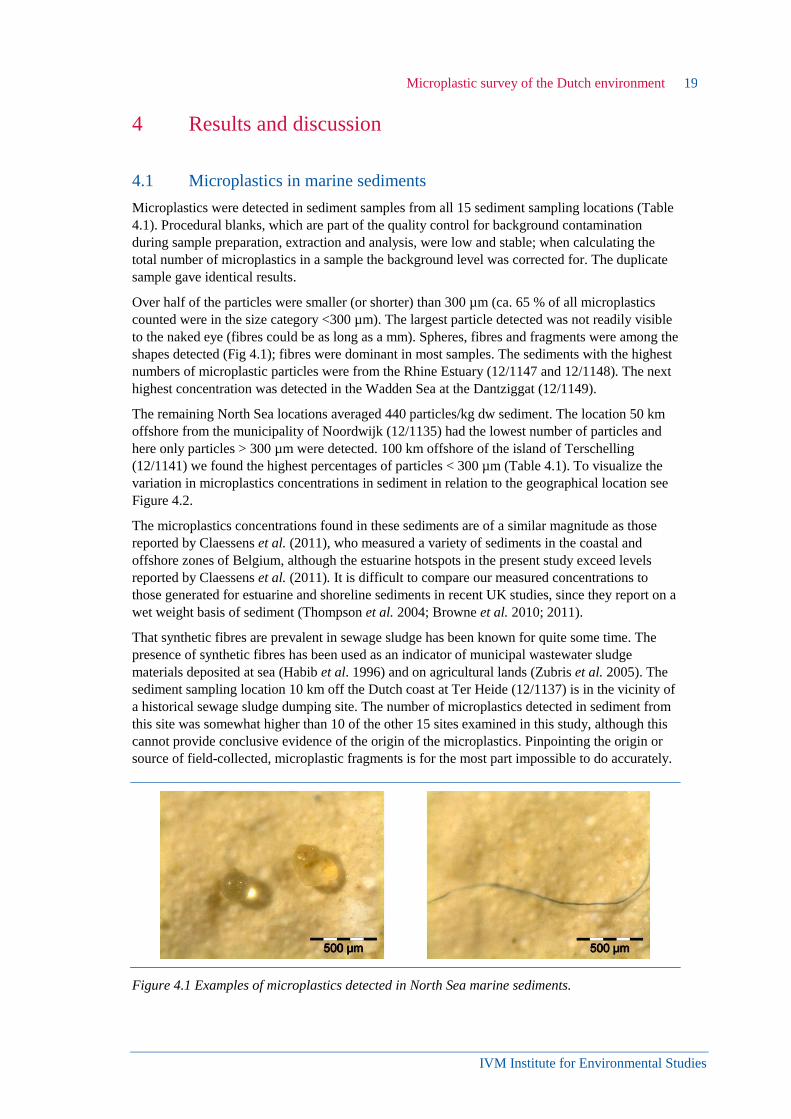
Over half of the particles were smaller (or shorter) than 300 µm (ca. 65 % of all microplastics
counted were in the size category <300 µm). The largest particle detected was not readily visible
to the naked eye (fibres could be as long as a mm). Spheres, fibres and fragments were among the
shapes detected (Fig 4.1); fibres were dominant in most samples. The sediments with the highest
numbers of microplastic particles were from the Rhine Estuary (12/1147 and 12/1148). The next
highest concentration was detected in the Wadden Sea at the Dantziggat (12/1149).
The remaining North Sea locations averaged 440 particles/kg dw sediment. The location 50 km
offshore from the municipality of Noordwijk (12/1135) had the lowest number of particles and
here only particles > 300 µm were detected. 100 km offshore of the island of Terschelling
(12/1141) we found the highest percentages of particles < 300 µm (Table 4.1). To visualize the
variation in microplastics concentrations in sediment in relation to the geographical location see
Figure 4.2.
The microplastics concentrations found in these sediments are of a similar magnitude as those
reported by Claessens et al. (2011), who measured a variety of sediments in the coastal and
offshore zones of Belgium, although the estuarine hotspots in the present study exceed levels
reported by Claessens et al. (2011). It is difficult to compare our measured concentrations to
those generated for estuarine and shoreline sediments in recent UK studies, since they report on a
wet weight basis of sediment (Thompson et al. 2004; Browne et al. 2010; 2011).
That synthetic fibres are prevalent in sewage sludge has been known for quite some time. The
presence of synthetic fibres has been used as an indicator of municipal wastewater sludge
materials deposited at sea (Habib et al. 1996) and on agricultural lands (Zubris et al. 2005). The
sediment sampling location 10 km off the Dutch coast at Ter Heide (12/1137) is in the vicinity of
a historical sewage sludge dumping site. The number of microplastics detected in sediment from
this site was somewhat higher than 10 of the other 15 sites examined in this study, although this
cannot provide conclusive evidence of the origin of the microplastics. Pinpointing the origin or
source of field-collected, microplastic fragments is for the most part impossible to do accurately.
Figure 4.1 Examples of microplastics detected in North Sea marine sediments.
IVM Institute for Environmental Studies
20 Results and discussion
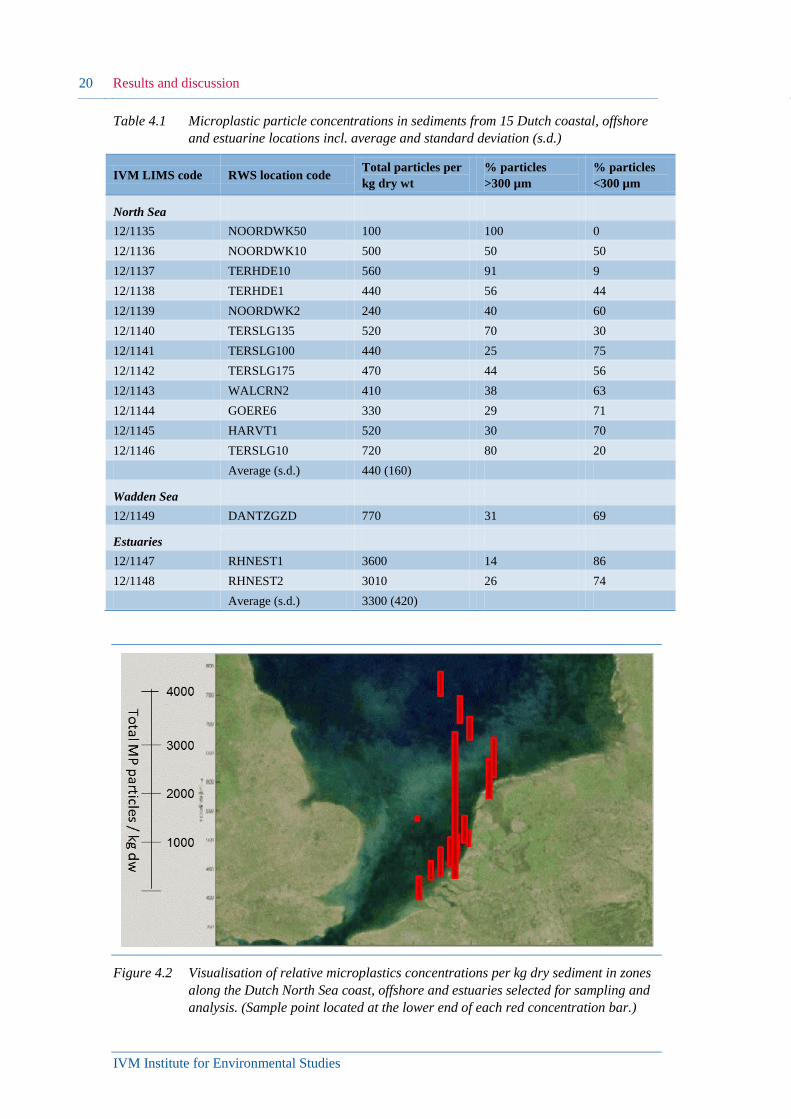
Table 4.1 Microplastic particle concentrations in sediments from 15 Dutch coastal, offshore
and estuarine locations incl. average and standard deviation (s.d.)
IVM LIMS code RWS location code Total particles per
kg dry wt
% particles
>300 µm
% particles
<300 µm
North Sea
12/1135 NOORDWK50 100 100 0
12/1136 NOORDWK10 500 50 50
12/1137 TERHDE10 560 91 9
12/1138 TERHDE1 440 56 44
12/1139 NOORDWK2 240 40 60
12/1140 TERSLG135 520 70 30
12/1141 TERSLG100 440 25 75
12/1142 TERSLG175 470 44 56
12/1143 WALCRN2 410 38 63
12/1144 GOERE6 330 29 71
12/1145 HARVT1 520 30 70
12/1146 TERSLG10 720 80 20
Average (s.d.) 440 (160)
Wadden Sea
12/1149 DANTZGZD 770 31 69
Estuaries
12/1147 RHNEST1 3600 14 86
12/1148 RHNEST2 3010 26 74
Average (s.d.) 3300 (420)
Figure 4.2 Visualisation of relative microplastics concentrations per kg dry sediment in zones
along the Dutch North Sea coast, offshore and estuaries selected for sampling and
analysis. (Sample point located at the lower end of each red concentration bar.)

IVM Institute for Environmental Studies
Microplastic survey of the Dutch environment 21
4.2 Microplastic in treated wastewater effluents
Microplastics were detected in all effluents (Table 4.2), with significant variation among the
three samples taken on the same day, possibly suggesting not all effluents samples are
representative of the bulk (therefore multiple samples or pooling is recommended). The
concentrations in individual samples ranged from 9 particles/L (min.) to 91 particles/L (max.)
with a mean and median of all samples of 52 particles/L. Fibres, spheres and fragments were
detected (Figure 4.3). The data shown here do not demonstrate any additional removal of
microplastics if effluents are treated in the membrane reactor (MBR) that is located at Heenvliet.
In fact, when looking at the means of all WWTP locations, they all emitted similar numbers of
microplastic particles/L treated effluent.
Table 4.2 Measured concentrations of microplastics in WWTP effluents (triplicate samples
per site). Average and standard deviation (s.d.) given per location and for
Heenvliet, for both effluent types (conventional and membrane reactor, MBR).
IVM LIMS code Location Particles/L
effluent
% particles
>300 µm
% particles
<300 µm
11/1347B Heenvliet Conv. 57 100 0
11/1347C Heenvliet Conv. 67 78 22
11/1347D Heenvliet Conv. 19 0 100
Average (s.d.) 48 (25)
11/1352A Heenvliet MBR 42 23 77
11/1352B Heenvliet MBR 43 31 69
11/1352C Heenvliet MBR 67 26 74
Average (s.d.) 51 (14)
12/0710 Amsterdam W 63 78 22
12/0711 Amsterdam W 9 33 67
12/0712 Amsterdam W 91 58 42
Average (s.d.) 54 (42)
13/0214A Houtrust 72 80 20
13/0214B Houtrust 47 86 14
13/0214C Houtrust 45 71 29
Average (s.d.) 55 (15)
IVM Institute for Environmental Studies
22 Results and discussion
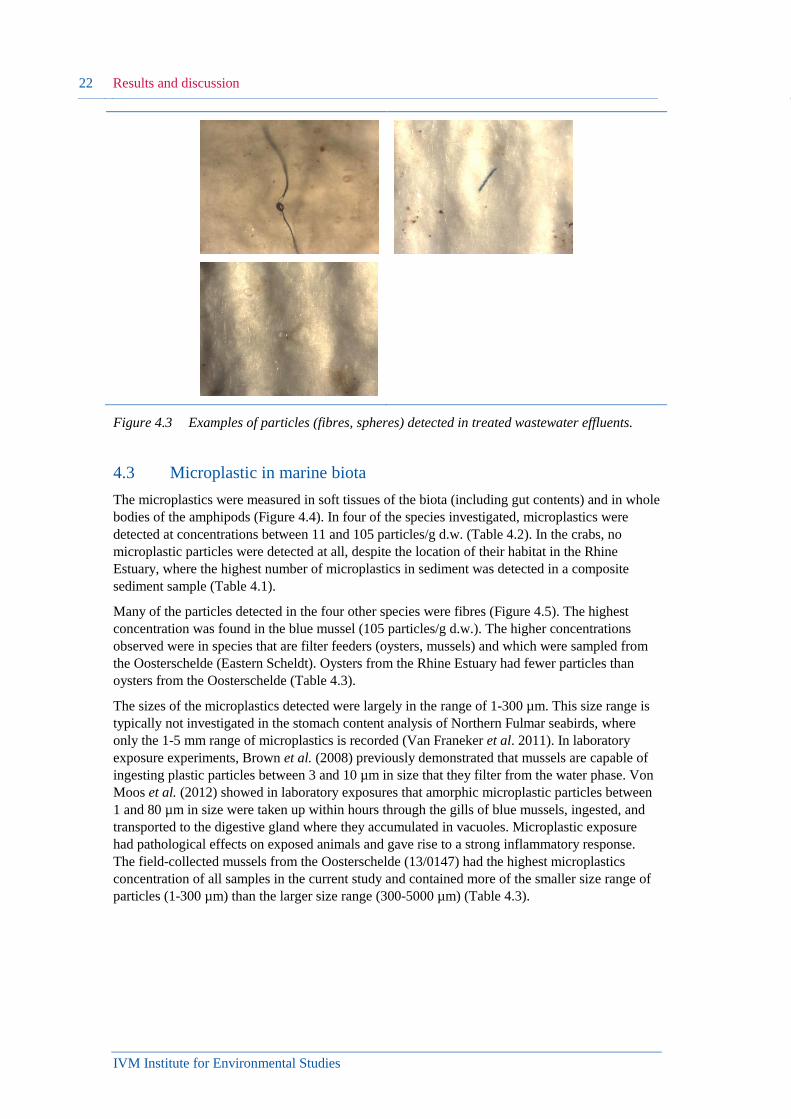
Figure 4.3 Examples of particles (fibres, spheres) detected in treated wastewater effluents.
4.3 Microplastic in marine biota
The microplastics were measured in soft tissues of the biota (including gut contents) and in whole
bodies of the amphipods (Figure 4.4). In four of the species investigated, microplastics were
detected at concentrations between 11 and 105 particles/g d.w. (Table 4.2). In the crabs, no
microplastic particles were detected at all, despite the location of their habitat in the Rhine
Estuary, where the highest number of microplastics in sediment was detected in a composite
sediment sample (Table 4.1).
Many of the particles detected in the four other species were fibres (Figure 4.5). The highest
concentration was found in the blue mussel (105 particles/g d.w.). The higher concentrations
observed were in species that are filter feeders (oysters, mussels) and which were sampled from
the Oosterschelde (Eastern Scheldt). Oysters from the Rhine Estuary had fewer particles than
oysters from the Oosterschelde (Table 4.3).
The sizes of the microplastics detected were largely in the range of 1-300 µm. This size range is
typically not investigated in the stomach content analysis of Northern Fulmar seabirds, where
only the 1-5 mm range of microplastics is recorded (Van Franeker et al. 2011). In laboratory
exposure experiments, Brown et al. (2008) previously demonstrated that mussels are capable of
ingesting plastic particles between 3 and 10 µm in size that they filter from the water phase. Von
Moos et al. (2012) showed in laboratory exposures that amorphic microplastic particles between
1 and 80 µm in size were taken up within hours through the gills of blue mussels, ingested, and
transported to the digestive gland where they accumulated in vacuoles. Microplastic exposure
had pathological effects on exposed animals and gave rise to a strong inflammatory response.
The field-collected mussels from the Oosterschelde (13/0147) had the highest microplastics
concentration of all samples in the current study and contained more of the smaller size range of
particles (1-300 µm) than the larger size range (300-5000 µm) (Table 4.3).

IVM Institute for Environmental Studies
Microplastic survey of the Dutch environment 23
Figure 4.4 Impression of sample preparation stage of marine biota (Clockwise from upper left:
blue mussel, sand crab, Pacific oyster, common periwinkle).
Table 4.3 Microplastics concentrations detected in five marine invertebrate species collected
from the Dutch coast at Oosterschelde Neeltje Jan outside (OS); Rhine Estuary
(RE), Ter Heide North Sea coast (TNS). Concentrations in number of particles per
gram of dry tissue.
IVM
LIMS
code
Species (location)
Dry
weight
(%)
Total particles
particles/g d.w.
Particle size
1-300 µm (%)
Particle size
300 -5000 µm
(%)
13/0144 Periwinkle (OS) 33 20 25 75
13/0145 Amphipod (OS) 10 11 67 33
13/0146 Pacific oyster (OS) 14 87 75 25
13/0147 Blue mussel (OS) 13 105 82 18
13/0148 Sand crab (RE) 24 0 0 0
13/0149 Pacific oyster (RE) 8 30 80 20
13/0150 Blue mussel (TNS) 19 19 50 50

IVM Institute for Environmental Studies
24 Results and discussion
Figure 4.5 Examples of fibres detected in extracts from marine biota.
IVM Institute for Environmental Studies
Microplastic survey of the Dutch environment 25
5 Concluding remarks
This exploratory study generated unique data for the Dutch marine environment through the
analysis and detection of microplastics in field collected invertebrates and sediments. In addition,
this study provided the opportunity to investigate the concentrations of microplastics in treated
wastewater effluents, already signalled in the summer of 2012 as a possible emission route to
surface waters and eventually to the marine environment (Leslie et al. 2012). The methods
applied have been recently developed and/or adapted from existing methods. This is a relatively
new field and we recognize that there is still work to be done on improving the data quality and
comparability of measured microplastic concentration data between laboratories. The quality will
be easier to assure and control in the future once e.g. reference materials, interlaboratory studies,
proficiency testing and training initiatives become available.
For spatial or temporal comparisons, it is useful to express concentrations in sediments based on
the dry weight of the sediments (as the wet weights vary more than the dry weights). The Belgian
group, Claessens et al. (2011) published sediment data for locations a few hundred km south of
the locations investigated in this study, and also found high amounts of microplastics which they
expressed as number of particles per mass of dry sediment. These reporting units are more useful
for comparing between sample sites than the number of particles per 50 ml wet sediment
expressed in earlier studies.
To make the data even more comparable in the future, and to properly interpret spatial and/or
temporal trends, there would be a need to measure or estimate the mass of the microplastic
materials in the sample as well. The current state-of-the-art approach is to count the particles in a
given amount of sediment. The particles belong to a wide variety of sizes, from potentially 10 nm
up to 5 mm and potentially (further) fragment in time. If a piece of plastic breaks in two
fragments, it means a doubling of the number of microplastics counted, while the amount of
plastic remains constant. This can potentially give a false impression that there is more plastic
material mass present at a given sampling location or time point when there is actually only a
larger number of relatively small plastic particles present. Solving this issue will require
investments in more method development in this area. Collecting data on size, number and total
mass of microplastic particles in sediments would provide for a powerful dataset.
Also more polymer identification method development is required to measure the very small
particles regularly encountered in this study. The infrared (IR)-based techniques are of limited
use when the particle size is very small. With light microscopy as an identification technique it is
important to exclude as many non-plastic particles as possible. This can be achieved through
improving the extraction methods, which put the characteristic properties of plastic to use.
Destruction of organic matter through methods that only plastic can withstand (e.g.
homogenization, acid, microwave, hydrogen peroxide treatments) is an option for biota, for
instance.
Density separation of plastics from aqueous samples, slurries or suspensions in water may be
improved for abiotic matrices. Other techniques, which may or may not be applicable to the
analysis of field collected samples, could be interesting to further develop for laboratory
exposure experiments (e.g. Claessens et al. 2013). Many methods will be operationally defined in
nature, as it will be difficult to find a single analytical method that extracts and quantifies all
plastic types with equal selectivity and sensitivity. The extraction of microplastic from
environmental matrices is an area with huge potential for further method development.
The relatively high measured concentrations of microplastics in sediment compared to various
studies of the water column concentrations (e.g. Norén 2008 but see also overview in Leslie et al.
2011), lends support to the suggestion that sediments act as sinks for microplastics and would be
a suitable matrix for monitoring. Common methods for sampling microplastics from seawater

IVM Institute for Environmental Studies
26 Concluding remarks
often rely on nets with 333 µm mesh sizes, limiting the catch to larger size categories than are
targeted when applying the sediment methods used here. This means the method for microplastic
extraction from sediment targets a broader size range of particles than most seawater extraction
methods. The levels of microplastics is high enough in North Sea sediments that should a future
increase or decrease occur at a given location, it is expected that there could be sufficient
statistical power built into a study design and sufficient power of analytical detection to observe
such a trend.
The detection of microplastics from WWTPs provided additional evidence for the inability of
WWTPs to retain all microplastics in the sludge, as in every treated effluent large numbers of
microplastics were observed. The data presented here suggests that membrane reactor systems
are not better at retaining microplastics in effluents than conventional WWTP system effluents.
Especially during heavy rainfall, municipalities may exceed their sewage system capacity and
emit untreated wastewater with microplastics.
Besides the emissions via wastewater effluents, sewage sludge is another possible emission route.
While incineration of sewage sludge is common practise in the Netherlands, many EU Member
States do not burn their sewage sludge. More than a third of sewage sludge in the EU is applied
as biosolid fertilizer to agricultural land. Other sewage sludge goes to landfills. Sewage sludge
dumping at sea was commonly practised by many EU Member States till the 1990’s. Run-off
surface water from agricultural fields treated with sewage sludge may bring microplastics to
rivers and eventually to the sea.
While improvements in wastewater treatment have been considerable since the 1980’s, a
significant percentage of EU citizens are not served by wastewater collection, particularly in
Southern and Eastern Europe, although there are also northern and central regions without
wastewater treatment (European Environment Agency, 2013). Considering the WWTP situation
in the EU and the evidence of emissions emerging from this present study, it would be advisable
to investigate and promote solutions to keep microplastics out of this waste stream. Besides
potential end-of-pipe solutions it would be recommended to seriously consider cleaner
production solutions, since the latter are immediately effective not only in regions with the
capacity to invest in advanced end-of-pipe treatment technologies, but also in less developed
regions where such advanced technologies are not readily available.
The detection of microplastics in field collected biota from the Netherlands coast has been
demonstrated in this study. Particularly the smaller size fraction was dominant in several of the
samples, with the exception of periwinkles. The physical impacts of microplastic body residues
are of concern but are only beginning to be studied in marine invertebrates (Moos et al. 2012;
Besseling et al. 2012; Wright et al. 2013). One hypothesis that arises from the results presented
here is that filter feeders may, through their feeding strategy, be more exposed to microplastics
than species with other feeding strategies (such as scavenging or grazing).
There remains much more to learn about which species are more susceptible to microplastics
exposure and if there are certain habitats where species are at higher risk than others. It should be
noted that that marine species preferred for human consumption include some filter feeders, e.g.
mussels, oysters. When new environmental contaminants are detected in biota, food chain
transfer studies are recommended to investigate whether secondary poisoning is taking place.
When prey organisms are consumed whole, the entire body residue of the prey is consumed by
the predator.
It was beyond the scope of this study to examine toxicological consequences of microplastic
exposure on the species selected for this study, although this is a key area of novel environmental
microplastics research (see examples given in Leslie et al. 2011). Besides the potential impact of
particle toxicity from microplastics, there is concern for the chemicals associated with plastics
(e.g. toxic additives, residual monomers and sorbed contaminants). According to the Global
IVM Institute for Environmental Studies
Microplastic survey of the Dutch environment 27
Chemicals Outlook Report (UNEP, 2012) there are relatively high numbers of substances of very
high concern (SVHCs) contained in plastics and product categories which are dominated by
plastic materials such as textile and clothing, and home and office articles.

IVM Institute for Environmental Studies
Microplastic survey of the Dutch environment 29
References
Besseling, E., Wegner, A., Foekema, E.M., van den Heuvel-Greve, M.J. & Koelmans, A.A. (2013).
Effects of microplastic on fitness and PCB bioaccumulation by the lugworm Arenicola marina
(L.). Environmental Science & Technology 47, 593-600.
Bogaart-Scholte, M.W.M., van der Weijden, M.H., Naber, A., Wetsteijn, L.P.M.J. & Roos, M. (2010).
MWTL Meetplan 2010. [Dutch National Monitoring Program Plan 2010], 390 pp. Waterdienst,
Rijkswaterstaat, Ministry of Infrastructure and Environment, The Netherlands. In Dutch.
Brown, M.A., Crump, P., Niven, S.J., Teuten E.L., Tonkin, A., Galloway T. & Thompson, R.C.
(2011). Accumulations of microplastic on shorelines worldwide: sources and sinks.
Environmental Science & Technology, 45, 9175-9179.
Brown, M.A., Dissanayake, A., Galloway, T.S., Lowe, D.M. & Thompson, R.C. (2008). Ingested
microscopic plastic translocates to the circulatory system of the mussel, Mytilus edulis (L).
Environmental Science & Technology, 42, 5026-5031.
Brown, M.A., Galloway, T.S. & Thompson, R.C. (2010). Spatial patterns of plastic debris along
estuarine shorelines. Environmental Science & Technology, 44, 3404-3409.
Claessens, M., de Meester, S., van Landuyt, L., de Clerck, K. & Janssen, C.R. (2011). Occurrence and
distribution of microplastics in marine sediments along the Belgian coast. Marine Pollution
Bulletin, 62, 2199-2204.
Claessens, M., Van Cauwenberghe, L., Vandegehuchte, M.B. & Janssen, C.R. (2013). New
techniques for the detection of microplastics in sediments and field collected organisms. Marine
Pollution Bulletin, 70, 227-233.
European Environment Agency. (2013). Urban waste water treatment (CSI 024) – Assessment.
Habib, D., Locke, D.C. & Cannone, L.J. (1998). Synthetic fibers as indicators of municipal sewage
sludge, sludge products, and sewage treatment plant effluents. Water, Air & Soil Pollution, 103,
1-8.
Leslie, H.A., Moester, M., de Kreuk, M. & Vethaak, A.D. (2012). Verkennende studie naar lozing van
microplastics door rwzi’s. [Pilot study on emissions of microplastics from wastewater treatment
plants]. H2O, 14/15, 45-47. In Dutch.
Leslie, H.A., van der Meulen, M.D., Kleissens, F.M. & Vethaak, A.D. (2011). Microplastic litter in
the Dutch Marine Environment. Deltares-IVM Report 1203772-000. The Netherlands, 85 pp.
Lindeboom, H.J., Witbaard, R., Bos, O.G. & Meesters, H.W.G. (2008). Gebiedsbescherming
Noordzee: Habitattypen, instandhoudingsdoelen en beheersmaatregelen. [Conservation of the
North Sea: Habitat types, conservation goals and management measures] Wageningen,
Wettelijke Onderzoekstaken Natuur & Milieu, WO Report 114, 33 pp. In Dutch.
Monitoring Guidance for Marine Litter in European Seas. MSFD GES Technical Subgroup on Marine
Litter (TSG-ML). Draft Report. July 2013.
Norén, F. (2008). Small plastic particles in coastal Swedish waters. N-Research report, commissioned
by KIMO Sweden. 11 pp.
Thompson, R.C., Olsen, Y., Mitchell, R.P., Davis, A., Rowland, S.J., John, A.W.G., McGonigle, D. &
Russell, A.E. (2004). Lost at sea: Where is all the plastic? Science, 304, 838-838.
UNEP. (2012). Global Chemicals Outlook: Towards sound management of chemicals. Report No.
DTI/1543/GE, 44 pp.
Van der Horst, A. (2013). Destructie van vetarm dierlijk en plantaardig materiaal m.b.v. een micro-
golfoven. [Destruction of non-fatty animal and plant material by microwave], IVM Standard
protocol W-DE-001, Institute for Environmental Studies, VU University Amsterdam, The
Netherlands, 7 pp. In Dutch.
IVM Institute for Environmental Studies
30
Van Franeker, J.A., Blaize, C., Danielsen, J., Fairclough, K., Gollan, J., Guse, N., Hansen P-L.,
Heubeck, M., Jensen, J-K., & Le Guillou, G. (2011). Monitoring plastic ingestion by the
Northern fulmar Fulmarus glacialis in the North Sea. Environmental Pollution, 159, 2609-2015.
Von Moos, N., Burkhardt-Holm, P. & Köhler, A. (2012). Uptake and effects of microplastics on cells
and tissue of the blue mussel Mytilus edulis L. after an experimental exposure. Environmental
Science & Technology 46, 11327-11335.
Wright, S.L., Thompson, R.C. & Galloway, T.S. (2013). The physical impacts of microplastics on
marine organisms: A review. Environmental Pollution 178, 483-492.
Zubris, K.A.V. & Richards, B.K. (2005). Synthetic fibers as an indicator of land application of sludge.
Environmental Pollution, 138, 201-211.


