

EVALUATION OF FACTORS AFFECTING THE TENSILE PROPERTIES OF CEMENT-TREATED MATERIALS
by
Humberto J. Pendola Thomas W. Kennedy W. Ronald Hudson
Research Report Number 98-3
Evaluation of Tensile Properties of Subbases for Use in New Rigid Pavement Design
Research Project 3-8-66-98
conducted for
The Texas Highway Department
in cooperation with the U. S. Department of Transportation
Federal Highway Administration Bureau of Public Roads
by the
CENTER FOR HIGHWAY RESEARCH
THE UNIVERSITY OF TEXAS AT AUSTIN
September 1969

The opinions, findings, and conclusions expressed in this publication are those of the authors and not necessarily those of the Bureau of Public Roads.
ii

PREFACE
This is the third in a series of reports dealing with the findings of a
research project concerned with the evaluation of properties of stabilized
subbase materials. This report presents some of the factors which are impor
tant in determining the strength of cement-treated materials and reports the
findings of an evaluation by indirect tensile test of nine factors thought to
affect the tensile properties of cement-treated materials. The effects of
these nine factors and their interactions on tensile properties are summarized
here, as are the statistical design and analysis used in the evaluation.
This report required the assistance of many individuals; the authors
would like to acknowledge the work of all those who contributed to it.
Special thanks are extended to Dr. Virgil L. Anderson and Mr. Joseph A. Kozuh
for their help in designing the statistical experiment and in providing guid
ance in the analysis of the data. Special appreciation is due Messrs. Pat
Hardeman and James N. Anagnos for their assistance in the preparation and
testing of the cement-treated materials. Thanks are also due to Mr. James L.
Brown of the Texas Highway Department, who provided the technical liaison for
the project.
Future reports will be concerned with a preliminary investigation of
the tensile characteristics and behavior of lime-treated materials and with
a detailed investigation of the tensile characteristics of asphalt-treated,
cement-treated, and lime-treated materials. Reports will be written on such
subjects as (1) factors affecting the tensile characteristics and behavior
of these three materials when subjected to static loads and dynamic repeated
loads, (2) correlation of indirect tensile test parameters with parameters
from standard Texas Highway Department tests, (3) performance criteria for
iii
iv
stabilized materials, (4) feasibility of determining an effective modulus of
elasticity and Poisson's ratio from results of indirect tensile tests, and
(5) development of support value k for a layered system related to layer
thickness, modulus, and the area of loading.
September 1969
Humberto J. Pendola Thomas W. Kennedy W. Ronald Hudson

LIST OF REPORTS
Report No. 98-1, '~n Indirect Tensile Test for Stabilized Materials," by W. Ronald Hudson and Thomas W. Kennedy, summarizes current knowledge of the indirect tensile test, reports findings of limited evaluation of the test, and describes the equipment and testing techniques developed.
Report No. 98-2, '~n Eva]uation of Factors Affecting the Tensile Properties of Asphalt-Treated Materials," by William O. Hadley, W. Ronald Hudson, and Thomas W. Kennedy, discusses factors important in determining the tensile strength of asphalt-treated materials and reports findings of an evaluation of eight of these factors.
Report No. 98-3, '~valuation of Factors Affecting the Tensile Properties of Cement-Treated Materials," by Humberto J. Pendola, Thomas W. Kennedy, and W. Ronald Hudson, presents factors important in determining the strength of cement-treated materials and reports findings of an evaluation by indirect tensile test of nine factors thought to affect the tensile properties of cement-treated materials.
v

!!!!!!!!!!!!!!!!!!!"#$%!&'()!*)&+',)%!'-!$-.)-.$/-'++0!1+'-2!&'()!$-!.#)!/*$($-'+3!
44!5"6!7$1*'*0!8$($.$9'.$/-!")':!

ABSTRACT
This study was performed to evaluate the factors and interactions affect
ing the tensile properties of cement-treated materials. Nine factors were
investigated: cement content, molding water content, aggregate gradation,
curing time, curing temperature, type of aggregate, type of curing, type of
compaction, and compactive effort. The first five were investigated at three
levels and the last four at two levels. A statistically designed fractional
factorial experiment was run for the evaluation.
The parameter considered as a primary indicator of the tensile properties
of cement-treated materials was indirect tensile strength. Analysis of
variance was used to determine the significance for all the main factors,
two-factor interactions, and three-factor interactions. The highly signifi
cant effects, (a = 0.01) are discussed in this report, and tables of factors
and interactions significant at alpha levels of 1 and 5 percent are shown.
As a result of the regression analysis, an equation which predicts values of
the indirect tensile strength within the inference space defined by the
experiment was developed.
vii

!!!!!!!!!!!!!!!!!!!"#$%!&'()!*)&+',)%!'-!$-.)-.$/-'++0!1+'-2!&'()!$-!.#)!/*$($-'+3!
44!5"6!7$1*'*0!8$($.$9'.$/-!")':!
TABLE OF CONTENTS
PREFACE
LIST OF REPORTS
ABSTRACT
CHAPTER 1. INTRODUCTION
CHAPTER 2. CURRENT STATUS OF KNOWLEDGE
Genera 1 Effects Mechanism of Portland Cement Stabilization
Hydration of Cement Cation Exchange . . Carbonation . . . . Pozzolanic Reaction
Factors Affecting the Properties of Cement-Treated Effect of Density and Molding Water Content Effect of Cement Content . . . . . . Effect of Type of Soil and Gradation Effect of Type of Curing Effect of Length of Curing .... . Effect of Curing Temperature ... . Effect of Method of Compaction and Compactive Effect of Length of Mixing Effect of Degree of Pulverization Effect of Cement Type .. Effect of Repeated Loads ... . Effect of Shrinkage .. .. ..
Summary of Current Status of Knowledge
CHAPTER 3. EXPERIMENTAL PROGRAM
Standard Test Procedures and Equipment . Design of the Experiment Selection of Factors . .
Molding Water Content Curing Time . . . . Aggregate Type Aggregate Gradation Type of Curing
ix
Mixtures
Effort
iii
v
vii
1
3 3 4 4 4 4 5 5 6 7 8 8 9 9
10 11 11 12 12 13
15 17 20 20 22 22 22 24
x
Curing Temperatures Compactive Effort . Type of Compaction Cement Content
Parameters Evaluated Experimental Results
CHAPTER 4. DISCUSSION OF RESULTS
Statistical Inference Analysis of Variance .
Four-Factor Interactions Three-Factor Interactions Main Effects . . . .
Evaluation and Discussion Regression Analysis
Regression Equation Nonlinear Effects .
CHAPTER 5. CONCLUSIONS, RECOMMENDATIONS, AND APPLICATIONS
Conc lus ions Recommendations
Applications
REFERENCES
APPENDICES
..
Appendix 1. Appendix 2. Appendix 3. Appendix 4.
Types of Gradations Used in This Experiment Treatment Combinations ...... . Prepara tion of the Specimens . . . . . . . Duplicate Specimens and Error Term Calculations
24 24 24 26 26 27
31 33 33 34 45 45 50 51 53
55 57 57
59
69 75 85 93
CHAPTER 1. INTRODUCTION
The use of cement-treated materials in the construction of pavements has
grown significantly in the last fifty years, due to several factors. One of
the most important of the factors responsible for the widespread and increasing
use of stabilized materials is the scarcity of suitable granular materials at a
time when tremendous quantities are needed for building new highways. Another
factor is the need for a stable working base which will minimize construction
delays due to adverse weather conditions. Finally, there is the need for im
proved pavement performance and reduced maintenance cost (Refs 4 and 5).
One aspect of pavement performance and behavior which has received little
attention concerns the tensile properties of the materials used in the various
layers of a pavement. Both theoretical considerations and field observations
demonstrate the importance of these tensile characteristics, yet little con
sideration is given to them in the design and evaluation of pavements (Refs
10 and 11). In addition, little information is available on the tensile
characteristics of cement-treated materials, possibly because of the lack of
simple, effective tensile testing techniques.
In an attempt to develop information on the tensile properties of stabi
lized material~ and to incorporate this information into a new design method
for pavements, the Center for Highway Research at The University of Texas at
Austin has evaluated the indirect tensile test and applied it to the evaluation
of the tensile behavior of stabilized pavement materials (Refs 6, 7, and 8).
The purpose of this study was to describe the application of this test to
cement-treated materials and to determine the factors and interactions between
factors which significantly affect the tensile properties of cement-treated
materials under static load.
1

!!!!!!!!!!!!!!!!!!!"#$%!&'()!*)&+',)%!'-!$-.)-.$/-'++0!1+'-2!&'()!$-!.#)!/*$($-'+3!
44!5"6!7$1*'*0!8$($.$9'.$/-!")':!

CHAPTER 2. CURRENT STATUS OF KNOWLEDGE
In general, cement-treated materials are mixtures of pulverized soils,
portland cement, and water which are compacted to high unit weight and pro
tected against moisture loss during a specified curing period. Although many
terms, such as soil-cement, cement-modified soils, and plastic soil-cement,
are used to designate a particular type of mixture (Refs 12, 13, 14, and 15),
it is felt that all of these materials can be defined as cement-treated, and
that term is used throughout this report.
GENERAL EFFECTS
The addition of portland cement to a soil usually results in a material
with engineering characteristics which are significantly improved as compared
to the properties of the unaltered soil. In general, cement-treated soils
exhibit the following changes (Ref 12):
(1) reduced plasticity indices,
(2) increased plastic limits,
(3) reduced liquid limits (for soils with liquid limits greater than 40) or increased liquid limits (for soils with liquid limits less than 40),
(4) increased strengths,
(5) reduced permeabilities, and
(6) reduced volume changes.
MECHANISM OF PORTLAND CEMENT STABILIZATION
The improvement of the engineering properties of cement-treated materials
is often attributed solely to the hydration of the portland cement. This con
cept assumes that the soil is inert, but in reality it is not, since certain
physical-chemical reactions occur between the cement, water, and soil. The
four mechanisms of cement stabilization are hydration, cation exchange, car
bonation, and pozzolonic reactions (Refs 12, 16, 17, 18, and 19). The latter
two are of minor importance.
3

4
Hydration of Cement
The hydration of cement is by far the most important contributor to the
improvement of engineering properties. As the cement hydrates, strong link
ages develop between the soil particles and form a more or less continuous
skeleton of hard, strong material enclosing a matrix of unaltered soil. This
skeleton not only strengthens the treated material but also fills some of the
voids and thus reduces permeability and swelling tendencies and increases
resistance to the deleterious effects of changes in the ambient moisture con
ditions (Refs 12 and 18).
Cation Exchange
The first noticeable property change that occurs when cement is mixed
with a moist cohesive soil is a marked reduction in the plasticity of the
treated material. This is attributed to either a cation exchange or the
crowding of additional cations onto the surface of the soil particles. In
both cases the electrical charge on the soil particles is altered, and floccu
lation or aggregation of the soil particles results. This flocculation gen
erally occurs within a few days after mixing and probably is the second most
important mechanism of cement stabilization (Refs 12 and 18).
Carbonation
Cementitious materials may be formed by the chemical reaction of carbon
dioxide from air with lime generated during hydration of the cement. The
reaction results in calcium carbonate, which provides an additional cementing
agent (Ref 18).
Pozzolonic Reaction
Additional cementitious material results from the reaction between free
lime liberated during hydration and silica or alumina from clay. The lime and
the silica or alumina react in the presence of moisture to produce a cementi
tious material which strengthens the bonds within the treated material, but
this reaction is of a long term nature and probably contributes very little
to the strength of the mixture (Refs 18 and 19).

5
FACTORS AFFECTING THE PROPERTIES OF CEMENT-TREATED MIXTURES
Although most soils can be successfully stabilized with cement, the
engineering properties of the cement-treated materials may vary widely. These
variations result from many factors, the more important of which are
(1) density of the compacted mixture,
(2) water content at the time of mixing and compaction,
(3) cement content of the mixture,
(4) type of soil,
(5) gradation of the soil,
(6) type of curing,
(7) length of the curing period,
(8) temperature of curing,
(9) method of compaction,
(10) compactive effort,
(11) length of mixing time,
(12) degree of pulverization of the soil, and
(13) type of cement.
Although all these factors affect the properties of the cement-treated
mixtures, a review of the literature indicated that the first ten were the
most important, providing that reasonable levels were used for the last
three. Thus, it was felt that the effect of these ten factors on the tensile
properties of cement-treated materials should be investigated.
Although little if any work has been conducted on the effect of these
factors on the tensile characteristics of cement-treated materials, numerous
studies (Refs 20 through 40) have been made in terms of other engineering
properties, e.g., compressive strength and durability characteristics. Summa
rized below is the current status of knowledge concerning the most significant
factors which affect the properties of cement-treated materials.
Effect of Density and Molding Water Content
Density and water content at the time of mixing are directly related to
the compressive strength. Previous experiments on fine-grained soils have
shown that most soils stabilized with portland cement exhibit a parabolic
moisture density curve (Refs 21, 22, and 41). Felt (Ref 21) showed that for
either sandy or clayey soils an increase in density of 1 pcf resulted in an

6
increase in compressive strength of approximately 20 psi. However, experiments
by Kayyal (Ref 38) showed that strength increased with density up to a certain
limit and then a further increase in density produced a decrease in strength.
The molding water content of a cement-treated mixture is important in
obtaining the desired compacted density, since maximum densities are obtained
at optimum water content (Ref 42). For the coarser aggregates an increase of
water content slightly below the optimum produced maximum compressive strength,
but the finer soils showed maximum compressive strength when the water con
tent was increased a little above optimum. Generally, gradation influences
the optimum moisture content. According to Martin (Ref 23), coarser grada
tions produced denser mixes and reduced the optimum moisture content.
The fact that strength reaches a maximum and decreases in a manner some
what like that of the moisture-density curve suggests a strong relationship
between density and strength. It was found (Ref 12) that for coarse soils
compacted according to the modified AASHO method, strength was not signifi
cantly affected by reductions of water below optimum, but for the finer soils,
the strength decreased when the water was decreased below the optimum content.
However, according to Watson (Ref 43), the basic characteristics of the soil,
i.e., gradation, plasticity, etc., had more effect on the compressive strength
of a cement-treated mixture than on any other factor. He also stated that
increasing the amount of cement in a given soil from 5 to 11 percent produced
a greater increase in compressive strength than did the factors of varying
density and water content.
Effect of Cement Content
Several experimenters (Refs 21, 24, 25, 43, 44, and 45) have analyzed the
effect of cement content on the properties of cement-treated mixtures. The
proportion of cement alters the plasticity, the volume change, the suscep
tibility to frost-heave, the elastic properties, the durability, and other
properties in different degrees for different soils.
Felt (Ref 21) varied the cement content from 6 to 30 percent for sands,
silts, and clays. As expected, all the soils increased in strength with an
increase in cement content; however, the rate of increase varied with the type
of soil, with the sand-cement mixture exhibiting the greatest increase.
Circeo, Davidson, and Davis (Ref 30) investigated the effect of cement con
tent on the slope of the strength-age relationship. In their experiment it

7
was found that the slope was small at low cement contents and that the slope
of the strength-age relationship increased as the cement content increased.
Laboratory and field tests performed by Abrams (Ref 24) on two granular base
materials treated with various quantities of cement showed that an increase in
cement content resulted in an increase in the durability and strength of the
materials.
Nussbaum and Larsen (Ref 25) in their experiment on load-deflection
characteristics of cement-treated pavements showed that load capacity in
creased with increased cement content but that the effect was more signifi
cant at lower cement contents.
Effect of Type of Soil and Gradation
As previously noted, physical-chemical reactions invoiving the soil,
cement, and water occur; thus, the type of soil should affect the quality and
strength of cement-treated materials, not only because of its physical charac
teristics but also because of its physical-chemical characteristics.
Felt (Ref 21) showed that sandy soils exhibited higher compressive
strengths than silty and clayey soils having the same percentages of cement
at all ages of curing. Sandy and gravelly soils, however, may react differ
ently with cement depending upon their chemical makeup and surface chemical
properties. Some poor reactions are due to a deficiency of fines and the
presence of deleterious organic matter (Refs 26 and 27). These deleterious
organic compounds, such as nucleic acid and dextrose, generally have a low
molecular weight and act as retarders, causing low strengths (Ref 28).
The shape of the soil particles is important since better interparticle
friction and a better packing of the mixture are attained when angular aggre
gates are used instead of aggregates having rounded or smooth surfaces.
McLaren (Ref 46) studied the properties of a wide range of granular
materials mixed with small quantities of cement. The results showed that the
compressive strength was dependent on the type of materials used. White lime
stone and slag gave substantially higher strengths than other granular mate
rials.
Catton (Ref 29) found in his experiment that densities and strengths were
higher for well-graded coarse type aggregate, than for the fine-type soils,
when they were stabilized with portland cement. As liquid limit, plasticity

8
index, and surface area increased, the requirements on the cement to produce a
structural material increased (Ref 24).
In a review and evaluation of cement-treated pavements, Mitchell and
Freitag (Ref 44) said that the soils that can be hardened satisfactorily with
reasonable amounts of cement are those which have approximately the following
characteristics:
(1) percent finer than No. 200 sieve - less than 35,
(2) percent passing No.4 sieve - greater than 55,
(3) maximum size of aggregate - 3 inches,
(4) liquid limit - less than 50 percent, and
(5) plasticity index - less than 25 percent.
Effect of Type of Curing
The type of curing is another important factor which affects the proper
ties of cement-treated mixtures. The type of curing determines the amount of
moisture which will be retained in the cement-treated soil mixture during the
curing period. Generally, if more moisture is retained during the curing
period the strength will be higher (Refs 47 and 48). It has been reported
(Ref 12), however, that the influence of moisture is related more to its
ability to improve workability and facilitate compaction than it is to the
water requirements for hydration, since adequate water for compaction insures
adequate water for hydration, provided it is not lost during the curing period.
The significant moisture content is, thus, that which prevails at the time of
compaction and throughout the curing.
Effect of Length of Curing
Leadabrand (Ref 49) studied the time-compressive strength relationship
for two soils at different laboratory curing times of up to five years. He
also took cores from field construction projects ranging in age from one to
twenty years. It was found that cement-treated mixtures continued to increase
in strength with increasing age in a manner similar to concrete.
Circeo, Davidson, and Davis (Ref 30) statistically analyzed the effect
of curing time on compressive strength. It was found that the closest corre
lation for granular cement-treated mixtures was a semi-logarithmic relation
ship, and for silty and clayey cement-treated mixtures, the closest correla
tion was a logarithmic relationship between the compressive strength and the

9
curing time. These relationships could be used to predict the compressive
strength of soil-cement at a future time of curing. The slope of the strength
age relationship was found to be affected by the physical and chemical prop
erties of the soil, the cement content, and certain chemical additives. Thus,
the slope of the strength-age relationship is a good indicator of the quality
of cement-treated mixtures.
Effect of Curing Temperature
Clare and Pollard (Ref 31) studied the effect of curing temperature at
ages of up to three months for five different soils mixed with 10 percent
cement. Their conclusions were: (1) for cement-treated road base constructed
in the spring, the strength during the first three months will be 50 percent
to 100 percent greater than if the base were constructed in the fall; (2) to
get the same strength, less cement is necessary for a soil under tropical
rather than temperate conditions; (3) cement-treated materials will harden
in cold weather provided that the temperature is not below 00
C; (4) the
seven-day strength varies directly with temperature, changing from 2 percent
to 2.5 percent with each degree centigrade change in the curing temperature, o
when the latter is near 25 C; (5) the nature of the strength-age relation-
ship for cohesive soils suggests that hardening is accelerated by increasing
temperature (Ref 31).
These findings were corroborated by Dumbleton and Ross (Ref 32), who
determined the effect of curing temperature between 00
C and 450
C on the
strength and strength-age relationships of a heavy-clay, a silty-clay, and a
sand treated with hydrated lime and portland cement. The increase of strength
per unit increase of curing temperature was greater at higher rather than at
lower temperature ranges for cohesive soils. With noncohesive treated sand,
the increase of strength with increase of curing temperature was almost inde
pendent of temperature range.
Effect of Method of Compaction and Compactive Effort
Considerable effort has been devoted to the development of laboratory
compaction procedures which will satisfactorily duplicate the effects of field
compaction. As a result, several compaction procedures are now in use (Refs
38 and 39). These methods differ primarily in terms of the relative magni
tudes of shear strain imparted to the specimens.

10
One common compaction method involves dropping a weight onto the surface
of the soil. This process is referred to as impact compaction (Ref 50).
Another method involves subjecting the soil to a static load which is built
up slowly to some predetermined value and then released. This process is
referred to as static compaction and has limited use.
In order to simulate the effect of sheepfoot rollers, a kneading com
pactor is used. It is effected by building up pressure on a small area of
soil to a preselected value, maintaining it briefly, and then gradually
releasing the pressure.
Since vibration is an effective means of compacting deposits of granu
lar soils, another process of compaction was developed at The University of
Texas at Austin to simulate the effects of vibratory rollers. It is a modi
fication of kneading compaction in which the pressure is maintained and is
applied to the soil by oscillating at a high frequency. This process is
referred to as vibratory-kneading compaction (Ref 38),
Another method, the gyratory shear compaction, involves the application
of a shearing action to a speciman by gyrating a mold while maintaining a
static pressure on the sample. This method is currently used by the Texas
Highway Department (Ref 51).
Seed and Chan (Ref 52) studied the effect of the method of compaction on
the strength of clay samples and El-Rawi (Refs 33 and 34) studied the strength
characteristics of a clay, a silt, and a coarse sand stabilized with portland
cement using two different methods of compaction, i.e., kneading and impact.
Through his study, El-Rawi found that specimens compacted wet of optimum by
kneading compaction gave lower unconfined strength and lower cohesion values
than those compacted wet of optimum by impact compaction,
Effect of Length of Mixing
Cement-treated pavement bases are frequently constructed using mixed-in
place procedures. The first step consists of pulverizing the soil in place
and then adding the desired amount of cement to complete the dry mixing. A
portion of the water is then added and the material mixed again. This process
may be repeated until the optimum moisture content is achieved. Thus, several
passes of the mixing equipment may be necessary, and the process may continue
for two hours or more (Refs 14 and 15).

11
With the thought of simulating field conditions, Felt (Ref 21) dump
mixed cement-treated mixtures for different periods of time in the laboratory
and then molded and compacted them into test specimens. During the mixing
period, water was added to the dry mix in equal increments of time, and after
each addition of water the mixture was stirred for about two minutes. The
water added in each increment was proportioned so that at the end of the
specified time the mixture was at optimum moisture content. Water lost by
evaporation was replaced just prior to molding the specimens. It was found
that increasing the time of mixing decreased the compressive strength, espe
cially when granular soils were used instead of fine soils, and also that,
for durability, intermittent mixing was not as detrimental as long periods of
continuous mixing.
Effect of Degree of Pulverization
Certain specifications (Refs 14 and 15) for soil-cement base construc
tion require the soil (exclusive of gravel, stone, etc.) to be pulverized so
that 80 percent passes the No.4 sieve. Felt (Ref 21) ran some experiments
directed toward analyzing the effect of clay lumps in the quality of soil
cement mixtures. He found that in some cases air-dried clay lumps added to a
moist soil passing No.4 sieve produced complete failure by disruption of the
specimens, as the dry clay lumps absorbed water and swelled during the curing
and testing period. When the clay lumps were moist and, thus, in a swelled
condition at the time of inclusion in the test specimens, the unpulverized
soil had little harmful effect. To eliminate the effect of clay lumps in
fine-grained soils, it was recommended that the soil be wetted prior to
compaction.
Generally, pulverization of soils improves the mixing uniformity. Baker
(Ref 35) ran tests on strength of cement-treated mixtures as a function of
mixing uniformity. He found that increasing the uniformity of the mix in
creased the strength.
Effect of Cement Type
Controlled experiments involving the use of normal and air entraining
normal cement with three different soils showed that moisture-density
relationships, compressive strengths, and brushing losses in wet-dry and

12
freeze-thaw tests for the two types of cement were similar enough to allow
the two types of cement to be used interchangeably in cement stabilization
(Re f 21).
Davidson and Bruns (Ref 36) performed some experiments on comparison of
normal and high early strength portland cements for soil stabilization. High
early strength cements gave higher strengths than normal portland cements at
different percentages and at different ages. This strength difference for
the two types of cement was more pronounced during the first seven days than
after 28 days of curing.
Effect of Repeated Loads
The factors which control the properties of cement-treated materials
under repeated loading are by no means clear and well defined. The experi
mental data available are based on limited conditions and therefore present
a rather narrow perspective by which to generalize and correlate the complex
pattern of property variations which occur. Previous studies of untreated
soils and base course materials under the action of repeated compressive
stresses have shown that such factors as stress history, frequency and inten
sity of repeated stress, and the number of load repetitions may influence the
properties significantly.
Nussbaum and Larsen (Ref 37) of the Portland Cement Association, Mitchell
and Shen (Ref 53) of the University of California, and several other research
ers have been working on different types of cement-treated soils subjected to
repeated loads and on the influences of repetitive loading in the properties
of cement-treated materials. Repetitive tensile stress tests on cement
treated materials have not yet been run but they will soon be performed on
cement and other stabilized materials at The University of Texas Center for
Highway Research, as a part of the project "Evaluation of Tensile Properties
of Subbases for a New Rigid Pavement Type."
Effect of Shrinkage
Barksdale and Vergnalle (Ref 60) state that the most important factors
which influence shrinking in portland cement-stabilized bases are the physical
chemical soil characteristics, amount of cement, compaction moisture content,
degree of compaction, and method and time of curing. George (Ref 61) reports
that in general, longer curing increases the total shrinkage of sandy soils,

l3
but the reverse is true for clayey soils. Shrinkage of soil-cement first
decreases with proportion of cement, attains a minimum, and thereafter
increases slightly with cement content. He states that it is possible to
find an optimum proportion for least amount of shrinkage. Furthermore, it
appears that molding moisture content has the most influence on shrinkage and
that shrinkage can be reduced by improving compaction of the beam specimens.
SUMMARY OF UTRRENT STATUS OF KNOWLEDGE
From the literature review it appears that soil, cement, and water enter
into complex physical-chemical reactions which produce a material with engi
nee ring
In
ing:
(1)
(2 )
(3 )
(4 )
(5 )
(6)
(7)
(8)
(9)
(10)
(11)
(12 )
(13)
properties differing significantly from those of the untreated soil.
general the literature shows that strength increases with the follow-
an increase in cement content,
an increase in density,
the use of coarse graded materials,
the use of angular aggregates,
an increase of molding moisture content in the range below optimum,
better retention of moisture during the curing period,
an increase of curing time,
an increase of curing temperature,
the use of low shear strain type of compaction at moisture contents above optimum,
an increase in compactive effort,
a decrease of mixing time,
an increase in the degree of pulverization, and
the use of high early strength cement for curing periods less than 28 days.
Unfortunately, most of the above findings are for unconfined compressive
strengths. Few if any studies have been conducted in terms of tensile
strengths. In addition, the above studies have not evaluated a large number
of factors simultaneously. Thus, no estimate is available on interactions
which may significantly affect the properties of cement-treated materials.

!!!!!!!!!!!!!!!!!!!"#$%!&'()!*)&+',)%!'-!$-.)-.$/-'++0!1+'-2!&'()!$-!.#)!/*$($-'+3!
44!5"6!7$1*'*0!8$($.$9'.$/-!")':!
CHAPTER 3. EXPERIMENTAL PROGRAM
The indirect tensile test and its application to stabilized materials
were considered and discussed in detail by Hudson and Kennedy (Refs 6 and 7).
From this evaluation it was concluded that of the currently available tensile
tests, the indirect tensile test has the greatest potential for the evaluation
of the tensile properties of highway materials.
Essentially the test consists of applying compressive loads along opposite
generators of the cylindrical specimen. This results in a relatively uniform
tensile stress perpendicular to and along the diametral plane containing the
applied load. Failure usually occurs as splitting along this loaded plane
when the tensile stress exceeds the tensile strength of the material.
STANDARD TEST PROCEDURES AND EQUIPMENT
The procedure followed for the testing of the cement-treated specimens is
the same as that recommended by Hudson and Kennedy (Refs 6 and 7) with slight
modifications (Ref 8).
Specimens were 4 inches in diameter with a nominal height of 2 inches. o
Testing was conducted at 75 F at a loading rate of 2 inches per minute.
Stainless steel loading strips were used to apply the load to the specimens.
The overall width of the strip was 1 inch with the middle half-inch composed
of a curved section with a radius of 2 inches. Tangent sections approximately
1/4-inch long were machined from the curved portion to each end of the strip
to prevent any punching to the specimen during testing.
Using the curved strips results in a known loading area and allows the
use of the theoretical equations required for evaluating linear elastic
materials (Ref 8). The stresses along the principal planes corresponding to
the horizontal and vertical axes for a loading strip of 1 inch are plotted in
Fig 1. The equations for the stresses at the center of a nominal 4-inch
diameter specimen for this loading configuration reduce to
15

16
-1.0
- .8
c -.6 0
III
'" 4> -.4 ... Q,
E 0
(,,) - .2
+ a
c .2 0
III C II> .4 ~
.6
.8
1.0
-
-
I I I I I I I I I I
1.0 .8 .6 .4 .2 a -.2 -.4 -.6 -.8 -1.0 - 1.2 -1.4 -1.6
Tension ~I ~ Compression
Fig 1. Stress distribution a ong the principal axes for a loading strip width equal to inch (Ref 8).

where
(1)
(2 )
cr rx =
cr = cr ry ry
p 1. 85152 TTtD
P -5.89440 TTtD
P maximum total land, in pounds;
P 0.58936 tD
P -187624-• tD
and
D average diameter of the specimen, in inches;
t = average height of the specimen, in inches;
cr = stresses along the horizontal plane; rx
cr stresses along the vertical plane. ry
The basic testing equipment was the same as previously used in other
studies at The University of Texas (Refs 6, 7, and 8) and consists of an
adjustable loading frame, a closed loop electrohydraulic loading system, and
17
a loading head which is a modified, commercially available shoe-die with upper
and lower platens constrained to remain parallel during tests.
Another piece of equipment, a device for measuring the transverse strain
in a specimen, was used to obtain a measure of specimen deformation in the
direction of the tensile stresses causing failure. This measuring device
consisted of two cantilevered arms with attached strain gages.
Vertical deformations were measured by a DC linear-variable-differential
transducer which was also used to control the rate of load application by
providing an electrical signal related to the relative movements of the upper
and lower platens. All measurements were recorded on two x-y plotters.
DESIGN OF THE EXPERIMENT
This experiment was designed to evaluate the significance of all main
effects, all two-factor interactions*, and selected three-factor interactions
*Interaction is the differential response to one factor in combination with varying levels of one or more other factors applied Simultaneously; that is, an interaction is an additional effect due to the combined influence of two or more factors (Ref 54).

18
for the nine major factors considered to affect the tensile properties of
cement-treated materials. Other factors may also have significant effects
on the tensile properties of cement-treated materials; nevertheless, they are
not considered in this study since their effects have been judged to be small
compared with the other factors and since their inclusion would have required
a number of specimens so large that it would have been impractical.
Of the nine factors chosen for evaluation, it was felt that five should
be studied at three levels in order to estimate the nonlinear effects of the
main factors and the interactions included in the experiment. For the remain
ing four factors only two levels were included since the levels could not be
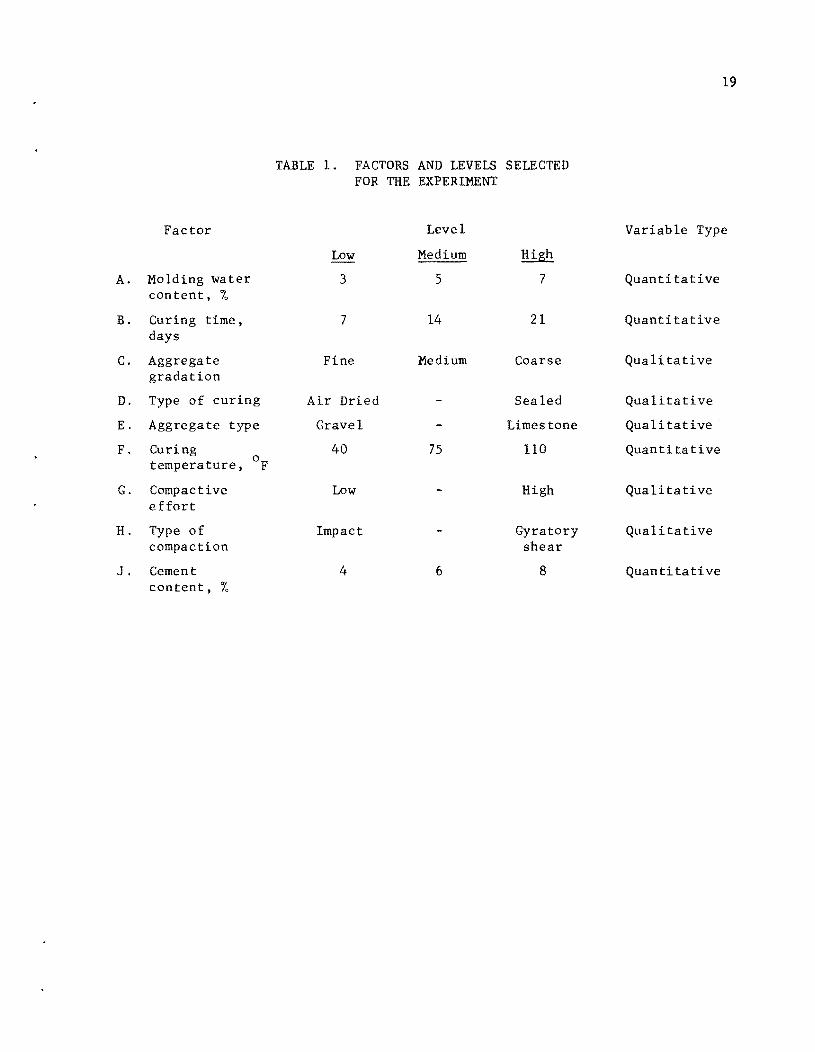
assigned meaningful quantitative values. The factors and levels selected for
this investigation are summarized in Table 1.
The need for information on a large number of factors and their inter
actions required a statistically designed experiment. To investigate all
main effects and all interactions would have required a complete factorial
experiment, which was highly desirable, but would have required so many ex
perimental units that it could not have been handled economically (Ref 54).
A complete factorial would have included five factors at three levels and
four factors at two levels making the total number of required specimens equal
to 35 X 24 or 3888. Since this is an impractical number to test in a con
trolled experiment, a 1/4 replicate of a complete factorial was used, with
all of the factors at two levels. In addition, midpoint specimens were intro
duced for five of the factors in order to estimate nonlinear effects, and
duplicate specimens were used to obtain an estimate of the experimental error.
The experimental units were divided in the following manner:
1/4 (2)9 128 experimental units at two levels
44 experimental midpoint units
8 duplicate specimens
180 Total number of specimens
The fractional factorial is described by the statistical identity
I ABCDE DEFGH = ABCFGH
This design allows the analysis of all main effects, all two-factor inter
actions, and selected three and four-factor interactions. The treatment
19
TABLE l. FACTORS AND LEVELS SELECTED FOR THE EXPERIMENT
Factor Level Variable Type
Low Medium High
A. Molding water 3 5 7 Quantitative content, %
B. Curing time, 7 14 21 Quantitative days
C. Aggregate Fine Medium Coarse Qua 1i ta ti ve gradation
D. Type of curing Air Dried Sea led Qualitative
E. Aggrega te type Gravel Limestone Qua li ta ti ve
F. Curing 40 75 llO Quan ti ta ti ve temperature, of
G. Compactive Low High Qua li ta ti ve effort
H. Type of Impact Gyratory Qualitative compaction shear
J. Cement 4 6 8 Quantitative content, 'ro

20
combinations are tabulated in Appendix 2. The actual statistical design was
developed by Dr. Virgil Anderson, statistical consultant to the project.
The preparation of the specimen was divided into three basic stages:
(1) mixing, (2) compaction, and (3) curing. The procedures used for each
stage can be seen in Appendix 3. The order for mixing, compacting, and test
ing the specimens was completely randomized except that all specimens .cured
for a specified period were tested on the same day.
Since the total number of specimens was too large for mixing and com
pacting in one day, the experiment was divided into two series of 90 specimens
each. The first 90 specimens were mixed and compacted in one day and the
second 90, nine days later, in order to avoid interference with the testing
of the first series of specimens.
In the mixing phase four factors out of nine were introduced in the
experiment. The error mean squares introduced during the mixing process were
then related to these four factors. For the compaction phase two more factors
were added, possibly adding errors and interactions with the four factors
associated with the mixing phase. In the curing phase three more factors were
added and consequently the errors collected along the experiment are related
to all nine factors of the experimental process. All the main factors and
the two and three-factor interactions considered in the design of the experi
ment are summarized in Table 2.
The analysis of variance of each of the dependent variables determines
the significance and order of significance of all the main factors and inter
actions. Following the analysis of variance, a regression analysis was con
ducted in order to obtain a predictive equation for indirect tensile strength
for any combination of the factors included in this experiment.
SELECTION OF FACTORS
The factors and levels selected for this investigation and summarized in
Table 1 are discussed below.
Molding Water Content
The water content during mixing and compaction was selected on the basis
of the type of material, gradation, cement content, and the workability of
the specimens. Preliminary tests indicated that molding water contents of
3 and 7 percent were the limits for good compaction for the combination of
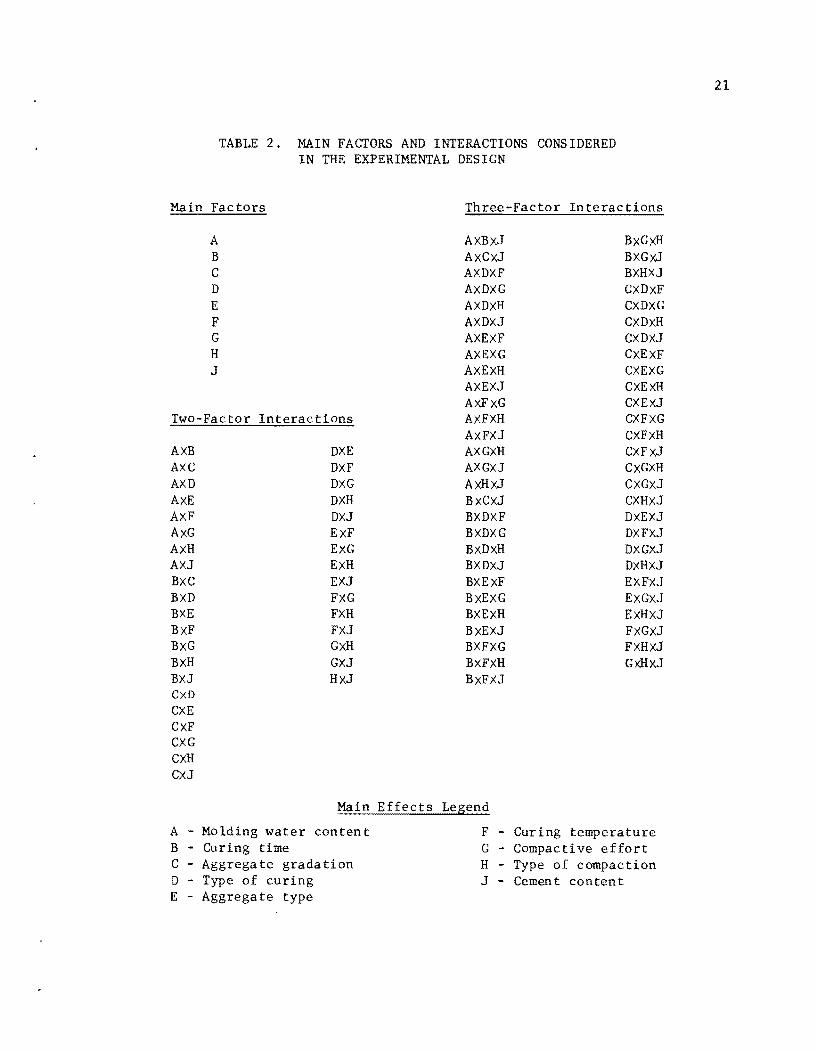
TABLE 2. MAIN FACTORS AND INTERACTIONS CONSIDERED IN THE EXPERIMENTAL DESIGN
Main Factors
A B C D E F G H J
Two-Factor Interactions
AXB DXE AXC DXF AXD DXG AXE DXH AXF DXJ AXG EXF AXH EXG AXJ EXH BXC EXJ BXD FXG BXE FXH BXF FXJ BXG GXH BXH GXJ BXJ HXJ CxD CXE CXF CXG CXH CXJ
Main
A - Molding water content B - Curing time C - Aggregate gradation D - Type of curing E - Aggregate type
Effects
Three-Factor Interactions
AxBxJ BXGXH AXCXJ BXGXJ AXDXF BXHXJ AxDXG CXDXF AXDxH CXDxG AXDXJ CXDXH AXEXF CXDXJ AXEXG CxEXF AXEXH CXEXG AXEXJ CxExH AXFXG CXEXJ AXFXH CXFXG AXFXJ CXFXH AXGXH CXFXJ AXGxJ CXGXH AXHxJ CXGXJ BxCxJ CXHXJ BXDXF DXEXJ BXDXG DXFxJ BxDXH DXGxJ BXDXJ DXHXJ BXEXF EXFXJ BXEXG EXGXJ BXEXH EXHXJ BXEXJ FXGXJ BXFXG FXHXJ BXFxH GxHxJ BXFXJ
Legend
F - Curing temperature G - Compactive effort H - Type of compaction J - Cement content
21

22
all the factors included in the experiment. Six percent was the optimum
water content for a mixture of crushed limestone having the medium level of
gradation and cement content. For a mixture of rounded gravel having a medium
level of gradation and cement content, the optimum water content was slightly
higher. The final choices were then 3, 5, and 7 percent, to designate the
low, medium, and high levels of water content. This equal spacing of the
levels also facilitated the statistical design of the experiment.
Curing Time
In selecting curing times an effort was made to encompass a period of
time which could be considered to be reasonable in actual construction prac
tice and at the same time to space the curing times far enough apart so that
the effect on the properties of the cement-treated materials could be detec
ted. The final choice of curing times was seven, fourteen, and twenty-one
days, with the extreme values equally spaced on either side of the medium
value.
Aggregate Type
The two types of aggregates chosen were crushed limestone and a rounded
gravel from Seguin, Texas, both of which are used in Texas for the construc
tion of subbases and have been used in a prior study (Refs 8 and 9) of asphalt
treated materials. The particle shape and surface texture of these two mate
rials are quite different. The gravel has a smooth, subrounded, and non
porous surface expected to develop less bond with the cement matrix than the
rough, angular, crushed limestone particles. In addition, the inherent
strengths of the two aggregates are different, with the gravel being stronger.
Figure 2 shows that in this study the bond between the gravel and the cement
matrix tended to fail before the aggregate particle, while in the case of the
limestone the aggregate failed before the bond.
Aggregate Gradation
Three different aggregate gradations were used. The gradations are
similar to Texas Highway Department Specifications (Ref 57): Type A for
coarse graded base course, Type B for fine graded base, and Type D for sur
face course materials. In addition, they fall within Winterkorn's classi
fication of soils for bituminous stabilization (Ref 58) and are the same as

Fig 2. Typical failures of crushed limestone and rounded gravel specimens.
23

24
those used in the evaluation of factors affecting the tensile properties of
asphalt-treated materials (Refs 8 and 9). The gradations selected are shown
in Appendix 1, along with the Texas Highway Department Specifications. The
grain size distribution curves for the three gradations selected are shown in
Fig 3.
Type of Curing
Two types of curing were selected: air dried and sealed. In the first,
the specimens were exposed to the air and allowed to dry from their original
moisture condition to that of an air-dried state. The other method of curing
consisted of sealing the specimens by wrapping them with a PVC film to main
tain the original moisture content throughout the curing period. It was
felt that these two methods of curing simulated extreme conditions in the
field. Air-dried curing was selected as the low level and sealed-curing as
the high level.
Curing Temperatures
Three curing temperatures were chosen which were considered to be repre
sentative of the range of temperatures actually occurring at different times o
in the year. The lowest level was set at 40 F, the medium level was set at
750
F, and the highest level was set at 1100
F.
Compactive Effort
Two different levels of compactive effort were used in this investigation.
These levels were designated as high and low and were established on the basis
of the resulting density for the two types of soils used in this study. This
approach resulted in extreme levels of compactive efforts although the result
ing densities were not radially different. The compaction procedures asso
ciated with the low and high levels for the impact and gyratory-shear compac
tors are summarized in Appendix 2.
Type of Compaction
Two different types of compaction, impact compaction and gyratory shear
compaction, were used in this experiment. These two types were chosen be
cause past experience showed that they give differences in the strength
properties of cement-treated materials and represent extremes with regard to

CI ,: II) II)
0 Q.
'E q,)
u .... q,) Q.
Screen Opening, in. .0029 .007 ,0165 .0331 ,0787 .187 .25 1.5
100 ,------------.-----------.---------,------------,-----------~--_.----._--_r~~~._,_--__, ,375 .50 .75 1.0
80
60
40
20
o 200 80 40 20 10 4
Screen Number
Fig 3. Grain size distribution curves.
I. '4 In.
:5. I, :5 • eln. 2 In. '4 In.

26
the effect produced on the soils and the shear strains imposed on the speci
men during compaction.
Originally, kneading compaction which produces a compactive action
similar to a sheep foot roller was also considered; however, it was not in
cluded in the design because the time consumed for the compaction of each
specimen was too long compared with the time required by either the gyratory
shear or the impact compactor. The compaction procedures are described in
Appendix 2.
Cement Content
The greatest use for cement-treated mixtures is in the construction of
base and subbase courses. For this reason the cement content used with the
various soils was in the range that would normally be used in pavement base
construction. The three different percentages of cement content selected for
the low, medium, and high level were 4, 6, and 8 percent, respectively.
The three levels are equally spaced and should give a relatively wide
variation in the tensile properties. According to established criteria for
cement-treated soils, the cement content for soils similar to those used in
this experiment varies from a minimum of 3 percent to a maximum of 9 percent
by weight of aggregate. This range encloses the three different levels of
cement selected for the experiment.
PARAMETERS EVALUATED
where
Indirect tensile strength was evaluated in this experiment.
(1) Indirect tensile strength is the tensile stress required to fail the specimens when a diametrical load is applied to the specimen. The relationship used to calculate its value is
ST = 0.58936 tD
P = max maximum load required to break the specimen in pounds;
D average diameter of the specimen, in inches;
t average height of the specimen, in inches.

27
Originally, consideration was given to the evaluation of four additional
parameters, which are defined below:
(2) Horizontal failure deformation - the horizontal deformation of the specimen at the maximum load applied, as recorded on the loadhorizontal-deformation plot.
(3) Vertical failure deformation - the vertical deformation of a specimen at the maximum load, recorded on the load-verticaldeformation plot and assumed to be equal to the movement of the upper platen from the point of initial load application to the point of maximum load as measured by the LVDT.
(4) Tangent modulus of vertical failure deformation - the slope per unit of thickness of the load-vertical-defonmation relationship prior to failure as defined by a regression analysis.
(5) Deflection ratio - the ratio between the slope per unit thickness of load-horizon tal-deformation plot and the slope per unit thickness of the load-vertical-defonmation plot.
The two deformation measurements, although recorded, were not evaluated;
validity of the load-deformation data was questioned because of the method
used to secure the loading strips to the platens and because of the small
magnitude of the horizontal deformations. Therefore, tangent modulus and
deflection ratio were not evaluated for this report either.
EXPERIMENTAL RESULTS
The indirect tensile strength is based upon a simple equation which
assumes no effect due to Poisson's ratio on the treated material. This
assumption is not strictly correct since a multiaxial state of stress actually
exists in the specimen. At the present time, however, there is no method
available for utilizing data from the test to estimate Poisson's ratio with
out the extensive use of strain gages. The cost and difficulty involved in
attaching strain gages to cement-treated specimens make this approach un
desirable (Ref 8); therefore, the effect of Poisson's ratio was neglected
although it is anticipated that future work will allow this effect to be
evaluated.
The maximum load needed for the tensile strength calculation was obtained
from the load versus vertical deformation plot. The test results obtained for
the tensile strength are summarized in Table 3.

28
TABLE 3. EXPERIMENTAL RESULTS
Indirect Indirect Tensile Tensile
Specimen No. Strength , psi Specimen No. Strength, psi
1 34.7 46 74.3 2 126.4 47 113.7 3 20.3 48 39.4 4 174.6 49 72 .2 5 14.3 50 225.4 6 248.9 51 272.5 7 123.3 52 243.3 8 140.5 53 25.3 9 212.0 54 238.0
10 257.2 55 91.6 11 174.6 56 242.6 12 90.5 57 103.1 13* 139.0 58 111.3 14 39.3 59 187.7 15 54.1 60 101. 9 16 50.0 61 84.9 17 268.9 62* 206.5 18 i ( 252.0 63 105.7 19 57.8 64 183.5 20 66.6 65 40.4 21 103.8 66~'( 190.5 22 237.9 67 137.6 23 290.7 68 60.4 24 197.5 69 99.6 25 366.5 70 32.3 26 260.2 71* 202.6 27 157.5 72 134.0 28 115.6 73 283.2 29 431.8 74 70.9 30~'" 129.3 75* 127.7 31 118.0 76 114.8 32 80.8 77 70.5 33 89.8 78 212.9 34 44.0 79 37.0 35 169.6 80* 145.4 36 74.2 81 102.1 37 41.6 82 139.8 38 68.0 83 221.7 39 364.1 84 57.0 40 57.7 85 162.4 41 86.4 86 131.1 42 27.0 87 45.2 43 316.0 88 169.4 44 41.1 89 251. 8 45 53.7 90 100.1
*Duplicate specimens. (Continued)

29
TABLE 3. (Continued)
Indirect Indirect Tensile Tensile
Specimen No. Strength, psi Specimen No. Strength , psi
91 375.2 136 102.8 92 196.8 137 122.6 93 117.1 138 113.4 94 47.1 139 106.9 95 41.4 140 147.2 96 44.8 141 48.0 97 175.8 142 77 .0 98 96.0 143 132.9 99 385.3 144 159.1
100 63.7 145-k 82.3 101 26.0 146 147.5 102 497.1 147 55.0 103 54.3 148 207.4 104 ,~ 70.9 149 113.9 105 259.2 150* 74.5 106 71.8 151 122.0 107 41.1 152 170.3 108 374.3 153 128.2 109 254.1 154 365.1 110 106.3 155", 93.5 111 245.6 156 197.8 112 54.7 157 104.5 11]>', 105.6 158 26.4 114 63.8 159 59.5 115'>', 98.1 160 74.7 116 108.5 161 192.3 117 98.0 162 37.0 118 283.3 163 123.0 119 62.0 164 13 .1 120 40.6 165 303.8 121 93.1 166 247.5 122", 136.8 167 291. 2 123 115.5 168 108.3 124 63.7 169 73.1 125 30.9 170 40.4 126 127.1 171 42.0 127 227.6 172 146.4 128 142.4 173 233.5 129 157.8 174 43.6 130 495.5 175 162.9 131 39.6 176'~ 92.4 132 88.0 177 280.2 133 50.3 178 252.8 134 125.9 179 68.0 135 180.3 180 22.4
')"Dup 1ica te specimens.

30
An analysis of variance was conducted with a computer program capable of
handling nine independent variables. According to the statistical design, the
analysis of variance was conducted for 128 specimens, which constitute one
fourth of the complete factorial and represent all the factors containing the
low and high levels, that is, nine factors, each at two levels. Midpoint
levels were not used in the analysis of variance.
The estimate of true error mean square was calculated using the data from
the duplicate specimens and was used to evaluate the significance level of
each of the main effects and interactions. This error term was calculated
using seven sets of duplicates instead of eight, because one of the duplicated
specimens (No. 66), was discarded due to an apparent error in weighing the
materials for the specimen. The sets of duplicates and the error term between
treatments treated alike are included in Appendix 4.
CHAPTER 4. DISCUSSION OF RESULTS
The principal objective of this study was to determine which factors
significantly affect the tensile strength of cement-treated materials. Those
factors or interactions found to significantly affect the tensile strength at
alpha levels of 0.01 and 0.05 are presented in Table 4. All other factors
and interactions were considered to have no significant effect. The residual
shown in the table is the pooled mean squares for those factors and interac
tions which were not significant. The error mean square term was calculated
from the duplicate specimens and represents an estimate of the true error.
The relationships of the highly significant main factors and their inter
actions for tensile strength are shown in Figs 4 through 13. The data points
in these figures are the average values of strength for all specimens contain
ing a given level or combination of levels for the main effect or interaction.
Midpoint means are not included in the figures nor in the analysis of variance
because the levels of the other factors are not the same as those for the high
and low levels, and because the number of observations on the midpoint means
is smaller, causing the variance to be larger. Hence, the midpoint means
cannot be compared to the endpoint means. Nonlinear effects as measured by
the midpoint levels will be discussed in conjunction with the regression
analysis.
STATISTICAL INFERENCE
In this experiment, as in any other, the conclusions drawn are applicable
only within the inference space of the population defined by the experiment
design, i.e., within the range of combinations of values of the variables
tested. No attempt should be made to apply the results outside of this parti
cular inference space. As previously mentioned, however, an attempt has been
made to evaluate nonlinear effects for five of the factors. This will be
discussed in terms of the regression analysis.
Since there were interactions which were found to significantly affect
the tensile strength, they must be considered in order to analyze the
31

32
TABLE 4. ANALYSIS OF VARIANCE FOR TENSILE STRENGTH
Source of Mean F Significance Variation Squares Value Level %
A 1 524,050 1480.0 1 D 1 142,607 404.0 1 J 1 127,391 361.0 1 E 1 108,056 306.0 1
AJ 1 57,196 162.0 1 AD 1 53,895 153.0 1 DE 1 34,340 97.3 1
G 1 29,248 82.9 1 EJ 1 23,795 67.4 1 AE 1 23,416 66.3 1 DJ 1 18,769 53.2 1
B 1 12,769 36.2 1 AC 1 II ,012 31.2 1
H 1 8,430 23.9 1 ADJ 1 7,357 20.8 1 AH 1 6,992 19.8 1 EF 1 6,139 17.4 1 AB 1 5,798 16.4 1 DEJ 1 5,342 15.1 1
AFHJ-BCGJ 1 4,399 12.5 1 BG 1 4,337 12.3 1 EG 1 4,223 12.0 5 AEJ 1 4,2l2 11. 9 5 BC 1 3,238 9.17 5
C 1 3,168 8.98 5 AEF 1 2,587 7.33 5
CDFJ 1 2,571 7.28 5
AEG 1 2,422 6.86 5 BDH 1 2,388 6.77 5 CEH 1 2,165 6.13 5 BEJ 1 2,128 6.03 5
BDFJ 1 2,077 5.88 5 BF 1 2,036 5.77 5
CH 1 2,013 5.70 5
BCJ 1 1,989 5.63 5
Residual 92 464 Within treatments
treated alike 7 353
Legend
A - Molding water content F - Curing temperature B - Curing time G - Compactive effort C - Aggregate gradation H - Type of compaction D - Type of curing J - Cement content E - Aggregate type

33
behavior associated with specific combinations of factors. It is not adequate
to consider the main effects alone, without evaluation of the interaction
effects; in this report interactions will be discussed first.
ANALYSIS OF VARIANCE
As shown in Table 4, 35 factors and their interactions were found to
significantly affect the tensile strength of cement-treated materials at a
probability level of 0.05 or greater with 21 of these at a probability level
0.01. Not all of these effects have practical significance, however; i.e.,
the effect may have been measurable and under the controlled conditions of
this test may have been significant, but the effect was not large and probably
would make little difference in application of the results by engineers.
Therefore, only those factors shown to be practically significant are discussed.
In this study, the significant effects were produced by two, three,
and four-factor interactions; and it is mandatory that the higher order
interaction effects be considered first, since any observed effect is the
result of interrelationships between the various main factors. Thus, main
effects can be referred to only in terms of the average effect since the
effect is dependent on the interactions existing for any combination of fac
tors. On this basis, significant higher order interactions will be discussed
first and main effects last.
Four-Factor Interactions
In the experiment design, no four-factor interactions were included for
evaluation. Nevertheless, three such interactions were found to significantly
affect the indirect tensile strength at a probability level of 0.05 with one
of these interaction effects being significant at 0.01. Unfortunately this
highly significant interaction was confounded with another four-factor inter
action.
The highly significant four-factor interaction involved the interaction
between molding water content, curing temperature, type of compaction, and
cement content and the interaction between curing time, aggregate gradation,
compactive effort, and cement content. Since these two interactions are con
founded, as shown in Table 4, there is some doubt as to which one produced
the significant effect. According to Daniel (Ref 55), when two interactions
are confounded, the interaction containing the greater number of significant

34
main effects probably is the more important. However, in this. case both four
factor interactions contain three highly significant main factors, and, thus,
it is impossible to attribute the significance solely to one of the two inter
actions. Nevertheless, its existence along with the other two interactions
which were signifciant at a probability level of 0.05 points out the complexity
and interrelationship of the factors affecting the properties of cement-treated
materials.
Three-Factor Interactions
A total of nine three-factor interactions was found to be significant at
a probability level of 0.05; however, only two of these interactions were
significant at a probability level of 0.01. These two highly significant
three-way interactions are graphically shown in Figs 4 and 5 and are dis
cussed in the following paragraphs.
Molding Water Content X Type of Curing X Cement Content (Interaction
AxDxJ - Fig 4). The tensile strength increased from the point of low cement
content and low molding water content to the point of high cement content and
high molding moisture content, and the strength increase was much greater for
the increased moisture content than for the increased cement content. Al
though the same basic trends were noted regardless of the type of curing, it
can be seen that the strength increases were much greater for specimens cured
by sealing rather than air drying.
Type of Curing X Aggregate Type X Cement Content (Interaction DxEXJ,
Fig 5). The interaction of these three factors indicates that the strengths
of both the limestone and the gravel specimens increased from the point of low
cement content with air-dried curing to the point of high cement content and
sealed curing. In addition, it appears that the effect produced by increasing
the cement content from 4 to 8 percent was essentially the same as the effect
produced by sealed curing rather than air-dried curing. Although the trends
for the strengths of both the limestone and gravel specimens were similar,
the strength increases were much greater for the limestone specimens.
Two-Factor Interactions
From a total of 36 analyzable two-factor interactions, 15 were signifi
cant at a level of 0.05 or greater, with 11 of these significant at a level

.J::. -go c til ...
400
300
(i) 200 ..!! ·iii c ~
100
... ..... .,..
....... , .. -
... ......
...
.. -........
... ....
• .-0-t .......................................... 0 ••••••••••••••••••••••• _ •• _ •••••••• _ •• _ ••••••••••••• __ •••••••• _--
...........
Seated } Type of Curing
Air-Dried
. ...... ..-
__ •• _ •••••••••••• _._ ••• : •• ::":. __ •••• _ •• 0 •••••• _ ••• _ ••• _ •••••• __ .0
....... ....
. ....
.... .... ' .
. ...
O~----------+·~/----------------------------~··-·------------4 8
Cement Content I 0/0
Fig 4. Effect of interaction between molding water content, type of curing, and cement content (interaction AXDXJ).

300
~200 a. c: • ~ -(/)
• 'is c: {!. _ 100 (,)
e :v E.
/ ... , ........... ·1·· .. · .... ·· .. · .. ···· .. ··· .... · ........ -...... _-......................... -.... --.. -
..... '. ........
/
.~."~ .. '
/" /,"
",,;0"" ••
. / .. /"
........ """ .. .....
............
. .... ::;.; 1 /' .~I ,~'l . .~. ~
;~;;~;t~~~-;?~:· .. · .. ·-.. ../:~~:~ .. ........ pri'
Limestone} Grovel
--.",. ....
Aggregate Type
.. .,. ...... .
O~--------~/_/·-··-----------------------~·~---.... -···-··-------
Fig 5.
4 8 Cement Content I 0/0
Effect of interaction between type of curing, aggregate type, and cement content (interaction DXEXJ).

of 0.01. These 11 highly significant two-factor interactions are discussed
below and are illustrated in Figs 6 through 16.
Molding Water Content X Cement Content (Interaction AxJ - Fig 6).
37
Tensile strength increased with the increased molding water content; however,
the increase was much greater for specimens containing the higher cement con
tent. Likewise, strength increased with increased cement content but the
increase was much greater for specimens compacted at the higher water con-
tent. Thus, it appears that the beneficial effect of additional cement is
limited unless there is an adequate supply of water for hydration of the cement.
Molding Water Content X Type of Curing (Interaction AxD - Fig 7). The
increase in the molding water content resulted in a greater increase in
strength for the specimens which were sealed during the curing period than
for the specimens cured by air drying. Such a phenomenon is logical since
increased water would be expected to increase the efficiency of the hydration
process. In the case of the sealed specimens this increased water was re
tained for hydration of the cement, while in the air-dried specimen it was
lost; and, thus, its benefit was not fully realized.
Type of Curing X Aggregate Type (Interaction DxE - Fig 8). It was found
that the strength increase, associated with changing the aggregate from gravel
to limestone, was much greater for the sealed specimens than for the air-dried
specimens, although the strengths were greater for the limestone specimens in
all cases. As previously noted, when the specimens were cured by sealing,
more water was available for hydration, resulting in an improved cement matrix.
Apparently the benefits of the improved matrix were more fully realized by the
limestone aggregate, which could develop a better cement-aggregate bond due to
its angularity and rough surface texture.
Aggregate Type X Cement Content (Interaction ExJ - Fig 9). The strength
increase associated with the increased cement content was greater for speci
mens containing limestone than for those containing gravel. It is felt that
this interaction effect illustrates once again that the limestone is able to
benefit more from a stronger matrix than the rounded gravel.
Molding Water Content X Aggregate Type (Interaction AXE - Fig 10). The
strength increase associated with the increase in water content was greater
for the limestone than for the gravel. As in the case of the interaction,

38
.~
Q.
~ -01 ~ Q) ... Ui
.!! ';; ~
~ -u ! is ..s
rn Q.
.t::. c;. c e -(/) .!! ';; c ~
-u Q)
:6 .E
300
250
200
150 -
100
50
*n = = CP Q)
,-- E e Q) CP U U
~ ~ ~ 0 0
0 q- «> q- CD I o 3 7
Molding Water Content. % by Weight
Fig 6. Effect of interaction between molding water content and cement content (interaction AXJ).
300
250
200
ISO
100
..--" 50UI Q)
o -g 0 " .!! : '- "6 ... 0
.- Q) Q)
<t (/l <t (/)
0 3 7
Molding Water Content. % by Weight
Fig 7. Effect of interaction between molding water content and type of curing (interaction AXD) .

300
III 250 Q.
.c 0. c 200 CD ...
en
.!! 150 'iii c ~
~ 100 ,!: "t! .s
50
0
300
'iii 250 Q.
:: co c 200 '" ... -Ul
.!? 'iii 150 c ~
-<.> 100 !!
'6 .s
50
o
~n ~~ 'c' i ,- !
0 "t! (5 ! "'CI II) ... c; , : i ...
~I « ... Ul Ul
Gravel Limestone
Aggregate Type
Fig 8. Effect of interaction between type of curing and aggregate type (interaction DXE) .
-
--r--
<II ! c 0 ~
I
-Q) III 1 III
> ... II)
0 e 2 E ... :.J C) C) ...J
4 8
Cement Content J % by Weight
Fig 9. Effect of interaction between aggregate type and cement content (interaction ExJ) .
39

40
<II a.
£ DI C II> ...
U>
.!! 'iii c ~
.. 0 II> ... '6 -=
en a.
~ 0
~
C. c ~
U>
.!! iii c ~
.. 0 II> ...
"C
-=
300
250
-
200
150 -
100
r---
50 CD II>
r-- C C 2 2
Q; en q; en > Q) > ~ c E c ...
:J ... :J (!) (!)
o 3 7
Molding Water Content. % by Weight
Fig 10. Effect of interaction between molding water content and aggregate type (interaction AxE) .
300
250
200 r-
150
- -100
r--
50 "C "C
.!! .!! ... "C ... "C C Q) C II>
... C ... 0 II> Q)
~ (f) ~ (f)
o 4 8
Cement Content. % by Weight
Fig 11, Effect of interaction between type of curing and cement content (interaction DXJ).

41
"Type of Curing X Aggrega te Type," (Fig 8), the limes tone benefi ted more than
the gravel from the improved matrix resulting from better hydration.
Type of Curing X Cement Content (Interaction DXJ - Fig 11). The average
strength increased with the increase in cement content in both specimens cured
by sealing and by air drying. However, the strength increase was much greater
for the sealed specimens than for the air-dried specimens. Thus, the benefit
of the increased cement content was more fully realized when the specimens were
cured under the more ideal curing conditions, as would be expected.
Molding Water Content X Aggregate Gradation (Interaction AXC - Fig 12).
It was found that a molding water content of 7 percent produced stronger
specimens than a 3 percent water content but that the increase in strength
was much greater for specimens containing a finely graded aggregate. In
addition, a change from finely graded aggregate to a coarse graded aggregate
produced a strength increase for specimens compacted at 3 percent water while
the reverse was true for specimens compacted at 7 percent water.
Molding Water Content X Type of Compaction (Interaction AxH - Fig 13).
As in the previous interaction the increased molding water content resulted
in higher strengths; however, the amount of this increase was dependent on
the type of compaction, with impact compacted specimens producing a greater
increase in strength than the gyratory shear specimens.
Curing Temperature X Aggregate Type (Interaction EXF - Fig 14). It
appears that the increased curing temperature from 400
F to 1100
F produced
higher tensile strengths for specimens containing gravel; however, there was
little effect on the strength of the limestone specimens.
Molding Water Content X Curing Time (Interaction AXB - Fig 15).
Increased water content at the time of molding resulted in stronger specimens.
Although specimens cured for 21 days seemed to have a larger strength gain
than specimens cured 7 days, examination of Fig 15 indicates that the differ
ence in the rate of increase associated with the two different curing times is
very small and of little practical significance.
Curing Time X Compactive Effort (Interaction BXG - Fig 16). Increased
curing time apparently had little effect on the strength of specimens com
pacted at a low compactive effort, while the average strength of specimens

42
300
250
VI Q.
= 200 r--0 c: II)
-= (/)
II)
II> c: II I-
U II)
,~ ~
..5
... Q.
-150
100 c: 0
c: ...
50
,~ 0 ~ ... 0 roo-- 0 ...
r-- ~ C) 0 ...
II) C) II) ... VI
0
II) ... II) ... c: 0 c: 0
iL: 0
iL: 0 0 0
3 7
Molding Water Content, % by Weight
Fig 12. Effect of interaction between molding water content and aggregate gradation (interaction AXe) •
300
250
,s; 200 roo--
0. c: II) ... in
CD
'iii c: II)
I-
... (,) II ... ~ c:
r--
150
100 ... 0 II) .c:
r-- ... ;--(/)
50 0 >-II) ...
U .c: - .2 (/) (,)
0 0 0 Q. ~ Q. ... .E >- .E >-
C) C)
0 3 7
Molding Water Content, % by Weight
Fig 13. Effect of interaction between molding water content and type of compaction (interaction AXH) •

III Q.
300
250
'&:'-200 -QI c: .. ... -II) ISO ~ 'iii c:
t! _ 100 (.l 'II ... :; .:
III Q.
50
o
300
250
.200 :5 go 'II ... iii ISO ~ 'iii c: t!!-ti 'II ... :; .:
100
50
o
r- ,....-
,....-
r-
'II 'II c: c: .. .e .. .e III III ,.. 'II ,.. ..
g E g E ... :.J
... :.J C> C>
40 110 Curing Temperature, 0 F
Fig 14. Effect of interaction between aggregate type and curing temperature (interaction EXF) .
,....-
,....-
r-r--
III III III IIJ ,.. ,.. ,.. ,.. 0 g g g
0 0 0 0
N I"- -l"- N
3 7
Molding Water Content, % by Weight
Fig 15. Effect of interaction between molding water content and curing time (interaction AxB).
43
44
300
UI 250 a.
~ -g' 200 Q) ... -(/)
.9! 150 "iii c: t!!
- 100 (.J CD "~ ." .E
50
0
-
--
.--
~ ~ • .c. 0 0> 0 0
...J J: ...J J: 7 21
Curing Time, Days
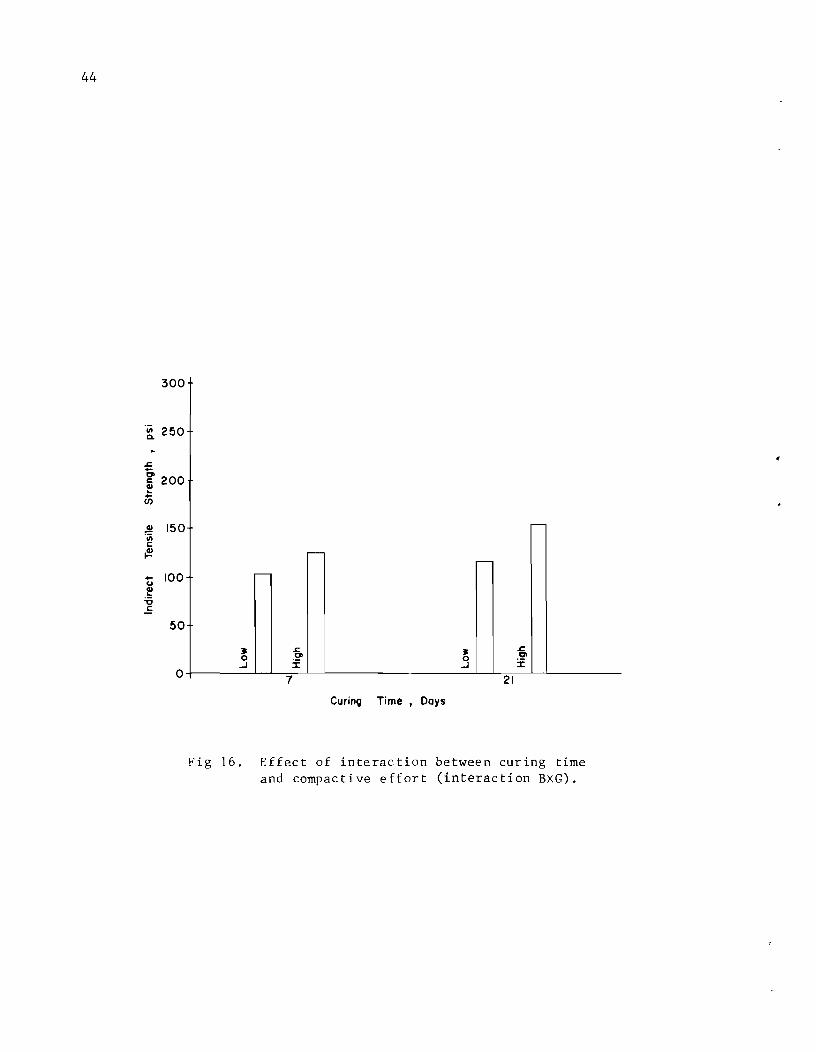
Fig 16. Effect of interaction between curing time and compactive effort (interaction BXG).
compacted at a high compactive effort was increased by increasing the curing
time from 7 to 21 days.
Main Effects
Seven of the nine main effects were found to be significant at a prob
ability level of 0.01. Figures 7 through 28 illustrate the effects produced
by these factors and show that the average indirect tensile strength was
significantly increased by
(1) increasing the molding water content from 3 to 7 percent (Factor A - Fig 17),
(2) sealed rather than air-dried curing (Factor D - Fig 18),
(3) increasing the cement content from 4 to 8 percent (Factor J -Fig 19),
(4) using crushed limestone rather than rounded gravel aggregates (Factor E - Fig 20),
(5) using a high compactive effort (Factor G - Fig 21),
(6) curing for 21 days rather than 7 days (Factor B - Fig 22), and
(7) using impact compaction rather than gyratory shear compaction (Factor H - Fig 23).
EVALUATION AND DISCUSSION
This experiment was designed to investigate, but not necessarily to
explain, the causes of the effects produced by all nine factors and their
interactions. Nevertheless, it is desirable and possible to postulate the
causes of the observed behavior and, in most cases, to advance logical ex
planations for future consideration.
45
In Table 4 (p 30), by comparing the relative values of the mean squares,
it can be seen that the water content during mixing and compaction was by far
the most important factor affecting strength. In addition to its highly sig
nificant main effect, it was also involved in six highly significant two
factor interaction effects, one three-factor interaction effect, and one
four-factor interaction effect. It would appear that these effects were
primarily concerned with the hydration process rather than compaction or mix
ing, since, in four of the six highly significant two-factor interactions
molding water content was associated with a factor concerned with hydration,
i.e., cement content, type of curing, aggregate type, and curing time. In
these interactions it can be reasoned that the interaction is the result of

46
300
250 'iii ~
s::. ... 200 co c: Q) ... (i)
!! 'iii
150 c: ~ ... u 100 Q)
:.5 ..5.
50
o 7
Molding Water Content, % by Weight
Fig 17. Effect of molding water content (Factor A).
300
250
200
-150
LOO
50
O~--------------~~------------------~~--------Air Dried Sealed
Fig 18. Effect of type of curing (Factor D).

300
'en 250 Q.
~ 01
i 200 ... en .!! 'en .---r::: 150 ~
ti CD ... 100 '6 r--.E
50
o+---------------~~---------------------L~----------
300
'iii Q. 250 .c 0. is ... en 200
.!! 'en r::: ~ 150
-..., ~ '6 100 .E
50
4 8
Cement Content. % by Weight
Fig 19. Effect of cement content (Factor J).
o+---------------~~---------------------L-L--------__ Gravel Limestone
Aggregate Type
Fig 20. Effect of aggregate type (Factor E).
47

48
300
250
"iii Q.
~ 200 co c: ~ -If)
.2! 150 -'iii c: ~
- 100 u '" :6 E
50
0 Low High
Compactive Effort
Fig 21. Effect of compactive effort (Factor G).
300
250
'iii Q.
~
~ 200
"& c: ~ iii 150 .2! 'in c: ~
100 +-u '" ... '6 E
50
0 7 21
Curing Time , Days
Fig 22. Effect of curing time (Factor B).

49
300
250 "iii a.
'& 200 c e -CJ)
Jl 'iii
150 c ~
- 100 u GI
j 50
0 Gyratory Shear Impact
Type of Compaction
Fig 23. Effect of type of compaction (Factor H).
50
improved hydration or the ability of the soil to benefit from improved hydra
tion. Thus, the strength gain for increased molding water contents was
greater for higher cement contents, was greater for sealed specimens in which
the water was retained for hydration, was greater for limestone than for gravel
since the rough surface texture of the limestone could develop a better bond
with the improved matrix, and was greater for the longer curing time which
allowed better hydration to occur. The other two highly significant two
factor interactions involved aggregate gradation and type of compaction. Both
had relatively low mean squares and were considered to be relatively unimpor
tant in comparison to most of the other highly significant effects involving
molding water content.
It may be noted that of the nine factors chosen for investigation, seven
were found to produce highly significant effects. The remaining two factors,
aggregate gradation and curing temperature, were judged to produce no effects
of practical significance although aggregate gradation indicated some signi
ficance at the probability level of 0.05. It is not surprising that curing
temperature did not produce a significant main effect since there was evidence
that water needed for hydration was removed from the specimens at the upper o
level of temperature (110 F). Thus, the beneficial effect of increased
curing temperature was offset by the loss of water associated with the increase
in temperature.
In general, any factor which could be expected to increase the strength
of the cement matrix or improve the bond between the cement matrix and soil
particles resulted in increased strengths.
REGRESSION ANALYSIS
A stepwise regression analysis was conducted in order to obtain a predic
tive equation for indirect tensile strength and to evaluate the quadratic
characteristics of the response surfaces (Ref 58). The high and low levels as
well as the applicable intermediate levels of all factors were used as input.
From the analysis a predictive equation was developed, allowing the indirect
tensile strength to be estimated within some standard error for the inference
space defined by this experiment.
The quadratic characteristics of the response surfaces were evaluated
using an F test. A partial F value for each variable considered in the

51
regression analysis was compared with the critical F value. If the critical
F value was smaller than the F value associated with any of the effects
being evaluated, i.e., quadratic, linear-quadratic, or quadratic-quadratic
terms, the term was considered to have a significant effect, which means that
the relationship between the dependent variable and the variable tested was
curvilinear. This test of significance was performed for the two dependent
variables.
where
Regression Equation
The regression equation obtained for the indirect tensile strength is
ST -110.85 - 2l.35E. + 20.68A.J. + 1.25A.E.J. 1 1 1 1 1 1
2 2 2 + 11.3lD.E. - 4.70A. - 1.63A.J. + 0.15A.D.J.
1 1 1 1 1 1 1 1
+ 2 0.30A.H. + 1.22A.C.
2 + 0.05B.G.
1 1 1 1 1 1
ST predicted value of indirect tensile strength, in psi;
A B D E, G, H, J = factors considered for prediction;
i = level of the factor (see Table 5 for levels used in this analysis).
The multiple correlation coefficient for the tensile strength predictive
equation is R = 0.95 and the standard error of estimate is equal to ±32.02.
This is not considered critical since the lack of fit error of this regression
is significant at ~ = 0.10. The equation was obtained utilizing a stepwise
regression computer routine with the capability of handling up to ten factors.
Although many main effects do not appear significant in this regression equa
tion, it must be noted that these factors cannot be ignored in the application
of the regression. The equation is only valid within the factor space
studied, which is a function of all factors and levels involved. Any attempt
to extrapolate beyond the factor space with the regression equation is a vio
lation of the statistical principles and is incorrect.

52
TABLE 5. LEVELS OF FACTORS USED IN REGRESSION EQUATIONS
Factor Descrip tion Level --3 AO = 3
A. Molding water content, % 5 Al =: 5 7 A2 = 7
7 BO = 7 B. Curi ng time, days 14 Bl 14
21 B2 = 21
Coarse Co = 0 C. Aggregate gradation Medium Cl = 1
Fine C2 = 2
Air dried DO 0 D. Type of curing Sealed D2 2
Rounded gravel EO = 0 E. Type of aggregate Crushed limestone E2 =: 2
40 FO 40 F. Curing temperature, of 75 Fl 75
110 F2 = 110
Low GO 0 G. Compactive effort High G2
=: 2
Impact HO = 2 H. Type of compaction Gyratory shear HZ = 0
4 JO = 4
J. Cement content, % 6 J l 6 8 J 2 = 8
53
Furthermore, it may be noted that the factors and interactions included
in the predictive equation are not identical to those shown to be highly
significant by the analysis of variance. This is partially due to the fact
that an additional level for each factor was included in the regression
analysis; thus, the data for the two analyses were not the same. A second
cause is that the predictive equation is concerned only with those variables
which provide the best estimate of the dependent variable. Hence, if two
independent variables are highly correlated, it is possible that the regression
analysis may include only one of them.
Nonlinear Effects
The above regression equation can, to a certain extent, be used to
evaluate the nonlinear effects for the five factors that contain a midpoint
level. A factor which appears in the equation in terms of a squared term can
be judged to produce a nonlinear effect. Thus, it appears that molding water
content (Factor A), curing time (Factor B), and cement content (Factor J)
produce curvature of the response surface of indirect tensile strength.

!!!!!!!!!!!!!!!!!!!"#$%!&'()!*)&+',)%!'-!$-.)-.$/-'++0!1+'-2!&'()!$-!.#)!/*$($-'+3!
44!5"6!7$1*'*0!8$($.$9'.$/-!")':!

CHAPTER 5. CONCLUSIONS, RECOMMENDATIONS, AND APPLICATIONS
CONCLUSIONS
This report describes a screening experiment performed to evaluate the
effects of nine factors and their interactions on the tensile strengths of
cement-treated materials. Conclusions are limited to the range of variables
studied in the experiment. The application of a fractional factorial is
questionable if complex interactions are present; therefore, further work
will be needed. This study, however, gives a great deal of information about
the complexity of the interactions of factors involved in cement-treated
materials.
Seven of the nine factors evaluated in this study produced significant
main effects on the indirect tensile strength at a probability level of 0.01.
From the data it was found that the average strength was significantly in
creased by
(1) increasing the molding water content from 3 to 7 percent,
(2) using sealed rather than air-dried curing,
(3) increasing the cement content from 4 to 8 percent,
(4) using crushed limestone rather than rounded gravel aggregates,
(5) using a high compactive effort,
(6) curing for 21 days rather than 7 days, and
(7) using impact compaction rather than gyratory shear compaction.
Eleven of the 36 two-factor interactions evaluated produced significant
effects on the indirect tensile strength at a probability level of 0.01.
These interactions were
(1) molding water content X cement content,
(2 ) molding water content X type of curing,
(3 ) type of curing X aggregate type,
(4) type of aggregate X cement con tent,
(5) molding water content X aggregate type,
(6 ) type of curing X cement content,
55

56
(7) molding water content X aggregate gradation,
(8) molding water content X type of compaction,
(9) curing temperature X aggregate type,
(10) molding water content X curing time, and
(11) curing time X compactive effort.
Two three-factor and one four-factor interactions were found to be sig
nificant at a probability level of 0.01. The four-factor interaction was con
founded with another four-factor interaction and therefore could not be
evaluated. The three-factor interactions were
(1) molding water content X type of curing X cement content and
(2) type of curing X aggregate type X cement content.
In addition to the highly significant effects summarized above, one main
effect, four two-factor interaction effects, seven three-factor interaction
effects and two four-factor interaction effects were found to be significant
at a probability level of 0.05.
Curing temperature was the only factor which did not produce a signifi
cant main effect at a level of 0.05. This should not be interpreted to mean
that curing temperature was not important since there was evidence that
moisture needed for hydration was driven from the specimens cured at 1100
F.
Thus, the benefits of increased temperature may have been offset by the loss
of moisture.
Molding water content was the most important factor affecting the
strength of the cement-treated materials since it was a highly significant
main effect and was involved in six of the eleven highly significant two-factor
interaction effects.
In general, any factor which could be expected to increase the strength
of the cement matrix or improve the bond between the cement matrix and soil
particles resulted in increased strengths.
The large number of interactions significant at a probability level of
0.01 indicates the complexity of the relationships between tensile strength
and the factors involved.
In evaluating the effects produced by various factors, it is not adequate
to infer only from main effects; rather one must consider the interactions
between the factors involved in order to predict tensile strength.

Significant nonlinear effects were produced by molding water content,
cement content, and curing time.
RECOMMENDATIONS
Based on this study as well as other portions of the investigation
directed toward ultimately developing an adequate design procedure for
stabilized subbases, it is recommended that:
57
(1) A method be developed to relate the elastic properties of cementtreated materials to the applied loads and the resulting deformations of the specimen being tested by indirect tension; information on the elastic properties is necessary to the development of a design procedure and should be evaluated in terms of the effects produced by the various factors which may influence the tensile characteristics of the material.
(2) A detailed investigation be conducted for those factors found to significantly influence the tensile strength of cement-treated materials. The design should allow a more complete evaluation of the interaction effects and should contain additional levels for the quantitative variables in order to more closely define the response surface and to develop adequate predictive regression equations.
(3) An evaluation be made to determine the factors which significantly affect the tensile characteristics of cement-treated materials subjected to repeated indirect tensile stresses and at the same time to determine the nature of these effects.
Applications
The research work summarized was not performed for direct application to
the field. It is one part of a comprehensive effort to develop better design
procedures for stabilized materials for use in pavement design and analysis.
Nevertheless, the results are helpful to practicing engineers in pointing out
the complexities involved in the evaluation and design of cement-treated
materials and provide a better understanding of tensile strength and the range
of strengths which can be expected from cement-treated materials.
The ultimate application of the results will be in a comprehensive
design method for stabilized materials.

!!!!!!!!!!!!!!!!!!!"#$%!&'()!*)&+',)%!'-!$-.)-.$/-'++0!1+'-2!&'()!$-!.#)!/*$($-'+3!
44!5"6!7$1*'*0!8$($.$9'.$/-!")':!

REFERENCES
1. Kawala, E. J., "Cement-Treated Subbases for Concrete Pavements," Technical Bulletin 235, American Road Builders Association, 1958.
2. Mills, W. H., Jr., "Road Base Stabilization with Portland Cement," Engineering News-Record, Vol 112, No. 22, November 1935.
3. Mills, W. H., Jr., '~tabilizing Soils with Portland Cement, Experiments by South Carolina Highway Department," Proceedings, Sixteenth Annual Meeting of the Highway Research Board, 1936.
4. Catton, Miles, "Early Soil Cement Research and Development," Development Department Bulletin, D42, Portland Cement Association, 1959 (Reprint from Journal of the Highway Division, Proceedings of the American Society for Testing Materials, 1959).
5. Johnson, A. W., "Cement-Treated Soil Mixtures," Highway Engineering Handbook, 1960.
6. Hudson, W. Ronald, and Thomas W. Kennedy, "An Indirect Tensile Test for Stabilized Materials," Research Report No. 98-1, Center for Highway Research, The University of Texas at Austin, January 1968.
7. Kennedy, Thomas W., and W. Ronald Hudson, "Application of the Indirect Tensile Test to Stabilized Materials," Highway Research Record No. 235, Highway Research Board, January 1968.
8. Hadley, William 0., W. Ronald Hudson, and Thomas W. Kennedy, "An Evaluation of Factors Affecting the Tensile Properties of Asphalt-Treated Materials," Research Report No. 98-2, Center for Highway Research, The University of Texas at Austin, August 1968.
9. Hadley, William 0., et aI, "A Statistical Experiment to Evaluate Tensile Properties of Asphalt-Treated Materials," a paper presented at the Annual Meeting of the Association of Asphalt Paving Technologists, January 1969.
10. Burmister, D. M., "Evaluation of Pavements Systems of the WASHO Road Test by Layered System Methods," Bulletin 177, Highway Research Board, 1958.
11. Burmister, D. M., "Stress and Displacement Characteristic of a TwoLayered Rigid Base Soil System: Influence Diagrams and Practical Applications," Proceedings, Thirty-sixth Annual Meeting of the Highway Research Board, 1956.
59

60
12. Davidson, D. T •• "Soil Stabilization with Portland Cement, II Bulletin 292, Highway Research Board, 1961.
13. "Procedures for Testing Soils," American Society for Testing Materials, April 1958.
14. Soil Cement Laboratory Handbook, Portland Cement Association, 1966.
15. Soil Cement Construction Handbook, Portland Cement Association, 1966.
16. Winterkorn, Hans, and W. Aichhorn, 'Tundamentals of Soil Stabilization on Street and Road Construction," Road Research Center of the Austrian Society of Engineers, Vienna, 1960.
17. Za-Chieh Moh, "Reaction of Soil Mineral with Cement and Chemicals," Highway Research Record No. 86, Highway Research Board, 1965.
18. Herzog, A., and J. K. Mitchell, "Reactions Accompanying Stabilization of Clays with Portland Cement," Highway Research Record No. 36, Highway Research Board, 1963.
19. Handy, R. L., "Cementation of Soil Minerals with Portland Cement or Alka lis," Bulletin 198, Highway Research Board, 1958.
20. Mills, W. H., "Report of Subcommittee on use of Portland Cement in Soil Stabilization, Condition Survey of Soil-Cement Roads," Proceedings, Twentieth Annual Meeting of the Highway Research Board, 1940.
21. Felt, E. J., 'Tactors Influencing Physical Properties of Soil-Cement Mixtures," Bulletin 108, Highway Research Board, 1955, Development Department Bulletin, D16, Portland Cement Association, Research and Development Laboratories.
22. Davidson, D. T., et aI, 'Moisture-Density, Moisture-Strength, and Compaction Characteristics of Cement-Treated Soil Mixtures," Bulletin 353, Highway Research Board, 1962.
23. Martin, Iury, "Effect of Water Content on the Compressive Strength and Density of Various Aggregate-Cement Mixtures for Highway CementTreated Bases," Bulletin 251, Washington State University, Pullman, 1960.
24. Abrams, "Laboratory and Field Test of Granular Soil-Cement Mixture for Base Course," Development Department Bulletin, 037, Portland Cement Association, Research and Development Laboratories, 1959, (Reprint from American Society for Testing Materials, Special Technical Publication, No. 254),
25. Nussbaum, P. J., and T. J. Larsen, "Load-Deflection Characteristics of Soil-Cement Pavements," Highway Research Record No. 86, Highway Research Board, 1965.

26. Clare, K. E., and P. T. Sherwood, "The Effect of Organic Matter on the Setting of Soil-Cement Mixtures," Journal of Applied Chemistry, Vol 4, London, November 1954.
61
27. Norling, L. T., and R. G. Packard, "Expanded Shortcut Test Method for Determining Cement Factors for Sandy Soils," Bulletin 198, Highway Research Board, 1958.
28. Winterkorn, Hans, "Surface Chemical Factors Influencing the Stabilization of Soils with Cement," Proceedings, Twenty- second Annua 1 Meet ing of the Highway Research Board, 1942.
29. Catton, M. D., "Research on the Physical Relations of Soil and SoilCement," Proceedings, Twentieth Annual Meeting of the Highway Research Board, 1940.
30. Circeo, L. J., D. T. Davidson, and H. T. Davis, '~trength Maturity Relations of Soil-Cement Mixtures," Bulletin 353, Highway Research Board, 1962.
31. Clare, K. E., and A. E. Pollard, "Effect of Temperature on Soil-Cement," Geotechnigue, Vol 4, 1959.
32. Dumbleton, M. J., and N. F. Ross, "Effect of Temperature in the Gain of, Strength of Soils Stabi lized with Hydra ted Lime and Port land Cement," Research Note RN/3655, B.S. 438, Road Research Lab, Great Britain, January 1960.
33. El-Rawi, N. M., "Strength Characteristics of Soil-Cement Mixtures," unpublished Ph.D. Dissertation, Oklahoma State University, 1967.
34. El-Rawi, N. M., T. Allan Haliburton, and Robert L. Janes, "Effect of Compaction Method on Strength Parameters of Soil-Cement Mixtures," Highway Research Record No. 255, Highway Research Board, 1967.
35. Baker, C. N., "Strength of Soil-Cement as a Function of Mixing," Bulletin 98, Highway Research Board, 1954.
36. Davidson, D. T., and B. W. Bruns, "Comparison of Type I and Type III Portland Cements for Soil Stabilization," Bulletin 267, Highway Research Board, 1960.
37. Nussbaum, P. J., and T. J. Larsen, "Fatigue of Soil-Cement," Journal, Vol 9, No.2, Portland Cement Association, Research and Development Laboratories, May 1967.
38. Kayyal, Kassim M., "Strength Characteristics of Soils Compacted by Four Methods," unpublished Ph. D. Dissertation, The University of Texas, January 1965.
39. Johnson, A. W., and J. R. Sallberg, "Factors Influencing Compacting Test Results," Bulletin 319, Highway Research Board, 1962.

62
40. Davidson, D. T., and R. L. Handy, "Cement Requirements of Selected Soil Series in Iowa," Bulletin 267, Highway Research Board, 1960.
41. Catton, M., and E. J. Felt, 'Weight in Water Methods of Determining the Moisture Content of Soil-Cement Mixtures in the Field," Proceedings, Twenty-third Annual Meeting of the Highway Research Board, 1943.
42. Road Research Laboratory, "Soil Mechanics for Road Engineers," Department of Scientific and Industrial Research, H. M. Stationary Office, London, 1952.
43. Watson, John D., "The Unconfined Compressive Strength of Soil-Cement Mixtures," Proceedings, Twenty-first Annual Meeting of the Highway Research Board, 1941.
44. Mitchell, J. K., and D. R. Freitag, "A Review and Evaluation of SoilCement Pavements," Journal of the Soil-Mechanics and Foundation
Vol 85, Part I, Proceedings of the American Society of Civil Engineers, December 1959.
45. Le Clerc, R. V., and Sandahl, H. E., '~ Rapid Field Method for Determining Cement Content of Plastic Cement-Treated Base," Bulletin 267, Highway Research Board, 1960.
46. McLaren, D., B. Broad, and G. Wert, "Cement Stabilization of Granular Road Base Materials," Research Note RN/3665, Road Research Lab, Great Britain, January 1960.
47. "Prevention of Moisture Loss in Soil Cement with Bituminous Materials," Research Report 8F, Highway Research Board, September 1949, p 34.
48. Maner, A. W., "Curing Soil-Cement Bases," Proceedings, Thirty-first Annual Meeting of the Highway Research Board, 1952.
49. Leadabrand, J. A., "Some Engineering Aspects of Soil-Cement Mixtures," Mid-South Section Meeting, American Society of Civil Engineers, April 1956.
50. Texas Highway Department, Manual of Testing Procedures, Vol I, Materials and Test Division, Test Method Tex-113-E, Revised Edition, 1966.
51. Texas Highway Department, Manual of Testing Procedures, Vol I, Materials and Test Division, Test Method Tex-206-F, Revised Edition, 1966.
52. Seed, H. B., and C. K. Chan, '~tructure and Strength Characteristics of Compacted Clay," Journal of the Soil Mechanics and Foundation Division, Vol 85, No. SM5, Proceedings of the American Society of Civil Engineers, 1959.
53. Mitchell, J. K., and Chen-Kong Shen, '~ehavior of Soil-Cement in Repeated Compression and Flexure," Institute of Transportation and Traffic Engineering, University of California, Berkeley, 1966.

63
54. astle, Bernard, Statistics in Research, The Iowa State University Press, Ames, Iowa.
55. Anderson, Virgil L., "Design and Optimum Techniques for Consulting Statisticians and Experimenters," unpublished notes, Purdue University, p 148.
56. Daniel, Cuthbert, "Sequences of Fractional Replicates," American Statistical Association Journal, Vol 57, June 1962, p 408.
57. "Standard Specifications for Road and Bridge Construction," Texas Highway Department, 1962.
58. Winterkorn, H. F., "Granu1ometric and Volumetric Factors in Bituminous Soil Stabilization," Proceedings, Thirty-sixth Annual Meeting of the Highway Research Board, 1957.
59. Draper, N. R., and H. Smith, Applied Regression Analysis, John Wiley and Sons, Inc., New York, 1966.

!!!!!!!!!!!!!!!!!!!"#$%!&'()!*)&+',)%!'-!$-.)-.$/-'++0!1+'-2!&'()!$-!.#)!/*$($-'+3!
44!5"6!7$1*'*0!8$($.$9'.$/-!")':!

APPENDICES

!!!!!!!!!!!!!!!!!!!"#$%!&'()!*)&+',)%!'-!$-.)-.$/-'++0!1+'-2!&'()!$-!.#)!/*$($-'+3!
44!5"6!7$1*'*0!8$($.$9'.$/-!")':!

APPENDIX 1
TYPES OF GRADATIONS USED IN THIS EXPERIMENT

!!!!!!!!!!!!!!!!!!!"#$%!&'()!*)&+',)%!'-!$-.)-.$/-'++0!1+'-2!&'()!$-!.#)!/*$($-'+3!
44!5"6!7$1*'*0!8$($.$9'.$/-!")':!

APPENDIX 1. TYPES OF GRADATIONS USED IN THE EXPERIMENT
Sieve Size
Passing 2 inch
Passing 1-3/4 inch
Passing 1-3/4 inch Retained 7/8 inch
Passing 7/8 inch Retained 3/8 inch
Passing 3/8 inch Retained No. 4
Passing No.4 Retained No. 10
Total Retained on No. 10
Passing No. 10 Retained No. 40
Passing No. 40 Retained No. 80
Passing No. 80 Retained No. 200
Passing No. 200
~~Reference 57.
COARSE GRADATION - Type A
Texas Highway Department Specifications,* Percent by Weight
100
95-100
15-40
15-40
10-25
5-20
65-80
0-20
3-15
2-15
0-8
69
Gradation Used, Percent by Weight
100
100
o
26
21
15
62
15
5
8
10
(continued)

70
Sieve Size
Passing 1 inch
Passing 7/S inch
Passing 7/S inch Retained 3/S inch
Passing 3/S inch Retained No. 4
Passing No. 4 Retained No. 10
Total Retained No. 10
Pass ing No. 10 Retained No. 40
Passing No. 40 Retained No. SO
Passing No. 80 Retained No. 200
Passing No. 200
okReference 57.
APPENDIX 1. (Continued)
MEDIUM GRADATION - Type B
Texas Highway Department Specifications ,* Percent by Weight
100
95-100
20-50
10-40
5-25
60-75
0-30
4-20
3-20
0-8
Gradation Used, Percent by Weight
100
100
20
18
13
51
22
7
10
10
(continued)

Sieve Size
Passing 1/2 inch
Passing 3/8 inch
Passing 3/8 inch Retained No. 4
Passing No. 4 Retained No. 10
Total Retained No. 10
Passing No. 10 Retained No. 40
Passing No. 40 Retained No. 80
Passing No. 80 Retained No. 200
Passing No. 200
*Reference 57.
APPENDIX 1. (Continued)
FINE GRADATION - Type C
Texas Highway Department Specifications,* Percent by Weight
100
95-100
20-50
10-30
60-75
0-30
4-25
3-25
0-8
71
Gradation Used, Percent by Weight
98
95
20
15
40
30
10
10
10

!!!!!!!!!!!!!!!!!!!"#$%!&'()!*)&+',)%!'-!$-.)-.$/-'++0!1+'-2!&'()!$-!.#)!/*$($-'+3!
44!5"6!7$1*'*0!8$($.$9'.$/-!")':!

APPENDIX 2
TREATMENT COMBINATIONS

!!!!!!!!!!!!!!!!!!!"#$%!&'()!*)&+',)%!'-!$-.)-.$/-'++0!1+'-2!&'()!$-!.#)!/*$($-'+3!
44!5"6!7$1*'*0!8$($.$9'.$/-!")':!

Specimen Number
1
2
3
4
5
6
7
8
9
10
11
12
13
14
15
16
17
18
19
20
21
22
23
24
25
26
Test Order
91
36
1
92
93
94
2
37
3
95
96
97
38
98
99
4
39
40
5
100
6
101
102
103
104
7
APPENDIX 2. TREATMENT COMBINATIONS
A
-1
o -1
+1
-1
o -1
o +1
+1
+1
+1
o -1
-1
+1
o o
-1
-1
+1
+1
+1
-1
+1
o
B
+1
o -1
+1
+1
+1
-1
o -1
+1
+1
+1
o +1
+1
-1
o o
-1
+1
-1
+1
+1
+1
+1
-1
C
-1
-1
-1
-1
-1
o -1
o -1
-1
+1
+1
o -1
+1
+1
+1
o -1
-1
-1
+1
-1
+1
-1
o
75
Level of Factor1
D
+1
-1
-1
-1
-1
+1
+1
-1
-1
+1
-1
+1
-1
+1
+1
-1
+1
+1
+1
-1
-1
+1
+1
+1
+1
+1
E
-1
-1
-1
-1
+1
+1
+1
-1
+1
+1
+1
-1
-1
-1
+1
-1
+1
+1
+1
+1
+1
-1
+1
+1
+1
+1
F
-1
o -1
-1
-1
o +1
o +1
-1
-1
-1
o +1
-1
-1
o o
-1
+1
-1
-1
+1
-1
+1
o
G
-1
-1
-1
-1
-1
+1
-1
-1
+1
+1
-1
-1
-1
-1
-1
+1
+1
+1
-1
+1
-1
+1
+1
+1
-1
+1
H
+1
-1
-1
-1
+1
+1
+1
-1
+1
+1
+1
+1
-1
-1
-1
+1
+1
+1
-1
+1
+1
-1
-1
+1
+1
+1
J
+1
o -1
+1
-1
o +1
+1
+1
-1
+1
-1
o +1
-1
-1
o o
-1
+1
-1
+1
-1
+1
+1
o
(continued)

76
Spec imen Number
27
28
29
30*
31
32
33
34
35
36
37
38
39
40
41
42
43
44
45
46
47
48
49
50
51
52
53
54
55
56
Test Order
105
8
106
41
9
107
108
109
10
11
12
13
14
15
110
16
42
43
17
18
44
19
20
45
46
47
111
112
113
21
A
-1
+1
+1
o +1
-1
o -1
+1
-1
-1
-1
+1
-1
-1
-1
+1
-1
-1
o o
-1
+1
o o o
-1
+1
+1
+1
APPENDIX 2. (Continued)
B
+1
-1
+1
o -1
+1
+1
+1
-1
-1
-1
-1
-1
-1
+1
-1
o o
-1
-1
o -1
-1
o o o
+1
+1
+1
-1
C
+1
+1
-1
o +1
+1
o -1
+1
-1
+1
+1
+1
+1
-1
+1
o o
+1
o o
+1
+1
o o
-1
-1
+1
+1
+1
Level of Factor1
D
+1
-1
+1
-1
-1
+1
-1
+1
+1
+1
-1
-1
+1
-1
-1
+1
+1
-1
+1
-1
-1
+1
-1
+1
+1
+1
-1
+1
-1
+1
E
+1
-1
+1
-1
-1
+1
-1
-1
+1
+1
+1
+1
+1
+1
+1
-1
+1
-1
-1
-1
-1
-1
-1
+1
+1
+1
+1
-1
+1
+1
F
+1
+1
-1
o -1
+1
o +1
-1
-1
+1
-1
-1
+1
-1
-1
o o
+1
o +1
-1
+1
o +1
o +1
+1
+1
+1
G
+1
-1
-1
-1
-1
-1
-1
+1
-1
+1
+1
-1
+1
-1
+1
-1
+1
-1
-1
-1
-1
+1
+1
+1
+1
+1
-1
+1
+1
+1
H
-1
+1
-1
-1
-1
+1
-1
+1
-1
+1
+1
+1
+1
-1
-1
+1
+1
-1
-1
-1
-1
-1
-1
+1
+1
+1
-1
+1
+1
-1
J
+1
+1
+1
o +1
-1
o -1
-1
-1
-1
+1
+1
+1
+1
-1
o o
-1
o o
+1
-1
+1
o o
-1
+1
-1
-1
(continued)

Specimen Number
57
58
59
60
61
62*
63
64
65
66
67
68
69
70
71"':
72
73
74
75
76
77
78
79
80"':
81
82
83
84
85
86
Test Order
114
48
49
22
23
50
51
115
24
116
52
25
26
117
118
119
27
120
28
29
30
53
121
31
54
32
33
122
123
34
APPENDIX 2. (Continued)
A
+1
o o
+1
-1
o o
+1
-1
+1
o -1
-1
-1
+1
+1
+1
-1
+1
+1
-1
o -1
+1
-1
+1
+1
-1
+1
+1
B
+1
o o
-1
-1
o o
+1
-1
+1
o -1
-1
+1
+1
+1
-1
+1
-1
-1
-1
o +1
-1
o -1
-1
+1
+1
-1
C
-1
o o
-1
+1
o o
+1
-1
+1
+1
+1
-1
+1
+1
-1
-1
+1
-1
+1
-1
o +1
-1
o -1
-1
-1
+1
-1
Level of Factor1
D
-1
-1
+1
-1
+1
+1
-1
+1
-1
-1
-1
-1
+1
-1
-1
-1
+1
-1
+1
+1
-1
+1
-1
+1
+1
+1
-1
+1
-1
+1
E
-1
-1
+1
+1
-1
+1
-1
-1
-1
+1
-1
+1
+1
-1
+1
-1
-1
-1
-1
+1
-1
+1
-1
-1
+1
-1
+1
-1
+1
-1
F
+1
o o
+1
+1
o -1
+1
+1
+1
o -1
+1
+1
+1
-1
+1
+1
+1
+1
+1
-1
-1
+1
o -1
-1
-1
-1
-1
G
-1
-1
+1
-1
+1
+1
-1
-1
-1
-1
-1
+1
+1
-1
-1
+1
-1
+1
+1
-1
+1
+1
-1
+1
+1
-1
+1
+1
+1
+1
H
+1
-1
+1
-1
+1
+1
-1
-1
+1
-1
-1
-1
-1
+1
-1
+1
-1
-1
+1
+1
-1
+1
-1
+1
+1
+1
-1
-1
-1
-1
77
J
-1
-1
-1
-1
+1
o o
-1
-1
+1
o -1
-1
+1
+1
+1
+1
+1
-1
-1
+1
o +1
-1
o +1
+1
-1
-1
-1
(cont inued)

78
Specimen Number
87
88
89
90
91
92
93
94
95
96
97
98
99
100
101
102
103
104
105
106
107
108
109
110
111
112
113
114
115
Test Order
35
55
124
125
126
56
145
57
58
146
147
148
59
60
61
149
150
151
127
62
152
63
64
153
128
154
65
66
129
APPENDIX 2. (Continued)
A
-1
+1
+1
-1
+1
+1
+1
-1
-1
-1
+1
+1
+1
+1
-1
+1
-1
-1
o -1
-1
+1
o -1
o -1
-1
+1
o
B C
-1 -1
o 0
+1 -1
+1 +1
o 0
-1 +1
+1 +1
-1 +1
-1 +1
+1 -1
+1 -1
+1 +1
-1 +1
-1 +1
-1 +1
+1 -1
+1 +1
+1 +1
o 0
-1 +1
+1 +1
-1 +1
-1 0
+1 +1
o 0
+1 +1
-1 -1
-1 +1
o 0
Level of Factor1
D
-1
-1
-1
-1
+1
+1
+1
-1
-1
-1
+1
-1
+1
-1
+1
+1
-1
+1
+1
+1
-1
+1
+1
+1
+1
-1
+1
-1
-1
E
-1
-1
-1
-1
+1
+1
-1
+1
+1
+1
+1
+1
+1
-1
-1
+1
-1
+1
+1
-1
-1
+1
+1
+1
+1
-1
+1
-1
-1
F
-1
o +1
-1
o -1
-1
+1
-1
+1
+1
+1
+1
+1
-1
-1
+1
-1
+1
+1
-1
-1
o -1
-1
-1
-1
-1
o
G
+1
-1
+1
+1
+1
+1
+1
-1
+1
+1
-1
-1
+1
-1
+1
+1
+1
+1
+1
+1
-1
-1
+1
-1
+1
+1
+1
-1
-1
H
+1
-1
-1
+1
+1
+1
-1
-1
-1
+1
+1
-1
-1
+1
-1
+1
-1
+1
+1
+1
-1
-1
+1
-1
+1
+1
+1
-1
-1
J
+1
o +1
-1
o -1
-1
-1
+1
-1
-1
-1
+1
-1
-1
+1
-1
-1
o -1
-1
+1
o +1
o +1
+1
-1
-1
(continued)

Specimen Number
116
117
118
119
120
121
122
123
124
125
126
127
128
129
130
131
132
133
134
135
136
137
138
139
140
141
142
143
144
145*
Test Order
67
130
68
155
69
70
156
131
71
157
158
159
160
132
161
72
162
73
163
74
75
76
133
134
77
78
164
165
166
79
APPENDIX 2. (Continued)
A
+1
o +1
-1
-1
+1
o o
-1
-1
+1
+1
+1
+1
+1
-1
+1
-1
+1
+1
-1
o o o
+1
-1
-1
-1
+1
-1
B
-1
o -1
+1
-1
-1
+1
o -1
+1
+1
+1
+1
o +1
-1
+1
-1
+1
-1
-1
-1
o o
-1
-1
+1
+1
+1
-1
C
-1
o -1
-1
+1
-1
o o
+1
-1
-1
+1
+1
o -1
-1
-1
-1
+1
-1
-1
o -1
o -1
+1
+1
+1
+1
-1
Level of Factor 1
D
+1
-1
+1
-1
-1
-1
-1
-1
-1
+1
-1
-1
+1
-1
+1
-1
-1
-1
-1
+1
+1
-1
-1
-1
-1
+1
+1
+1
+1
+1
E
-1
-1
-1
+1
+1
+1
-1
-1
+1
-1
-1
+1
-1
-1
+1
-1
-1
-1
+1
-1
+1
-1
-1
-1
+1
-1
+1
+1
-1
+1
F
-1
-1
-1
-1
-1
+1
o o
+1
-1
+1
+1
+1
o +1
+1
-1
+1
-1
+1
-1
o o
+1
-1
-1
+1
+1
+1
-1
G
-1
-1
+1
+1
-1
+1
-1
-1
+1
-1
-1
+1
-1
-1
+1
-1
+1
+1
-1
-1
-1
-1
-1
-1
+1
-1
-1
+1
+1
+1
H
+1
-1
-1
-1
+1
+1
-1
-1
+1
+1
+1
+1
-1
-1
-1
+1
+1
-1
+1
-1
-1
-1
-1
-1
-1
+1
+1
-1
+1
+1
J
-1
o +1
-1
79
-1
-1
o o
+1
-1
+1
+1
+1
o +1
+1
-1
-1
-1
-1
+1
o o o
-1
+1
+1
-1
-1
+1
(continued)

80
Specimen Number
146
147
148
149
150*
151
152
153
154
ISS">"
156
157
158
159
160
161
162
163
164
165
166
167
168
169
170
171
172
173
174
175
Test Order
80
81
167
135
168
82
169
83
84
170
171
136
172
173
174
137
175
176
85
138
86
177
139
178
87
140
88
141
179
180
APPENDIX 2. (Continued)
A
+1
-1
+1
o -1
+1
o +1
+1
o +1
o -1
-1
-1
o -1
+1
-1
o +1
+1
-1
-1
-1
-1
-1
o -1
+1
B
-1
-1
+1
o +1
-1
+1
-1
-1
+1
+1
o +1
+1
+1
o +1
+1
-1
o -1
+1
o +1
-1
o -1
o +1
+1
C
-1
+1
+1
o +1
+1
o -1
+1
o -1
+1
+1
-1
-1
-1
-1
-1
-1
+1
-1
+1
o -1
-1
o -1
o -1
-1
Level of Factor l
D
-1
+1
+1
-1
+1
-1
+1
-1
+1
-1
+1
-1
-1
-1
+1
+1
+1
-1
-1
+1
+1
-1
+1
-1
+1
-1
+1
+1
+1
-1
E
+1
-1
-1
-1
+1
-1
+1
+1
+1
-1
+1
-1
-1
+1
-1
+1
-1
-1
-1
+1
-1
+1
+1
+1
+1
-1
+1
+1
-1
-1
F
-1
+1
-1
o -1
+1
o +1
+1
o -1
o +1
+1
+1
o +1
-1
-1
o +1
-1
o -1
+1
o +1
o -1
+1
G
-1
-1
-1
-1
+1
+1
+1
-1
-1
-1
-1
-1
-1
--I
+1
+1
-1
-1
-1
+1
+1
+1
+1
-1
.;.1
-1
+1
+1
+1
+1
H
+1
-1
+1
-1
+1
-1
+1
-1
+1
-1
-1
-1
+1
-1
+1
+1
-1
-1
-1
+1
+1
-1
+1
+1
+1
-1
-1
+1
-1
-1
J
+1
+1
+1
+1
-1
+1
o +1
+1
o -1
o -1
+1
+1
o -1
-1
+1
o +1
+1
o +1
-1
o +1
-1
+1
-1
(continued)

Specimen Test Number Order
176* 142
177 143
178 144
179 89
180 90
*Dup1icate specimens.
1Leve1 of Factor
-1 Low Level o Middle Level
+1 High Level
APPENDIX 2.
A B C
0 0 0
0 0 0
0 0 0
+1 -1 +1
-1 -1 -1
81
(Continued)
Level of Factor1
D E F G H J
-1 -1 0 -1 -1 -1
+1 +1 0 +1 +1 0
+1 +1 0 +1 +1 +1
-1 -1 -1 +1 +1 +1
-1 -1 -1 +1 +1 -1

!!!!!!!!!!!!!!!!!!!"#$%!&'()!*)&+',)%!'-!$-.)-.$/-'++0!1+'-2!&'()!$-!.#)!/*$($-'+3!
44!5"6!7$1*'*0!8$($.$9'.$/-!")':!

APPENDIX 3
PREPARATION OF THE SPECIMENS

!!!!!!!!!!!!!!!!!!!"#$%!&'()!*)&+',)%!'-!$-.)-.$/-'++0!1+'-2!&'()!$-!.#)!/*$($-'+3!
44!5"6!7$1*'*0!8$($.$9'.$/-!")':!

APPENDIX 3. PREPARATION OF THE SPECIMENS
BATCHING AND MIXING PROCEDURE
1. Select the aggregate and gradation to be used. Batch the material
by weight in the following way:
a. Weigh the portion of aggregate retained on No. 10 sieve and store in a container.
b. Weigh the portion of aggregate passing No. 10 sieve and store in a different container.
2. Add the appropriate amount of portland cement (4, 6, and 8 percent
by total weight of aggregate) to the portion of aggregate passing No. 10
sieve.
3. Mix the fine aggregate and cement by hand.
4. Add half of the required mixing water (3, 5, and 7 percent by total
weight of aggregate and cement) to the coarse portion of the aggregate and
hand mix until the surfaces of all the coarse aggregate are wet.
5. Add the fines and cement to the wet coarse aggregate and spread the
fines over the coarser aggregate; then, add the remaining water.
6. Machine mix for 1 minute and then remove the fines stuck to the
bottom of the bowl; mix an additional 1-1/2 minutes. The mixing procedure
used in the experiment was performed using a Model AS-200 machine manufactured
by the Hobart Company (Ohio). Figure 24 shows the type of mixer used.
COMPACTION PROCEDURES
Gyratory Shear Compaction
1. Coat the mold and base plate with a thin layer of kerosene, and
place a circular-shaped paper at the bottom of the mold to avoid losing
fines during gyration.
85

86
Fig 24. Automatic mixing apparatus.
87
2. Place the first layer of material in the mold, keeping the coarser
aggregates away from the walls of the mold. Pour the remainder of the material
into the mold, punching it several times with a rod. Level the top of the
mold with a thin layer of fines.
3. Put another rounded paper at the top of the leveled material and
place the mold directly below the ram of the compactor.
4. Apply pressure to the specimen until 30 psi is reached on the low
pressure gage. Gyrate the specimen three times and stop. Repeat until 60
psi, in the case of the lower compactive effort, or 160 psi, in the case of
the higher compactive effort, is registered during gyration (Fig 25).
5. Release the pressure in the low pressure system. Now, at approxi
mately one stroke per second, increase the pressure to 1,000 pounds, as
measured on the high pressure gage. Then, release the pressure and remove
ram from the mold.
6. Take the 4 by 2 inch specimen out of the mold using the extractor
shown in Fig 25. Details and specifications for the gyratory shear compaction
can be seen in Ref 51.
Automatic Rainhart Impact Compaction
1. Proceed in the same way as in Steps 1 and 2 for the gyratory shear
compaction.
2. Set the specified number of blows in the automatic counter. For low
compactive effort set 30 blows and for high compactive effort set 75 blows.
3. After the mixture is compacted, apply a static leveling load of 1,000
pounds using a mechanical screw jack for leveling the specimen.
4. Remove the specimen from the mold using the extruding apparatus shown
in Fig 26. The same figure shows the Rainhart Impact Compactor (Ref 50) used
for compacting the 4 by 2-inch specimens.
CURING AND TESTING PROCEDURE
1. Wrap the specimen with a commerically available PVC film or leave it
as extruded from the mold, according to the type of curing desired for each
specimen.

88
Fig 25. Mechanical extruding apparatus and gyratory shear compactor.
Fig 26. Rainhart automatic compactor and mechanical extruding apparatus.

89
2. Store the specimen in the environmental chamber at 400 F, in the air
conditioned laboratory at 750 F, or in the oven at 1100 F, according to the
curing temperature of the specimen.
3. Remove the specimen from the corresponding curing temperature after
6, 13, or 20 days, according to the curing time, and remove the PVC film.
Determine the specific gravity.
4. Allow the specimen to dry for 24 hours with the help of an electric
fan to eliminate the influence of moisture content on testing.
5. Test the specimen at 750 F ± 20
F with the indirect tensile test
equipment shown in Fig 27. Place an arbitrary preload of 25 pounds on the
specimen prior to applying a loading rate of 2 inches per minute.

90
Fig 27. Basic indirect tensile testing equipment.

APPENDIX 4
DUPLICATE SPECIMENS AND ERROR TERM CALCULATIONS

!!!!!!!!!!!!!!!!!!!"#$%!&'()!*)&+',)%!'-!$-.)-.$/-'++0!1+'-2!&'()!$-!.#)!/*$($-'+3!
44!5"6!7$1*'*0!8$($.$9'.$/-!")':!

APPENDIX 4. DUPLICATE SPECIMENS AND ERROR TERM CALCULATIONS
INDIRECT TENSILE STRENGTH
Specimen Tensile Mean Number Strength Squares
75 127.7 156.6
80 145.4
13 139.0 47.0
30 129.3
18 252.0 1035.1
62 206.5
113 105.6 271.4
145 82.3
104 70.9 6.5
150 74.5
122 136.8 937.5
155 93.5
ll5 98.1 16.3
176 92.4
Total Sum of Squares 2,470.4
Degrees of Freedom 7
*Error Term = 2 1470.4 = 353 7
*Within treatments treated alike
93

![[XLS] · Web view118 118 45 45 88 118 118 128 128 128 128 98 98 12 12 12 98 98 98 88 98 58 128 128 98 98 98 98 98 98 98 98 12 12 98 98 98 98 12 98 98 98 58 12 98 98 98 98 98 98 98](https://static.documents.pub/doc/80x56/5b1aab787f8b9a1e258df5af/xls-web-view118-118-45-45-88-118-118-128-128-128-128-98-98-12-12-12-98-98.jpg)


