

Confidential
Investor Presentation
January 2020

Confidential
Today’s presenters
2
Lars FrommHead of Financing, Altor
Jonas DahlbergChief Executive Officer
Transcom since June 2019 Altor since March 2018
Mattias HolmströmDirector, Altor
Altor since August 2011Board Member of Transcom since April 2017
Previous roles:CFO, Transcom (2019)
CFO, Sweco Group (2012-2019)President, Sweco Russia (2008-2012)
Associate Principal, McKinsey (1998-2008)
Previous roles:Head, Loan Capital Markets SWE, Danske Bank (2015-2018)Director, Large Cap Leveraged Finance, Nordea (2011-2015)
Manager, Acquisition Finance, SEB (2003-2011)Associate, Corporate Finance, Enskilda Sec. (1998-2003)
Previous roles:Senior Consultant, Booz & Company (2010-2011)
Investment Analyst, Altor (2009-2010)Client Relations, Chinsay AB (2007-2009)
Confidential
Agenda• Executive summary
• Company overview
• Industry trends
• Financial development
• Summary
Appendix
3

Confidential
Executive summary

Confidential
5
Transcom at a glance
• Transcom provides world-class customer services to leading consumer brands in Europe and North America
• Since Altor’s buy-out in 2017, Transcom is on a transformation journey aiming at double-digit margins and profitable growth
• Strategy includes the improvement of operational efficiency, growth in attractive segments, further development of the delivery model, expansion of the digital offering, and is supported by M&A
• Developments during 2018-2019 show improvements on essentially all key financials: EBITDA, margin, E/O items, cash flow and leverage
• Transcom is now ready for the next phase of the journey –profitable growth through organic and acquired expansion in attractive segments

Confidential
Continued margin expansion
(adj. EBITDA margin)
Diversify industry vertical exposure
(% sales)
M&A
Strategic priorities and development
6
Deliver cost-out program (run-rate)
ASA(Media, 2019)
Telco & cableOther
TMS
connected!(1)
(Utilities, 2019)
At de-listing TargetQ3 2019 LTM
- EUR 27m EUR 33m
Durrës(Client growth,
2018)
Awesome OS (eCom, 2018)
Xzakt(SME, 2017)
5.3%
8.8%
(1) TMS connected! was acquired outside the bond group, intended to be incorporated at a later stage.
Transcom site footprint On-shore
Off-shore
Near-shore

Confidential
Company overview
Confidential
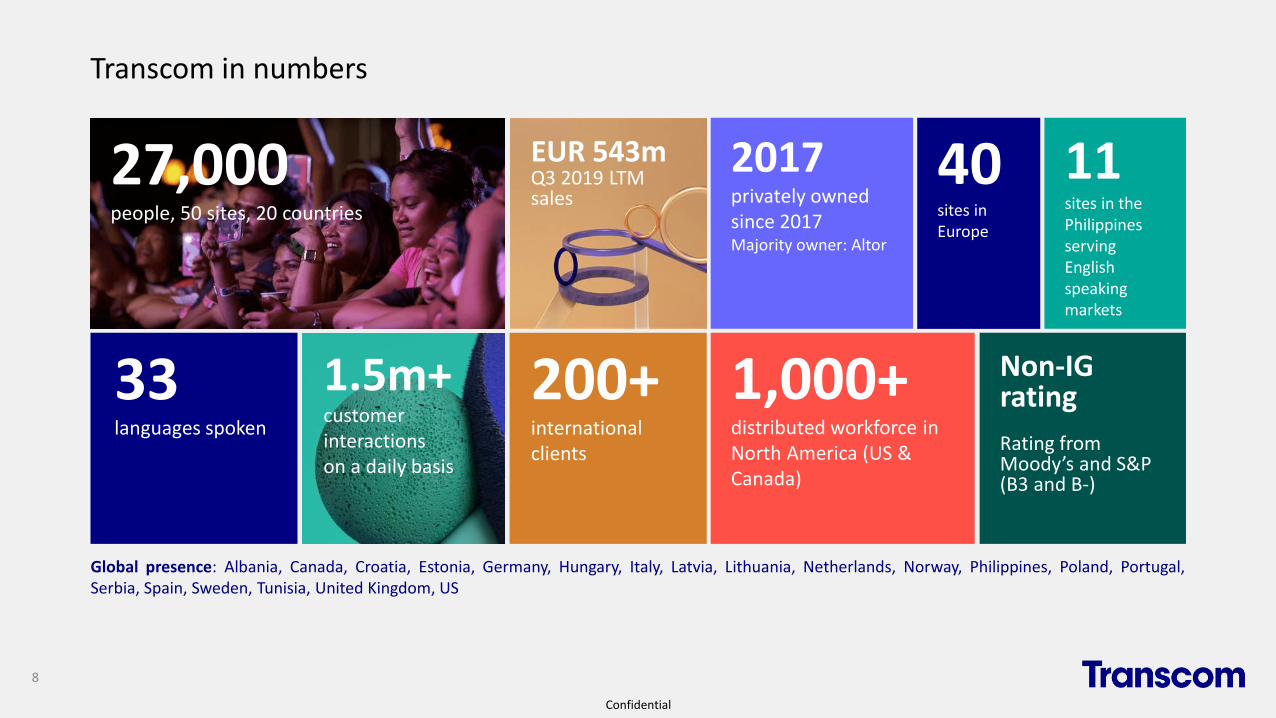
Transcom in numbers
8
200+international clients
1.5m+customer interactions on a daily basis
27,000people, 50 sites, 20 countries
EUR 543mQ3 2019 LTM sales
33languages spoken
2017privately ownedsince 2017Majority owner: Altor
1,000+distributed workforce in North America (US & Canada)
40sites in Europe
11sites in the Philippines serving English speaking markets
Global presence: Albania, Canada, Croatia, Estonia, Germany, Hungary, Italy, Latvia, Lithuania, Netherlands, Norway, Philippines, Poland, Portugal,Serbia, Spain, Sweden, Tunisia, United Kingdom, US
Non-IG rating
Rating from Moody’s and S&P (B3 and B-)

Confidential
Core services
Conversational commerce
Digital channels
Robotic Process
Automation
Interaction Analytics
Chatbots
Gamification
Utilities BFSI Gov &Health-
care
Media Travel
A leading provider of outsourced customer relationship management solutions…
We are a global customer care provider offering future proof
customer facing concepts delivered by our global team of local
specialists…
…supporting our clients’ digital agenda by combining our core
services with leading digital capabilities and tools…
…delivering services in 33 languages to international brands in various
industries
Call Chat E-mail
27,000customer experience specialists
serving customers via
Services & utilities
Commerce & logistics
Auto-motive
Logistics Retail/ e-commerce
IT/Tech Whitegoods
Telco & cable
Social media Messaging Telco Cable
9
Confidential
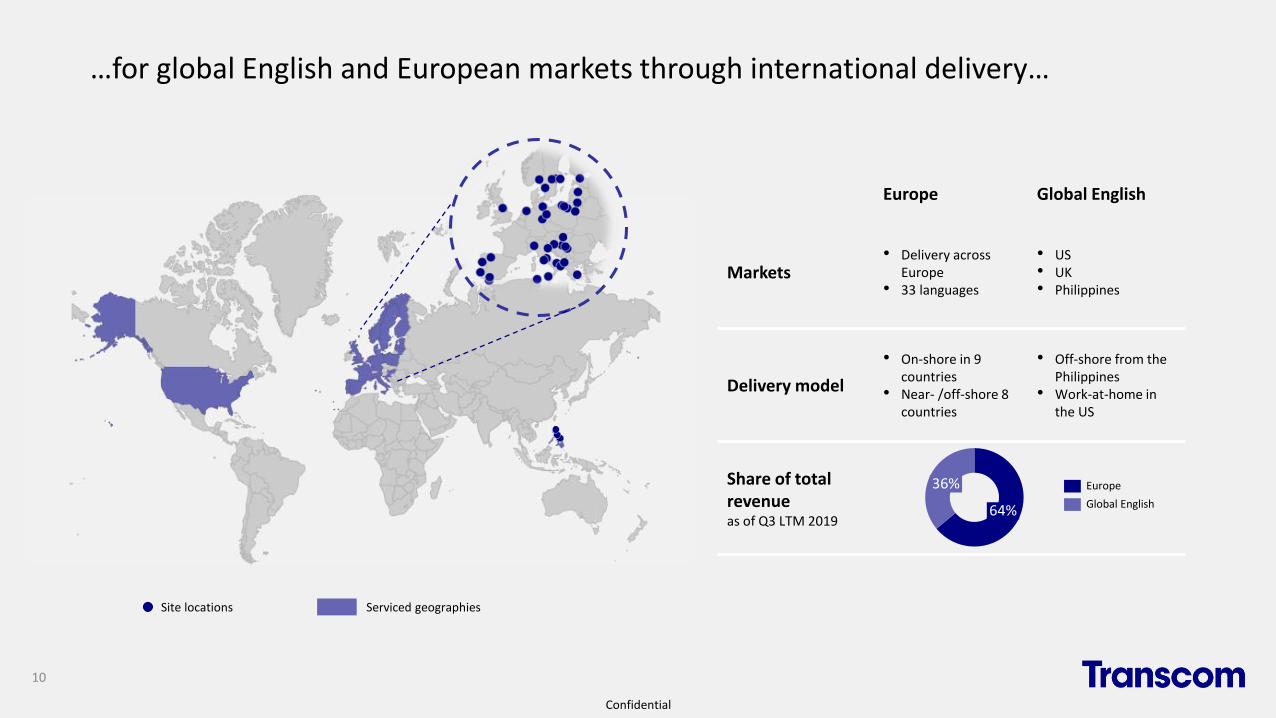
…for global English and European markets through international delivery…
Europe Global English
Markets• Delivery across
Europe• 33 languages
• US• UK• Philippines
Delivery model
• On-shore in 9 countries
• Near- /off-shore 8 countries
• Off-shore from the Philippines
• Work-at-home in the US
Share of total revenueas of Q3 LTM 2019
64%
36% Europe
Global English
Site locations Serviced geographies
10
Confidential
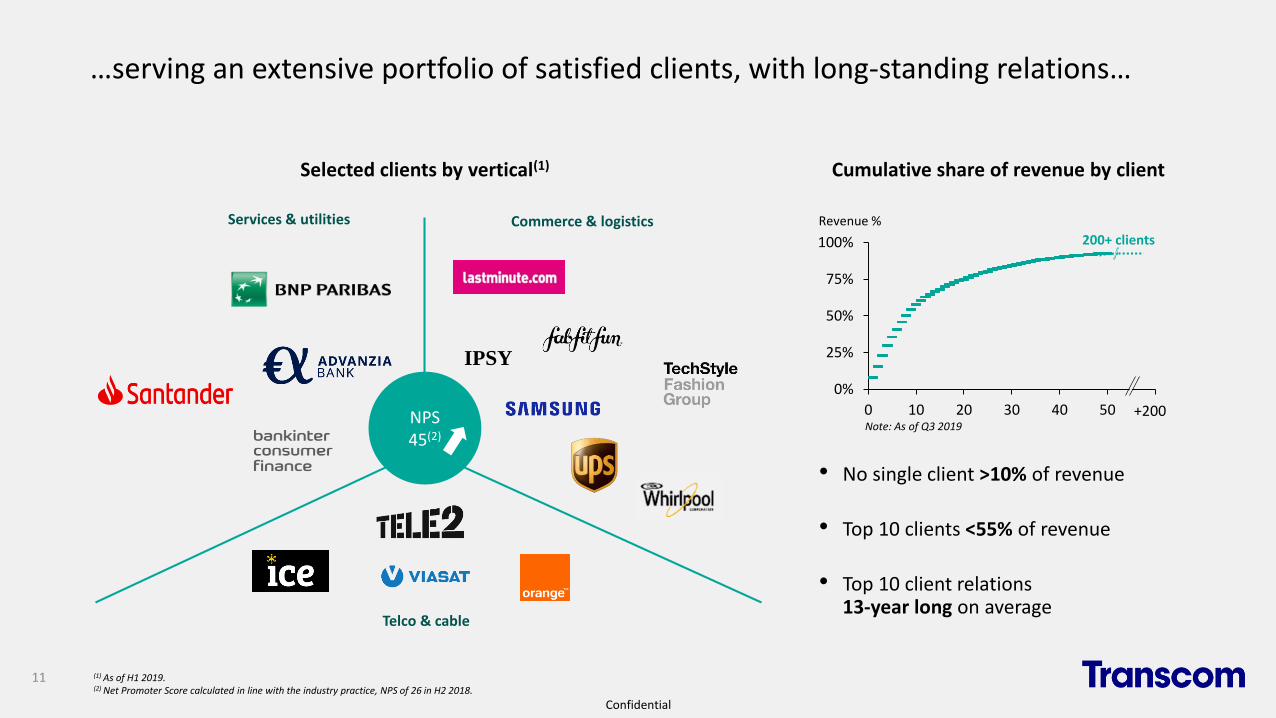
…serving an extensive portfolio of satisfied clients, with long-standing relations…
(1) As of H1 2019.(2) Net Promoter Score calculated in line with the industry practice, NPS of 26 in H2 2018.
Telco & cable
Commerce & logisticsServices & utilities
IPSY
NPS 45(2)
Selected clients by vertical(1)
0%
25%
50%
75%
100%
0 10 20 30 40 50 60
• No single client >10% of revenue
• Top 10 clients <55% of revenue
• Top 10 client relations 13-year long on average
Note: As of Q3 2019
Revenue %
200+ clients
+200
Cumulative share of revenue by client
11

Confidential
• Digital solutions implemented for 45% of top 20 clients
• Launch of T:Labs – Transcom’s hub for rapid digital innovation and experimentation with our clients
• Innovation & CX Awards
…with a highly competitive digital offering…
• Chatbots: AI serving as customer service representative to both agent and end-consumer. Often embedded in chat or messaging channel
• Robotic process automation:automation of repetitive manual back-office process
• Robotics desktop automation:real time automation of front-end tasks on the screen of the agent
Digital process automation
• Gamification: application of game-design elements in a non-game context. Game types cover the full agent life-cycle needs:
- Leadership
- Employability
- Operational
- Commercial
Gamification
• Global business intelligence: data-driven analysis and reporting
• Interaction analytics: insights from in-depth analysis of communications between end-customer and Transcom’s clients
• CX advisory services: advisory on designing, implementing and management of the best-in-class customer experience solutions
Customer experience (CX) management
• Digital channels
- Messaging (conversational commerce)
- Webchat
- Social media
- Rating-apps
- Self-service
Digital interactions
Best cloud implementation Best use of customer insights, finalist
12

Confidential
…and growth supported through acquisitions in attractive segments and geographies
to strengthen European near-shore and multilingual services
with +500 employees
August 2018
Transcom Holding AB acquires a site in Durrës
to strengthen digital capabilities and position in the e-commerce
industry
July 2018
Transcom Holding AB acquires Awesome OS
to create a center of excellence for utilities and strengthen
exposure to German market
March 2019
TopCo ABacquires TMS connected!(1)
to expand footprint on the German market and strengthen
capabilities in the media industry
April 2019
Transcom Rostock acquires ASA Informationsdienste GmbH
to further strengthen its position in the Nordics within
the SME market
June 2017
Transcom Holding AB acquires Xzakt
Kundralatiom AB
M&A transactions since take-private in 2017
• Going forward, Transcom is looking for “polished pearls”, i.e. companies with double-digit profitability, attractive growth potential and complementary assets
• ASA Informationsdienste was Transcom’s first carve-out deal, transaction type growing in importance for the future
(1) Acquired outside the bond group, intended to be incorporated at a later stage.13

Confidential
Industry trends

Confidential
Mature industry expanding on the back of fast-growing segments
6668
7275
7983
201820172015 2020E2016 2019E
~4%
~5%
Market sizeUSD bn
~4.0%
Other
~4.5%
Public sector &
Healthcare
Financialservices
Hightech
Retail incl. e-commerce
Industrial & Auto
Utilities Telco & Media
~4.0% 3.7% Europeanaverage
~3.0%
~10.0%
~5.0%
~2.5%~1.5%
CRM BPO revenue expected growth by vertical(1), CAGR 17-20,%Global BPO CRM market
45%APAC
EMEA
North America
29%
15%
12%
LatAm
Global contact center outsourcing spend, 2018
15 Source: Citi, McKinsey, Everest Group.(1) Reported numbers are for Europe only. However similar trends are reported for the US market (Everest Group, 2019).

Confidential
6% 9% 10% 14%23%
50%
Convergys Sykes Teleperfo. Sitel Webhelp Comdata
New technologies and ongoing digitalisation • Digitalisation will gradually replace simple tasks and enhance human performance
• Part of customer volume expected to gradually move to digital channels in the medium-term
• Market will change in the long-term, with continued market success dependent on ability to manage both technology (e.g. bots, visual agents, artificial intelligence) and humans
• Increased digitalisation and complexity in consumer life (e.g. internet of things, connected home, etc.) will drive complexity and value of contacts
• Customer service is becoming an even more important competitive criteria and a source of sales, evolving from being a “cost” to also becoming part of the “sales” budget
Increased value-added and outbound services
Transcom is well positioned to capitalise on changing market conditions
• Market consolidation continues amongst the biggest players with several broadening their service offering and expanding geographic footprint
• Financial investors continue to take market positions
• Increased supplier consolidation with fewer vendor relationships per customer will drive increased usage of partnership models
Market consolidation
• Increased outsourcing drives +2-3% of the total market growth of 4-5%
• Highest growth in emerging markets and immature industries
Increased outsourcing
16
Key market trends are digitalisation, increased value-added and consolidation
Digital market share
% of acquired revenue for selected players(1)
Key growth drivers… …underpinning the global BPO CRM market (USD bn)
1% 2%
13%
2013 2015 2020E
More value-added services and
outbound needed
Ongoing digitalisationof customer service
activities
More complex and multi-channeled
interactions
Contact center is becoming a growth
engine
Client
<
@
Source: AT Kearney, Citi, McKinsey, Everest Group, Company information.(1) Figures for 2015.
6683
2015 2020E

Confidential
Consumer behavior and technology driving new channels and services
Market growth by channel (2016-2020E)
17
18%
12%
8% 8%6%
E-mailSocial media
Chat Voice (complex
issues)
SMS
Expected industry growth: 5%
AutomationConversational commerce
Digital channels
Interaction analytics
Bots and virtual agents
Artificial intelligence
Source: Citi (2019).

Confidential
Fragmented industry under consolidation
18
25%
75%
Europe
Global
Estimated BPO CRM market share by top 5 players(1) Examples of recent transactions
25%
75%
Synnex acquires Convergys to integrate it with Concentrix in
Jun 2018
+
Covisian acquires Grupo GSS in Feb 2019
+
Ardian acquires CCC in Nov 2017
+
Webhelp acquires Sellbytel in Jun 2018
+
Arvato Bertelsmann and Sahamform a joint venture in Sep
2018
+
Transcom has done a series of M&A transaction since mid-
2017
Blacktone buys a stake in TaskUS in Aug 2018
+
Groupe BruxellesLambert acquires a majority stake in Webhelp in Jul 2019
+
TP acquires Intelnet in Jun 2018
+
(1) OES (2018).

Confidential
5.9
6.5 6.56.2 6.2 6.4
6.77.0
8.1
8.89.2
9.9 10.1
12.6%12.2% 11.9% 11.9%
10.7% 10.4% 10.7% 10.9%11.7%
12.5% 12.6%13.4% 13.2%
5.0%
7.0%
9.0%
11.0%
13.0%
15.0%
17.0%
19.0%
21.0%
23.0%
25.0%
0.0
2.0
4.0
6.0
8.0
10.0
12.0
2006 2007 2008 2009 2010 2011 2012 2013 2014 2015 2016 2017 2018
Peer group sales EBITDA margin
• Top-line growth with stable profitability for the 5 largest players over the last 10+ years, driven partly by market consolidation, a broadened service offering and geographic expansion
• Strong underlying growth, sector consolidation and increasing barriers to entry have strengthened the main players whilst protecting and enhancing their profitability
• Profitability of the largest companies in the sector underpins the non-cyclicality of the industry
Historical sales and EBITDA margin for the largest players(1)
19
Stability of industry revenue and margins over cycles
Source: Capital IQ, AT Kearney, Company information.(1) Includes Teleperformance, Convergys (acquired by Synnex Corp. in 2018), Sykes, TTEC and Transcom. FX rates based on constant currency as of year-end 2018.
EUR bn

Confidential
Financial development

Confidential
Continued trajectory of improved profitability
627586 584
544 543
32 31 38 39 48
5.2% 5.3%
6.5%7.2%
8.8%
2015A 2016A 2017A 2018A Q3 2019 LTM
EUR m
Sales Adj. EBITDA Adj. EBITDA %
(10.7%)
Sales and EBITDA(1) Summary of historical P&L(1)
EUR m 2015A 2016A 2017A 2018AQ3 2019
LTMQ3 2018
YTDQ3 2019
YTDQ3 2018 Q3 2019
Sales 626.5 586.1 584.0 543.6 542.6 400.6 399.6 130.5 130.5
Cost of sales -492.7 -458.7 -456.3 -419.3 -403.9 -313.4 -298.2 -100.8 -96.2
D&A(2) -8.9 -8.0 -8.2 -7.7 -8.9 -5.6 -6.8 -2.0 -2.4
D&A leasing -0.2 -0.2 -0.1
Gross profit 125.0 119.4 119.5 116.7 129.5 81.6 94.4 27.7 31.9
% margin 19.9% 20.4% 20.5% 21.5% 23.9% 20.4% 23.5% 21.2% 24.5%
SG&A -101.6 -96.2 -89.5 -85.1 -80.6 -63.3 -58.8 -21.9 -20.0
D&A leasing -9.3 -9.3 -3.3
Adj. EBITA(1) 23.4 23.1 30.0 31.6 39.8 18.1 26.3 5.7 8.7
% margin 3.7% 3.9% 5.1% 5.8% 7.3% 4.5% 6.6% 4.4% 6.6%
Adj. EBITDA(1) 58.1 42.6 14.4
% margin 10.7% 10.6% 11.0%
Adj. EBITDA excl. IFRS 16
32.3 31.2 38.2 39.2 47.6 23.7 32.2 7.8 10.6
% margin 5.2% 5.3% 6.5% 7.2% 8.8% 5.9% 8.1% 5.9% 8.1%
21 (1) 2015A-2016A figures represent consolidated TWW accounts. 2017A-2018A are consolidated at Issuer level and adjusted for the acquisitions of TWW and Xzakt group. On July 27, 2018, the group acquired Awesome OS which has been consolidated from this date. 2019 figures fully reflect IFRS 16 lease accounting, with no retroactive calculation for previous comparison periods.(2) M&A amortisation not included in D&A.

Confidential
Growing in attractive customer segments
22
• Commerce & logistics –Growing strongly driven by e-commerce and acquisition of Awesome
• Service & utilities – Stable; impacted by divestiture of Legal services in Spain in June 2019
• Telco & cable – Revenue shrinking while profitability is increasing due to operational improvements and exits from unprofitable contracts
EBITA margin Q3 2019 LTM
Revenue by industry segment (% and EUR m)
46%38% 33%
37%
38%39%
17%
24% 28%
Q3 2019 LTM
Services & utilities
2018A2017A
Commerce & logistics
Telco & cable
584
544 543
10.5%
7.6%
4.3%
Note: 2017A is consolidated at Issuer level and full year-adjusted for the acquisitions of TWW group and Xzakt group. On July 27, 2018, the group acquired Awesome OS which has been consolidated from this date. Q3 2019 LTM includes LatAm until Feb 2019 (EUR 2.3m sales and EUR -0.2m EBITDA). Adj. EBITA margin % per industry segment includes allocation of unallocated/group-wide expenses.

Confidential
Shifting towards profitable delivery locations
23
Revenue by type of delivery (% and EUR m)
Q3 2019- New site in Pasig, Philippines- New site in Elblag, Poland- Soon opening new site in Tunis,
Tunisia- Expansion decided of Zagreb,
Croatia
Q2 2019- Acquisition of ASA
Informationsdienste
Q1 2019- Divested operations in Chile- New site in Novi Sad, Serbia- New site in Zagreb, Croatia
74% 71%66%
18% 20%24%
8% 9% 10%Near-shore
544
2017A 2018A
Off-shore
On-shore
584 543
7%
19%
3%
EBITA margin Q3 2019 LTM
Q3 2019 LTM
Note: 2017A is consolidated at Issuer level and full year-adjusted for the acquisitions of TWW group and Xzakt group. On July 27, 2018, the group acquired Awesome OS which has been consolidated from this date. Q3 2019 LTM includes LatAm until Feb 2019 (EUR 2.3m sales and EUR -0.2m EBITDA).

Confidential
People, Passion, Performance (PPP) – Closing in on cost-out target
5.0
10.813.6 14.4 12.3
6.0
8.4
11.912.7
10.61.8
3.96.0
10.2
21.0
2017A 2018A Q3 2019 LTM Identified savings Target
29.4
11.0
33.1 33.1
English-speaking region Europe Central functions
Continued headcount reductions in HR, IT and operationsHeadcount reductions in support functions
Headcount reduction through delayering and transfer of services to shared service centers
Continued cost reductions through administration and HR efficiency increases and transfer to shared service centers
EUR m
Actual run-rate
24 Note: Gross of investments, ca. EUR 1.5m in 2018 and ca. EUR 0.8m in 2019.
Confidential
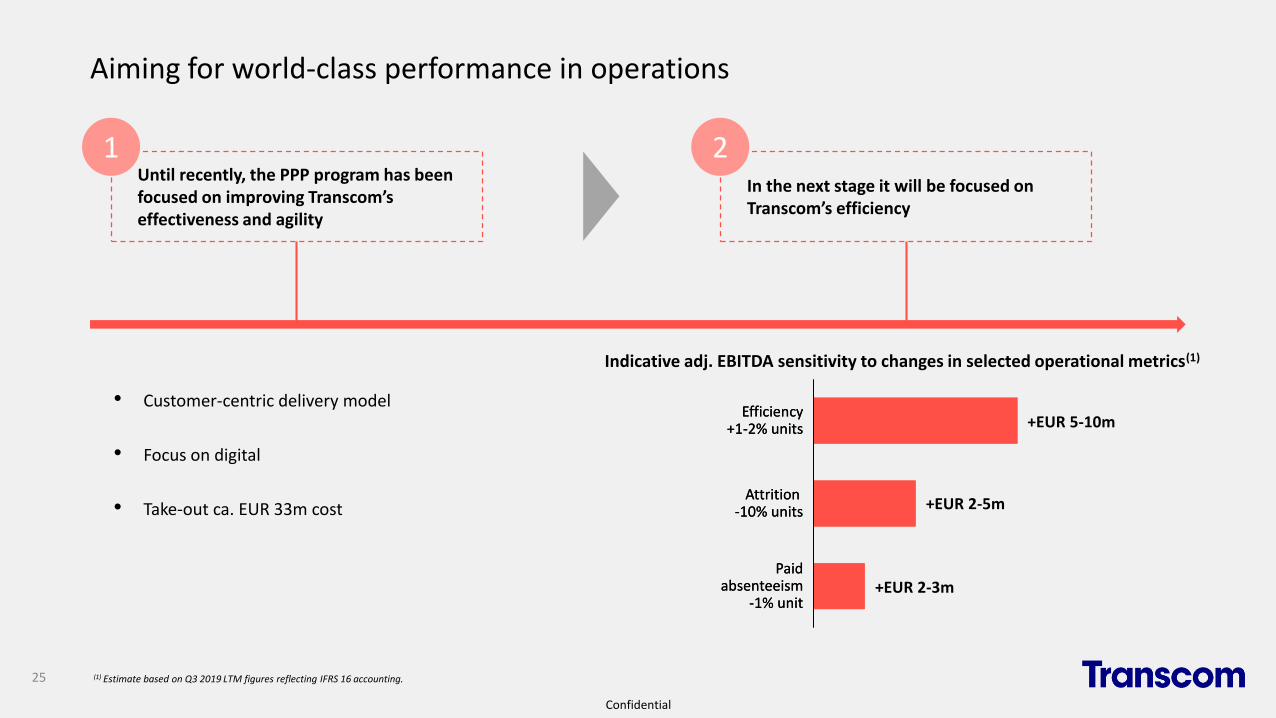
In the next stage it will be focused on Transcom’s efficiency
Until recently, the PPP program has been focused on improving Transcom’s effectiveness and agility
Aiming for world-class performance in operations
25
Attrition -10% units
Efficiency+1-2% units
Paidabsenteeism
-1% unit
Indicative adj. EBITDA sensitivity to changes in selected operational metrics(1)
+EUR 5-10m
+EUR 2-5m
+EUR 2-3m
21
• Customer-centric delivery model
• Focus on digital
• Take-out ca. EUR 33m costAttrition
-10% units
Efficiency+1-2% units
Paidabsenteeism
-1% unit
(1) Estimate based on Q3 2019 LTM figures reflecting IFRS 16 accounting.

Confidential
E/O items trending downwards
26
0
5
10
15
20
25
30
35
40
45
50
16.6
2.2
37.3
7.2
Q2 2017
7.0 6.0
Q1 2017
9.5
Q3 2017
20.0
3.5
Q4 2017
23.8
Q1 2018
34.5
20.6
Q4 2018
4.3
Q2 2018
34.4
Q3 2018
3.6 4.0
32.5
Q2 2019Q1 2019
15.0
3.1
2.2
Non-recurring items include:LTM
By quarter
Q3 2019
0.8
11.5
• Restructuring cost for PPP
• Consultancy cost for PPP
• Non-operational acquisition and divestiture cost
• Legal claims and settlements with clients
• Management restructuring
EUR m
Note: 2017A is consolidated at Issuer level and full year-adjusted for the acquisitions of TWW group and Xzakt group.

Confidential
Solid and improving operating cash flow
27
• Q3 2019 YTD operating cash flow improved to EUR 30.1 million (-1.0)
• Q3 2019 operating cash flow improved to EUR 12.5 million (-3.7)
• Q3 2019 NWC improved to EUR 1.1 million (-15.6)
EURm 2018AQ3 2018
YTDQ3 2019
YTDQ3 2018 Q3 2019
Profit/loss before tax -32,226 -34,862 -2,352 -4,698 992
Adjustments for non-cash items 30,050 30,802 27,712 12,106 8,492
Net financial items 19,674 15,813 12,593 4,033 4,164
Income taxes paid -2,288 -775 -5,074 526 -2,239
Changes in net working capital -12,716 -11,942 -2,733 -15,618 1,087
Operating cash flow 2,495 -964 30,146 -3,652 12,495
Investments -8,803 -6,641 -10,175 -3,226 -4,993
Acquisitions/disposals of subsidiaries, net of cash -34,033 -32,987 -711 -32,987 -6,647
Other 1,048 256 -85 158 -1
Cash flow from investing activities -41,788 -39,372 -10,971 -36,056 -11,641
Cash flow from financing activities 34,072 38,522 -19,890 35,505 -12,770
Cash flow for the period -5,222 -1,814 -715 -4,203 -11,915

Confidential
Despite renewed investments, still operating a capital-light business model
28
1.2 2.0 2.2
8.8 6.66.5
9.8
9.3
0.7
2015A 2016A 2017A
0.3
2018A Q3 2019 LTM
10.0
8.5
7.2
10.1
12.5
Tangible capex
Intangible capex
Operating capex development(1)
(1) Capex excludes M&A and represents operating capex.(2) M&A amortisation not included in D&A. (3) 3.39% assuming IFRS 16 lease build-up, no retroactive calculation done for previous comparison periods.Note: 2015A-2016A figures represent consolidated TWW accounts. 2017A-2018A are consolidated at Issuer level. From Q2 2017 onwards, figures include the acquisition of Xzakt group. From Q3 2018 onwards, figures include the acquisition of Awesome group.
1.4% 1.4% 1.4% 1.4% 1.7%
4.8%5.3%
4.7%
6.1% 6.0%
0.0%
1.5%
3.0%
4.5%
6.0%
7.5%
Q3 2019LTM
2015A 2016A 2017A 2018A
Net working capital and D&A as % of revenue(2)
(3)
D&A as a % of revenue
NWC as a % of revenue
EUR m

Confidential
Stable working capital with modest fluctuations
29 Note: 2015A-2016A figures represent consolidated TWW accounts. 2017A-2018A are consolidated at Issuer level. From Q2 2017 onwards, figures include the acquisition of Xzakt group. From Q3 2018 onwards, figures include the acquisition of Awesome group.
-120
-100
-80
-60
-40
-20
0
20
40
60
80
100
120
140
160
6,5
8,5
3,5
0,0
3,0
0,5
7,5
7,0
1,5
5,0
1,0
8,0
5,5
2,0
6,0
2,5
4,0
4,54.3
6.1
Q3
20
18
Q4
20
18
Q2
20
16
21
5.45.4
Q4
20
17
Q1
20
17
Q1
20
19
Q2
20
19
6.56.1
Q1
20
15
5.3
3.4
24
Q2
20
15
Q3
20
15
4.64.8
Q4
20
15
4.9
Q1
20
16
3.0
40
Q3
20
16
Q4
20
16
4.0
Q2
20
17
Q3
20
17
Q1
20
18
4.7
5.4
18
Q2
20
18
5.25.4
3430 30 31 31
3.9
26 2731
2229 34 25 30
36
NWC %
Prepaid expenses and accrued income
Trade receivables
Trade payables
Other receivables - Current
Accrued expenses and prepaid income
Other liabilities - Current
6.0
33
Q3
20
19
EUR m
Confidential
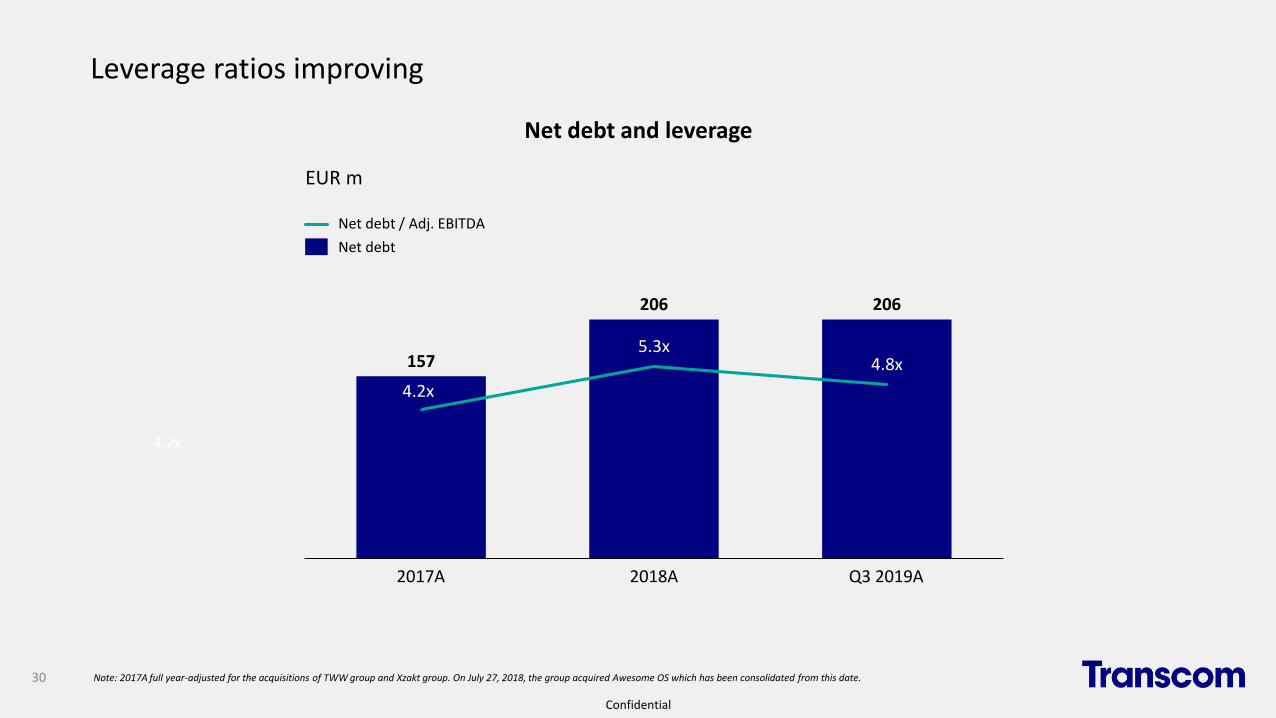
Leverage ratios improving
30
157
206 206
4.2x
5.3x4.8x
4.2x
2017A Q3 2019A2018A
Net debt
Net debt / Adj. EBITDA
EUR m
Note: 2017A full year-adjusted for the acquisitions of TWW group and Xzakt group. On July 27, 2018, the group acquired Awesome OS which has been consolidated from this date.
Net debt and leverage

Confidential
Summary

Confidential
32
Improve operational efficiency
Grow in attractive segments
Develop delivery model
Expand digital
Support with M&A
Profitable growth with
double-digit EBITDA margin
(1) As of Q3 2019 LTM.
EUR 27m cost-out (1)
67% in growth sectors (1)
34% near-/off-shore delivery (1)
Challenger position for digital
Strategic objectives

Confidential
Appendix

Confidential
2019• Acquisition of tms connected! outside of the bond
group, creating a center of excellence for utilities and strengthening exposure to German market
• Carve-out of ASA Informationsdienste GmbH (DPV), further strengthening the position on the German market
• Establishing an innovation hub
• Opening of the IT Development Hub in Zagreb
Transcom: Founded in 1995 – taken-private by Altor 2017 – transformation since then
2007Strengthening of the presence in the NorthAmerican market with the acquisition of NuComm International
2001Listing on the OMX Nordic Exchange
2009Opening of two new sites in the Philippines and doubling the capacity on that market
2004Expansion into Hungary with the acquisition of customer management business MarketLink
2002Acquisition of a majority stake in a Spanish customer management business, Gestel
2017• Taken-private by Altor
• Acquisition of Xzakt Kundrelation AB
• Start of the transformation program: People, Passion, Performance
1995Founded by Swedishinvestment company Kinnevik, as a customer service outsourcing to a division of Tele2
1995 20202000 2005 2010 2015
2018• First-time public debt issuance of EUR 180M 6.5% senior secure notes due 2023
(currently Moody’s: B3 / S&P: B-)
• Acquisition of Awesome OS and strengthening digital capabilities as well as focus on the e-commerce industry
• Expansion to Albania by take-over of a site in Durres
MarketLink
Today
34

Confidential
E/O items driven by specific initiatives and events of non-operational nature
35
1.8
9.8
1.3 1.1 0.3
3.5
0.2
E/O items by quarter, EUR m
Restructuring cost PPP
Consultancy support for PPP
Acquisition and divestitures
Legal claims and settlements with clients
1.02.7
0.11.0
0.2 0.20.0
3.2 2.70.4 1.4
-1.6
0.30.0
8.1
0.2 0.8 1.60.1 0.10.0
Management restructuring and other 0.3 0.3
1.0
Q1 2018 Q1 2019Q2 2018
0.0
Q3 2018 Q4 2018 Q2 2019 Q3 2019
0.0 0.0 0.0
Comments:
• Exiting unprofitable contracts• Severance cost• Onerous leases
• Acquisitions of Transcom, Awesome, Durrës, ASA
• Divestments of Chile, Legal services
• Transformation support
• Spain social cost claim • Client settlement• Other claims
• Management restructuring


