
Jesse Iivonen
ALTERNATIVE DESIGN FOR STEEL
ROOF TRUSS
Technology and Communication2014

VAASAN AMMATTIKORKEAKOULUUNIVERSITY OF APPLIED SCIENCESRakennustekniikka
ABSTRACT
Author Jesse IivonenTitle Alternative Design for Steel Roof TrussYear 2014Language EnglishPages 48 + 1 AttachmentName of Supervisor Tapani Hahtokari, Simon Nyman
This thesis work was done for Wärtsilä Power Plants. The idea and the content ofthis subject came up during the summer 2013 while I was working for Wärtsilä asa summer trainee.
The purpose of this work is to give an alternative solution for the existing rooftruss when radiators are located on top of the roof. The current solution is relative-ly new and it was implemented in a short period of time of the moment when theidea of radiators being on top of the roof was introduced.
Most of the Wärtsiläs power plants are located on earthquake zones. This meantthat seismic calculation needed to be done for this work. The structural modelingof the structure is done with Autodesk Robot Structural Analysis Professional2014 and the load calculations are done with Microsoft Excel. The seismic loadsare calculated based on response spectrum method and the calculations are donewith Autodesk Robot Structural Analysis Professional 2014.
The results of this work were better than expected. The new geometry of the rooftruss proved to be lighter and stiffer than the current truss. It also increased thenatural frequencies of the whole structure compared to the existing one. Due tothese factors also the support reactions of the whole structure decreased around 10%.
Keywords Steel, roof truss, seismic design
VAASAN AMMATTIKORKEAKOULURakennustekniikka
TIIVISTELMÄ
Tekijä Jesse IivonenOpinnäytetyön nimi Vaihtoehtoinen suunnittelu kattoristikolleVuosi 2014Kieli englantiSivumäärä 48 + 1 liitettäOhjaaja Tapani Hahtokari, Simon Nyman
Tämä työ on tehty Wärtsilä Power Plantsille. Aiheen idea ja sisältö muodostuivatkesän 2013 aikana, kun työskentelin Wärtsilälle kesäharjoittelijana.
Työn tarkoituksena on antaa vaihtoehtoinen suunnittelumalli olemassa olevallekattoristikolle, kun radiaattorit ovat katolla. Nykyinen ratkaisu on suhteellisenuusi ja se otettiin käyttöön lyhyen ajan sisällä hetkestä jolloin idea radiaattoreidensijoittamisesta katolle esiteltiin.
Suurin osa Wärtsilän voimalaitoksista sijaitsevat maanjäristysalueilla, jotenseismiset laskelmat suoritettiin osana tätä työtä. Rakenteellinen mallintaminentehtiin Autodesk Robot Structural Analysis Professional 2014 ohjelmalla jakuormat laskettiin Microsoft Excelillä. Seismiset kuormat laskettiinvastespektrimenetelmällä ja laskelmat suoritettiin Autodesk Robot StructuralProfessional 2014 -ohjelmalla.
Tämän työn tulokset ovat parempia kuin työn lähtötilanteessa oletettiin.Kattoristikon uusi geometria osoittautui kevyemmäksi sekä jäykemmäksi kuinnykyinen ristikko. Se kasvatti myös koko rakenteen ominaistaajuksia verrattunaolemassa olevaan ristikkoon. Ja näiden tekijöiden johdosta myös koko rakenteentukireaktiot laskivat suunnilleen 10 %.
Avainsanat Teräs, kattoristikko, maanjäristyssuunnittelu

1
TABLE OF CONTENTS
ABSTRACT
TIIVISTELMÄ
1 INTRODUCTION ....................................................................................... 10
1.1 General Information ............................................................................. 10
1.2 Company .............................................................................................. 10
1.3 Power Plants ........................................................................................ 10
2 STANDARDS ............................................................................................. 12
2.1 Eurocodes ............................................................................................ 12
2.2 UBC – Uniform Building Code ............................................................ 12
3 PROGRAMS ............................................................................................... 13
3.1 Windows Excel .................................................................................... 13
3.2 Mathcad ............................................................................................... 13
3.3 Autodesk Robot Structural Analysis Professional ................................. 13
4 PROJECT .................................................................................................... 14
5 LOADS ....................................................................................................... 15
5.1 Dead Loads .......................................................................................... 15
5.1.1 Roof Panels............................................................................... 16
5.1.2 Radiators .................................................................................. 16
5.1.3 Radiator and Roof Fan Service Platform Steels ......................... 16
5.2 Live Loads ........................................................................................... 17
5.2.1 Wind ......................................................................................... 17
5.2.2 Crane Load ............................................................................... 19
5.3 Seismic Loads ...................................................................................... 19
5.3.1 Elastic Response Spectrum ....................................................... 20
5.3.2 Design Response Spectrum for Elastic Analysis ........................ 21
5.3.3 Behavior Factor ........................................................................ 23
5.3.4 Soil Type .................................................................................. 23
6 ANALYSIS ................................................................................................. 25
6.1 Lateral Force Method ........................................................................... 25
6.2 Modal Analysis .................................................................................... 26
2
6.2.1 Single-Degree-of-Freedom System ........................................... 26
6.2.2 Multiple-Degree-of-Freedom System ........................................ 27
7 STRUCTURAL DESIGNING OF ROOF TRUSS ....................................... 29
7.1 Diagonals ............................................................................................. 29
7.1.1 Compressed Diagonals .............................................................. 29
7.1.2 Diagonals Under Tension .......................................................... 30
7.2 Verticals ............................................................................................... 31
7.3 Upper Chord ........................................................................................ 31
7.3.1 Shear Buckling ......................................................................... 35
7.3.2 Resistance of a Web for Local Concentrated Loads ................... 35
7.4 Lower Chord ........................................................................................ 38
7.5 Connections ......................................................................................... 38
7.5.1 Welded connections .................................................................. 38
7.5.2 Bolted Connections ................................................................... 43
8 CONCLUSION ........................................................................................... 47
RESOURCES .................................................................................................... 48
APPENDICES

3
LIST OF FIGURES AND TABLES
Figure 1. Elastic response spectrum, type1 s. 21
Figure 2. Design spectrum for elastic analysis s. 22
Figure 3. Single-degree-of-freedom system (SDOF) s. 26
Figure 4. Multiple-degree-of-freedom system s. 27
Figure 5. Matrix equation for two-degree-of-freedom system s. 28
Figure 6. Equation for a member which is under axial compression and bending
s. 32
Figure 7. Picture 7 equation, buckling prevented s. 32
Figure 8. Alternative method 2 for interaction factors s. 34
Figure 9. Table for Cmy s. 35
Figure 10. Yielding of the web under local concentrated load s. 36
Figure 11. Local buckling of the web under concentrated load s. 36
Figure 12. Concentrated load is distributed via shear of the web s. 37
Figure 13. Failure types of welded connections s. 39
Figure 14. Equations for connection resistance s. 40
Figure 15. Changes for KN type connections s. 41
Figure 16. Equation for combination of normal force and moment s. 41
Figure 17. Moment resistance of RHS members s. 42
Figure 18. Explanation for bolt connection distances s. 45
Table 1. Effects of different soil types s. 23

4
APPENDICES
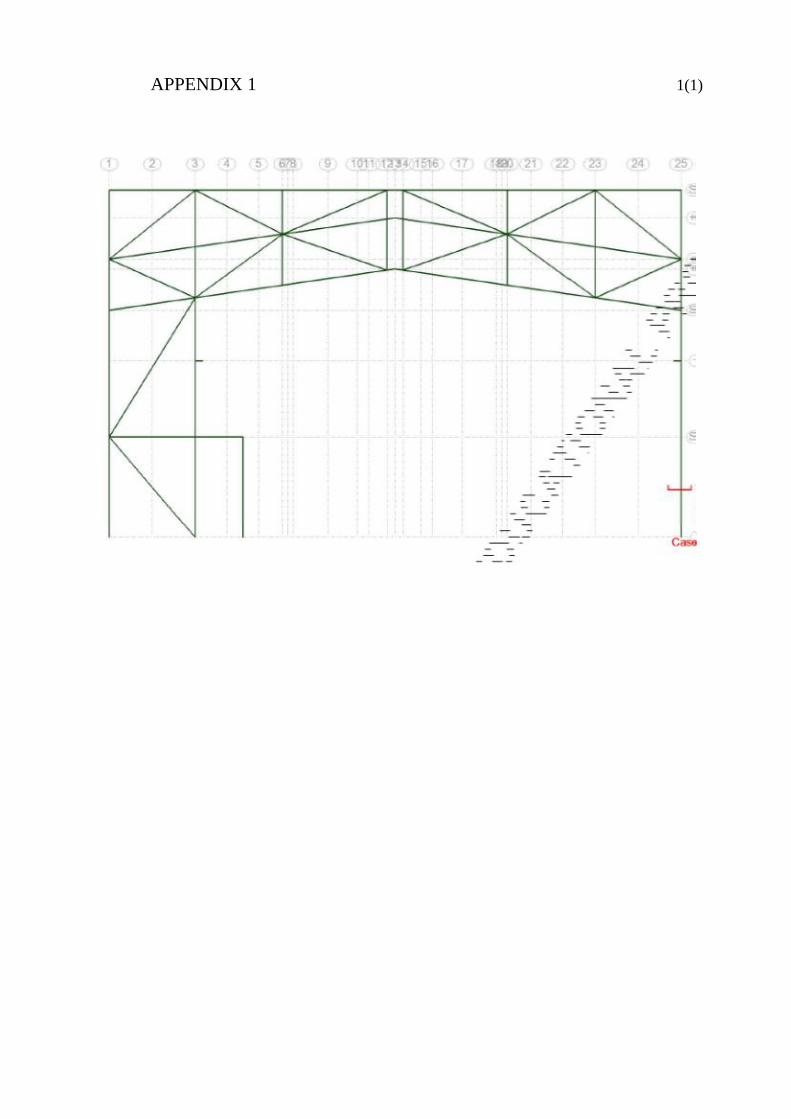
APPENDIX 1. New geometry of the roof truss
5
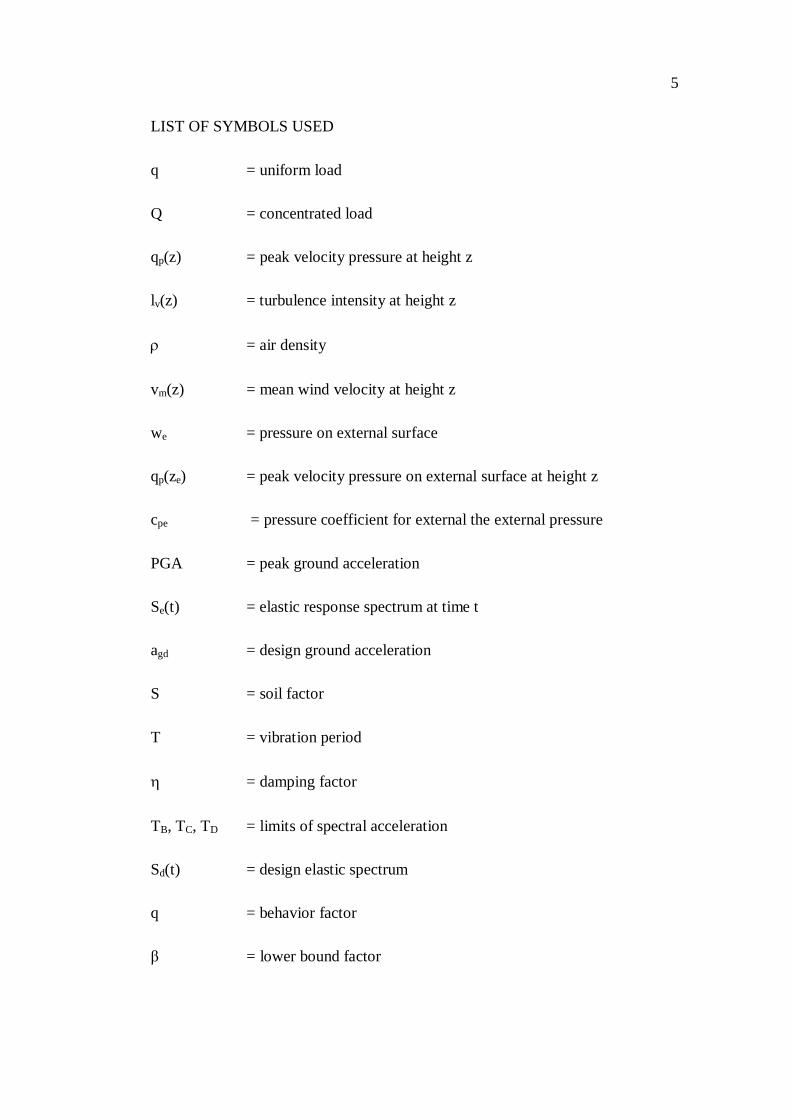
LIST OF SYMBOLS USED
q = uniform load
Q = concentrated load
qp(z) = peak velocity pressure at height z
lv(z) = turbulence intensity at height z
r = air density
vm(z) = mean wind velocity at height z
we = pressure on external surface
qp(ze) = peak velocity pressure on external surface at height z
cpe = pressure coefficient for external the external pressure
PGA = peak ground acceleration
Se(t) = elastic response spectrum at time t
agd = design ground acceleration
S = soil factor
T = vibration period
h = damping factor
TB, TC, TD = limits of spectral acceleration
Sd(t) = design elastic spectrum
q = behavior factor
β = lower bound factor
6
Fb = base shear force
m = mass
λ = correction factor
H = height
T1 = fundamental period
Ct = factor depending on structure type
c = damping coefficient
k = stiffness coefficient
x = displacement
ẋ = velocity
ẍ = acceleration
f = excitation force
M = mass matrix
C = damping matrix
K = stiffness matrix
F = excitation matrix
NEd = designing compressive strength
Nb,Rd = designing buckling resistance under compression
A = cross-sectional area
fy = materials yield strength
7
γM1 = partial factor
κ = reduction factor
ϕ = equation that takes consideration buckling curve and non-
dimensional slenderness
λk = non-dimensional slenderness
NEd = design normal force
NRd = yield strength
My,Ed = design bending moment
xy = reduction factor
xLt = reduction factor
kyy = interaction factor
κy = reduction factor
κLt = reduction factor
αLt = imperfection factor
Mcr = elastic critical moment
Cmy = equivalent uniform moment
hw = height of the web
tw = thickness of the web
η = reduction factor
FRd = resistance of the web in relation to local buckling
fyw = yield strength of the web
8
Leff = distribution width for the load in top part of the web
κf = reduction factor for local buckling
ly = effective loading length
Fd = design concentrated load
NRd ,WQ = yield strength of the WQ-beam
AWQ = cross-sectional are of the WQ-beam
RHS = rectangular hollow section
Fv,Rd = shear resistance
fub = ultimate tensile strength of a bolt
A = cross-sectional area
As = cross-sectional area of one bolt in area of screw thread
γM2 = partial factor
fu = ultimate tensile strength
d = diameter
d0 = diameter of the hole
t = smaller thickness of the two connected materials
p1 = distance between two holes, along the direction of the load trans-
fer
p1 = distance between two holes, perpendicular to the direction of the
load transfer
e1 = distance between hole and the edge of the plate, along the direc-
tion of the load transfer
9
e2 = distance between hole and the edge of the plate, perpendicular to
the direction of the load transfer
Veff,1,Rd = block tearing resistance
Ant = net area, under tension
Anv = net area, under shear
Rd = selected resistance of the connection
yov = over strength factor
Rfy = resistance of a member
10
1 INTRODUCTION
1.1 General Information
The purpose of this thesis work was to create and design an alternative solution(s)
for the current roof truss of engine halls with 32/34 engines and radiators on the
roof. The current roof truss is a relatively new solution and has been taken into
use when radiators were designed so that they are on top of the roof. Coming as a
totally new layout design on civil perspective, the current truss with radiators on
top of it is not the finest and structurally the most effective solution. Radiators are
going to be on the roof of the engine hall in the most part of Wärtsilä’s upcoming
projects. This solution provides the best efficiency ratio for the radiators and also
saves a lot of land space of the site. Because Wärtsilä is a global company and
supplies power plants all over the world, in every project there are different loads
and climate conditions depending on the country where the project is delivered. In
this thesis all the characteristic values, such as wind speed and earthquake magni-
tude according to Borneo, Indonesia, have been taken into account. Indonesia is
an active country for Wärtsilä power plant deliveries.
1.2 Company
Wärtsilä Corporation is a worldwide leading company in providing energy solu-
tion to its customers. The company supplies power solutions for marine and pow-
er plant markets. Wärtsilä has close to 19 000 employees in 70 countries around
the world. Wärtsilä can offer different project types for customers from material
delivery to turnkey projects. Professional project management is one of Wärtsilä’s
strengths on the markets. /1/
1.3 Power Plants
Wärtsilä supplies power plants globally. Wärtsilä’s leading technology and its
wide selection of solutions gives a variety of choices for the customers. Power
plants can be running on oil, gas and multi-fuel engines. Selection of engine sizes

11
together with multiple fuel options gives Wärtsilä the leading position on lifecycle
energy markets. /1/
12
2 STANDARDS
2.1 Eurocodes
The Eurocodes are harmonized building standards within Europe. The Eurocodes
include ten different codes from EN 1990 to EN 1999. These different codes are
common reference codes in Europe and it is mandatory for all EU countries to de-
sign according to the Eurocodes. As the Eurocodes are being reference codes for
design, every country may include additional and detailed information to its Na-
tional Annex. All the sections where the National Annex may be applied are
marked in the Eurocodes. /3/
Calculations and design in this thesis are done according to the Eurocodes, despite
the fact that the design building will be located in Asia. This point has to be con-
sidered in mentioned parts of the design. Seismic loads are calculated according to
EN 1998. In most Wärtsilä projects, seismic calculations are done according to
UBC 1997 (Uniform Building Code). All the values that are related to seismic
calculations have been selected based on building location and corresponding val-
ues in UBC 1997.
2.2 UBC – Uniform Building Code
The UBC is a series of building codes that includes three volumes. The Uniform
Building Code is the most used building standard in the United States of America.
The UBC has been adopted widely in the US because it meets government’s ne-
cessities. The three volumes of the UBC define everything from administrative
provisions to structural engineering regulations and installation requirements. /4/
The Uniform Building Code is not the design code that is used in this thesis due to
the fact that the Eurocodes are the standards used in Finland and therefore also
applied in this thesis.
13
3 PROGRAMS
3.1 Windows Excel
Windows Excel is Microsoft’s table calculation program. In this thesis it is used
for wind calculations, diagonal member calculations and connection calculations.
3.2 Mathcad
Matchcad is a computer based calculation program by PTC. It is suitable for al-
most all kind of calculations, especially for engineering and scientific use. In this
thesis Mathcad is used to calculate and to draw graphs for response spectrums.
3.3 Autodesk Robot Structural Analysis Professional
Autodesk Robot Structural Analysis Professional is a structural modeling and cal-
culation program. In this thesis, it is used for creating a static structural model of
one module line of the engine hall. Finite element method (FEM) calculations are
made with this program.
14
4 PROJECT
Location:
- The project is located in Indonesia on the island of Borneo.
Year:
- The project has started in the late 2013 and is scheduled to be finished in
2014.
Engines:
- The engine type is 32/34 and the project contains 16 engines which are di-
vided into two similar engine halls.
Engine hall measurements:
- One engine hall is 65 m wide, 21.45 m deep and its total structural height
is 12.935 m.
Radiators:
- Radiators are located on the roof of engine halls.
15
5 LOADS
Loads are basically actions that impose forces to the structure. Loads are divided
into sub-categories of dead loads, live loads, accidental loads and seismic loads.
Load cases and combinations are determined by combining actions. These cases
have to be formed by taking together actions which are able to act at the same
time. Every combination has a leading variable action and accompanying variable
actions. Accompanying variable actions are reduced with reduction factors ac-
cording to the Eurocodes. Every combination has also permanent actions. Acci-
dental and seismic combinations are made according to the Eurocode EN 1990. /2/
Permanent or dead loads are actions which are assumed to act during the whole
time of the designed building age and they are assumed to remain unchanged.
Permanent loads are mainly self-weight of structures and other permanent parts of
the building. /2/
Live or imposed loads are actions that vary during time. They are categorized ac-
cording to building types and building importance. Most common variable actions
are people, furniture, wind and snow. /2/
In addition to these load types, there are installation loads. Installation loads are
actions that occur and act during construction and have to be considered in the
design of structures. /2/
5.1 Dead Loads
Dead loads which are taken into account in calculations are gathered from
Wärtsilä standard loads. In these calculations dead loads consists of self weight of
the frame, roof panels and radiators. The weight of the roof panels has been con-
verted into uniform load for the lower chord of the roof truss. The weight of the
radiators has been divided and converted into five concentrated loads for the up-
per chord of the roof truss, according to locations of radiator support beams. The-
se conversions have been made because calculations and modeling are done with
only one module of the Engine hall. Module spacing is 5.4 m.
16
5.1.1 Roof Panels
150 mm roof panels = 0.5 kN/m2
The uniform load for the lower chord of roof truss =>
= 0,52
× 5,4 = 2,7
5.1.2 Radiators
The operating weight per radiator unit is 4370 kg. In calculation this weight is
converted to 50 kN.
In this example project there are five radiator support beams for the radiator. The
radiators are in a line along the building length on both edges of the roof. The
width of one radiator unit is 2.5 m.
Two edge support beams =>
= 50
(3 × 2 × 2,5 )× 5,4 = 18
Three support beams in the middle =>
= 50
(3 × 2,5 )× 5,4 = 36
5.1.3 Radiator and Roof Fan Service Platform Steels
The weight of the platform steels is approximately 450 kg/m. In calculation this
weight is converted to 4.5 kN/m. This weight is applied to two beams under the
service platforms.

17
=4,5
2 × 5,4 = 12,42
5.2 Live Loads
Live loads consist of wind and standard live load on the roof. Wind actions are
calculated based on Wärtsilä standard wind speed of 100 mph (44.5 m/s). The
height of the 32/34 engine hall is 12.9 m including roof truss and radiator sup-
ports. Live load on the roof is 0.75 kN/m2.
5.2.1 Wind
Peak velocity pressure
Peak velocity pressure is the biggest pressure that wind causes to the surface of
the building, calculated at different heights. In the Eurocodes, peak velocity pres-
sure is marked as qp(z). /5/
qp(z)=[1+7*lv(z)]*12*r*v2
m(z)
qp(z) = peak velocity pressure at height z
lv(z) = turbulence intensity at height z
r = air density
vm(z) = mean wind velocity at height z
Wind actions are calculated based on wind speed of 30 m/s. When calculating the
peak velocity pressure according to expression for qp(z), the factor 7 is based on
the Eurocodes calculations of peak factor. Peak factor calculations are based on
structure frequencies, mean wind velocities and aerodynamic functions. Peak fac-

18
tor of 3.5 is applied to get the factor 7 in the expression for qp(z). This factor 7 is
used in calculations for this thesis and it has not been checked with more specific
calculations. Turbulence intensity, air density and mean wind velocity are defined
according to the Eurocodes and specific values are in the attached calculations. /5/
Wind pressure on surfaces
Forces that wind causes to the structure can be defined as pressures on the surfac-
es. These pressures are calculated according to the equation below. Wind causes
pressure to the external and internal surfaces and both of them are considered to
be acting at the same time. In calculations wind direction is either 0° or 90° in re-
spect to the building facade. External and internal pressures are calculated with
the same equation only with the change of pressure coefficient. Pressure coeffi-
cients are interpolated according to tables in the Eurocode 1991-1-4. Interpola-
tions are done by relation between the height and depth of the building for the
walls and by the pitch angle of the roof when calculating the pressures for the
roof. The specific calculations are found attached.
we=qp(ze)*cpe
we = pressure on external surface [kN/m2]
qp(ze) = peak velocity pressure on external surface at height z
cpe = pressure coefficient for external the external pressure
In this thesis, wind loads are modeled by the following method.
- Walls: As a uniform load gathered from external wind pressure on surface.
- Roof truss/radiator support structure: As two concentrated loads, acting to
the lowest point of the roof truss and to the highest point of the truss.
19
5.2.2 Crane Load
Crane loads are most commonly seen in industrial halls. There can be several
cranes in one building which are supported by crane beams. Cranes create wheel
load and transverse wheel load for the supporting beams. There are cranes of dif-
ferent weight depending on their lifting capacity. For example, in this thesis crane
loads are calculated based on two-two-ton cranes.
5.3 Seismic Loads
Seismic design has to be applied in the regions where earthquakes and seismicity
are possible events to occur. When designing buildings for the seismic resistance
according to the Eurocodes, the National Annexes of each country gives their own
input to the design. The national Annex was not available for this thesis because
the project is located outside Europe. In calculations of the seismic design in this
work, recommended values by the Eurocodes are applied for all the sections
where the National Annex could have been used. /6/
Design seismic action is the response of the structure under seismic event calcu-
lated according to the standards. Earthquakes, which are the most common events
caused by seismicity, can affect different kinds of forces for the structure from
ground motion to ground acceleration and time-history representation. Mostly
used force caused by earthquakes among structural engineering is peak ground
acceleration (PGA). It is calculated according to horizontal and vertical compo-
nents of ground acceleration and is comparable with the probability to occur every
50 years. Using FEM calculations, these forces of seismicity are modeled and cal-
culated according to response spectrums of elastic analysis and modal analysis.
Design spectrum for elastic analysis is the most commonly used analysis method
nowadays. /6/
Even though calculations can and should be done to protect the structures in case
of seismic event, they are all based on saving human lives in situations of earth-
quakes and other seismic events. In addition to saving human lives, seismic design
is done according to requirements of no global or local collapse and to require-
20
ment that the bearing structures stay operational for more seismic events than it is
designed. /6/
5.3.1 Elastic Response Spectrum
Elastic response spectrum is a graph which describes the maximum response val-
ue of single-degree-of-freedom (SDOF) system for certain excitation as function
of fundamental period. There are two types of elastic spectrums and they have to
be checked in both horizontal and vertical directions. The choice between spec-
trum type 1 and type 2 depends on the magnitude level on the surface and it can
be defined in the National Annex. In this thesis, calculations are done with both
types. Vertical component is calculated with the same equations, only the design
ground acceleration agd is changed to avg according to avg / agd = 0.45 / 0.90. /7/
/11/ See Figure 1.
0 < T < TB: Se(t)=agd*S*[1+T/TB*(h*2,5+1)]
TB < T < TC: Se(t)=agd*S*h*2,5
TC < T < TD: Se(t)=agd*S*h*2,5*[T/TC]
TD < T 4s: Se(t)=agd*S*h*2,5*[TC*TD/T2]
Where:
Se(t) = elastic response spectrum at time t
agd = design ground acceleration
S = soil factor
T = vibration period
h = damping factor
TB, TC, TD = limits of spectral acceleration
21
0 1 2 3 40
1
2
3
Se(T)
Se/a
g
Se1 T1( )ag
Se2 T2( )ag
Se3 T3( )ag
Se4 T4( )ag
T1 T2, T3, T4,
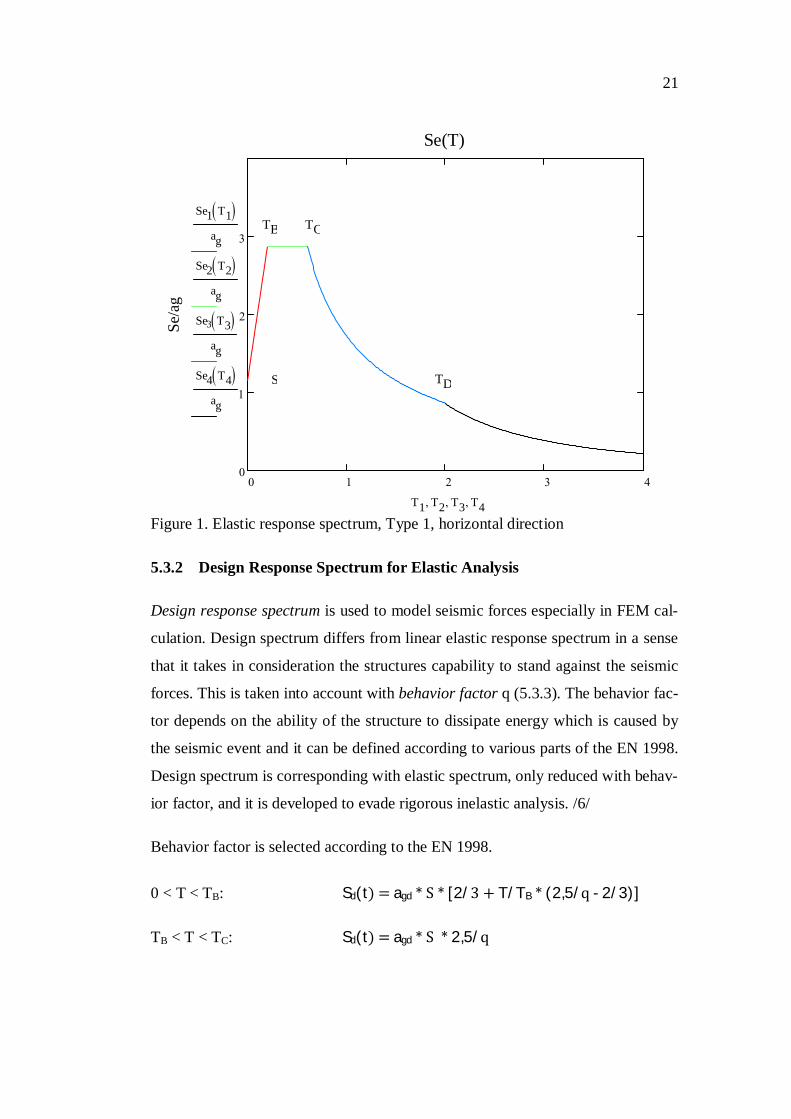
Figure 1. Elastic response spectrum, Type 1, horizontal direction
5.3.2 Design Response Spectrum for Elastic Analysis
Design response spectrum is used to model seismic forces especially in FEM cal-
culation. Design spectrum differs from linear elastic response spectrum in a sense
that it takes in consideration the structures capability to stand against the seismic
forces. This is taken into account with behavior factor q (5.3.3). The behavior fac-
tor depends on the ability of the structure to dissipate energy which is caused by
the seismic event and it can be defined according to various parts of the EN 1998.
Design spectrum is corresponding with elastic spectrum, only reduced with behav-
ior factor, and it is developed to evade rigorous inelastic analysis. /6/
Behavior factor is selected according to the EN 1998.
0 < T < TB: Sd(t)=agd*S*[2/3+T/TB*(2,5/q-2/3)]
TB < T < TC: Sd(t)=agd*S*2,5/q
S TD
TCTB

22
0 1 2 3 40
1
2
Sd(T)
Se/a
g
Sd1 T1( )ag
Sd2 T2( )ag
Sd3 T3( )ag
Sd4 T4( )ag
T1 T2, T3, T4,
TC < T < TD: Sd(t) =agd*S*2,5/q*[TC/T]≥ b*agd
TD < T 4s: Sd(t) =agd*S*2,5/q*[TC*TD/T2]≥ b*agd
Where:
Sd(t) = design elastic spectrum
q = behavior factor = 1.5
β = lower bound factor = 0.2
Figure 2. Design spectrum for elastic analysis
S
TB TC
TD
23
5.3.3 Behavior Factor
The behavior factor q is mentioned and defined in various parts of the EN 1998.
Basically the behavior factor takes into consideration the full theoretical elastic
response of the structure, including damping, to seismic forces and compares it to
the response of the structure to seismic forces with elastic response designing val-
ues. This ratio of behavior factor is an approximation and as simplified it reflects
for the capability of the structure to absorb energy caused by seismic even. It is
given to different materials separately. /7/
The decision to use the behavior factor of 1.5 was decided according to the EN-
1998-1-4 section 6.3.2. The structures belong to ductility class medium and cross-
sectional classes one and two. With this information the behavior factor could
have been up to 4, however that would have required more accurate justifications.
Using the behavior factor of 1.5 ensures that analysis stay on satisfying results. /8/
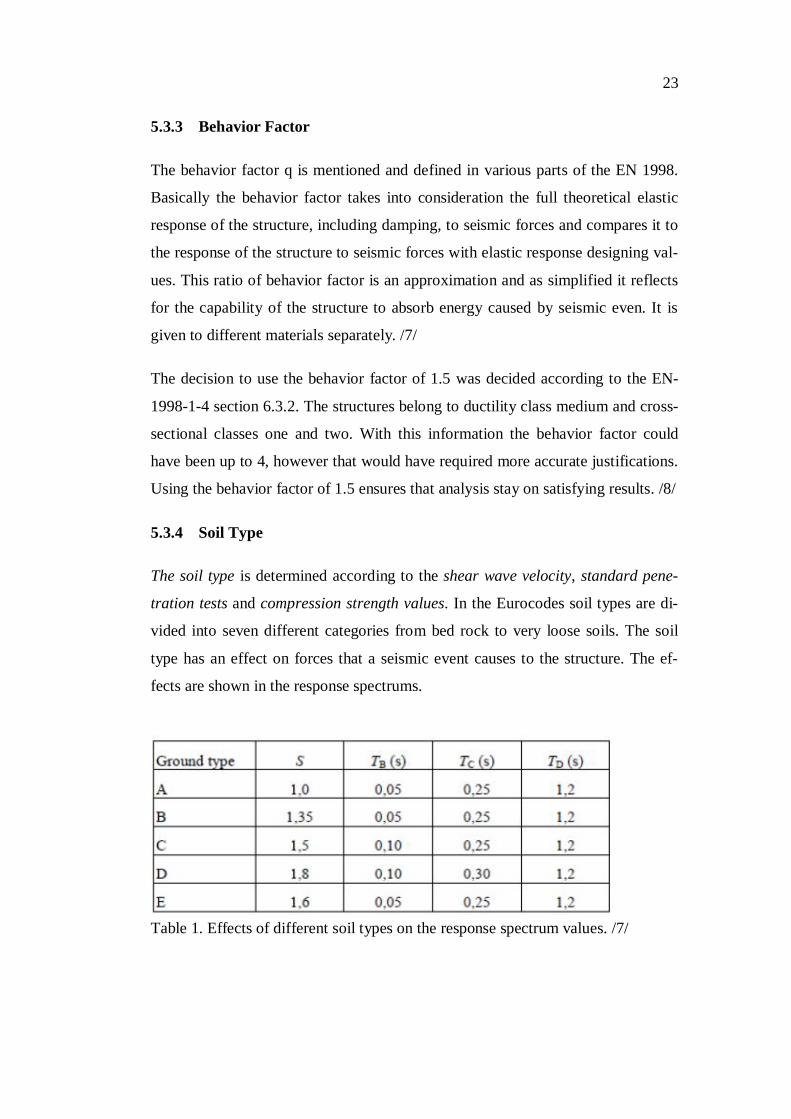
5.3.4 Soil Type
The soil type is determined according to the shear wave velocity, standard pene-
tration tests and compression strength values. In the Eurocodes soil types are di-
vided into seven different categories from bed rock to very loose soils. The soil
type has an effect on forces that a seismic event causes to the structure. The ef-
fects are shown in the response spectrums.
Table 1. Effects of different soil types on the response spectrum values. /7/
24
The soil type used in this thesis is C. The choice to use this soil type is based on
the corresponding type and values of UBC 1997. This corresponding soil type is
marked as SD in UBC 1997 and its general description is stiff soil. This is the as-
sumption of which soil type to be used in Wärtsilä projects before more specific
ground inspections are made. /4/
25
6 ANALYSIS
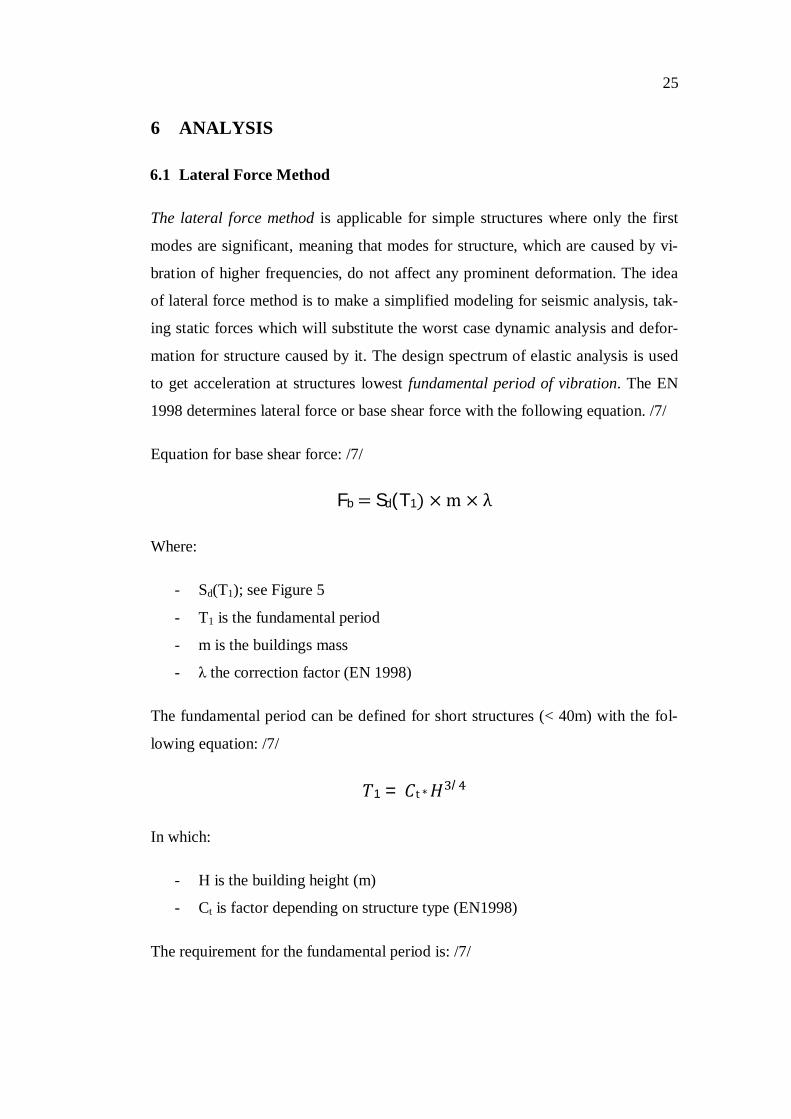
6.1 Lateral Force Method
The lateral force method is applicable for simple structures where only the first
modes are significant, meaning that modes for structure, which are caused by vi-
bration of higher frequencies, do not affect any prominent deformation. The idea
of lateral force method is to make a simplified modeling for seismic analysis, tak-
ing static forces which will substitute the worst case dynamic analysis and defor-
mation for structure caused by it. The design spectrum of elastic analysis is used
to get acceleration at structures lowest fundamental period of vibration. The EN
1998 determines lateral force or base shear force with the following equation. /7/
Equation for base shear force: /7/
Fb=Sd(T1)×m×λ
Where:
- Sd(T1); see Figure 5
- T1 is the fundamental period
- m is the buildings mass
- λ the correction factor (EN 1998)
The fundamental period can be defined for short structures (< 40m) with the fol-
lowing equation: /7/
1 = t*/
In which:
- H is the building height (m)
- Ct is factor depending on structure type (EN1998)
The requirement for the fundamental period is: /7/

26
1≤ 4 ∗ c2
6.2 Modal Analysis
When vibrations caused by external factors get in touch with a structural system,
the structure will start to vibrate. At some specific frequency of vibration the
whole structure will change its shape. This will be repeated with countless of fre-
quencies and with each of them the structure will move to a different shape. The
modal analysis in structural engineering is the tool that is used to calculate and
estimate these shapes and the frequencies that cause them. Frequencies at which
the structure will move are called natural frequencies and different shapes that
structure will form at each frequency are modes. Each structure has multiple natu-
ral frequencies.
Each structure has a mass and stiffness. In addition structural systems may have
dampers. Natural frequencies and corresponding modes of the structure are calcu-
lated in modal analysis using mass, stiffness and damping factors.
6.2.1 Single-Degree-of-Freedom System
Figure 3. Single-degree-of-freedom system (SDOF). /10/
In the single-degree-of-freedom system the contents of mass, stiffness, damping,
movement and force are the acting parts. Mass can only move to a certain direc-
tion. It is the simplest way to describe structure for the modal analysis, but in real-
ity there are rarely structures which can be defined as single-degree-of-freedom
systems.

27
The equation for the single-degree-of-freedom system is: /10/
mẍ(t)+cẋ(t)+kx(t)=f(t)
In which:
- m represents mass
- c represents damping
- k represents stiffness
- x represents displacement (in certain direction) of mass
- ẋ represents displacements first time derivative, velocity
- ẍ represents displacements second time derivative, acceleration
- f represents excitation force
The homogenous solution of equation and the natural frequency can be solved by
taking f (t) as 0 and calculating it with differential theory. With the help of La-
place variable, the roots for characteristic equation and furthermore the damped
natural frequency can be solved.
6.2.2 Multiple-Degree-of-Freedom System
Figure 4. Multiple-degree-of-freedom system. This picture is example for two-
degrees. /9/
The multiple-degree-of-freedom (MDOF) system demonstrates the real structures
in the most accurate way. In MDOF one mass content can have six degrees of
28
freedom which means that it is allowed to move in x, y and z direction and twist
around x, y and z axels. In MDOF, the calculation will be done in a way that in-
stead of just single content of mass, damping, stiffness and force, there will be
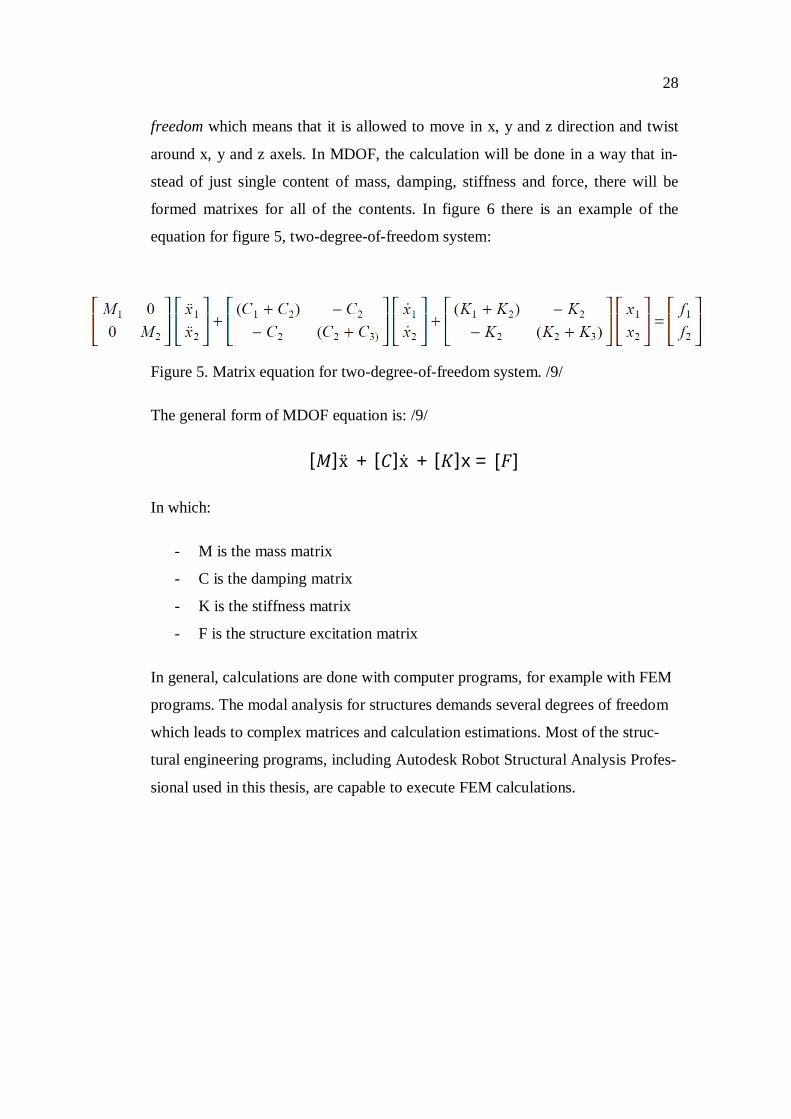
formed matrixes for all of the contents. In figure 6 there is an example of the
equation for figure 5, two-degree-of-freedom system:
Figure 5. Matrix equation for two-degree-of-freedom system. /9/
The general form of MDOF equation is: /9/
[ ]ẍ + [ ]ẋ + [ ]x = [ ]
In which:
- M is the mass matrix
- C is the damping matrix
- K is the stiffness matrix
- F is the structure excitation matrix
In general, calculations are done with computer programs, for example with FEM
programs. The modal analysis for structures demands several degrees of freedom
which leads to complex matrices and calculation estimations. Most of the struc-
tural engineering programs, including Autodesk Robot Structural Analysis Profes-
sional used in this thesis, are capable to execute FEM calculations.
29
7 STRUCTURAL DESIGNING OF ROOF TRUSS
The design of structure always starts with calculating all the forces and defor-
mation that are caused for every structural part from external forces and loads.
Each structural part has to be able to withstand and distribute forces without col-
lapse or remarkable deflections.
The roof truss is designed to take vertical loads which are on top of the roof or
hanging from it inside the building. The truss is a good structural solution when a
relatively light structure is needed with a long span and minimum deflection, es-
pecially vertical bending. It also distributes wind loads to the bearing columns via
its diagonal components.
Geometrically the roof truss can be almost any kind, except some restrictions of
manufacturing point of view. Roof trusses can be made of steel or wood. The
equations, terms and standards used in this thsis are for steel truss.
7.1 Diagonals
The diagonals are designed either for buckling if they are under compression or
for yield if they are under tension. Diagonals do not take any moment with tradi-
tional calculations for the roof truss, even though welded connections between
diagonals and chords are not fully pinned or fixed. With a standard roof truss eve-
ry second diagonal is under compression and every second is under tension. In
this thesis, the new geometry of the roof truss will create a so called compression
arch, which leads to a situation where every second diagonal member is not com-
pressed and every second not tensioned.
7.1.1 Compressed Diagonals
The compressed diagonals are designed for buckling. The buckling resistance of
structural member depends on its length, slenderness, procedure of manufacturing
and reduction factor. The following equation needs to be fulfilled:
NEd≤Nb,Rd

30
Where:
- NEd is the designing compressive strength
- Nb,Rd is the designing buckling resistance under compression
Nb,Rd is defined with following expression for cross-sectional classes 1,2 and 3:
Nb,Rd=κ×A×fy/γM1
Where:
- A is profiles cross-sectional area [mm2]
- fy is materials yield strength
- γM1 is partial factor. For steel it is 1.0.
- κ is reduction factor
κ is calculated according to the Eurocodes with following expression:
= 1 ÷ ( + − λk )
κ needs to be smaller than 1.
Where:
- ϕ is an equation that takes buckling curve and non-dimensional slender-
ness into consideration. The EN 1993-1-1.
- λk is non-dimensional slenderness. The EN 1993-1-1.
7.1.2 Diagonals Under Tension
The diagonals under tension are designed for the yield strength of the member.
The following expression needs to be fulfilled.
NEd≤NRd
Where:
- NEd is designing yield force
31
- NRd is yield strength of diagonal member
NRd is calculated according to following expression:
NRd=fy×A
When the designing yield force is known from the static model, needed cross-
sectional area can be calculated from the equation above with the following ex-
pression:
A=NRd÷fy
After this, suitable cross-section can be chosen.
7.2 Verticals
The verticals are designed for buckling using the same expressions as were used
for diagonals under compression. The biggest normal force for verticals affects at
the both ends of the roof truss. All the other verticals are affected by a lot smaller
forces. Despite of the different forces affecting among the verticals, they are all
selected to be the same profiles with the end verticals. This is done according to
instructions from Wärtsilä and the main reason is to ease the manufacturing of the
truss and to keep extra safety in the design.
7.3 Upper Chord
The upper chord is designed for bending and compression. The Eurocodes has a
pattern which has to be followed when bending and compression are affecting at
the same time. The following equation is determined in the Eurocodes for mem-
bers under axial compression and bending.

32
Figure 6. Equation for a member which is under axial compression and bending.
/12/
Where:
- NEd is the design compressive force
- My,Ed is the design bending moment
- xy is the reduction factor (buckling regarding to y-axis)
- xLt is the reduction factor (lateral torsional buckling)
- kyy is the interaction factor according to the EN 1993
When a member is supported so that buckling cannot happen along the weak axis
of the member, the following equation can be adapted.
Figure 7. Equation for a member which is under axial compression and bending,
and buckling along the weak axel of the member is prevented. /13/
Where:
- κy is the reduction factor (buckling regarding to y-axis)
- κLt is the reduction factor (lateral torsional buckling)
Reduction factors κy and κLt are calculated according to following equations. /12/
y = 1 ÷ + − λk ≤ 1
κy determined earlier as κ in section 7.1.1.

33
Lt = 1 ÷ LT + LT − λLT ≤ 1
Where:
- ϕLt=0.5×[1+αLT(λLT−0.2)+λLT2]
- αLt is an imperfection factor given in table 6.3 in the EN 1993
- λLT= y × y ÷ cr
- Mcr is the elastic critical moment
The value of the interaction factor kyy is determined according to the Eurocode
1993 Annex B and the alternative method 2.
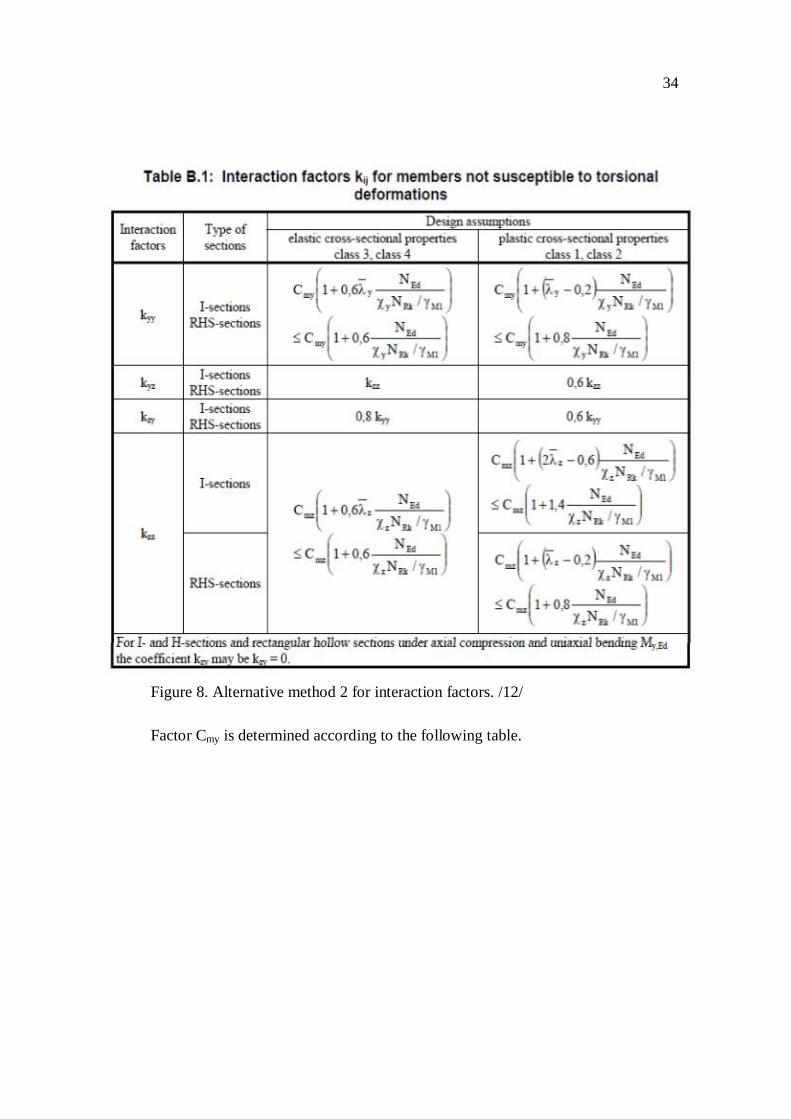
34
Figure 8. Alternative method 2 for interaction factors. /12/
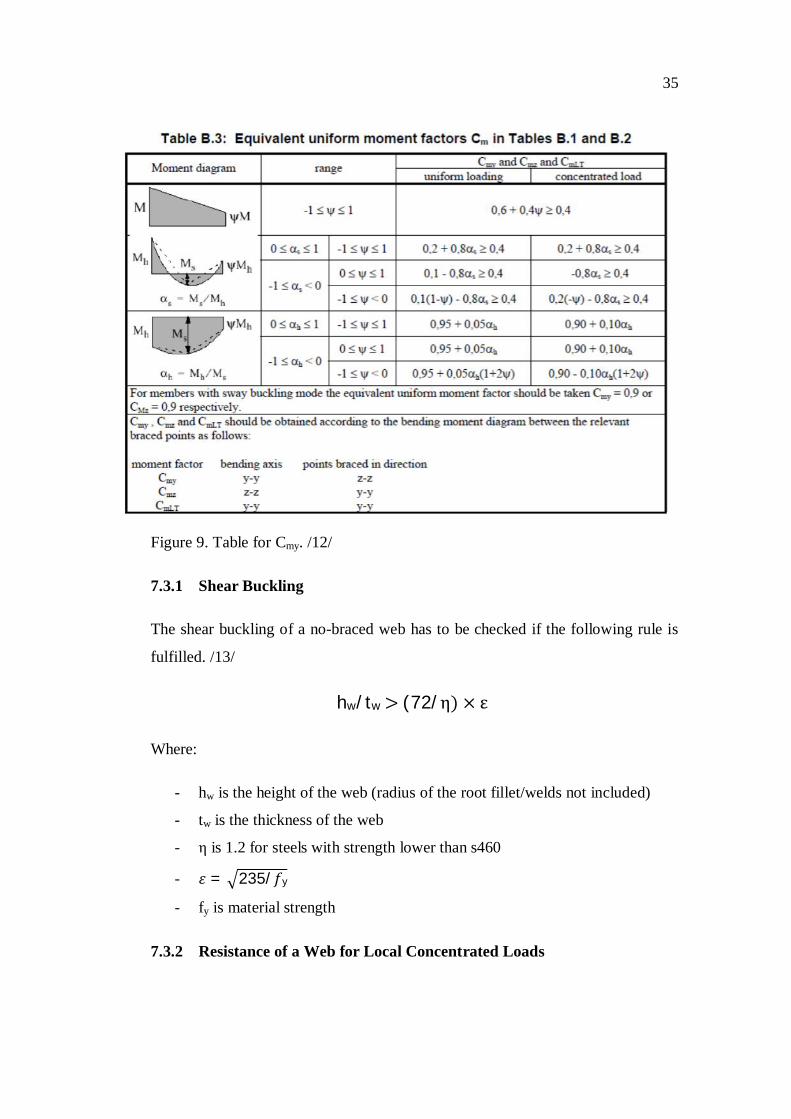
Factor Cmy is determined according to the following table.
35
Figure 9. Table for Cmy. /12/
7.3.1 Shear Buckling
The shear buckling of a no-braced web has to be checked if the following rule is
fulfilled. /13/
hw/tw>(72/η)×ε
Where:
- hw is the height of the web (radius of the root fillet/welds not included)
- tw is the thickness of the web
- η is 1.2 for steels with strength lower than s460
- = 235/ y
- fy is material strength
7.3.2 Resistance of a Web for Local Concentrated Loads
36
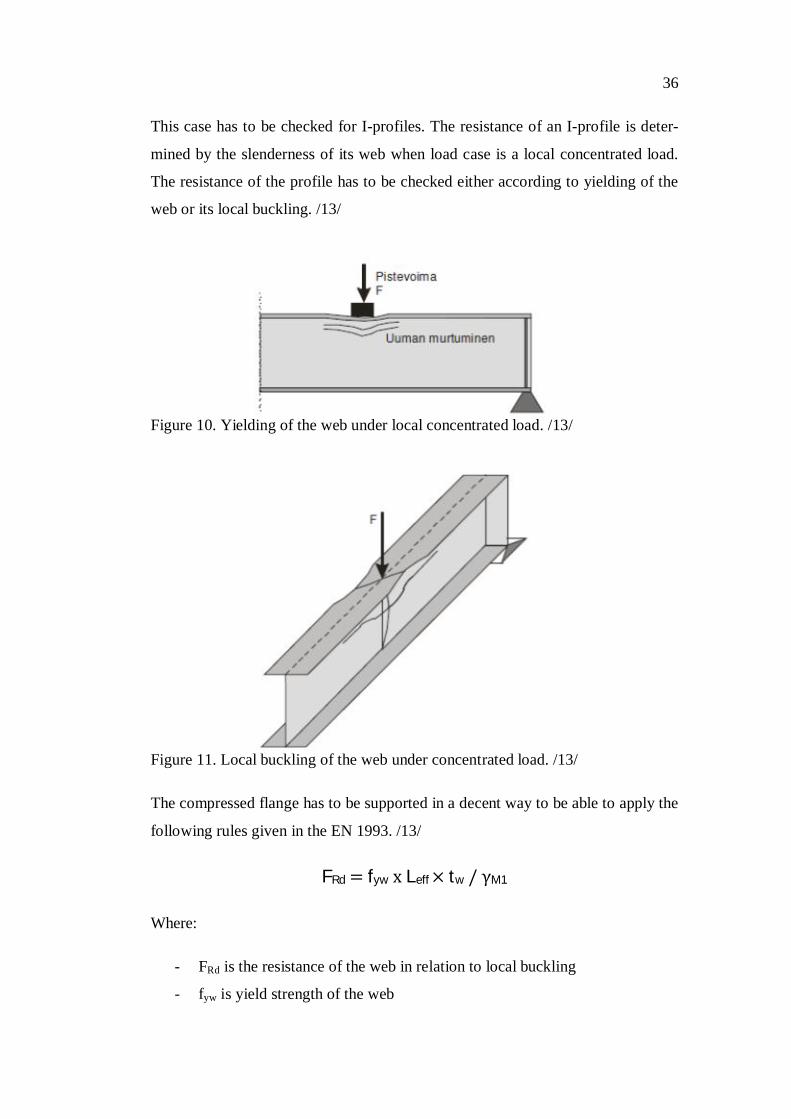
This case has to be checked for I-profiles. The resistance of an I-profile is deter-
mined by the slenderness of its web when load case is a local concentrated load.
The resistance of the profile has to be checked either according to yielding of the
web or its local buckling. /13/
Figure 10. Yielding of the web under local concentrated load. /13/
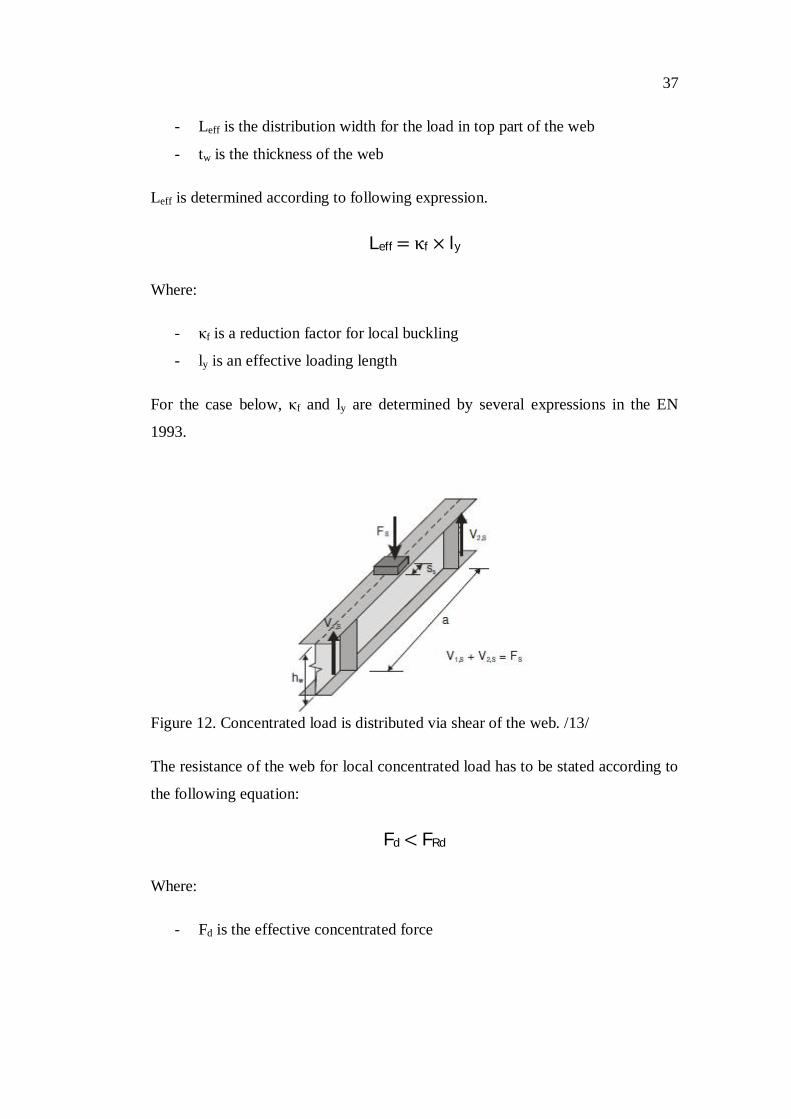
Figure 11. Local buckling of the web under concentrated load. /13/
The compressed flange has to be supported in a decent way to be able to apply the
following rules given in the EN 1993. /13/
FRd=fywxLeff×tw/γM1
Where:
- FRd is the resistance of the web in relation to local buckling
- fyw is yield strength of the web
37
- Leff is the distribution width for the load in top part of the web
- tw is the thickness of the web
Leff is determined according to following expression.
Leff=κf×ly
Where:
- κf is a reduction factor for local buckling
- ly is an effective loading length
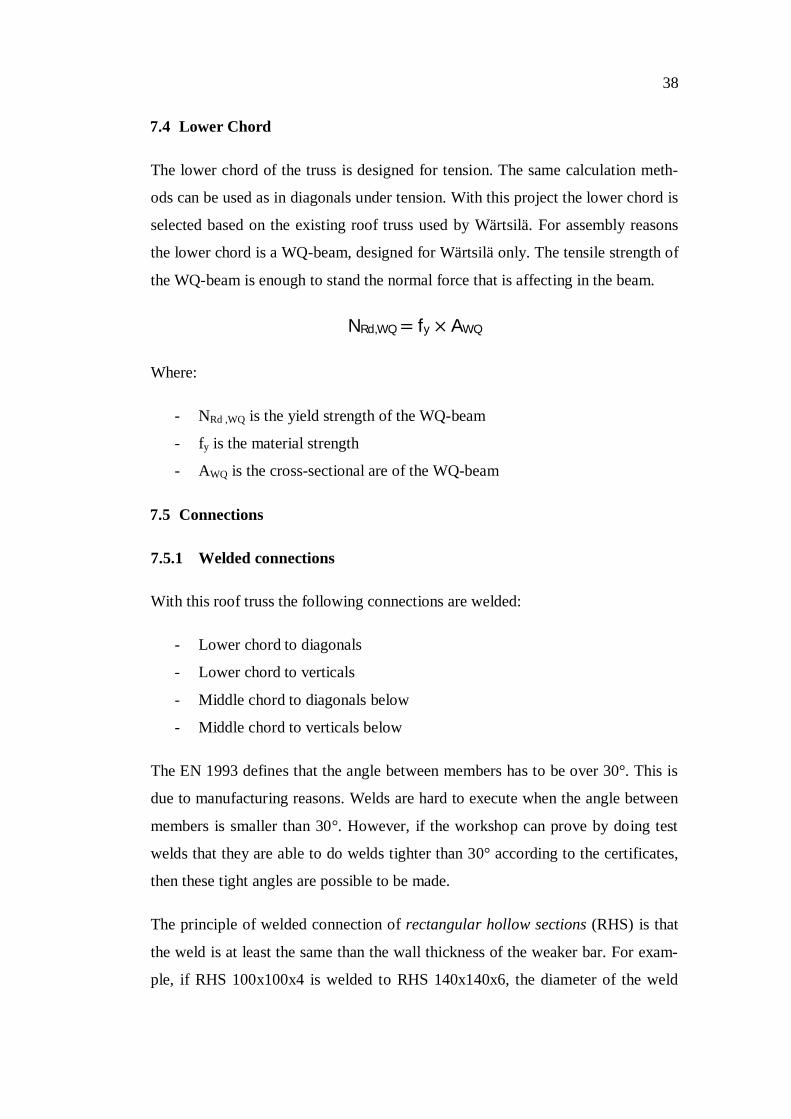
For the case below, κf and ly are determined by several expressions in the EN
1993.
Figure 12. Concentrated load is distributed via shear of the web. /13/
The resistance of the web for local concentrated load has to be stated according to
the following equation:
Fd<FRd
Where:
- Fd is the effective concentrated force
38
7.4 Lower Chord
The lower chord of the truss is designed for tension. The same calculation meth-
ods can be used as in diagonals under tension. With this project the lower chord is
selected based on the existing roof truss used by Wärtsilä. For assembly reasons
the lower chord is a WQ-beam, designed for Wärtsilä only. The tensile strength of
the WQ-beam is enough to stand the normal force that is affecting in the beam.
NRd,WQ=fy×AWQ
Where:
- NRd ,WQ is the yield strength of the WQ-beam
- fy is the material strength
- AWQ is the cross-sectional are of the WQ-beam
7.5 Connections
7.5.1 Welded connections
With this roof truss the following connections are welded:
- Lower chord to diagonals
- Lower chord to verticals
- Middle chord to diagonals below
- Middle chord to verticals below
The EN 1993 defines that the angle between members has to be over 30°. This is
due to manufacturing reasons. Welds are hard to execute when the angle between
members is smaller than 30°. However, if the workshop can prove by doing test
welds that they are able to do welds tighter than 30° according to the certificates,
then these tight angles are possible to be made.
The principle of welded connection of rectangular hollow sections (RHS) is that
the weld is at least the same than the wall thickness of the weaker bar. For exam-
ple, if RHS 100x100x4 is welded to RHS 140x140x6, the diameter of the weld
39
should be 4 mm. With this principle it is ensured that the resistance of the weld is
at least same as the resistance of the weaker bar.
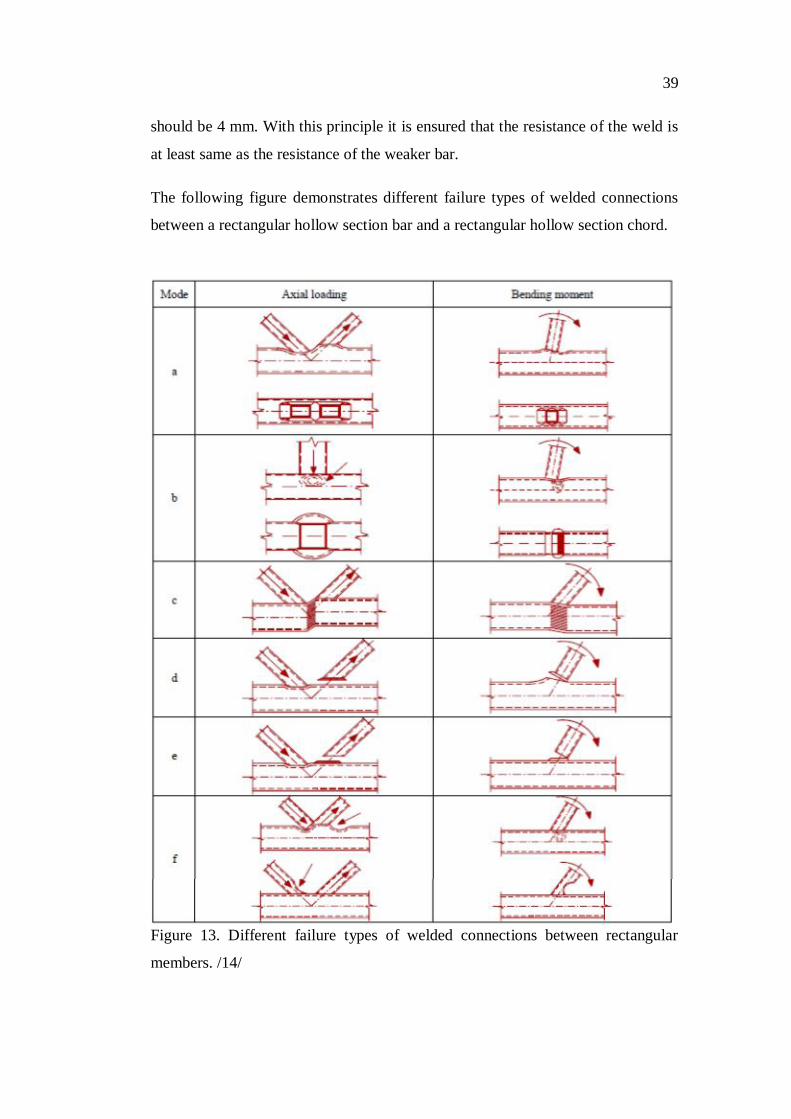
The following figure demonstrates different failure types of welded connections
between a rectangular hollow section bar and a rectangular hollow section chord.
Figure 13. Different failure types of welded connections between rectangular
members. /14/

40
Resistance of the K and N type gapped connections between bars that are hollow
sections are determined in various parts in the EN 1993. The following figure is
for connections between rectangular members.
Figure 14. Equations for connection resistance. /14/

41
For KT type of connections the following changes have to be made for the equa-
tions.
Figure 15. Changes for KN type connections caused by KT connection. /14/
The resistance of welded connections between the chords and brace members can
also be checked for the combined effect of normal force and bending moment,
even though it was mentioned earlier that in the classic design of trusses these
connections are assumed to be pinned. When calculating this combined effect, the
following condition has to be fulfilled.
Figure 16. Equation for combined effect of normal force and moment. /14/

42
In the following figure are the equations given by the EN 1993.
Figure 17. Moment resistance of rectangular hollow section members. /14/

43
7.5.2 Bolted Connections
With this roof truss the following connections are bolted.
- Middle chord to upper diagonals
- Middle chord to upper verticals
- Upper chord to diagonals
- Upper chord to verticals
- Lower chord to columns
- Middle joint between the two trusses
- Middle joint between the two upper middle chords
All the bolted connections in this thesis are designed as pinned connection, which
means that they are not transmitting moments. This means that the bolted connec-
tions need to be designed for shear force. The resistance of bolted connection is
determined according to the EN 1993 with the following expressions. /14/
Shear resistance of a bolt: /13/
Fv,Rd=0,6×fub×A(As)/γM2
Where:
- Fv,Rd is the shear resistance (one shear plane)
- 0,6 is reduction factor (bolts up to 8.8)
- fub is the ultimate tensile strength of one bolt
- A is the cross-sectional area of one bolt
- As is the cross-sectional area of one bolt in area of screw thread
- γM2 is material safety factor
Tension resistance of a bolt: /13/
Ft,Rd=0,9×fub×As/γM2

44
Bearing resistance: /13/
Fb,Rd=k1×αb×fu×d×t/γM2
Where:
- k1 : Direction: Perpendicular to the load transfer
§ For edge bolts:
· smallest of the following values:
o 2,8×e2/d0–1,7
o 2,5
§ For other than edge bolts:
· smallest of the following values:
o 1,4×p2/d0–1,7
o 2,5
- αb : Direction: Along load transfer
§ Smallest of the following values:
o e1/3d0
o p1/3d0–1/4
o fub/fu
o 1,0
- fu is the ultimate tensile strength of the material in which the bolts are
connected
- d is the diameter of the bolt
- d0 is the diameter of the hole
- t is the smaller thickness of the two connected materials
- p1 is the distance between two holes, along the direction of the load
transfer ≥ 2,2 x d0, but smaller than 14 x t or 200 mm
- p1 is the distance between two holes, perpendicular to the direction of
the load transfer ≥ 3,0 x d0, but smaller than 14 x t or 200 mm
- e1 is the distance between the hole and the edge of the plate in which
the bolts are connected, along the direction of the load transfer ≥ 1.2 x
d0
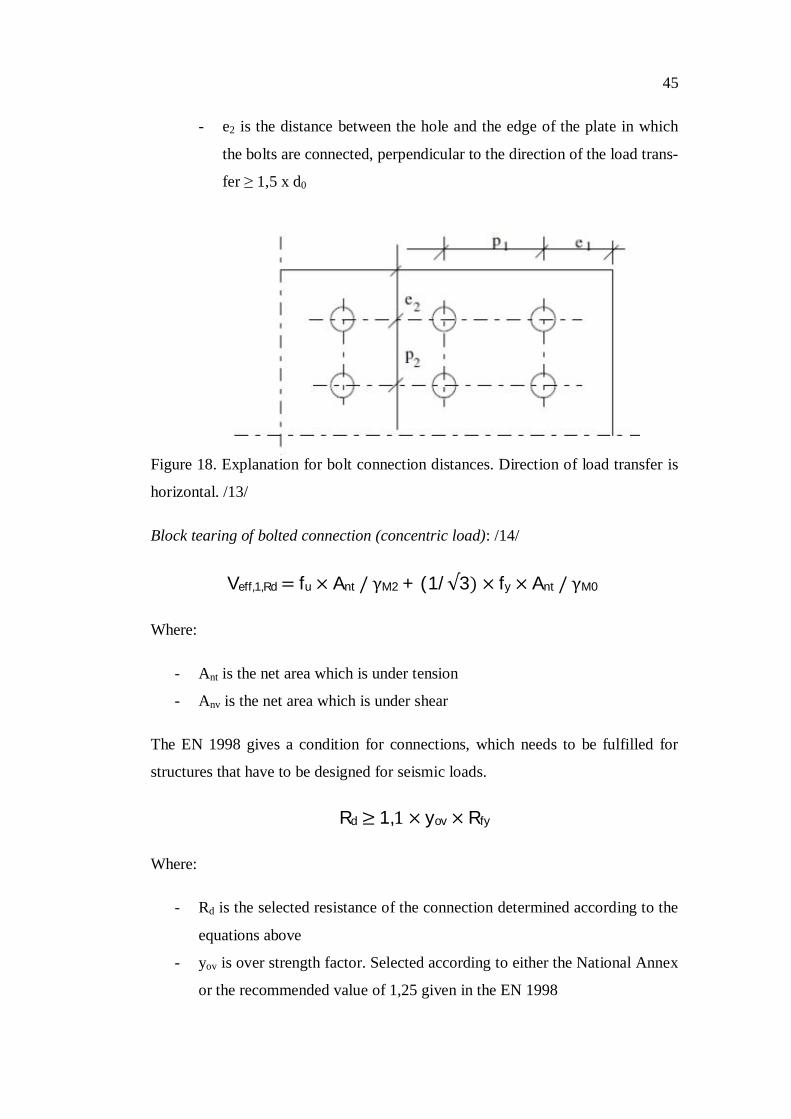
45
- e2 is the distance between the hole and the edge of the plate in which
the bolts are connected, perpendicular to the direction of the load trans-
fer ≥ 1,5 x d0
Figure 18. Explanation for bolt connection distances. Direction of load transfer is
horizontal. /13/
Block tearing of bolted connection (concentric load): /14/
Veff,1,Rd=fu×Ant/γM2+(1/√3)×fy×Ant/γM0
Where:
- Ant is the net area which is under tension
- Anv is the net area which is under shear
The EN 1998 gives a condition for connections, which needs to be fulfilled for
structures that have to be designed for seismic loads.
Rd≥1,1×yov×Rfy
Where:
- Rd is the selected resistance of the connection determined according to the
equations above
- yov is over strength factor. Selected according to either the National Annex
or the recommended value of 1,25 given in the EN 1998

46
- Rfy is the resistance of the member that is connected, determined according
to plasticity

47
8 CONCLUSION
The new geometry of the roof truss has many benefits compared to the existing
one. It has many structural benefits and in addition to that it is lighter than the ex-
isting truss that leads also for cost savings.
The new truss is over 500 kg lighter than the existing truss. It does not sound like
much, but when one engine hall can contain dozens of module lines, the savings
in weight of the steel amount increases quite a lot.
But the cost savings were just a good addition. The real benefits came with the
new geometry of the truss. The existing model of the roof truss when the radiators
are on top of the engine hall uses less than half of the possible height for the truss.
With this new model the entire height that is possible to use is actually used. With
this change the stiffness of the whole module line increased radically. Also the
first modes and natural frequencies of the structure went up. This is an important
factor regarding that now there is a bigger gap between the first significant natural
frequency of the structure and the frequency caused by the running engine.
Also the support reactions of the whole structure went down about 10 %. That
gives an opportunity to check the possible reduction of the base slab thickness.
Even though the results and benefits of this new roof truss were excellent, all the
problems could not be escaped. A couple of the weld connections were on the
edge of being 30°. This is not a deal breaking issue, but it has to be checked and
tested with the steel manufacturer. The geometry could have been changed in a
way that all the connection would have been clearly bigger that 30° but this would
have affected the placing of the braces too much. Tentatively this issue of welding
angles smaller than 30° was checked with one manufacturer and they replied that
it is possible to execute these tight angles. They only have to carry out test weld-
ing for that.

48
RESOURCES
/1/ Wärtsilä internet pages. Accessed 9.1.2014.http://www.wartsila.com/en/about/company-management/overview
/2/ Eurocode 1991. SFS-EN 1991-1-1: Actions on structures – Part 1-1: Generalactions – Densities, self-weight and imposed loads. Accessed 14.1.2014. Electron-ic document.
/3/ Eurocodes – building the future. Accessed 18.12.2013.http://eurocodes.jrc.ec.europa.eu/home.php
/4/ International Conference of Building Officials. 1997: 1997 Uniform BuildingCode Volume 2. Whittier, California, U.S.A. First Printing.
/5/ Eurocode 1991. SFS-EN 1991-1-4: Actions on structures – Part 1-4: Generalactions – Wind actions. Accessed 14.1.2014. Electronic document.
/6/ G.Solomos. A.Pinto. S.Dimova. A review of the seismic hazard zonation innational building codes in the context of Eurocode 8. 2008: European commissionJRC. 24.1.2014. http://www.jrc.ec.europa.eu
/7/ Eurocode 1998. Accessed 14.1.2014. Electronic document.
/8/ Thesis meetings. Wärtsilä Runsor office. Tapani Hahtokari, Simon Nyman,Markus Sandås, Jesse Iivonen.
/9/ Modal analysis theory. 1999: University of Cincinnati. Accessed 13.2.2014.http://www.sdrl.uc.edu/academic-course-info/docs/ucme663/v3_2.pdf. UC - struc-tural dynamics research lab.
/10/ Vibrations of Single Degree of Freedom Systems. 2014: Duke University.Accessed 13.2.2014. http://people.duke.edu/~hpgavin/cee541/sdof-dyn.pdf
/11/ Teräsrakenteiden maanjäristysmitoitus. 2013: KPM-engineering. Accessed2.4.2014. http://www.terasrakenneyhdistys.fi/fin/koulutus/tk-paivat/
/12/ Eurocode 1993. SFS-EN 1993-1-1: Design of steel structures – Part 1-1:General rules and rules for buildings. Accessed 14.1.2014. Electronic document.
/13/ Teräsrakenteet. Tapani Hahtokari. Vaasan Ammattikorkeakoulu.Luentomateriaali.
/14/ EN 1993: Design of steel structures – Part 1-8: Design of joints. Accessed14.1.2014. Electronic document.
APPENDIX 1 1(1)


