

Johnson Space Center May 18, 2010

Single-walled Carbon Nanotube(SWCNT)
Carbon Nanostructures
C60
(Buckminsterfullerene)

taken from http://www.photon.t.u-tokyo.ac.jp/~maruyama/wrapping.files/frame.html
Rolling up graphene to make a SWCNT

armchair ( = 30°)
zigzag ( = 0°)
intermediate (0 30°)
zigzag
Many SWCNT structures exist( different diameters and angles )

Typical diameter: 0.6 – 3 nm
Typical lengths: 100 – 10,000 nm large aspect ratios
Density: 1.4 g / cm3
Tensile strength: 60 GPa 50 x higher than steel
Persistence length: 50 m very rigid
Surface area: > 1000 m2 / g (every atom on surface)
Electrical transport: metallic or semiconducting
Optical spectra: intense -* bands, direct band-gap semiconductors
SWCNT Properties

Even pure single-walled samples contain:
• many diameters
• many chiral angles
• many lengths (no effect on electronic structure)
• bundles of tubes bound by van der Waals forces
Nanotubes are produced ascomplex mixtures

van Hovesingularities
Electronic states of a semiconducting SWCNT
E11 E22 E33

Constructing nanotubes from a graphene sheet
Roll-up vector
Roll-up angle
Nan
otu
be
axis

E11
emissionE22
absorption
Spectrofluorimetry of semiconducting SWCNTs
hole
e-


Spectral transitions mapped to structures
ApplicationApplication
SWCNT Composites

• Add small amounts of SWCNTs to polymers to make composites with improved mechanical strength, thermal conductivity, and/or electrical conductivity
• SWCNTs can retain their near-IR fluorescence in the composite. This allows in situ monitoring of:
dispersion (fluorescence microscopy) orientations (polarized fluor. microscopy)
axial strains (spectral shifts)
The Basic Idea

polarization control, focusingexcitation lasers
near-IR imager InGaAs 2-D array
(82,000 pixels)
inverted microscope
sample
near-IR spectrographwith InGaAs 1-D array
Apparatus for near-IR fluorescence microscopy
Tsyboulski, et al. Nano Lett. 5, 975 (2005)
Images Spectra

Fluorescence from a Single Nanotube
(7,5)
160 m field

Em
issi
on I
nten
sity
Compress
Stretch
Shift in band gap
Compress
Stretch
Axial deformation changes the nanotube’selectronic structure and causes spectral shifts

Extension Compression
Strain jig for microscope stage
SWCNTs in PMMA film fused to PMMA barStrain gauge mounted on sample film

to strain reader
resistive strain gauge
PMMAbeam
spin coatednanotube/PMMA filmmicrometer
for pushing swing arm
swing arm2 cm
built by Pavel Nikolaev and Sivaram Arepalli
PMMAbeam
stationary pins
moving pins
side view
4-point bending jig for applying controlled strain

Polarization reveals nanotube orientation

(8,7)
Wavenumbers (cm-1)
7600 7800 8000 8200
Nor
m. e
mis
sion
inte
nsity
0.0
0.2
0.4
0.6
0.8
1.0
1.2 0.8%0.0%-0.8% strain
Single SWCNT spectra
(8,7) nanotube
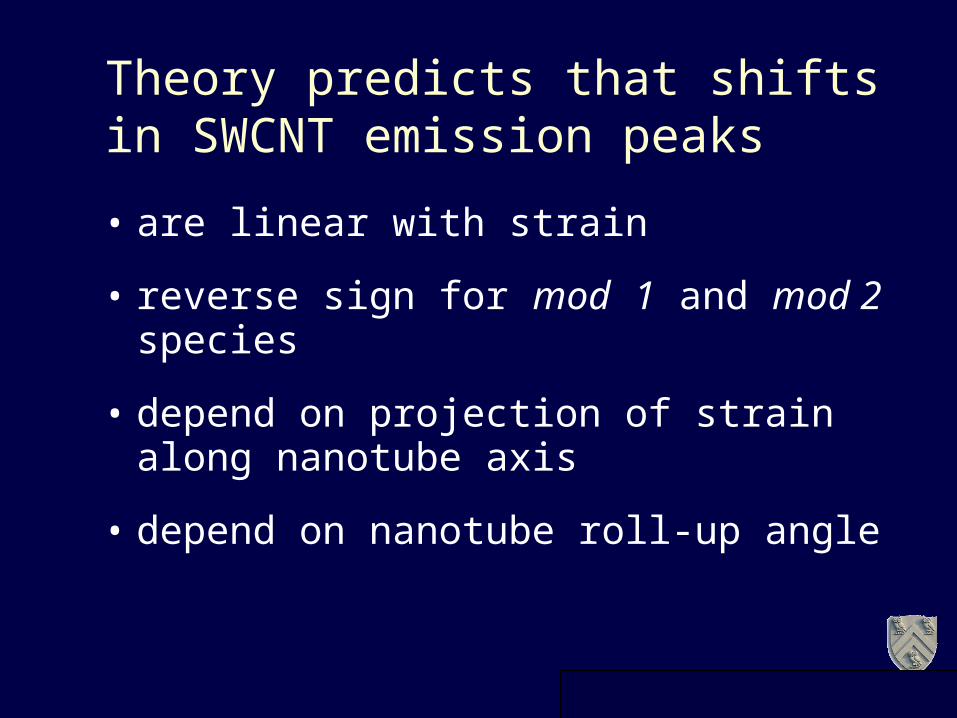
• are linear with strain
• reverse sign for mod 1 and mod 2 species
• depend on projection of strain along nanotube axis
• depend on nanotube roll-up angle
Theory predicts that shifts in SWCNT emission peaks

Peak position shifts linearly as host is strained
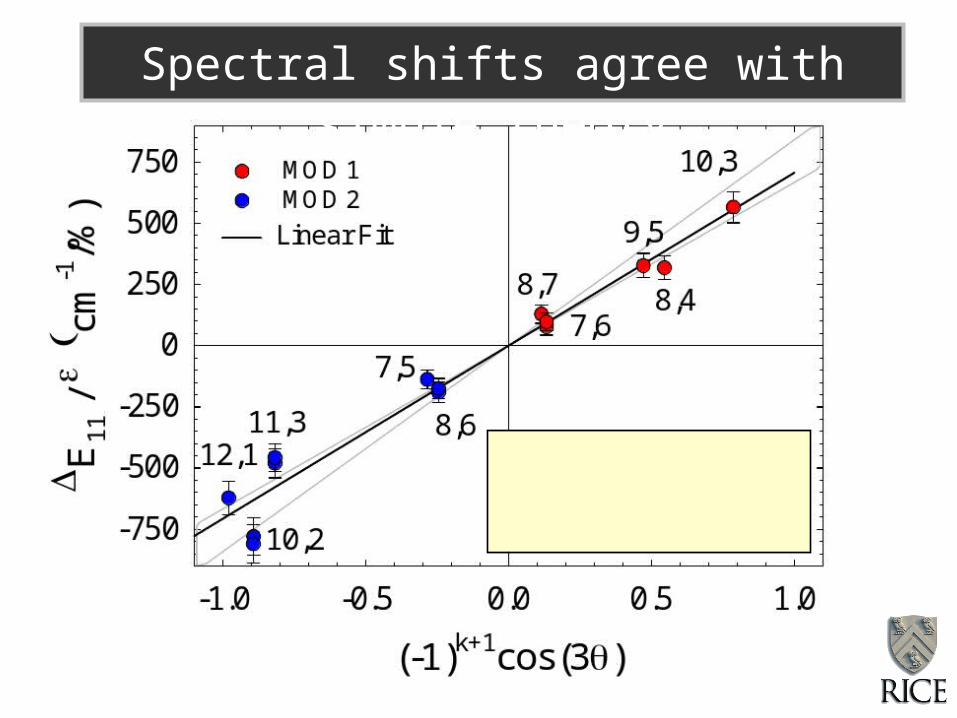
Spectral shifts agree with simple theory

Spectral shift is linear until …
it splits into 2 peaks!

Part of one nanotube slipping

Strain data for a single SWCNT in Epon 862 epoxy
(10,2) nanotube in PFO
0.6% strain
Wavelength (nm)
900 1000 1100 1200 1300
Nor
mal
ized
Em
issi
on I
nten
sity
-0.2
0.0
0.2
0.4
0.6
0.8
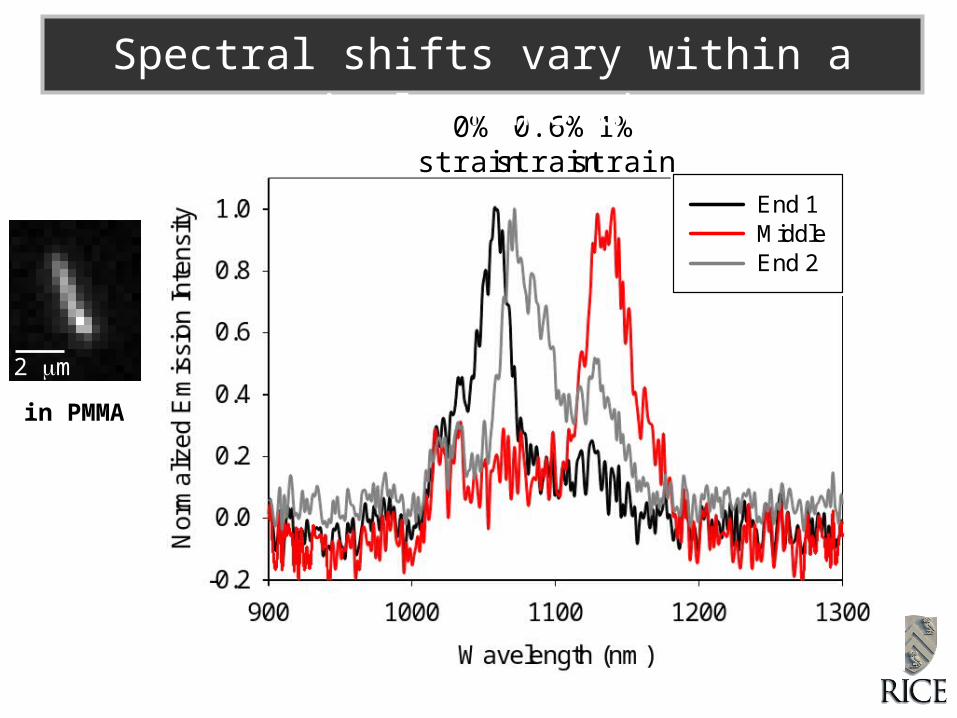
1.0 End 1MiddleEnd 2
2 m
0.6%strain
1% strain
0%strain
Spectral shifts vary within a single nanotube
in PMMA

Strain (%)
0.0 0.2 0.4 0.6 0.8 1.0 1.2
E11
(cm
-1)
-1000
-800
-600
-400
-200
0 End 1MiddleEnd 2
Middle shows linear behavior
Ends slip
Ends slip while the middle adheres
Copyright © 2007 Applied NanoFluorescence, LLC
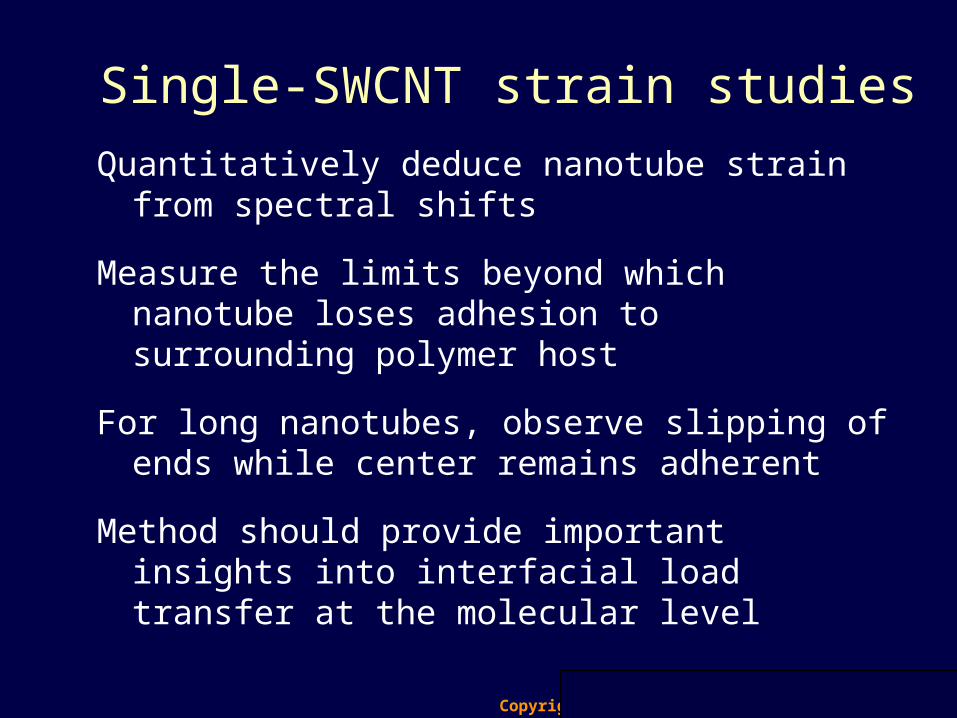
Quantitatively deduce nanotube strain from spectral shifts
Measure the limits beyond which nanotube loses adhesion to surrounding polymer host
For long nanotubes, observe slipping of ends while center remains adherent
Method should provide important insights into interfacial load transfer at the molecular level
Single-SWCNT strain studies
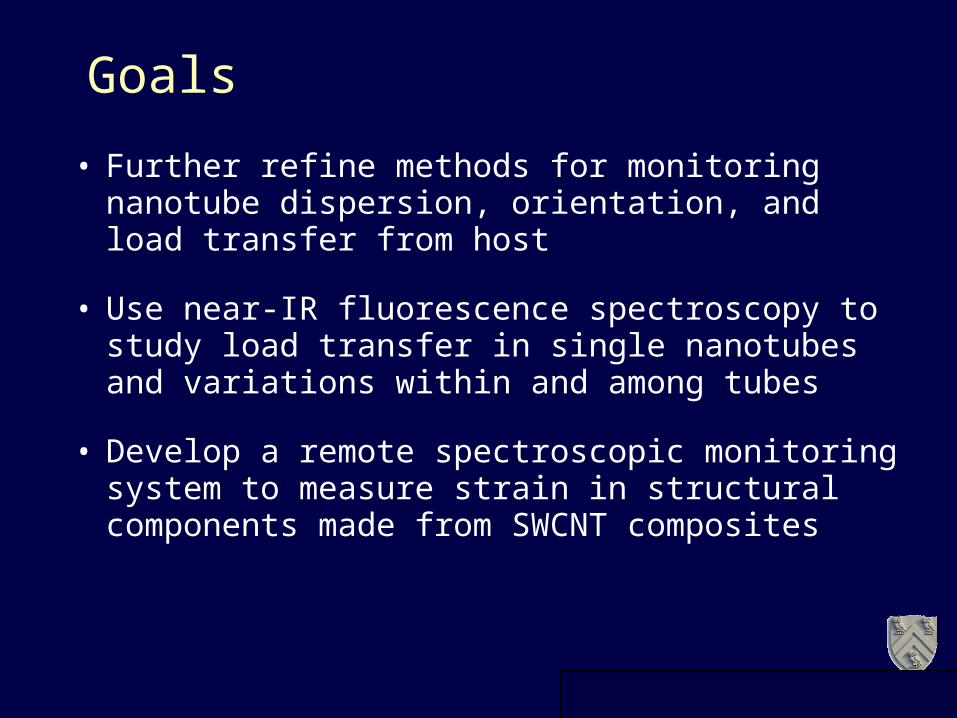
Goals
• Further refine methods for monitoring nanotube dispersion, orientation, and load transfer from host
• Use near-IR fluorescence spectroscopy to study load transfer in single nanotubes and variations within and among tubes
• Develop a remote spectroscopic monitoring system to measure strain in structural components made from SWCNT composites

interrogationlaser
near-IR imager InGaAs 2-D array
(82,000 pixels)
Non-invasive sensing of structural strain
near-IR collection optics & spectrometer
composite with sorted SWCNTs
Den
sity
(g/
mL)
1 .0 6
1 .0 7
1 .0 8
1 .0 9
1 .1 0
1 .1 1
7 ,3
6 ,5
8 ,3
7 ,5
7 ,6
U n s o rte d H iP c o
a b c d6 ,4
W a v e le n g th (n m )9 0 0 1 0 0 0 1 1 0 0 1 2 0 0
Nor
mal
ized
em
issi
on in
tens
ity
0 .0
0 .2
0 .4
0 .6
0 .8
1 .0
1 .2
7 ,36 ,58 ,3 7 ,5 7 ,66 ,4 9 ,1
6 ,4
6 ,5
8 ,3
7 ,57 ,6
N a n o tu b e d ia m e te r (n m )0 .7 0 .8 0 .9 1 .0
Refractive index
1 .3 5 2
1 .3 5 6
1 .3 6 0
1 .3 6 4
1 .3 6 8
7 ,3
8 ,7
e
1 0 ,2
W a v e le n g th (n m )1 0 0 0 1 2 0 0 1 4 0 0
Absorbance (a.u.)
9 ,28 ,4
D e p th in c e n trifu g e tu b e (m m )
5 1 0 1 5 2 0 2 5 3 0 3 5 4 0 4 5 5 0
Refractive index
1 .3 4
1 .3 6
1 .3 8
1 .4 0
1 .4 2
P o s t N o n lin e a r D G U
P o s t L in e a r D G U
Den
sity
(g/
mL)
1 .0 0
1 .0 5
1 .1 0
1 .1 5
1 .2 0
1 .2 5
1 .3 0
fN a n o tu b e e n a n tio m e rs
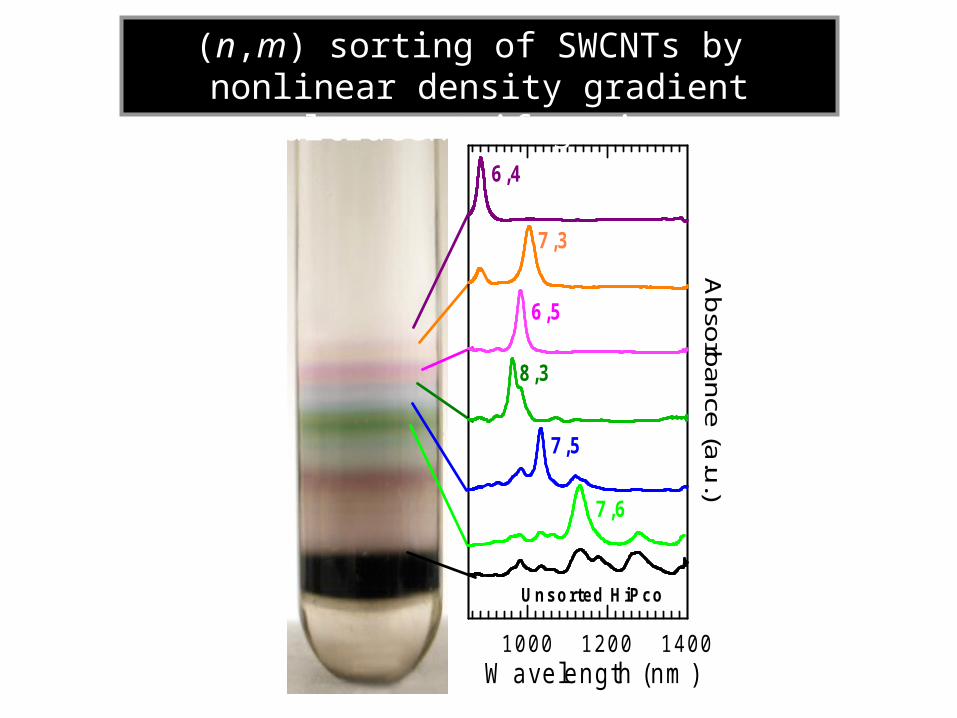
(n,m) sorting of SWCNTs by nonlinear density gradient ultracentrifugation

Separated fractions contain robust near-IR fluorophores with distinct emission peaks
Ghosh, Bachilo, and Weisman, Nature Nanotechnology, published online May 9, 2010

References
O’Connell et al., Science 297, 593 (2002)Bachilo et al., Science 298, 2361 (2002)Bachilo and Weisman, Nano Letters 3, 1235 (2003)Tsyboulski et al., Nano Letters 5, 975 (2005)Leeuw et al. Nano Letters 8, 826 (2008)Ghosh et al., Nature Nanotechnology, web-posted May 9, 2010


