

Jordan National Behavioral Risk and Chronic Disease Survey
Jordan 2004 / 2005
Dr. Meyasser ZindahHead of NCD Department Ministry Of Health

Justification for study:
• Jordan has made the epidemiological transition from infections diseases to chronic diseases as the leading causes of morbidity and mortality.
• As Jordan develops new programs to reduce the risk factors for chronic diseases such as smoking, physical inactivity, overweight and obesity.
• Timely and ongoing information is needed to measure the magnitude and trends of these chronic diseases and their risk factors.

Main Goal
To improve the health of population by reducing mortality, and morbidity, from non -communicable diseases.
Objectives
a) To establish an NCDs surveillance system.
b) To measure the self- reported prevalence of selected risk factors for chronic disease such as smoking, physical inactivity, nutrition...etc.
c) Measure the prevalence of diabetes, hypertension, cholesterol, triglyceride, and obesity using physical and biochemical measures.

Methodology Study Design:
•national cross-sectional survey, and approved by the Ministry of Health
• The sampling frame was representative nationally and stratified by governorate, major city, and other urban and rural areas.
• A multi stage sampling designed by department of statistics to select the households.
• In each house one adult aged 18 years or older was selected randomly and interviewed.

Methodology
• Field work was conducted between October 1st and December 31.A total of 3,334 adults were interviewed (Behavioral Sample). Response rate was 94.7%.
• A representative sub sample were randomly chosen from the original sample for step II & III ..
They were asked to fast from midnight preceding their visit to a local health center where blood pressure, weight, height, and waist circumference were obtained.
In addition, a blood sample was collected and sent to a central laboratory where total cholesterol, HDL-C, LDL-C, triglycerides, and fasting blood glucose were determined.

•Response rate for step II & III were 80%.
• Standardized training was provided to the attending
physicians of the selected local health clinics and
standard equipment for measurements were
provided and used.
Methodology

Response RateResponse RateTotal Sample
(3520 Persons)
Behavioral Sample
Bio-Chemical Sample
Response RateResponse Rate Response RateResponse Rate
95% 80%

Stepwise instruments were used in the following sequence:
Step 1:
• Core and expanded Demographic questions
• Core and expanded behavioral measurements; except for alcohol consumption questions.
Note: Optional questions were added to this step about Cholesterol awareness, Diabetes awareness, heart diseases , oral health, eye sight, women health, and medical services.
Methodology

Step 2:
Core physical measurements, including:
• weight and height• Blood pressure• Waist.
Step 3:Core biochemical measurements including:
• Blood glucose level.• Total Cholesterol level , •and expanded HDL-C and LDL-C• Triglyceride level
Note: Step 2 and Step 3 were applied according to WHO standards

Field work:The field working team consists of six groups, each group consist of 3 persons:
- Epidemiology training resident.
- Research assistant.
- Driver.
• The teams visited the selected houses, enumerated the total
number of persons 18 years or over in the selected households
and selected the eligible participant in a random fashion and
directly interviewed them.

سنة فما فوق رقم األسرة في العينه سنة فما فوق رقم األسرة في العينه 1818عدد افراد االسرة عدد افراد االسرة 123456789101112112345678910111211121421251811121421251812211341113411455361145536133122225737592122225737592441113161611089111316161108955112245119661112245119661661124244792861124244792867711242111124211
56651256651288122414467694122414467694

سنة فما فوق 18عدد افراد االسرة
رقم األسرة في العينه
12345678910
1112
1112142125181
2113411455361
3122225737592
4111316161189
5112245119661
6112424479286
71124211566512
8122414467694

• If the eligible person was not available at the time of visit, the
team would try to schedule a time when that person would be
available and would return to the house a second time or third
time.
• Households were dropped out of the sample after visiting the
three times without a response.
• Standardized training was provided to all team members.
Field work:

Data ManagementField supervision: The questionnaire was checked and reviewed by a field
supervisor•Reviewed questionnaire:
Data entry: every questionnaire was checked and entered to the computer so only valid data were possible further checked were carried out every 200 questionnaire .
Data cleaning were performed.
Data was analyzed using SAS Software.

Thanks youThanks you

Results
Prevalence of smoking
51%
7%
25%
0
10
20
30
40
50
60
Male Female TotalSex
Perc
enta
ge

Age at starting smoking
48.8
23
5.87.2
23.4
2.9
1420
1512.2
28
1.405
10152025303540455055
<= 10 11-14 15-18 19-24 25-29 >=30
Age
%
Male Female
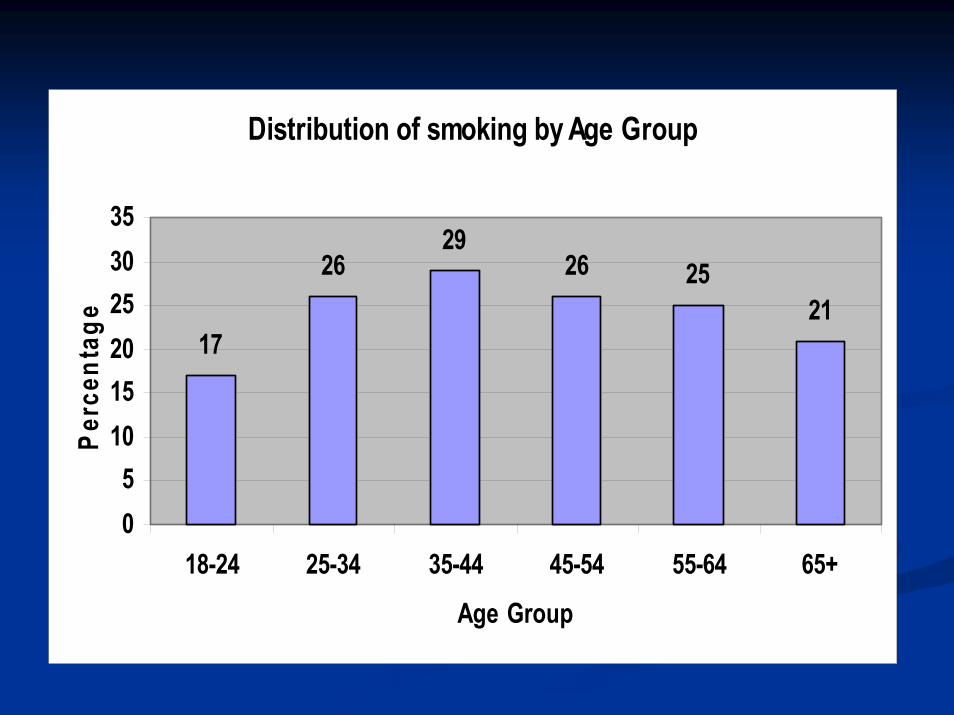
Distribution of smoking by Age Group
17
2629
26 2521
05
101520253035
18-24 25-34 35-44 45-54 55-64 65+
Age Group
Per
cent
age

Distribution of current smokers according to average of cigarettes
smoking per day
11%
59%
30%
010203040506070
less than 10 10-20 cigarette > 20 cigarette
Daily Average Cigarettes Smoking
Perc
enta
ge

Distribution of study population according to numbers of Distribution of study population according to numbers of days Vigorous physical activity spent during a weekdays Vigorous physical activity spent during a week
% *% *No. of PersonsNo. of PersonsNumber of Days Number of Days
16 16 211 211 One Day One Day 28 28 3633632 Days2 Days12 12 154 154 3 Days3 Days 8 8 106 106 4 Days4 Days9 9 122 122 5 Days5 Days9 9 123 123 6 Days6 Days
16 16 207 207 7 Days7 Days1114 14 DonDon’’t knowt know
1001001300 1300 TotalTotal


