
Journal ClubCremona 24 Maggio 2008
Genomica e proteomica: significato e utilità attuali
Alberto Ballestrero
Clinica di Medicina Interna a indirizzo Oncologico
DIMI - Università di Genova

Incorporation of genomic into breast cancer management
Gene expression analysisPrognosis Prediction
Classification/Gene discovery
Who treat? Which therapy?
Improve biological knowledge

Gene expression analysis assumptions
1) Expression analysis allows identifying the tumour transcriptional features (transcriptoma)
2) Transcriptoma contains the information required to predict tumour evolution and response to treatments
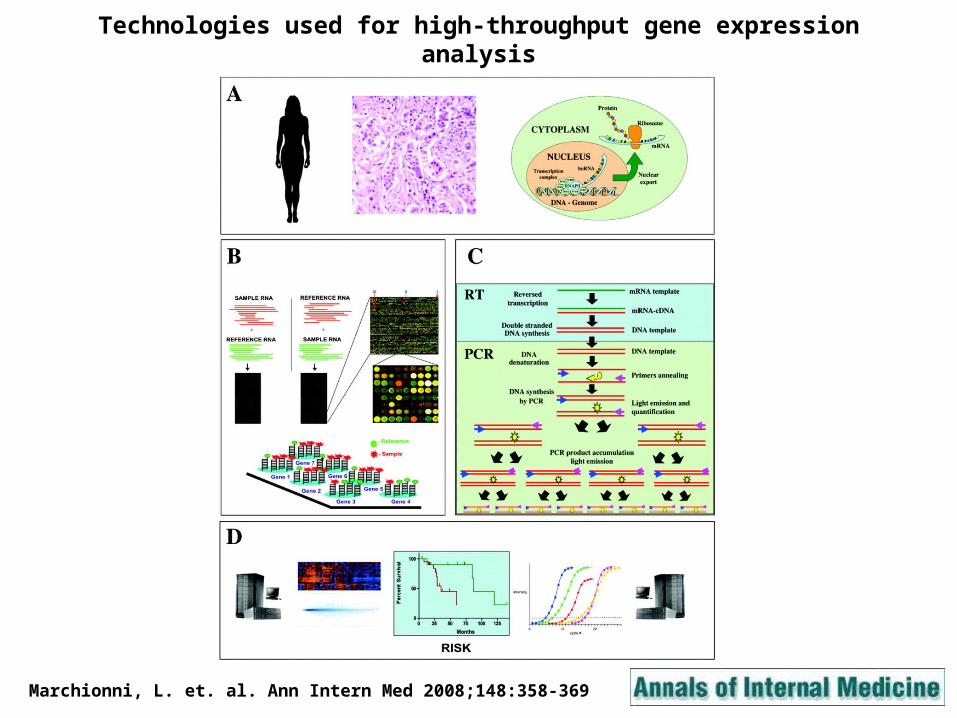
Technologies used for high-throughput gene expression analysis
Marchionni, L. et. al. Ann Intern Med 2008;148:358-369

78 t
um
ors
78 t
um
ors
70 significant prognosis genes in N- patients70 significant prognosis genes in N- patients
PoorPoorsignaturesignature
Van’t Veer et al. Nature, 2002Van’t Veer et al. Nature, 2002
GoodGoodsignaturesignature
Netherlands signature
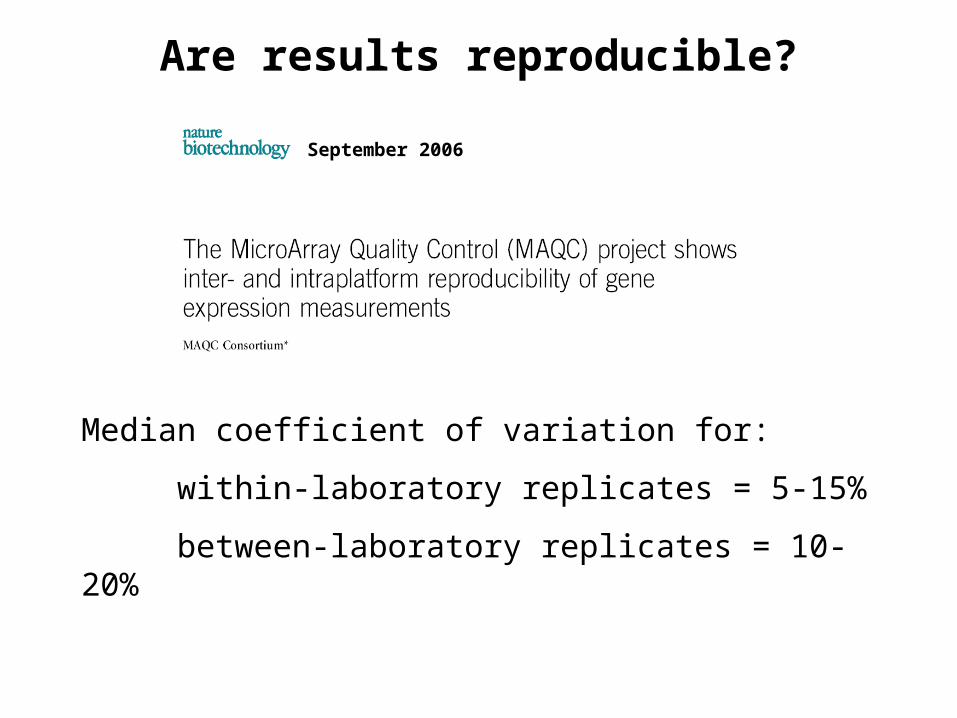
Are results reproducible?
September 2006
Median coefficient of variation for:
within-laboratory replicates = 5-15%
between-laboratory replicates = 10-20%
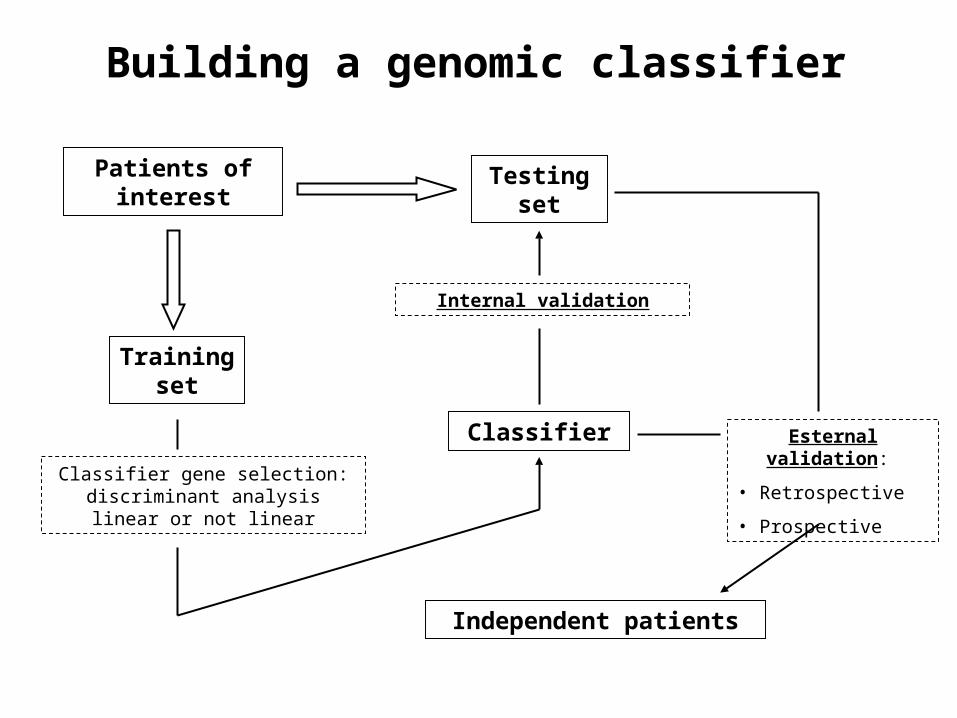
Building a genomic classifier
Patients of interest
Training set
Classifier gene selection: discriminant analysis linear or not
linear
Classifier
Testing set
Internal validation
Independent patients
Esternal validation:
• Retrospective
• Prospective
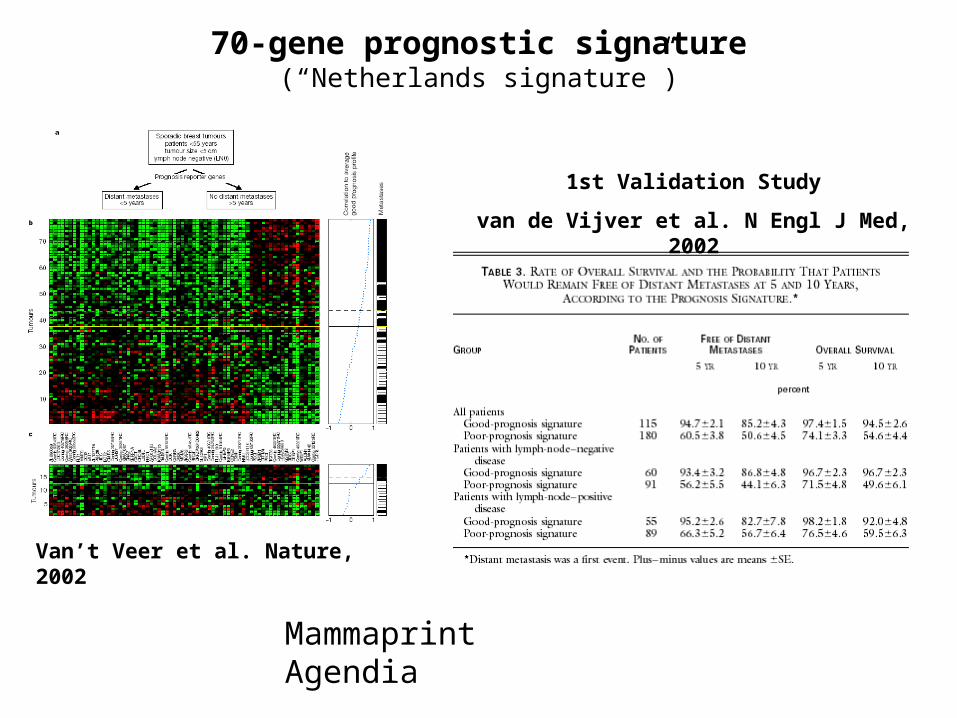
70-gene prognostic signature(“Netherlands signature”)
1st Validation Study
van de Vijver et al. N Engl J Med, 2002
Van’t Veer et al. Nature, 2002
Mammaprint Agendia

Netherlands signature: 151 N- patients
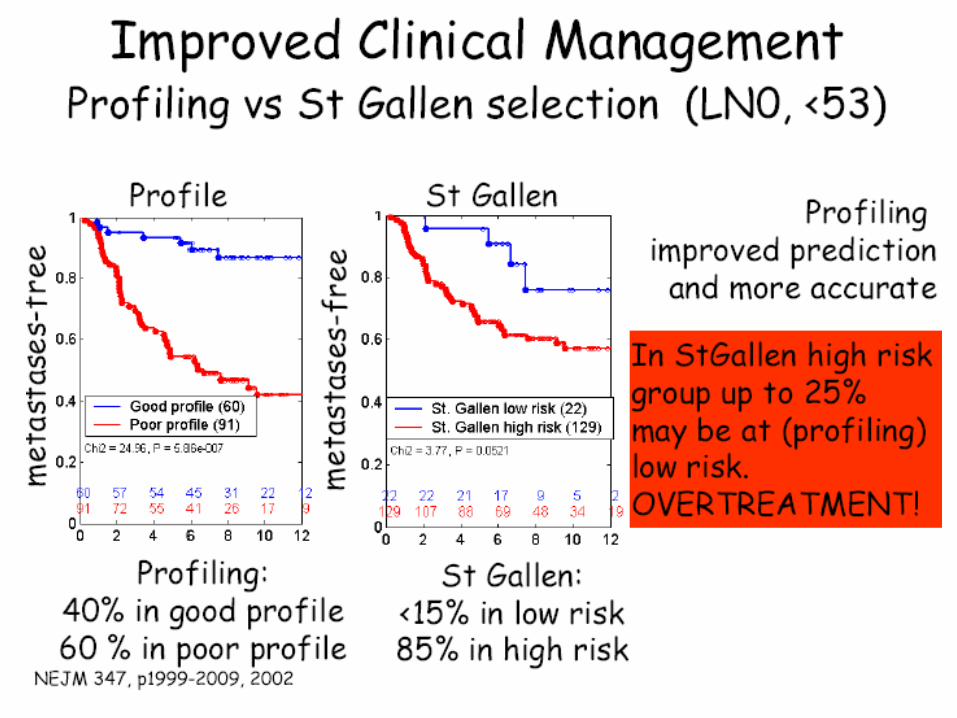
Van de Vijver MJ et al. N Engl J Med 347:1999-2009, 2002
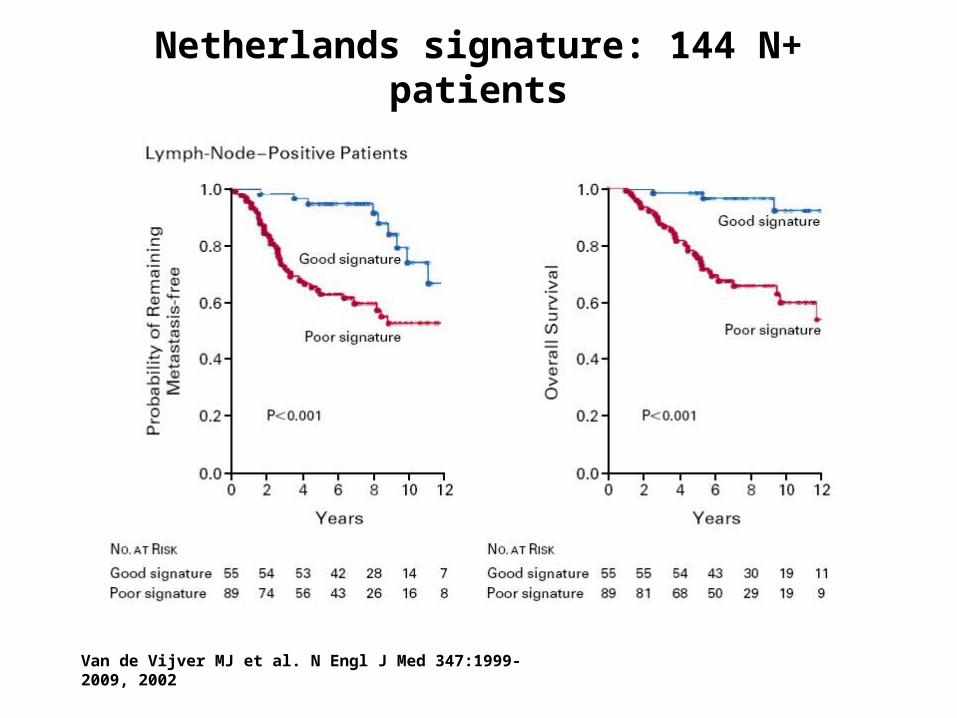
Netherlands signature: 144 N+ patients
Van de Vijver MJ et al. N Engl J Med 347:1999-2009, 2002
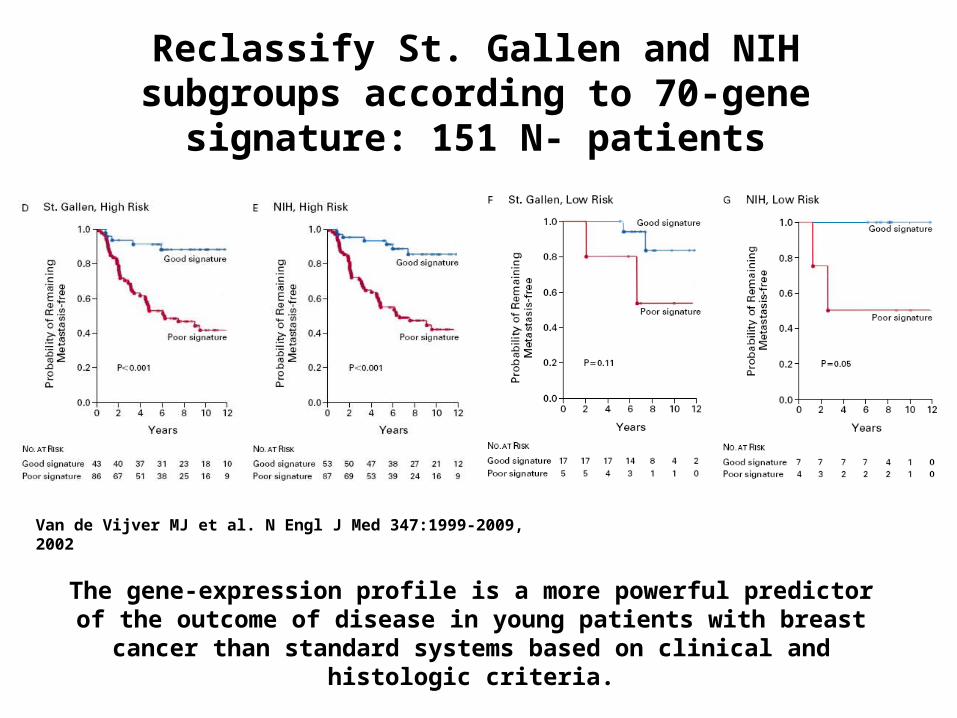
Reclassify St. Gallen and NIH subgroups according to 70-gene signature: 151 N- patients
The gene-expression profile is a more powerful predictor of the outcome of disease in young patients with breast cancer than standard
systems based on clinical and histologic criteria.
Van de Vijver MJ et al. N Engl J Med 347:1999-2009, 2002
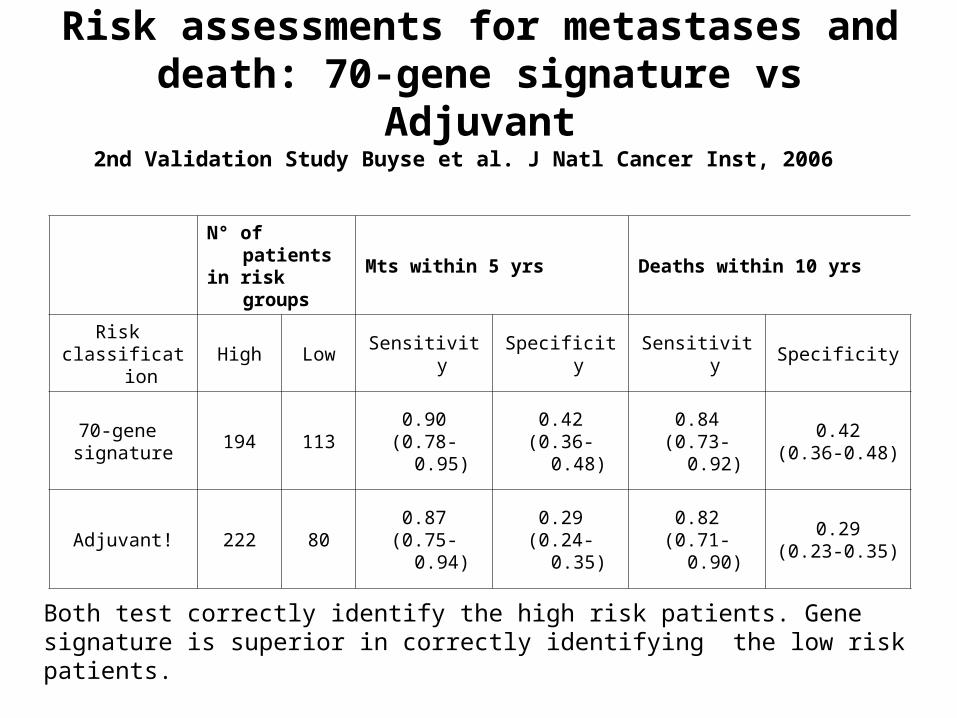
Risk assessments for metastases and death: 70-gene signature vs Adjuvant
N° of patients in risk groups
Mts within 5 yrs Deaths within 10 yrs
Risk classification
High Low Sensitivity Specificity Sensitivity Specificity
70-gene signature
194 1130.90
(0.78-0.95)0.42
(0.36-0.48)0.84
(0.73-0.92)0.42
(0.36-0.48)
Adjuvant! 222 800.87
(0.75-0.94)0.29
(0.24-0.35)0.82
(0.71-0.90)0.29
(0.23-0.35)
Both test correctly identify the high risk patients. Gene signature is superior in correctly identifying the low risk patients.
2nd Validation Study Buyse et al. J Natl Cancer Inst, 2006

90% (CI 85%-96%)
71% (CI 65%-78%)
Buyse et al. J Natl Cancer Inst 2006
30% discordant cases between 70-gene
signature and Adjuvant
DMF

MINDACT triala testing hypotesis for a key question
Key question for use of 70-gene to decide on Key question for use of 70-gene to decide on chemotherapy.chemotherapy.Evaluate the Evaluate the risk of undertreatingrisk of undertreating patients who would patients who would otherwise get chemotherapy per clinical-pathological criteria.otherwise get chemotherapy per clinical-pathological criteria.
Testing hypotesis.The patients who have a low risk gene prognosis signature The patients who have a low risk gene prognosis signature and high risk clinical-pathologic criteria, and who were and high risk clinical-pathologic criteria, and who were randomized to receive no chemotherapy has a 5-year DMFS randomized to receive no chemotherapy has a 5-year DMFS = 92% (null hypothesis).= 92% (null hypothesis).

EORTC-BIG MINDACT TRIAL DESIGN6,000 Node negative women
Clinical and Genomic
BOTH HIGH RISK
DISCORDANT Clinical and
Genomic RisksClinical and
GenomicBOTH LOW RISK
RANDOMIZEdecision-making
Chemotherapy No chemotherapy
Use genomic riskUse clinical riskHigh risk Low risk
High risk Low risk
Assess clinical risk and genomic risk

1717
Oncotype DX® 21-Gene Recurrence Score (RS) Assay
PROLIFERATIONKi-67
STK15Survivin
Cyclin B1MYBL2
ESTROGENERPR
Bcl2SCUBE2
INVASIONStromelysin 3Cathepsin L2
HER2GRB7HER2
BAG1GSTM1
REFERENCEBeta-actinGAPDHRPLPO
GUSTFRC
CD68
16 Cancer and 5 Reference Genes From 3 Studies
Category RS (0-100)Low risk RS <18
Int risk RS ≥18 and <31
High risk RS ≥31
Paik et al. N Engl J Med. 2004;351:2817-2826.
RS = + 0.47 x HER2 Group Score - 0.34 x ER Group Score + 1.04 x Proliferation Group Score+ 0.10 x Invasion Group Score + 0.05 x CD68- 0.08 x GSTM1- 0.07 x BAG1

Prediction of recurrence in N0 ER positive patients (TAM treated)
Paik et al. N Engl J Med. 2004;351:2817-2826
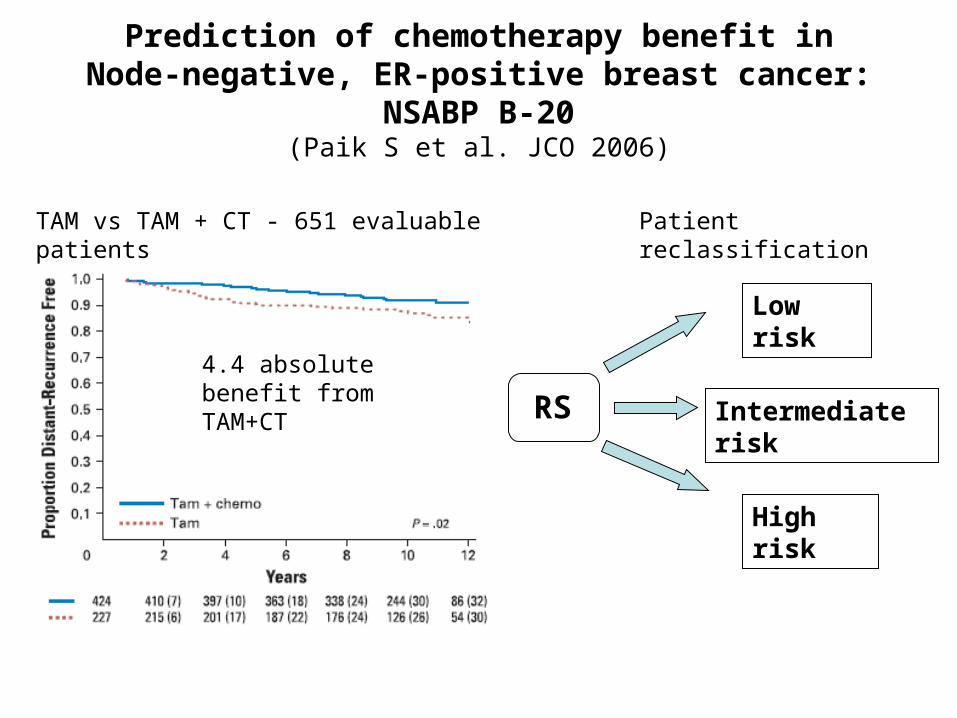
Prediction of chemotherapy benefit inNode-negative, ER-positive breast cancer: NSABP B-20
(Paik S et al. JCO 2006)
4.4 absolute benefit from TAM+CT
TAM vs TAM + CT - 651 evaluable patients Patient reclassification
RS
Low risk
Intermediate risk
High risk
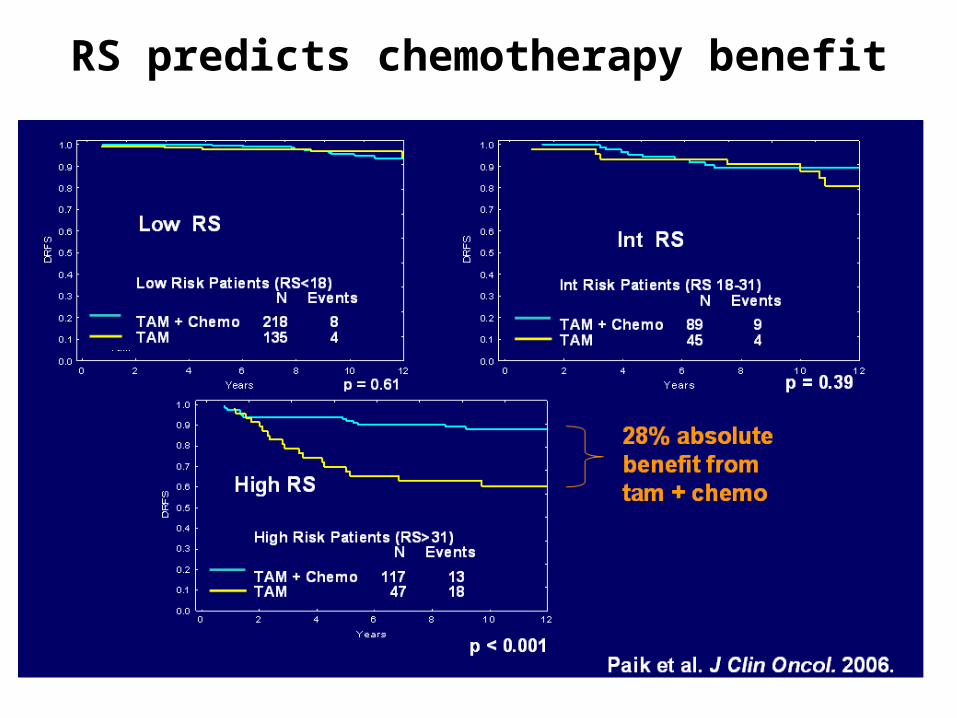
RS predicts chemotherapy benefit

Schema: TAILORx
Node-Neg, ER-Pos Breast CancerNode-Neg, ER-Pos Breast Cancer
RS <10HormoneTherapy
RS <10HormoneTherapy
RS 11-25RandomizeHormone
vsChemotherapy +
Hormone
RS 11-25RandomizeHormone
vsChemotherapy +
Hormone
RS >25Chemotherapy
+Hormone
RS >25Chemotherapy
+Hormone
Oncotype DX® AssayOncotype DX® Assay
Primary study group
To determine whether adjuvant hormonal therapy is not inferior to adjuvant chemohormonal for patients in the “primary study group”

Oncologist treatment recommendations after RS: N- ER+ patients

Others Genetic Element of Interest
Chin L, Gray JW. Nature 2008

Why proteomic?
Cellular signaling events are driven by protein-protein interactions, post-translational protein modifications and enzymatic activities that cannot be predicted accurately or described by transcriptional profiling methods alone.
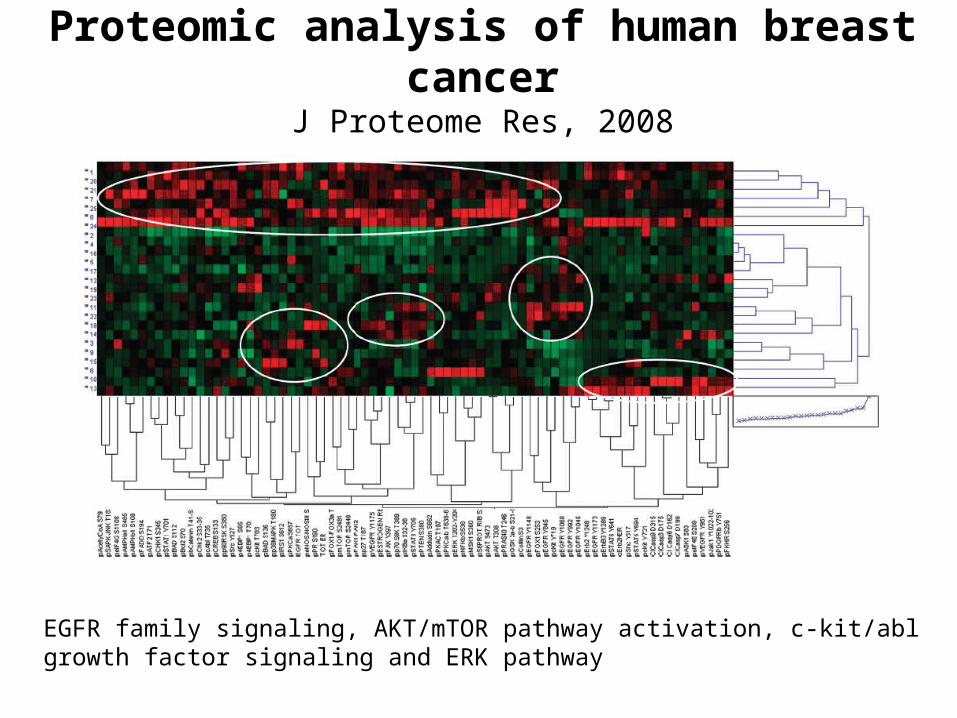
Proteomic analysis of human breast cancerJ Proteome Res, 2008
EGFR family signaling, AKT/mTOR pathway activation, c-kit/abl growth factor signaling and ERK pathway
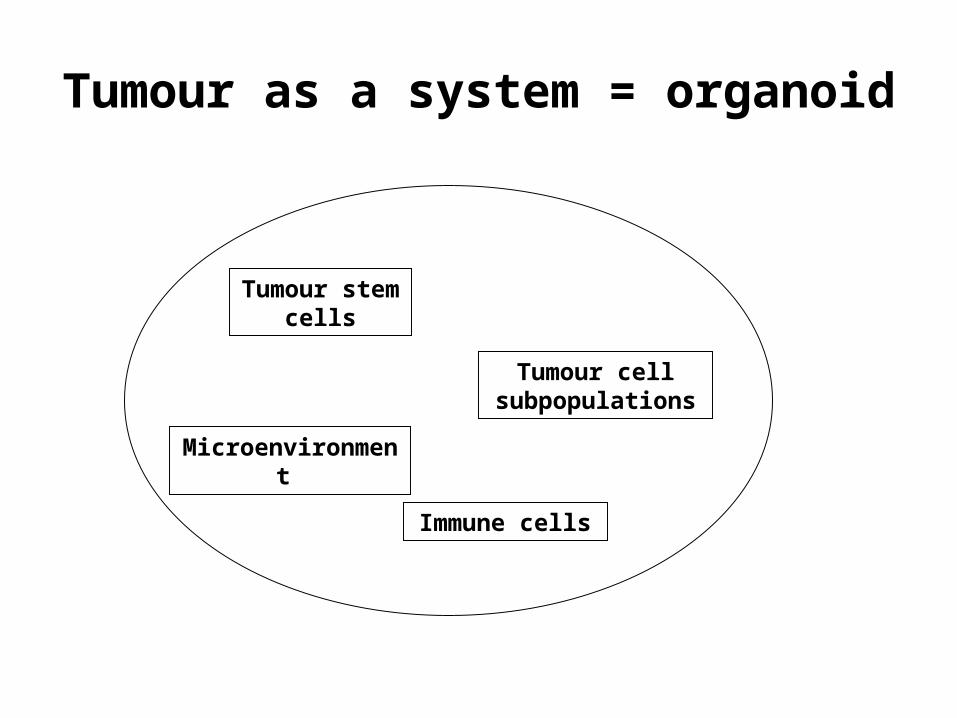
Tumour as a system = organoid
Tumour stem cells
Tumour cell subpopulations
Microenvironment
Immune cells


