
F1
2
3
4Q1
56
7
910
1112131415
16
17
18
19
20
21
22
23
24
25
26
27
28
29
30
31
32
33
34
35
36
37
38
39
40
41
424344454647
4849
50
51
52
53
Journal of Contaminant Hydrology xxx (2013) xxx–xxx
Q5
CONHYD-02911; No of Pages 15
Contents lists available at SciVerse ScienceDirect
Journal of Contaminant Hydrology
j ourna l homepage: www.e lsev ie r .com/ locate / jconhyd
O
Identifying sources of groundwater nitrate contamination in alarge alluvial groundwater basin with highly diversifiedintensive agricultural production
ROK.M. Lockhart a, A.M. King b, T. Harter a,⁎
a Department of Land, Air and Water Resources, University of California, One Shields Avenue, Davis, CA 95616, USAb Department of Civil and Environmental Engineering, University of California, One Shields Avenue, Davis, CA 95616, USA
a r t i c l e i n f o
CO
⁎ Corresponding author. Tel.: +1 530 400 1784; faxE-mail addresses: [email protected] (K.M. L
[email protected] (A.M. King), aaron.m.king@gma
0169-7722/$ – see front matter © 2013 Published byhttp://dx.doi.org/10.1016/j.jconhyd.2013.05.008
Please cite this article as: Lockhart, K.M.,groundwater basin with highly..., Journal o
Pa b s t r a c t
Article history:Received 18 July 2012Received in revised form 9 May 2013Accepted 25 May 2013Available online xxxx
RRECTEDGroundwater quality is a concern in alluvial aquifers underlying agricultural areas worldwide.
Nitrate from land applied fertilizers or from animal waste can leach to groundwater andcontaminate drinking water resources. The San Joaquin Valley, California, is an example of anagricultural landscape with a large diversity of field, vegetable, tree, nut, and citrus crops, butalso confined animal feeding operations (CAFOs, here mostly dairies) that generate, store, andland apply large amounts of liquid manure. As in other such regions around the world, therural population in the San Joaquin Valley relies almost exclusively on shallow domestic wells(≤150 m deep), of which many have been affected by nitrate. Variability in crops, soil type,and depth to groundwater contribute to large variability in nitrate occurrence across theunderlying aquifer system. The role of these factors in controlling groundwater nitratecontamination levels is examined. Two hundred domestic wells were sampled in twosub-regions of the San Joaquin Valley, Stanislaus and Merced (Stan/Mer) and Tulare and Kings(Tul/Kings) Counties. Forty six percent of well water samples in Tul/Kings and 42% of wellwater samples in Stan/Mer exceeded the MCL for nitrate (10 mg/L NO3-N). For statisticalanalysis of nitrate contamination, 78 crop and landuse types were considered by groupingthem into ten categories (CAFO, citrus, deciduous fruits and nuts, field crops, forage, native,pasture, truck crops, urban, and vineyards). Vadose zone thickness, soil type, well constructioninformation, well proximity to dairies, and dominant landuse near the well were considered.In the Stan/Mer area, elevated nitrate levels in domestic wells most strongly correlate with thecombination of very shallow (≤21 m) water table and the presence of either CAFO derivedanimal waste applications or deciduous fruit and nut crops (synthetic fertilizer applications).In Tulare County, statistical data indicate that elevated nitrate levels in domestic well water aremost strongly associated with citrus orchards when located in areas with a very shallow(≤21 m) water table. Kings County had relatively few nitrate MCL exceedances in domesticwells, probably due to the deeper water table in Kings County.
© 2013 Published by Elsevier B.V.
Keywords:GroundwaterNitrateNon-point source contaminationGroundwater and agriculturePollution
N
54 Q655
56
57
U
1. Introduction
Elevated nitrate levels (more than 2 mg/L NO3-N) ingroundwater used as drinking water have been linked to
58
59
60
61
: +1 530 752 5262.ockhart),il.com (T. Harter).
Elsevier B.V.
et al., Identifying sourcf Contaminant Hydrolog
adverse health effects (Mueller andHelsel, 1996). Consumptionof water containing elevated levels of nitrate can cause lowblood oxygen in infants, a condition known as methemoglobi-nemia or “blue baby syndrome”. Methemoglobinemia was theimpetus behind the United States Environmental ProtectionAgency (USEPA) maximum contamination level (MCL) of10 mg/L NO3-N (Mueller and Helsel, 1996). Nitrate in drinkingwater has also been linked to cancer through the formation
es of groundwater nitrate contamination in a large alluvialy (2013), http://dx.doi.org/10.1016/j.jconhyd.2013.05.008
62
63
64
65
66
67
68
69
70
71
72
73
74
75
76
77
78
79
2 K.M. Lockhart et al. / Journal of Contaminant Hydrology xxx (2013) xxx–xxx
of carcinogenic N-nitroso compounds (Weyer et al., 2001),to spontaneous abortions (Centers for Disease Control andPrevention, 1996), and to non-Hodgkin's lymphoma (Wardet al., 1996).
Nitrate occurs naturally in groundwater. However, septicleakage, nitrogen fertilizers, and animal manure applied to soilcan cause elevated levels of nitrate in groundwater (Owenset al., 1992). High groundwater nitrate has been positivelycorrelated with surrounding agricultural landuse (Vowinkel
UNCO
RREC
M
Fresno
Merced
Stanislaus
Depth to Unconfined
Groundwater (ft)
10 - 30
31 - 50
51 - 70
71 - 100
101 - 160
County Borders
San
Sacrame
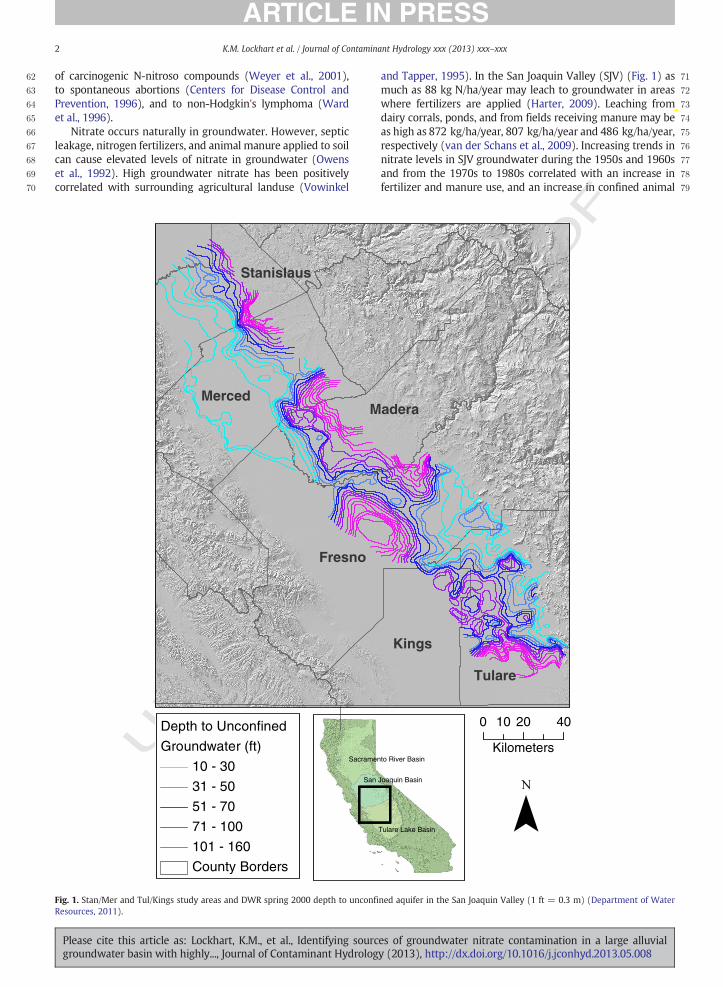
Fig. 1. Stan/Mer and Tul/Kings study areas and DWR spring 2000 depth to unconfiResources, 2011).
Please cite this article as: Lockhart, K.M., et al., Identifying sourcgroundwater basin with highly..., Journal of Contaminant Hydrolog
and Tapper, 1995). In the San Joaquin Valley (SJV) (Fig. 1) asmuch as 88 kg N/ha/year may leach to groundwater in areaswhere fertilizers are applied (Harter, 2009). Leaching fromdairy corrals, ponds, and from fields receiving manure may beas high as 872 kg/ha/year, 807 kg/ha/year and 486 kg/ha/year,respectively (van der Schans et al., 2009). Increasing trends innitrate levels in SJV groundwater during the 1950s and 1960sand from the 1970s to 1980s correlated with an increase infertilizer and manure use, and an increase in confined animal
TED P
RO
OF
adera
Tulare
Kings
0 20 4010
Kilometers
Tulare Lake Basin
Joaquin Basin
nto River Basin
ned aquifer in the San Joaquin Valley (1 ft = 0.3 m) (Department of Water
es of groundwater nitrate contamination in a large alluvialy (2013), http://dx.doi.org/10.1016/j.jconhyd.2013.05.008
C
80
81
82
83
84
85
86
87
88
89
90
91
92
93
94
95
96
97
98
99
100
101
102
103
104
105
106
107
108
109
110
111
112
113
114
115
116
117
118
119
120
121
122
123
124
125
126
127
128
129
130
131
132
133
134
135
136
137
138
139
140
141
142
143
144
145
146
147
148
149
150
151
152
153
154
155
156
157
158Q7159
160
161
162
163
164
165
166
167
168
169
170
171
172
173
174
175
176
177
178
179
180
181
182
183
184
185
186
187
188
189
190
191
192
193
194
195
196
3K.M. Lockhart et al. / Journal of Contaminant Hydrology xxx (2013) xxx–xxx
UNCO
RRE
feeding operations (CAFOs) in the SJV over the same timeperiod (Dubrovsky et al., 1998).
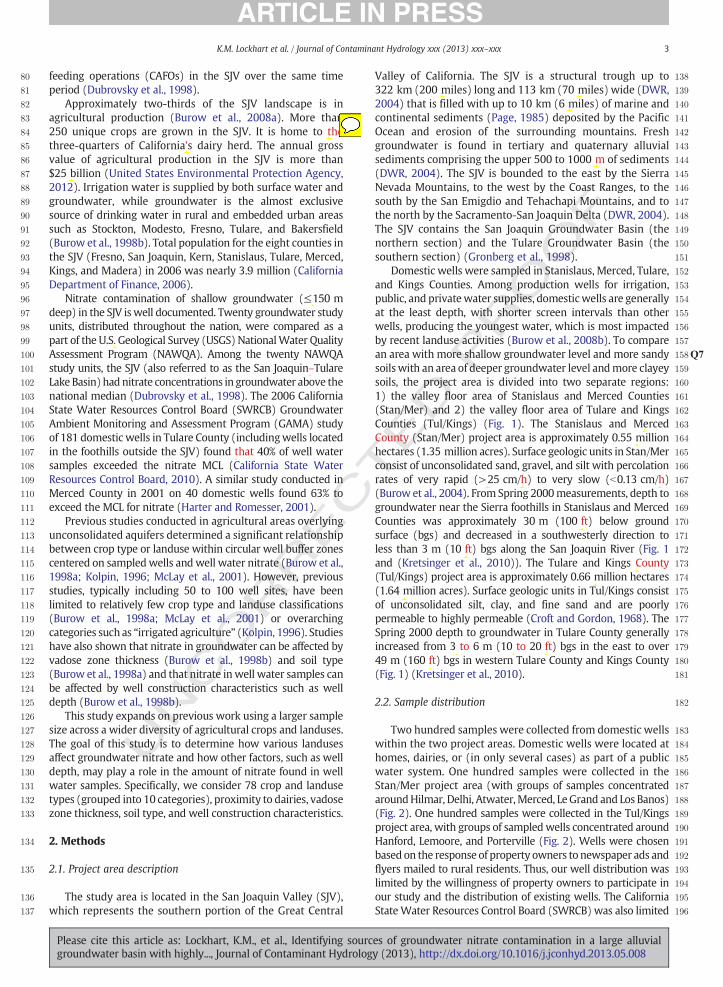
Approximately two-thirds of the SJV landscape is inagricultural production (Burow et al., 2008a). More than250 unique crops are grown in the SJV. It is home to thethree-quarters of California's dairy herd. The annual grossvalue of agricultural production in the SJV is more than$25 billion (United States Environmental Protection Agency,2012). Irrigation water is supplied by both surface water andgroundwater, while groundwater is the almost exclusivesource of drinking water in rural and embedded urban areassuch as Stockton, Modesto, Fresno, Tulare, and Bakersfield(Burow et al., 1998b). Total population for the eight counties inthe SJV (Fresno, San Joaquin, Kern, Stanislaus, Tulare, Merced,Kings, and Madera) in 2006 was nearly 3.9 million (CaliforniaDepartment of Finance, 2006).
Nitrate contamination of shallow groundwater (≤150 mdeep) in the SJV iswell documented. Twenty groundwater studyunits, distributed throughout the nation, were compared as apart of the U.S. Geological Survey (USGS) NationalWater QualityAssessment Program (NAWQA). Among the twenty NAWQAstudy units, the SJV (also referred to as the San Joaquin–TulareLake Basin) had nitrate concentrations in groundwater above thenational median (Dubrovsky et al., 1998). The 2006 CaliforniaState Water Resources Control Board (SWRCB) GroundwaterAmbient Monitoring and Assessment Program (GAMA) studyof 181 domestic wells in Tulare County (includingwells locatedin the foothills outside the SJV) found that 40% of well watersamples exceeded the nitrate MCL (California State WaterResources Control Board, 2010). A similar study conducted inMerced County in 2001 on 40 domestic wells found 63% toexceed the MCL for nitrate (Harter and Romesser, 2001).
Previous studies conducted in agricultural areas overlyingunconsolidated aquifers determined a significant relationshipbetween crop type or landuse within circular well buffer zonescentered on sampledwells andwell water nitrate (Burow et al.,1998a; Kolpin, 1996; McLay et al., 2001). However, previousstudies, typically including 50 to 100 well sites, have beenlimited to relatively few crop type and landuse classifications(Burow et al., 1998a; McLay et al., 2001) or overarchingcategories such as “irrigated agriculture” (Kolpin, 1996). Studieshave also shown that nitrate in groundwater can be affected byvadose zone thickness (Burow et al., 1998b) and soil type(Burow et al., 1998a) and that nitrate inwell water samples canbe affected by well construction characteristics such as welldepth (Burow et al., 1998b).
This study expands on previous work using a larger samplesize across a wider diversity of agricultural crops and landuses.The goal of this study is to determine how various landusesaffect groundwater nitrate and how other factors, such as welldepth, may play a role in the amount of nitrate found in wellwater samples. Specifically, we consider 78 crop and landusetypes (grouped into 10 categories), proximity to dairies, vadosezone thickness, soil type, and well construction characteristics.
2. Methods
2.1. Project area description
The study area is located in the San Joaquin Valley (SJV),which represents the southern portion of the Great Central
Please cite this article as: Lockhart, K.M., et al., Identifying sourcgroundwater basin with highly..., Journal of Contaminant Hydrolog
TED P
RO
OF
Valley of California. The SJV is a structural trough up to322 km (200 miles) long and 113 km (70 miles) wide (DWR,2004) that is filled with up to 10 km (6 miles) of marine andcontinental sediments (Page, 1985) deposited by the PacificOcean and erosion of the surrounding mountains. Freshgroundwater is found in tertiary and quaternary alluvialsediments comprising the upper 500 to 1000 m of sediments(DWR, 2004). The SJV is bounded to the east by the SierraNevada Mountains, to the west by the Coast Ranges, to thesouth by the San Emigdio and Tehachapi Mountains, and tothe north by the Sacramento-San Joaquin Delta (DWR, 2004).The SJV contains the San Joaquin Groundwater Basin (thenorthern section) and the Tulare Groundwater Basin (thesouthern section) (Gronberg et al., 1998).
Domestic wells were sampled in Stanislaus, Merced, Tulare,and Kings Counties. Among production wells for irrigation,public, and privatewater supplies, domesticwells are generallyat the least depth, with shorter screen intervals than otherwells, producing the youngest water, which is most impactedby recent landuse activities (Burow et al., 2008b). To comparean area with more shallow groundwater level and more sandysoilswith an area of deeper groundwater level andmore clayeysoils, the project area is divided into two separate regions:1) the valley floor area of Stanislaus and Merced Counties(Stan/Mer) and 2) the valley floor area of Tulare and KingsCounties (Tul/Kings) (Fig. 1). The Stanislaus and MercedCounty (Stan/Mer) project area is approximately 0.55 millionhectares (1.35 million acres). Surface geologic units in Stan/Merconsist of unconsolidated sand, gravel, and silt with percolationrates of very rapid (>25 cm/h) to very slow (b0.13 cm/h)(Burow et al., 2004). From Spring 2000measurements, depth togroundwater near the Sierra foothills in Stanislaus and MercedCounties was approximately 30 m (100 ft) below groundsurface (bgs) and decreased in a southwesterly direction toless than 3 m (10 ft) bgs along the San Joaquin River (Fig. 1and (Kretsinger et al., 2010)). The Tulare and Kings County(Tul/Kings) project area is approximately 0.66 million hectares(1.64 million acres). Surface geologic units in Tul/Kings consistof unconsolidated silt, clay, and fine sand and are poorlypermeable to highly permeable (Croft and Gordon, 1968). TheSpring 2000 depth to groundwater in Tulare County generallyincreased from 3 to 6 m (10 to 20 ft) bgs in the east to over49 m (160 ft) bgs in western Tulare County and Kings County(Fig. 1) (Kretsinger et al., 2010).
2.2. Sample distribution
Two hundred samples were collected from domestic wellswithin the two project areas. Domestic wells were located athomes, dairies, or (in only several cases) as part of a publicwater system. One hundred samples were collected in theStan/Mer project area (with groups of samples concentratedaroundHilmar, Delhi, Atwater,Merced, Le Grand and Los Banos)(Fig. 2). One hundred samples were collected in the Tul/Kingsproject area, with groups of sampledwells concentrated aroundHanford, Lemoore, and Porterville (Fig. 2). Wells were chosenbased on the response of property owners to newspaper ads andflyers mailed to rural residents. Thus, our well distribution waslimited by the willingness of property owners to participate inour study and the distribution of existing wells. The CaliforniaStateWater Resources Control Board (SWRCB) was also limited
es of groundwater nitrate contamination in a large alluvialy (2013), http://dx.doi.org/10.1016/j.jconhyd.2013.05.008
ECTED P
RO
OF
197
198
199
200
201
202
203
204
205
206
207
208
209
210
211
212
213
214
215
216
217
218
219
220
221
222
223
224
225
226
227
228
229
230
231
232
233
234
235
236
237
238
239
240
241
242
Nitrate as Nitrogen
(mg/L)
2 or less
2 to 5
5 to 10
over 10
DPR GWPA Zones
Leaching
Runoff
Runoff / Leaching
Populated Areas
County Borders
0 10 20 30 405
Kilometers
Fig. 2. Sample locations color-coded by nitrate level and GWPAs (each square is 2.6 km2 (1 mile2) (DPR, 2011)) for Stan/Mer and Tul/Kings.
4 K.M. Lockhart et al. / Journal of Contaminant Hydrology xxx (2013) xxx–xxx
UNCO
RR
by volunteer responses to mailed flyers in selecting domesticwells for their 2006GAMAdomesticwell study in Tulare Countyfor which 1500 flyers were mailed and 181 people volunteeredto have their well tested (California State Water ResourcesControl Board, 2010). We observed a similar response rate toour mailed flyers and sampled almost all volunteered wells.We were not able to target wells with particular surroundinglanduse.
2.3. Sample collection and analysis
Samples were collected between Spring 2010 and Summer2011. Each well was sampled only once. Previously, nosignificant seasonal variation was found in nitrate in ground-water sampled every 5–6 weeks for four years (1995–1999)from monitoring wells on five SJV dairies (Harter et al., 2002).In this region, recharge to groundwater is from both summerirrigation and winter rain. Recharge does not have strongseasonal variations in low to normal rainfall years, but can behigher in spring months of wet years (Ruud et al., 2004). Indomestic wells of the two study areas, significant seasonalvariations of nitrate in groundwater were not expected dueto the relative constancy of recharge, due to mixing anddispersion in the vadose zone, and perhaps most importantly
Please cite this article as: Lockhart, K.M., et al., Identifying sourcgroundwater basin with highly..., Journal of Contaminant Hydrolog
due to mixing of groundwater of varying age along thedomestic well screen (Horn and Harter, 2009; Kourakos et al.,2012).
All water samples were collected from spigots outside ofthe home or dairy facility. When a water storage tank waspresent at the well, samples were collected from spigotsbefore the tank when possible (32 wells in Stan/Mer and 21wells in Tul/Kings). When the wellhead was inaccessible or aspigot was not present between the tank and the wellhead,the sample was collected at the closest accessible spigot tothe wellhead. Two samples in Stan/Mer were collected after afilter. Approximately 57 L (15 gal) were purged from eachwell before sample collection to clear out standing water inpipes. If water displayed a tint or odor, up to 380 L (100 gal)was purged until water is cleared. Water storage tanks werenot drained. After purging, the spigot was fitted with plastictubing and water was filtered through a 0.45-micron filterand collected in a 250 mL clear plastic bottle. Date and timeof collection were recorded as well as the precise latitude andlongitude location of the well. Samples were kept cool in anice chest while still in the field and then transported to UCDavis' cold room for storage before delivery to the UC DavisAnalytical Lab for analysis. Samples were collected over a oneyear period and delivered to the lab approximately every
es of groundwater nitrate contamination in a large alluvialy (2013), http://dx.doi.org/10.1016/j.jconhyd.2013.05.008
C
243
244
245
246
247
248
249
250
251
252
253
254
255
256
257
258
259
260
261
262
263
264
265
266
267
268
269
270
271
272
273
274
275
276
277
278
279
280
281
282
283
284
285
286
287
288
289
290
291
292
293
294
295
296
297
298
299
300
301
302
303
304
305
306
307
308
309
310
311
312
313
314
315
316
317
318
319
320
321
322
323
324
325
326
327
328
329
330
331
332
333
334
335
336
337
338
339
340
341
342
343
344
345
346
347
348
349
350
351
352
353
5K.M. Lockhart et al. / Journal of Contaminant Hydrology xxx (2013) xxx–xxx
UNCO
RRE
3 weeks. For quality control, field blanks and duplicates werecollected approximately every 10 wells. Nitrate was notdetected in any field blanks and average percent differencebetween sample and field duplicate was 0.5. Samples wereanalyzed for nitrate as NO3-N by the Cadmium Reduction FlowInjectionMethod, StandardMethod4500-NO3-N I (Clesceri et al.,1998). This method reduces any nitrate present in the sample tonitrite, thus the result is total nitrate plus nitrite. However, forgroundwater samples in our study area, it is typical for nitrite tobe negligible.
2.4. Landuse analysis
Landuse analysis was performed using ESRI ArcGIS (Version10) and the California Augmented Multisource Landcover Map(CAML) (Hollander, 2010) 50 m grid of landuse/landcover,which was reclassified into ten categories:
• Native,• Urban,• Citrus,• Deciduous fruits and nuts,• Forage,• Field crops,• Pasture,• CAFOs,• Truck crops (i.e., vegetables and berry crops), and• Vineyards.
See Appendix A for a list of original crop and landusetypes included in each category. The ten landuse categorieslisted above were quantified in square meters (m2) within a2.4 km radius (“well buffer area”) centered on each well. Acircular region centered on each well was chosen becausegroundwater flow direction at each well site was unknown. Inthe absence of known groundwater flow direction, a circularregion centered on each well reflects an unbiased estimate ofthepotential source area (Barringer et al., 1990). SeeAppendix Bfor justification on choice of the 2.4 km radius.
Since nitrate leaching into groundwater from dairy corralsand lagoons, or from manure applied to forage crops can be amajor contributor to groundwater nitrate (vander Schans et al.,2009), well distance to a dairy CAFO was also considered.To test possible CAFO derived animal waste contributions togroundwater nitrate, wells were given a “dairy” or “non-dairy”designation depending on the distance to the nearest dairycorral or lagoon. Latitude and longitude locations were used todetermine eachwell's distance to a dairy corral or lagoon. Dairycorral and lagoon polygons were digitized from the UnitedStates Department of Agriculture (USDA) National AgricultureImagery Program (NAIP) 2009 aerial imagery (United StatesDepartment of Agriculture, 2009). Wells located within a2.4 km radius from a dairy corral or lagoon were considered“dairy wells”, otherwise, they were considered “non-dairy”wells.
2.5. Other information
Well construction information was assembled from wellconstruction logs or from information provided by landowners.A well construction log or depth information supplied by thelandowner was available for 49 wells (49%) in the Stan/Mer
Please cite this article as: Lockhart, K.M., et al., Identifying sourcgroundwater basin with highly..., Journal of Contaminant Hydrolog
TED P
RO
OF
project area and for 42 wells (42%) in the Tul/Kings projectarea. Screened interval length was available for 42 wells (42%)in the Stan/Mer project area and for 38 wells (38%) in theTul/Kings project area. Although well construction informationwas not available for every well, we expect that the availabledata is an accurate representation of the wells in the area.
Groundwater depth and general soil type was collectedwith information provided by the California Department ofPesticide Regulation (CDPR). CDPR has modeled groundwater,soil, and pesticide detections to define Groundwater ProtectionAreas (GWPAs). GWPAs are 2.60 km2 (1 mile2) zones that aresensitive to themovement of pesticides leading to pesticide userestrictions in these zones (DPR, 2011). A GWPA has one ormore of the following characteristics:
• Previous detections of pesticides in that section, or• Contains coarse soils and depth to groundwater b 21 m(70 ft) (leaching zones), or
• Contains runoff-prone soils or hardpans and depth togroundwater b 21 m (70 ft) (runoff zones) (DPR, 2011).
GIS shapefiles of CDPR GWPA zones were used to determineif awellwas locatedwithin aGWPA.Within aGWPA,wellswereassigned a categorical descriptor for depth to groundwater b21 m (70 ft). Outside a GWPA wells were assigned depthto groundwater > 21 m (70 ft). Wells within GWPAs wereassumed to be dominated by soil type “leaching” or “runoff”depending on the GWPA designation (Fig. 2).
2.6. Statistical methods
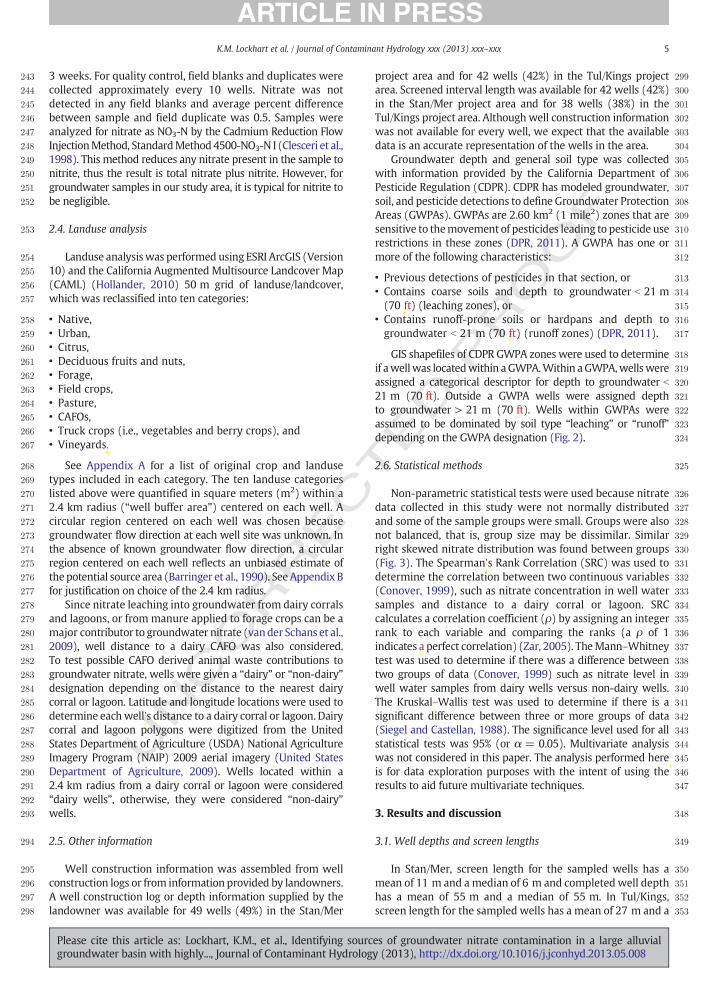
Non-parametric statistical tests were used because nitratedata collected in this study were not normally distributedand some of the sample groups were small. Groups were alsonot balanced, that is, group size may be dissimilar. Similarright skewed nitrate distribution was found between groups(Fig. 3). The Spearman's Rank Correlation (SRC) was used todetermine the correlation between two continuous variables(Conover, 1999), such as nitrate concentration in well watersamples and distance to a dairy corral or lagoon. SRCcalculates a correlation coefficient (ρ) by assigning an integerrank to each variable and comparing the ranks (a ρ of 1indicates a perfect correlation) (Zar, 2005). TheMann–Whitneytest was used to determine if there was a difference betweentwo groups of data (Conover, 1999) such as nitrate level inwell water samples from dairy wells versus non-dairy wells.The Kruskal–Wallis test was used to determine if there is asignificant difference between three or more groups of data(Siegel and Castellan, 1988). The significance level used for allstatistical tests was 95% (or α = 0.05). Multivariate analysiswas not considered in this paper. The analysis performed hereis for data exploration purposes with the intent of using theresults to aid future multivariate techniques.
3. Results and discussion
3.1. Well depths and screen lengths
In Stan/Mer, screen length for the sampled wells has amean of 11 m and a median of 6 m and completed well depthhas a mean of 55 m and a median of 55 m. In Tul/Kings,screen length for the sampled wells has a mean of 27 m and a
es of groundwater nitrate contamination in a large alluvialy (2013), http://dx.doi.org/10.1016/j.jconhyd.2013.05.008
354
355
356
357
358
359
360
361
362
363
364
365
366
367
368
369
370
371
372
375376377378379380381382383384385386387388389390391392
393
394
395
396
397
398
399
400
401
402
403
404
405
406
407
408
409
410
411
412
413
414
415
416
417
418
419
420
421
422
423
424
425
426
427
428
0 5 10 15 20 25 30 35 40 45 50 55 60 65 700
0.1
0.2
0.3
0.4
0.5
0.6
0.7
0.8
0.9
1C
umul
ativ
e F
requ
ency
Nitrate as NO3 N (mg/L)
Stan/Mer, DairyStan/Mer, Non DairyTul/Kings, DairyTul/Kings, Non Dairy
Fig. 3. Distribution of nitrate for Stan/Mer and Tul/Kings dairy and non-dairygroups.
6 K.M. Lockhart et al. / Journal of Contaminant Hydrology xxx (2013) xxx–xxx
RREC
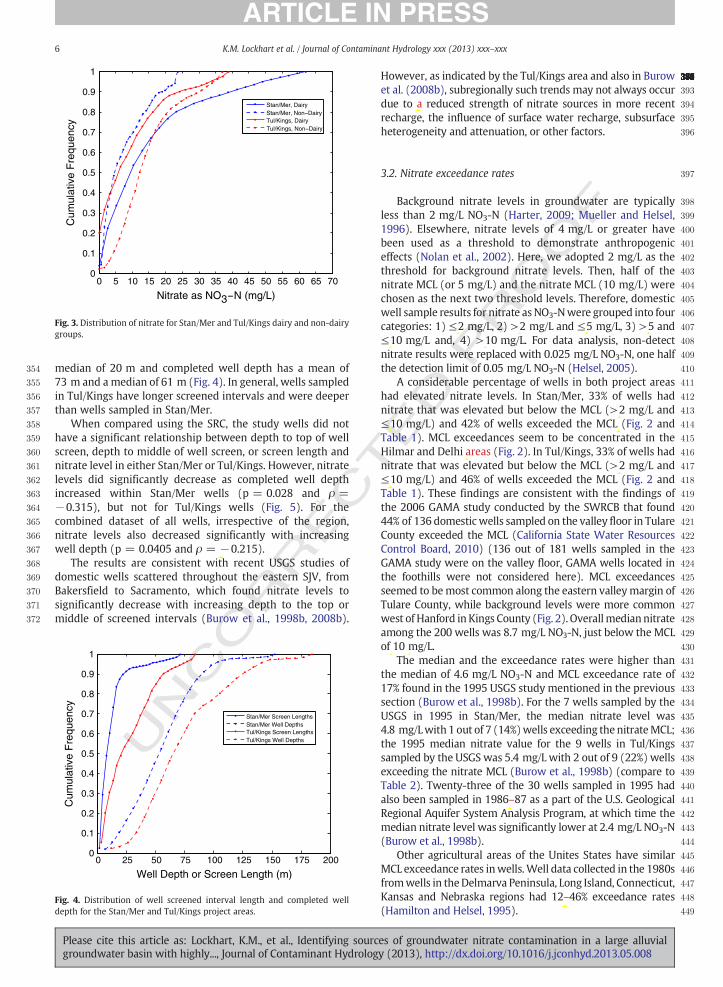
median of 20 m and completed well depth has a mean of73 m and a median of 61 m (Fig. 4). In general, wells sampledin Tul/Kings have longer screened intervals and were deeperthan wells sampled in Stan/Mer.
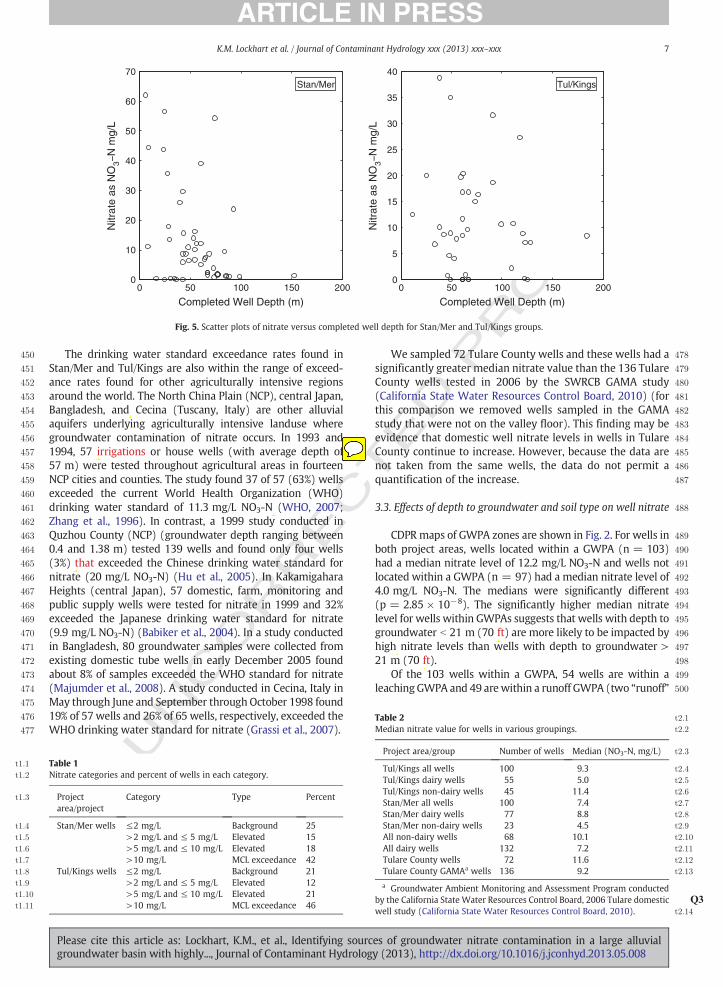
When compared using the SRC, the study wells did nothave a significant relationship between depth to top of wellscreen, depth to middle of well screen, or screen length andnitrate level in either Stan/Mer or Tul/Kings. However, nitratelevels did significantly decrease as completed well depthincreased within Stan/Mer wells (p = 0.028 and ρ =−0.315), but not for Tul/Kings wells (Fig. 5). For thecombined dataset of all wells, irrespective of the region,nitrate levels also decreased significantly with increasingwell depth (p = 0.0405 and ρ = −0.215).
The results are consistent with recent USGS studies ofdomestic wells scattered throughout the eastern SJV, fromBakersfield to Sacramento, which found nitrate levels tosignificantly decrease with increasing depth to the top ormiddle of screened intervals (Burow et al., 1998b, 2008b).
UNCO 429
430
431
432
433
434
435
436
437
438
439
440
441
442
443
444
445
446
447
448
449
0 25 50 75 100 125 150 175 2000
0.1
0.2
0.3
0.4
0.5
0.6
0.7
0.8
0.9
1
Cum
ulat
ive
Fre
quen
cy
Well Depth or Screen Length (m)
Stan/Mer Screen LengthsStan/Mer Well DepthsTul/Kings Screen LengthsTul/Kings Well Depths
Fig. 4. Distribution of well screened interval length and completed weldepth for the Stan/Mer and Tul/Kings project areas.
Please cite this article as: Lockhart, K.M., et al., Identifyinggroundwater basin with highly..., Journal of Contaminant Hy
l
sourcdrolog
However, as indicated by the Tul/Kings area and also in Burowet al. (2008b), subregionally such trends may not always occurdue to a reduced strength of nitrate sources in more recentrecharge, the influence of surface water recharge, subsurfaceheterogeneity and attenuation, or other factors.
TED P
RO
OF
3.2. Nitrate exceedance rates
Background nitrate levels in groundwater are typicallyless than 2 mg/L NO3-N (Harter, 2009; Mueller and Helsel,1996). Elsewhere, nitrate levels of 4 mg/L or greater havebeen used as a threshold to demonstrate anthropogeniceffects (Nolan et al., 2002). Here, we adopted 2 mg/L as thethreshold for background nitrate levels. Then, half of thenitrate MCL (or 5 mg/L) and the nitrate MCL (10 mg/L) werechosen as the next two threshold levels. Therefore, domesticwell sample results for nitrate asNO3-Nwere grouped into fourcategories: 1) ≤2 mg/L, 2) >2 mg/L and ≤5 mg/L, 3) >5 and≤10 mg/L and, 4) >10 mg/L. For data analysis, non-detectnitrate results were replaced with 0.025 mg/L NO3-N, one halfthe detection limit of 0.05 mg/L NO3-N (Helsel, 2005).
A considerable percentage of wells in both project areashad elevated nitrate levels. In Stan/Mer, 33% of wells hadnitrate that was elevated but below the MCL (>2 mg/L and≤10 mg/L) and 42% of wells exceeded the MCL (Fig. 2 andTable 1). MCL exceedances seem to be concentrated in theHilmar and Delhi areas (Fig. 2). In Tul/Kings, 33% of wells hadnitrate that was elevated but below the MCL (>2 mg/L and≤10 mg/L) and 46% of wells exceeded the MCL (Fig. 2 andTable 1). These findings are consistent with the findings ofthe 2006 GAMA study conducted by the SWRCB that found44% of 136 domesticwells sampled on the valley floor in TulareCounty exceeded the MCL (California State Water ResourcesControl Board, 2010) (136 out of 181 wells sampled in theGAMA study were on the valley floor, GAMA wells located inthe foothills were not considered here). MCL exceedancesseemed to bemost common along the eastern valleymargin ofTulare County, while background levels were more commonwest of Hanford in Kings County (Fig. 2). Overallmediannitrateamong the 200 wells was 8.7 mg/L NO3-N, just below the MCLof 10 mg/L.
The median and the exceedance rates were higher thanthe median of 4.6 mg/L NO3-N and MCL exceedance rate of17% found in the 1995 USGS study mentioned in the previoussection (Burow et al., 1998b). For the 7 wells sampled by theUSGS in 1995 in Stan/Mer, the median nitrate level was4.8 mg/Lwith 1 out of 7 (14%)wells exceeding the nitrateMCL;the 1995 median nitrate value for the 9 wells in Tul/Kingssampled by the USGS was 5.4 mg/L with 2 out of 9 (22%) wellsexceeding the nitrate MCL (Burow et al., 1998b) (compare toTable 2). Twenty-three of the 30 wells sampled in 1995 hadalso been sampled in 1986–87 as a part of the U.S. GeologicalRegional Aquifer System Analysis Program, at which time themedian nitrate level was significantly lower at 2.4 mg/L NO3-N(Burow et al., 1998b).
Other agricultural areas of the Unites States have similarMCL exceedance rates inwells.Well data collected in the 1980sfromwells in theDelmarva Peninsula, Long Island, Connecticut,Kansas and Nebraska regions had 12–46% exceedance rates(Hamilton and Helsel, 1995).
es of groundwater nitrate contamination in a large alluvialy (2013), http://dx.doi.org/10.1016/j.jconhyd.2013.05.008
C
OO
F
450
451
452
453
454
455
456
457
458
459
460
461
462
463
464
465
466
467
468
469
470
471
472
473
474
475
476
477
478
479
480
481
482
483
484
485
486
487
488
489
490
491
492
493
494
495
496
497
498
499
500
0 50 100 150 2000
10
20
30
40
50
60
70Stan/Mer
Completed Well Depth (m)
Nitr
ate
as N
O3
N m
g/L
Nitr
ate
as N
O3
N m
g/L
0 50 100 150 2000
5
10
15
20
25
30
35
40Tul/Kings
Completed Well Depth (m)
Fig. 5. Scatter plots of nitrate versus completed well depth for Stan/Mer and Tul/Kings groups.
t1:1
t1:2
t1:3
t1:4
t1:5
t1:6
t1:7
t1:8
t1:9
t1:10
t1:11
Table 2 t2:1
t2:2Median nitrate value for wells in various groupings.
7K.M. Lockhart et al. / Journal of Contaminant Hydrology xxx (2013) xxx–xxx
NCO
RRE
The drinking water standard exceedance rates found inStan/Mer and Tul/Kings are also within the range of exceed-ance rates found for other agriculturally intensive regionsaround the world. The North China Plain (NCP), central Japan,Bangladesh, and Cecina (Tuscany, Italy) are other alluvialaquifers underlying agriculturally intensive landuse wheregroundwater contamination of nitrate occurs. In 1993 and1994, 57 irrigations or house wells (with average depth of57 m) were tested throughout agricultural areas in fourteenNCP cities and counties. The study found 37 of 57 (63%) wellsexceeded the current World Health Organization (WHO)drinking water standard of 11.3 mg/L NO3-N (WHO, 2007;Zhang et al., 1996). In contrast, a 1999 study conducted inQuzhou County (NCP) (groundwater depth ranging between0.4 and 1.38 m) tested 139 wells and found only four wells(3%) that exceeded the Chinese drinking water standard fornitrate (20 mg/L NO3-N) (Hu et al., 2005). In KakamigaharaHeights (central Japan), 57 domestic, farm, monitoring andpublic supply wells were tested for nitrate in 1999 and 32%exceeded the Japanese drinking water standard for nitrate(9.9 mg/L NO3-N) (Babiker et al., 2004). In a study conductedin Bangladesh, 80 groundwater samples were collected fromexisting domestic tube wells in early December 2005 foundabout 8% of samples exceeded the WHO standard for nitrate(Majumder et al., 2008). A study conducted in Cecina, Italy inMay through June and September through October 1998 found19% of 57wells and 26% of 65 wells, respectively, exceeded theWHO drinking water standard for nitrate (Grassi et al., 2007).
UTable 1Nitrate categories and percent of wells in each category.
Projectarea/project
Category Type Percent
Stan/Mer wells ≤2 mg/L Background 25>2 mg/L and ≤ 5 mg/L Elevated 15>5 mg/L and ≤ 10 mg/L Elevated 18>10 mg/L MCL exceedance 42
Tul/Kings wells ≤2 mg/L Background 21>2 mg/L and ≤ 5 mg/L Elevated 12>5 mg/L and ≤ 10 mg/L Elevated 21>10 mg/L MCL exceedance 46
Please cite this article as: Lockhart, K.M., et al., Identifying sourcgroundwater basin with highly..., Journal of Contaminant Hydrolog
TED P
R
We sampled 72 Tulare County wells and these wells had asignificantly greater median nitrate value than the 136 TulareCounty wells tested in 2006 by the SWRCB GAMA study(California State Water Resources Control Board, 2010) (forthis comparison we removed wells sampled in the GAMAstudy that were not on the valley floor). This finding may beevidence that domestic well nitrate levels in wells in TulareCounty continue to increase. However, because the data arenot taken from the same wells, the data do not permit aquantification of the increase.
3.3. Effects of depth to groundwater and soil type on well nitrate
CDPR maps of GWPA zones are shown in Fig. 2. For wells inboth project areas, wells located within a GWPA (n = 103)had a median nitrate level of 12.2 mg/L NO3-N and wells notlocated within a GWPA (n = 97) had a median nitrate level of4.0 mg/L NO3-N. The medians were significantly different(p = 2.85 × 10⁻⁸). The significantly higher median nitratelevel for wells within GWPAs suggests that wells with depth togroundwater b 21 m (70 ft) are more likely to be impacted byhigh nitrate levels than wells with depth to groundwater >21 m (70 ft).
Of the 103 wells within a GWPA, 54 wells are within aleaching GWPA and 49 arewithin a runoff GWPA (two “runoff”
t2:3Project area/group Number of wells Median (NO3-N, mg/L)
t2:4Tul/Kings all wells 100 9.3t2:5Tul/Kings dairy wells 55 5.0t2:6Tul/Kings non-dairy wells 45 11.4t2:7Stan/Mer all wells 100 7.4t2:8Stan/Mer dairy wells 77 8.8t2:9Stan/Mer non-dairy wells 23 4.5t2:10All non-dairy wells 68 10.1t2:11All dairy wells 132 7.2t2:12Tulare County wells 72 11.6t2:13Tulare County GAMAa wells 136 9.2
a Groundwater Ambient Monitoring and Assessment Program conductedby the Q3California State Water Resources Control Board, 2006 Tulare domesticwell study (California State Water Resources Control Board, 2010). t2:14
es of groundwater nitrate contamination in a large alluvialy (2013), http://dx.doi.org/10.1016/j.jconhyd.2013.05.008
PRO
OF
501
502
503
504
505
506
507
508
509
510
511
512
513
514
515
516
517
518
519
520
521
522
523
524
525
526
527
528
529
530
531
532
533
534
535
536
537
538
539
540
541
542
543
544
545
546
547
548
549
550
551
552
553
554
555
556
557
558
559
560
561
562
563
564
565
566
567
568
569
570
571
572
573
574
0 500 1000 1500 2000 2500 3000 3500 4000 4500 50000
5
10
15
20
25
30
35
40
45
50
Distance Between Nearest Neighbor Pairs (m)
Abs
olut
e D
iffer
ence
in N
itrat
e V
alue
as
NO
3N
mg/
L
Fig. 6. Scatterplot of distance between nearest neighbor well pairs andabsolute difference in nitrate value for wells closer than 5 km (3 miles).
Table 3 t3:1
t3:2Mann–Whitney dairy versus non-dairy test results.
t3:3Medians compared p-Value Result at 95% significance
t3:4Tul/Kingsdairy vs. non-dairywells 0.001 Significantly different,non-dairy higher-
t3:5Stan/Mer dairy vs. non-dairywells 0.131 Not significantly differenta
t3:6All wells dairy vs. non-dairy 0.075 Not significantly differenta
t3:7All wells Stan/Mer vs. Tul/Kings 0.861 Not significantly differenta
t3:8Non-dairy wells Stan/Mer vs.Tul/Kings
0.001 Significantly different,Tul/Kings highera
t3:9Dairywells Stan/Mer vs. Tul/Kings 0.026 Significantly different,Stan/Mer highera
t3:10Tulare County wells vs. TulareCounty GAMAb wells
0.021 Significantly different,Tulare County highera
a See Fig. 7. t3:11b Groundwater Ambient Monitoring and Assessment Program conducted
by the Q4California State Water Resources Control Board, 2006 Tulare domesticwell study (California State Water Resources Control Board, 2010). t3:12
8 K.M. Lockhart et al. / Journal of Contaminant Hydrology xxx (2013) xxx–xxx
UNCO
RREC
or “leaching” zoneswere reclassified as “leaching” zones for thepurpose of this study). Leaching zone wells had a mediannitrate value of 13.8 mg/L NO3-N and runoff zone wells had amedian nitrate value of 10.7 mg/L NO3-N. The median nitratelevels of leaching zone versus runoff zone wells were notsignificantly different. GWPA wells located in Stan/Mer (n =56) had a median nitrate value of 12.8 mg/L NO3-N and GWPAwells located in Tul/Kings (n = 47) had amedian nitrate valueof 11.4 mg/L NO3-N and these two medians were notstatistically different. Since no significant difference wasfound for nitrate in wells between leaching or runoffclassifications, we can assume that for wells with depth togroundwater b 21 m (70 ft) (very shallow groundwater),either soil type is vulnerable to elevated nitrate leaching.
In the Stan/Mer project area, CDPR GWPAs are mostlydesignated as leaching. The GWPAs are grouped throughoutthe areas where wells were sampled and MCL exceedancesfor nitrate are common throughout these areas (Fig. 2). Theseareas are susceptible to contamination through landuseactivities due to the very shallow water table. Stan/Mer hadsome of the highest nitrate values measured in this study,especially in the Hilmar area where the highest individualnitrate levels for this study were seen (includingone > 60 mg/L for a well 6.10 m deep).
Within the Tul/Kings project area, elevated nitrate ingroundwater seems mostly contained to Tulare County(Fig. 2). Within Tulare County, MCL exceedances seem to bethe most common east of Highway 99 and west of thefoothills (Fig. 2). The majority of CDPR GWPAs are locatedwithin this same area and are classified as runoff zones withdepth to groundwater b 21 m (70 ft). Very shallow ground-water located within these GWPA zones is likely affected byoverlying landuse through forced groundwater recharge offield runoff by ponding basins or dry wells.
Kings County has relatively few CDPR designated GWPAs.Kings County well water samples with relatively low nitratelevels (the majority less than 2 mg/L) are probably due to thedeeper water table in Kings County (generally > 21 m, or70 ft).
3.4. Spatial correlation of nitrate in nearby domestic wells
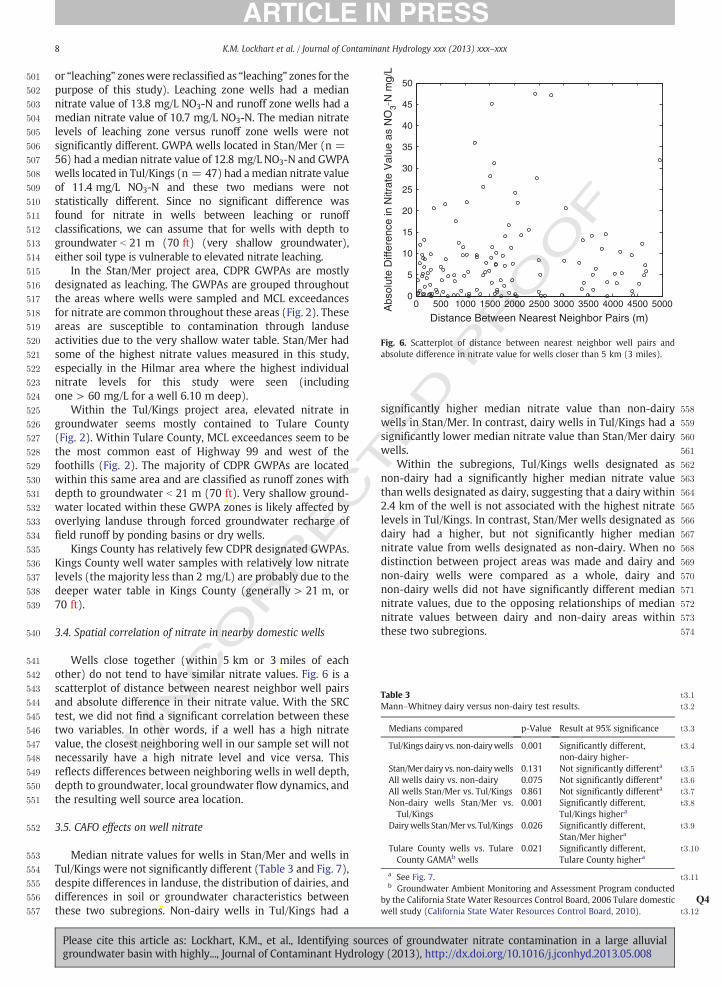
Wells close together (within 5 km or 3 miles of eachother) do not tend to have similar nitrate values. Fig. 6 is ascatterplot of distance between nearest neighbor well pairsand absolute difference in their nitrate value. With the SRCtest, we did not find a significant correlation between thesetwo variables. In other words, if a well has a high nitratevalue, the closest neighboring well in our sample set will notnecessarily have a high nitrate level and vice versa. Thisreflects differences between neighboring wells in well depth,depth to groundwater, local groundwater flow dynamics, andthe resulting well source area location.
3.5. CAFO effects on well nitrate
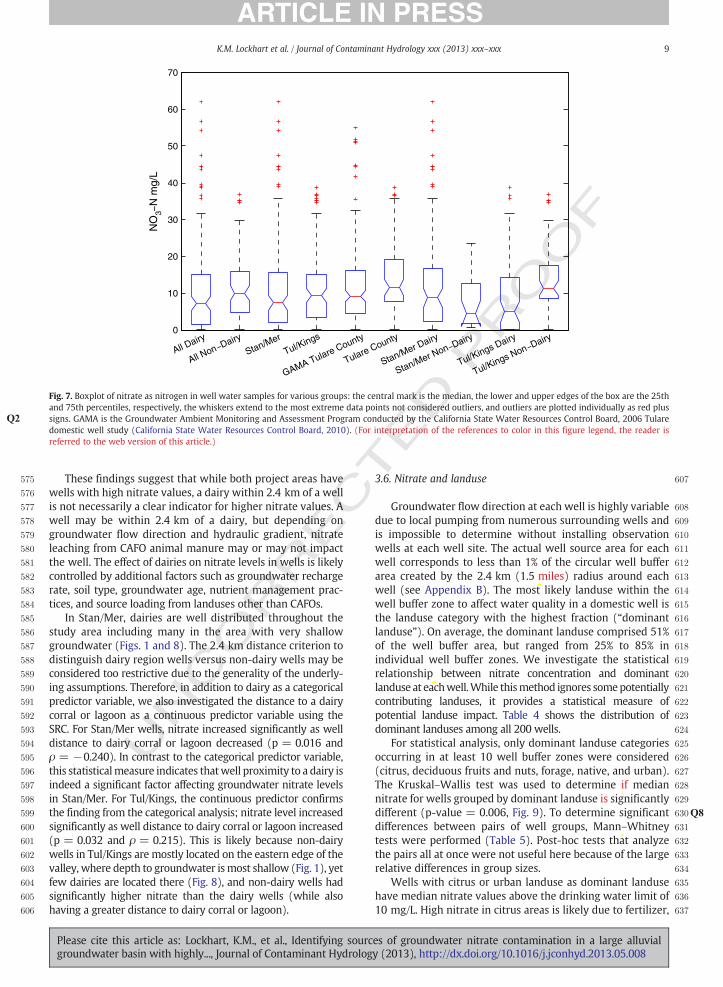
Median nitrate values for wells in Stan/Mer and wells inTul/Kings were not significantly different (Table 3 and Fig. 7),despite differences in landuse, the distribution of dairies, anddifferences in soil or groundwater characteristics betweenthese two subregions. Non-dairy wells in Tul/Kings had a
Please cite this article as: Lockhart, K.M., et al., Identifying sourcgroundwater basin with highly..., Journal of Contaminant Hydrolog
TEDsignificantly higher median nitrate value than non-dairy
wells in Stan/Mer. In contrast, dairy wells in Tul/Kings had asignificantly lower median nitrate value than Stan/Mer dairywells.
Within the subregions, Tul/Kings wells designated asnon-dairy had a significantly higher median nitrate valuethan wells designated as dairy, suggesting that a dairy within2.4 km of the well is not associated with the highest nitratelevels in Tul/Kings. In contrast, Stan/Mer wells designated asdairy had a higher, but not significantly higher mediannitrate value from wells designated as non-dairy. When nodistinction between project areas was made and dairy andnon-dairy wells were compared as a whole, dairy andnon-dairy wells did not have significantly different mediannitrate values, due to the opposing relationships of mediannitrate values between dairy and non-dairy areas withinthese two subregions.
es of groundwater nitrate contamination in a large alluvialy (2013), http://dx.doi.org/10.1016/j.jconhyd.2013.05.008
CED P
RO
OF
575
576
577
578
579
580
581
582
583
584
585
586
587
588
589
590
591
592
593
594
595
596
597
598
599
600
601
602
603
604
605
606
607
608
609
610
611
612
613
614
615
616
617
618
619
620
621
622
623
624
625
626
627
628
629
630Q8631
632
633
634
635
636
637
0
10
20
30
40
50
60
70
All Dairy
All Non Dairy
Stan/Mer
Tul/Kings
GAMA Tulare County
Tulare County
Stan/Mer Dairy
Stan/Mer Non Dairy
Tul/Kings Dairy
Tul/Kings Non Dairy
NO
3N
mg/
L
Fig. 7. Boxplot of nitrate as nitrogen in well water samples for various groups: the central mark is the median, the lower and upper edges of the box are the 25thand 75th percentiles, respectively, the whiskers extend to the most extreme data points not considered outliers, and outliers are plotted individually as red plussigns. GAMA is the Groundwater Ambient Monitoring and Assessment Program conducted by theQ2 California State Water Resources Control Board, 2006 Tularedomestic well study (California State Water Resources Control Board, 2010). (For interpretation of the references to color in this figure legend, the reader isreferred to the web version of this article.)
9K.M. Lockhart et al. / Journal of Contaminant Hydrology xxx (2013) xxx–xxx
UNCO
RRE
These findings suggest that while both project areas havewells with high nitrate values, a dairy within 2.4 km of a wellis not necessarily a clear indicator for higher nitrate values. Awell may be within 2.4 km of a dairy, but depending ongroundwater flow direction and hydraulic gradient, nitrateleaching from CAFO animal manure may or may not impactthe well. The effect of dairies on nitrate levels in wells is likelycontrolled by additional factors such as groundwater rechargerate, soil type, groundwater age, nutrient management prac-tices, and source loading from landuses other than CAFOs.
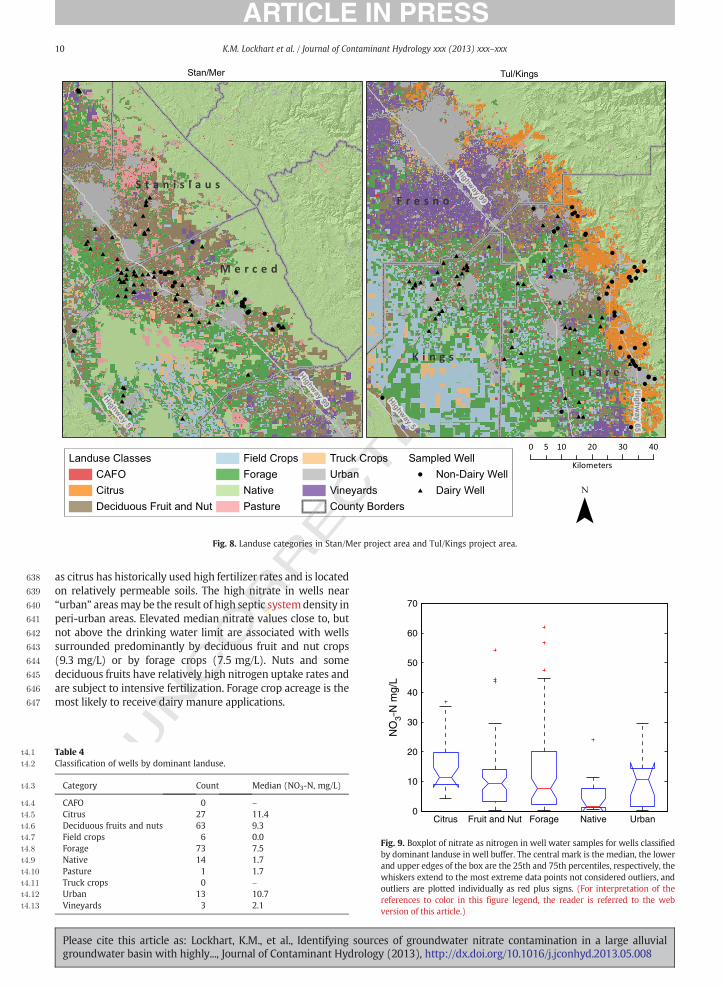
In Stan/Mer, dairies are well distributed throughout thestudy area including many in the area with very shallowgroundwater (Figs. 1 and 8). The 2.4 km distance criterion todistinguish dairy region wells versus non-dairy wells may beconsidered too restrictive due to the generality of the underly-ing assumptions. Therefore, in addition to dairy as a categoricalpredictor variable, we also investigated the distance to a dairycorral or lagoon as a continuous predictor variable using theSRC. For Stan/Mer wells, nitrate increased significantly as welldistance to dairy corral or lagoon decreased (p = 0.016 andρ = −0.240). In contrast to the categorical predictor variable,this statisticalmeasure indicates thatwell proximity to a dairy isindeed a significant factor affecting groundwater nitrate levelsin Stan/Mer. For Tul/Kings, the continuous predictor confirmsthe finding from the categorical analysis; nitrate level increasedsignificantly as well distance to dairy corral or lagoon increased(p = 0.032 and ρ = 0.215). This is likely because non-dairywells in Tul/Kings are mostly located on the eastern edge of thevalley, where depth to groundwater ismost shallow (Fig. 1), yetfew dairies are located there (Fig. 8), and non-dairy wells hadsignificantly higher nitrate than the dairy wells (while alsohaving a greater distance to dairy corral or lagoon).
Please cite this article as: Lockhart, K.M., et al., Identifying sourcgroundwater basin with highly..., Journal of Contaminant Hydrolog
T3.6. Nitrate and landuse
Groundwater flow direction at each well is highly variabledue to local pumping from numerous surrounding wells andis impossible to determine without installing observationwells at each well site. The actual well source area for eachwell corresponds to less than 1% of the circular well bufferarea created by the 2.4 km (1.5 miles) radius around eachwell (see Appendix B). The most likely landuse within thewell buffer zone to affect water quality in a domestic well isthe landuse category with the highest fraction (“dominantlanduse”). On average, the dominant landuse comprised 51%of the well buffer area, but ranged from 25% to 85% inindividual well buffer zones. We investigate the statisticalrelationship between nitrate concentration and dominantlanduse at eachwell.While thismethod ignores somepotentiallycontributing landuses, it provides a statistical measure ofpotential landuse impact. Table 4 shows the distribution ofdominant landuses among all 200 wells.
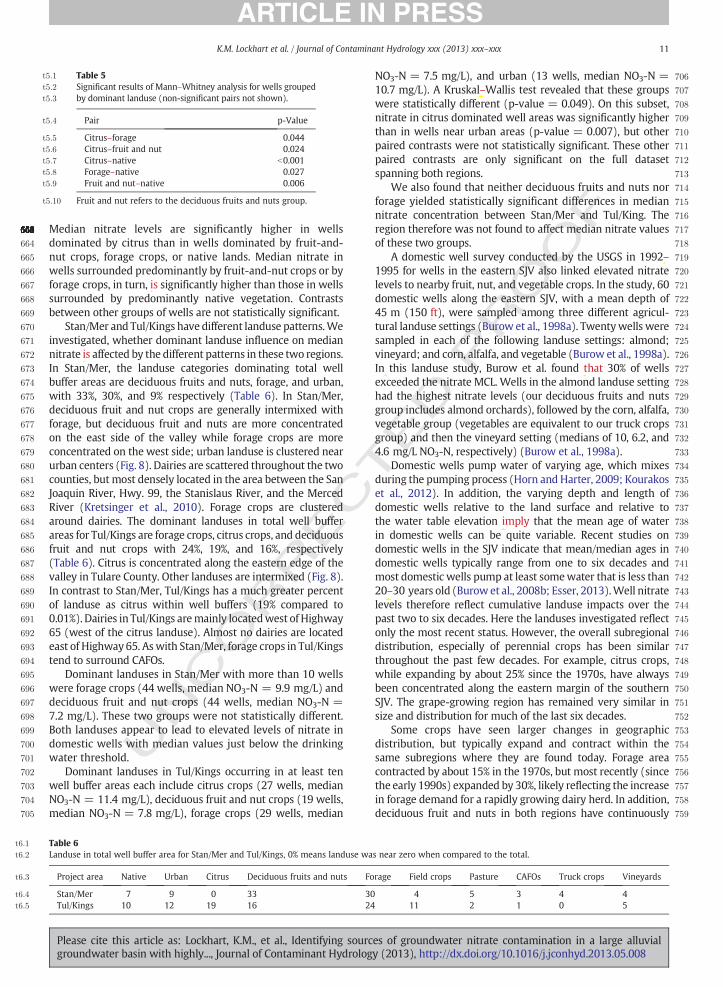
For statistical analysis, only dominant landuse categoriesoccurring in at least 10 well buffer zones were considered(citrus, deciduous fruits and nuts, forage, native, and urban).The Kruskal–Wallis test was used to determine if mediannitrate for wells grouped by dominant landuse is significantlydifferent (p-value = 0.006, Fig. 9). To determine significantdifferences between pairs of well groups, Mann–Whitneytests were performed (Table 5). Post-hoc tests that analyzethe pairs all at once were not useful here because of the largerelative differences in group sizes.
Wells with citrus or urban landuse as dominant landusehave median nitrate values above the drinking water limit of10 mg/L. High nitrate in citrus areas is likely due to fertilizer,
es of groundwater nitrate contamination in a large alluvialy (2013), http://dx.doi.org/10.1016/j.jconhyd.2013.05.008
ECTED P
RO
OF
638
639
640
641
642
643
644
645
646
647
Fig. 8. Landuse categories in Stan/Mer project area and Tul/Kings project area.
t4:1
t4:2
t4:3
t4:4
t4:5
t4:6
t4:7
t4:8
t4:9
t4:10
t4:11
t4:12
t4:13
40
50
60
70
mg/
L
10 K.M. Lockhart et al. / Journal of Contaminant Hydrology xxx (2013) xxx–xxx
CO
RRas citrus has historically used high fertilizer rates and is located
on relatively permeable soils. The high nitrate in wells near“urban” areasmay be the result of high septic systemdensity inperi-urban areas. Elevated median nitrate values close to, butnot above the drinking water limit are associated with wellssurrounded predominantly by deciduous fruit and nut crops(9.3 mg/L) or by forage crops (7.5 mg/L). Nuts and somedeciduous fruits have relatively high nitrogen uptake rates andare subject to intensive fertilization. Forage crop acreage is themost likely to receive dairy manure applications.
UN
Table 4Classification of wells by dominant landuse.
Category Count Median (NO3-N, mg/L)
CAFO 0 –
Citrus 27 11.4Deciduous fruits and nuts 63 9.3Field crops 6 0.0Forage 73 7.5Native 14 1.7Pasture 1 1.7Truck crops 0 –
Urban 13 10.7Vineyards 3 2.1
0
10
20
30
Urban
NO
3N
Citrus Fruit and Nut Forage Native
Fig. 9. Boxplot of nitrate as nitrogen in well water samples for wells classifiedby dominant landuse in well buffer. The central mark is the median, the lowerand upper edges of the box are the 25th and 75th percentiles, respectively, thewhiskers extend to the most extreme data points not considered outliers, andoutliers are plotted individually as red plus signs. (For interpretation of thereferences to color in this figure legend, the reader is referred to the webversion of this article.)
Please cite this article as: Lockhart, K.M., et al., Identifyinggroundwater basin with highly..., Journal of Contaminant Hy
sources of groundwater nitrate contamination in a large alluvialdrology (2013), http://dx.doi.org/10.1016/j.jconhyd.2013.05.008
C
648649650651652653654655656657658659660661662663
664
665
666
667
668
669
670
671
672
673
674
675
676
677
678
679
680
681
682
683
684
685
686
687
688
689
690
691
692
693
694
695
696
697
698
699
700
701
702
703
704
705
706
707
708
709
710
711
712
713
714
715
716
717
718
719
720
721
722
723
724
725
726
727
728
729
730
731
732
733
734
735
736
737
738
739
740
741
742
743
744
745
746
747
748
749
750
751
752
753
754
755
756
757
758
759
Table 5t5:1
t5:2 Significant results of Mann–Whitney analysis for wells groupedt5:3 by dominant landuse (non-significant pairs not shown).
t5:4 Pair p-Value
t5:5 Citrus–forage 0.044t5:6 Citrus–fruit and nut 0.024t5:7 Citrus–native b0.001t5:8 Forage–native 0.027t5:9 Fruit and nut–native 0.006
t5:10 Fruit and nut refers to the deciduous fruits and nuts group.
t6:1
t6:2
t6:3
t6:4
t6:5
11K.M. Lockhart et al. / Journal of Contaminant Hydrology xxx (2013) xxx–xxx
UNCO
RRE
Median nitrate levels are significantly higher in wellsdominated by citrus than in wells dominated by fruit-and-nut crops, forage crops, or native lands. Median nitrate inwells surrounded predominantly by fruit-and-nut crops or byforage crops, in turn, is significantly higher than those in wellssurrounded by predominantly native vegetation. Contrastsbetween other groups of wells are not statistically significant.
Stan/Mer and Tul/Kings have different landuse patterns.Weinvestigated, whether dominant landuse influence on mediannitrate is affected by the different patterns in these two regions.In Stan/Mer, the landuse categories dominating total wellbuffer areas are deciduous fruits and nuts, forage, and urban,with 33%, 30%, and 9% respectively (Table 6). In Stan/Mer,deciduous fruit and nut crops are generally intermixed withforage, but deciduous fruit and nuts are more concentratedon the east side of the valley while forage crops are moreconcentrated on the west side; urban landuse is clustered nearurban centers (Fig. 8). Dairies are scattered throughout the twocounties, but most densely located in the area between the SanJoaquin River, Hwy. 99, the Stanislaus River, and the MercedRiver (Kretsinger et al., 2010). Forage crops are clusteredaround dairies. The dominant landuses in total well bufferareas for Tul/Kings are forage crops, citrus crops, and deciduousfruit and nut crops with 24%, 19%, and 16%, respectively(Table 6). Citrus is concentrated along the eastern edge of thevalley in Tulare County. Other landuses are intermixed (Fig. 8).In contrast to Stan/Mer, Tul/Kings has a much greater percentof landuse as citrus within well buffers (19% compared to0.01%). Dairies in Tul/Kings aremainly locatedwest of Highway65 (west of the citrus landuse). Almost no dairies are locatedeast of Highway 65. Aswith Stan/Mer, forage crops in Tul/Kingstend to surround CAFOs.
Dominant landuses in Stan/Mer with more than 10 wellswere forage crops (44 wells, median NO3-N = 9.9 mg/L) anddeciduous fruit and nut crops (44 wells, median NO3-N =7.2 mg/L). These two groups were not statistically different.Both landuses appear to lead to elevated levels of nitrate indomestic wells with median values just below the drinkingwater threshold.
Dominant landuses in Tul/Kings occurring in at least tenwell buffer areas each include citrus crops (27 wells, medianNO3-N = 11.4 mg/L), deciduous fruit and nut crops (19 wells,median NO3-N = 7.8 mg/L), forage crops (29 wells, median
Table 6Landuse in total well buffer area for Stan/Mer and Tul/Kings, 0% means landuse wa
Project area Native Urban Citrus Deciduous fruits and nuts Fo
Stan/Mer 7 9 0 33 30Tul/Kings 10 12 19 16 24
Please cite this article as: Lockhart, K.M., et al., Identifying sourcgroundwater basin with highly..., Journal of Contaminant Hydrolog
TED P
RO
OF
NO3-N = 7.5 mg/L), and urban (13 wells, median NO3-N =10.7 mg/L). A Kruskal–Wallis test revealed that these groupswere statistically different (p-value = 0.049). On this subset,nitrate in citrus dominated well areas was significantly higherthan in wells near urban areas (p-value = 0.007), but otherpaired contrasts were not statistically significant. These otherpaired contrasts are only significant on the full datasetspanning both regions.
We also found that neither deciduous fruits and nuts norforage yielded statistically significant differences in mediannitrate concentration between Stan/Mer and Tul/King. Theregion therefore was not found to affect median nitrate valuesof these two groups.
A domestic well survey conducted by the USGS in 1992–1995 for wells in the eastern SJV also linked elevated nitratelevels to nearby fruit, nut, and vegetable crops. In the study, 60domestic wells along the eastern SJV, with a mean depth of45 m (150 ft), were sampled among three different agricul-tural landuse settings (Burow et al., 1998a). Twentywells weresampled in each of the following landuse settings: almond;vineyard; and corn, alfalfa, and vegetable (Burow et al., 1998a).In this landuse study, Burow et al. found that 30% of wellsexceeded the nitrate MCL. Wells in the almond landuse settinghad the highest nitrate levels (our deciduous fruits and nutsgroup includes almond orchards), followed by the corn, alfalfa,vegetable group (vegetables are equivalent to our truck cropsgroup) and then the vineyard setting (medians of 10, 6.2, and4.6 mg/L NO3-N, respectively) (Burow et al., 1998a).
Domestic wells pump water of varying age, which mixesduring the pumping process (Horn and Harter, 2009; Kourakoset al., 2012). In addition, the varying depth and length ofdomestic wells relative to the land surface and relative tothe water table elevation imply that the mean age of waterin domestic wells can be quite variable. Recent studies ondomestic wells in the SJV indicate that mean/median ages indomestic wells typically range from one to six decades andmost domestic wells pump at least somewater that is less than20–30 years old (Burow et al., 2008b; Esser, 2013).Well nitratelevels therefore reflect cumulative landuse impacts over thepast two to six decades. Here the landuses investigated reflectonly the most recent status. However, the overall subregionaldistribution, especially of perennial crops has been similarthroughout the past few decades. For example, citrus crops,while expanding by about 25% since the 1970s, have alwaysbeen concentrated along the eastern margin of the southernSJV. The grape-growing region has remained very similar insize and distribution for much of the last six decades.
Some crops have seen larger changes in geographicdistribution, but typically expand and contract within thesame subregions where they are found today. Forage areacontracted by about 15% in the 1970s, but most recently (sincethe early 1990s) expanded by 30%, likely reflecting the increasein forage demand for a rapidly growing dairy herd. In addition,deciduous fruit and nuts in both regions have continuously
s near zero when compared to the total.
rage Field crops Pasture CAFOs Truck crops Vineyards
4 5 3 4 411 2 1 0 5
es of groundwater nitrate contamination in a large alluvialy (2013), http://dx.doi.org/10.1016/j.jconhyd.2013.05.008
760
761
762
763
764
765
766
767
768
769
770
771
772
773
774
775
776
777
778
779
780
781
782
783
784
785
786
787
788
789
790
791
792
793
794
795
796
797
798
799
800
801
802
803
804
805
806
807
808
809
810
811
812
813
814
815
816
817
818
819
820
821
822
823
824
825
826
827
828
829
830
831
832
833
834
12 K.M. Lockhart et al. / Journal of Contaminant Hydrology xxx (2013) xxx–xxx
expanded, approximately doubling in area between 1960 and1975, and again between 1975 and 2005. Urban areas have alsoexpanded continuously over the past 60 years replacingagricultural areas surrounding historic urban centers. On theother hand, field crops have significantly contracted in areabetween 1990 and the mid-2000s (Harter et al., 2012).
If we make the assumption that the youngest groundwaterin the study wells is 10–20 years old, then the expansion of thedairy herd and of associated forage crops receiving manureapplications, of deciduous fruit and nut crops, and of urbanareas, and the contraction of field crops within the past20 years is likely not significantly reflected in our results. Also,due to significant vadose zone travel times and due to theirtypical groundwater age distribution, most domestic wellnitrate levels do not reflect recent improvements in agriculturalwater and nutrient management practices, if and where theyoccurred.
835
836
837
838
839
840
841
842
843
844
845
846
847
848
849
850
851
852
853
854
855
856
857
858
859
860
861
862
863
864
865
866
867
868
869
870
871
872
873
874
875
876
UNCO
RREC
4. Conclusions
Overall, domestic wells in Stanislaus, Merced, and TulareCounties (Kings County to a lesser extent) are widely affectedby nitrate contamination above regulatory limits. That contam-ination is most strongly associated with CAFO manure lagoonsand animal corrals and with forage, citrus and deciduous fruitand nut crops.
Depth to groundwater provides significant control on nitrateconcentration in domestic wells with higher values mostlywhere the water table is shallower b 21 m (70 ft) and lowernitrate values are found where the water table is deeper >21 m (70 ft), regardless of soil type or dominant crop type. Thiscompliments our finding that a more shallow well depth isrelated to a higher nitrate level. Wells close together (within5 kmor 3miles of each other) do not have similar nitrate valuesprobably because of the highly variable well constructioncharacteristics from well to well and highly variable ground-water flow direction due to local pumping in large irrigationwells.
A dairy within 2.4 km of a well is not necessarily a clearindicator for higher nitrate values and the effect of dairies onnitrate levels in wells is likely controlled by additional factorssuch as groundwater flow direction, hydraulic gradient, depthto groundwater, nutrient management practices, groundwatertravel time, and historical landuse practices. Our 2.4 kmdesignation may be too limiting a measure to define “dairy”and “non-dairy” wells and perhaps cow and dairy densitywould be a more useful variable in future analysis. In addition,we analyzed distance to dairy corral or lagoon for correlationwith nitrate level in wells (instead of the 2.4 km dairy or non-dairy cut off). We found significant, but opposing, relationshipsbetween nitrate level in wells and distance to dairy corral orlagoon (positively related for Stan/Mer and negatively relatedfor Tul/Kings). This opposing relationship is probably dueto the spatial distribution of other potentially high impactlanduses or spatial variability in the additional factors listedabove.
In Stan/Mer, our analysis suggests that the dominantcontributor to groundwater nitrate is CAFO derived animalwaste leaching from lagoons and corrals in areas where dairiesare densely located, fertilizers applied to deciduous fruit and
Please cite this article as: Lockhart, K.M., et al., Identifying sourcgroundwater basin with highly..., Journal of Contaminant Hydrolog
TED P
RO
OF
nut crops, and CAFO derived animal waste applied to foragecrops.
Out of all the well groupings compared, Tulare County wellshad the highest median nitrate value (11.6 mg/L). Tul/Kingsnon-dairywells andwellswith citrus crops as dominant landusehad the second highestmedian nitrate value (11.4 mg/L). In oursurvey network, these two groups comprise a similar set ofwells as the majority of Tul/Kings non-dairy wells were locatedeast of Highway 65, where landuse is mainly citrus crops(Fig. 8). Median nitrate in wells with citrus as dominant nearbylanduse was also 11.4 mg/L. Our analysis suggests that elevatednitrate levels in well water samples in this area are likely dueto a combination of very shallow water table and perhapsexcessive nitrogen applications in citrus crops at the time ofrecharge.MCL exceedances and elevated nitrate levelswere alsocommon west of Highway 65, and east of Highway 99 in TulareCounty (Fig. 2). There, nitrate sources may be CAFO derivedanimalwaste applied to forage crops, nitrogen fertilizers appliedto deciduous fruit and nut crops, and nitrogen from urbansources such as septic tanks. CAFO derived animal wasteleaching from lagoons and corrals may contribute to ground-water nitrate in the areas where dairies are densely located, butbecause non-dairy wells in Tul/Kings had a significantly greatermedian nitrate value and are mostly located far from dairies(Fig. 8), we cannot detect the influence of dairy corrals orlagoons nearwellswith the SRC test. By comparing to the resultsof the 2006 SWRCB GAMA study, we have demonstrated thatnitrate values in wells in Tulare County may have increasedsince 2006.
Despite some contrasting results between the two studyareas, the analysis showed that median nitrate values in wellswith forage crops as dominant land use were similar (notstatistically different) between the two areas. The mediannitrate values in wells with deciduous fruit and nut crops asdominant surrounding landuse were also similar between theStan/Mer and Tul/King areas, suggesting similar contaminationprocesses. Not enough data were available to investigatewhether such similarity in nitrate impact from the samedominating landuse holds for other crop categories.
Due to the depth of thewells, historic nutrientmanagementpractices and improvements potentially made to these prac-tices must be considered in relating the results to currentlanduses. Also, spatial data on manured versus non-manuredforage fields in all four counties would be valuable for futureanalysis. Analytes such as nitrate and water isotopes, ground-water age, and dissolved gasses inwell water can provide cluesabout contamination sources, particularly animal versussynthetic nitrogen sources, and potential denitrification, workthat is currently ongoing for the study area.
Acknowledgments
This work was funded by the California State WaterResources Control Board Grant Agreement No. 04-184-555-0.We would like to thank the following people and groups fortheir help and support on this project: landowners whoallowed us to sample wells on their property; Joseph Trujilloand Olin Applegate of UC Davis for collecting well samples; UCDavis Analytical Lab; Ronald Bond and Xunde Li of the UCDavismicrobiology lab, Nate Roth and Jim Quinn of the UC DavisInformation Center for the Environment for their help in
es of groundwater nitrate contamination in a large alluvialy (2013), http://dx.doi.org/10.1016/j.jconhyd.2013.05.008
877
878
879
880
881
882
883
884
885
t7:1
t7:2
t7:3
t7:4
t7:5
t7:6
t7:7
t7:8
t7:9
t7:10
t7:11
t7:12
t7:13
t7:14
t7:15
t7:16
t7:17
t7:18
t7:19
t7:20
t7:21
t7:22
t7:23
t7:24
t7:25
t7:26
t7:27
t7:28
t7:29
t7:30
t7:31
t7:32
t7:33
t7:34
t7:35
t7:36
t7:37
t7:38
t7:39
t7:40
t7:41
t7:42
t7:43
t7:44
t7:45
t7:46
t7:47
t7:48
t7:49
t7:50
t7:51
t7:52
t7:53
t7:54
t7:55
t7:57Table A.7 (continued)
t7:58Overall category Individual crop or landuse type
t7:56Sugar beetsa
t7:57Beans, dryb
t7:58Sunflowersa
t7:59Pasture Pasturea
t7:60Mixed pastureb
13K.M. Lockhart et al. / Journal of Contaminant Hydrology xxx (2013) xxx–xxx
obtaining addresses for bulkmailers; Paul Boyer, Harold Porras,Jessi Snyder, and Bre Slimick of Self Help Enterprises for theirhelp locating well owners and preparing the Tulare Countypress release; Maria Herrera of Community Water Center forher help in locating well owners and providing Spanishinterpretation; and Tammo Steenhuis along with the threeanonymous reviewers for their feedback on this manuscript.
F
t7:61Native pasturet7:62Miscellaneous grassesa
t7:63Turf farmsa
t7:64CAFO Livestock feedlot operationa
t7:65Dairy farmt7:66Poultry farmb
Appendix A. Landuse groupings
UNCO
RREC
D P
RO
O
886
887
888
889
890
891
892
893
894
895
896
897
898
899
900
901
902
903
904
905
906
907
908
909
910
911
912
913
914
915
916
917
Table A.7Individual crops or landuse types included in overall categories.
Overall category Individual crop or landuse type
Native Annual grasslandAlkali desert scruba
Barrena
Blue oak foothill pinea
Blue oak woodlandCoastal oak woodlanda
Freshwater emergent wetlanda
Lacustrinea
Montane hardwoodb
Riverinea
Valley oak woodlanda
Valley foothill riparianb
Waterb
Undetermined shrub typeb
Undetermined conifer typea
Eucalyptusa
Idle cropped past 3 yearsb
Idle new landsa
Urban UrbanFarmstead with residence
Citrus Grapefruita
Lemonsb
OrangesAvocadosa
OlivesKiwisa
Citrus, subtropical miscellaneous, and jojobaa
Deciduous fruitsand nuts
Applesb
Apricotsa
Cherriesb
Peaches and nectarinesPearsa
PlumsPrunesb
Figsb
AlmondsWalnutsPistachiosb
Other deciduous fruits and nutsb
Forage Corn field and sweetGrain sorghuma
Sudanb
Grain and hay, includes miscellaneousBarleya
Wheatb
Oatsb
AlfalfaClovera
Rice, includes wild rice subclassesa
Field Crops Flax, hops, castor beans, and miscellaneousfield and milletCottonSafflowera
t7:67Truck crops Nursery berry crops, cole mix, and miscellaneousb
t7:68Artichokesa
t7:69Asparagusa
t7:70Green beansa
t7:71Carrotsa
t7:72Lettucea
t7:73Melons, squash, cucumbersb
t7:74Onions and garlica
t7:75Sweet potatoesb
t7:76Tomatoes, processingb
t7:77Flowers, nursery and Christmas tree farmsb
t7:78Bush berriesa
t7:79Strawberriesb
t7:80Broccolia
t7:81Vineyards Vineyards, including table grapes
t7:82Only crops and landuse classes existing within well buffers are listed here.a Less than 0.1% of total well buffer area for all well buffers combined. t7:83b Less than 1% of total well buffer area for all well buffers combined. t7:84
Please cite this article as: Lockhart, K.M., et al., Identifying sourcgroundwater basin with highly..., Journal of Contaminant Hydrolog
TE
Appendix B. Justification for choice of 2.4 km well buffers
Under ideal aquifer conditionswith homogeneous hydraulicconductivity and uniform regional groundwater gradients, thesource area of domestic wells in alluvial aquifers is long andnarrow with pumping in the domestic well affecting ground-water flow direction only within a few feet to tens of feet fromthe well. Domestic well pumping rates are small averagingusually less than 4 L per minute (1 gpm, 3 acft/year). Themaximum extent of the source area, under ideal conditions, isdetermined by the depth of the well and the ratio of (uniform)recharge rate and (uniform) horizontal groundwater flow rate(Horn and Harter, 2009).
Groundwater recharge in the Central Valley comes mostlyfrom excess irrigation water and varies with climatic changes(Faunt, 2009). Groundwater recharge rates for the CentralValley have been estimated at 0.18, 0.09, and 0.37 m/year(0.6, 0.28, and1.2 ft/year) for an average, dry, and wet wateryear, respectively (Faunt, 2009). For amore local perspective theaverage annual recharge rate for theModesto area is 0.55 m/year(1.8 ft/year), but varies between 0.23 and 0.76 m/year (0.75 and2.5 ft/year) throughout the area (based on water year 2000)(Burow et al., 2004). Due to the variable recharge rates on aregional, local, and temporal scale, 0.30 m/year (1 ft/year) waschosen for our calculations as a general approximation forrecharge rates throughout the two project areas. At rechargerates on the order of 0.30 m/year (1 ft/year), given typicaldomestic pumping rates, the total source area of a domestic wellin the Central Valley is therefore only on the order of 1 ha (fewacres) in size.
Since groundwater flow directions are highly variable inspace and time due to local groundwater pumping by largeproduction wells and due to groundwater heterogeneity, a
es of groundwater nitrate contamination in a large alluvialy (2013), http://dx.doi.org/10.1016/j.jconhyd.2013.05.008
918
919
920
921
922
923
924
925
926
927
928
929
930
931
932
933
934
935
936
937
938
939
940
941
942
943
944
945
946
947
948
949
950
951952953
954
955
956
957958959
960
961962963964965966967968969970971972973974975
97697797897998098198298398498598698798898999099199299399499599699799899910001001100210031004100510061007100810091010101110121013101410151016101710181019102010211022102310241025102610271028102910301031103210331034103510361037103810391040104110421043104410451046104710481049105010511052105310541055
14 K.M. Lockhart et al. / Journal of Contaminant Hydrology xxx (2013) xxx–xxx
UNCO
RREC
circular source area (well buffer zone), extending to themaximum length of a typical domestic well source area, capturethe overall area within which the actual source area is located.Any locationwithin the circularwell buffer zone is equally likelyto contribute recharge to the domestic well, but at a relativelylow probability (less than 1%). The low probability is obtainedby taking the ratio of the estimated size of the source area(about 1 ha) and the size of the circular well buffer zone(>100 ha, see below).
An approximatewell depthwas chosen based on themediancompleted well depth of 61 m (or approximately 200 ft) forsampled wells in Tul/Kings, which was slightly deeper than themedian completed well depth of 54.9 m (or approximately180 ft) for sampled wells in Stan/Mer.
An approximate effective aquifer horizontal hydraulicconductivity (K) of 30.5 m/day (100 ft/day) was chosenbased on the Tule Subbasin Groundwater Model producedby Ruud et al. (2003), where Ruud et al. calculated horizontalhydraulic conductivities for the aquifer to be anywhere from0.15 to 107 m/day (0.5 to 350 ft/day).
In the Modesto area, Burow et al. found a hydraulicgradient (I) of approximately 0.002 for the shallower part ofthe aquifer (less than 85.3 m or 280 ft) and a gradient ofapproximately 0.001 for the deeper part of the aquifer(around 85.3 m or 280 ft) (Burow et al., 2008a). Actualhydraulic gradients at each domestic well can vary widelydepending on local groundwater pumping and site conditions:exact gradients are impossible to determine without theinstallation of monitoring wells and long term monitoring.Therefore, 0.001 was chosen as an approximate groundwatergradient.
To calculate groundwater lateral movement, use Darcy'sLaw to find specific discharge (Eq. (B.1)):
q ¼ KIK ¼ 30:5m=dayI ¼ 0:001q ¼ 30:5m=dayð Þ 0:001ð Þ 356day=yearð Þ ¼ 13:0m=year:
ðB:1Þ
Using the 0.30 m/year value for recharge and assumingmass is conserved within the system, you have 0.30 m ofdownward movement for every 13.0 m of lateral movement.
Therefore, for a 61 m deep well the radius of influence is:
61m=0:30mð Þ 13:0mð Þ 1km=1000mð Þ ≈ 2:4km 1:5mileð Þ:
This gives a total well buffer area of 1831 ha (4524 acres).
References
Babiker, I.S., Mohamed, M.A., Terao, H., Kato, K., Ohta, K., 2004. Assessment ofgroundwater contamination by nitrate leaching from intensive vegetablecultivation using geographical information system. Environment Interna-tional 29, 1009–1017.
Barringer, T., Dunn, D., Battaglin, W., Vowinkel, E., 1990. Problems andmethods involved in relating land-use to ground-water quality. JAWRAJournal of the American Water Resources Association 26, 1–9.
Burow, K.R., Shelton, J.L., Dubrovsky, N.M., 1998a. Occurrence of nitrate andpesticides in groundwater beneath three agricultural land-use settings inthe Eastern San Joaquin Valley, California, 1993–1995. Water-resourcesInvestigation Report 97-4284. U.S. Geological Survey.
Burow, K.R., Stork, S.V., Dubrovsky, N.M., 1998b. Nitrate and pesticides ingroundwater in the Eastern San Joaquin Valley, California: occurrence andtrends. Water-resources Investigation Report 98-4040. U.S. GeologicalSurvey.
Please cite this article as: Lockhart, K.M., et al., Identifying sourcgroundwater basin with highly..., Journal of Contaminant Hydrolog
TED P
RO
OF
Burow, K.R., Shelton, J.L., Hevesi, J.A., Weissmann, G.S., 2004. Hydrogeologiccharacterization of the Modesto area, San Joaquin Valley, California.Scientific Investigations Report 2004-5232. United States Department ofthe Interior and United States Geological Survey.
Burow, K.R., Jurgens, B.C., Kauffman, L.J., Phillips, S.P., Dalgish, B.A., Shelton,J.L., 2008a. Simulations of ground-water flow and particle pathlineanalysis in the zone of contribution of a public-supply well in Modesto,Eastern San Joaquin Valley, California. Scientific Investigations Report2008-5035. U.S. Geological Survey.
Burow, K.R., Shelton, J.L., Dubrovsky, N.M., 2008b. Regional nitrate andpesticide trends in groundwater in theeastern San JoaquinValley, California.Journal of Environmental Quality 37, S-249–S-263.
California Department of Finance, 2006. California county populationestimates and components of change by year, July 1, 2000–2006:Sacramento, California. Accessed February 11, 2012 at http://www.dof.ca.gov/HTML/DEMOGRAP/ReportsPapers/Estimates/E2/E-2_2000-06.php.
California State Water Resources Control Board, 2010. Groundwater ambientmonitoring and assessment (GAMA), Domestic well project, Groundwaterquality data report, Tulare County focus area. Technical Report (http://www.waterboards.ca.gov/water_issues/programs/gama/domestic_well.shtml#tularecfa).
Centers for Disease Control and Prevention, 1996. Spontaneous abortionspossibly related to ingestion of nitrate-contaminated well water — LaGrange County, Indiana, 1991–1994. Morbidity and Mortality WeeklyReport 45, 569–572.
Clesceri, L., Greenberg, A.E., Eaton, A.D., 1998. Standard Methods for theExamination of Water and Wastewater, 20th edition. American PublicHealth Association, Washington, DC.
Conover,W., 1999. Practical Nonparametric Statistics, 3rd edition. JohnWiley &Sons, INC.
Croft, M., Gordon, G., 1968. Geology, hydrology, and quality of water in theHanford–Visalia area, San Joaquin Valley, California. Open File Report.United States Department of the Interior Geological Survey, WaterResources Division.
Department of Water Resources, 2011. Water data library online. http://www.water.ca.gov/waterdatalibrary/groundwater/index.cfm (San Joaquin Valleyspring 2000 depth to groundwater).
DPR, 2011. California department of pesticide regulations groundwaterprotection areas, shapefiles. http://www.cdpr.ca.gov/docs/emon/grndwtr/gwpa_locations.htm.
Dubrovsky, N.M., Kratzer, C.R., Brown, L.R., Gronberg, J.M., Burow, K.R., 1998.Water quality in the San Joaquin–Tulare Basins, California, 1992–95.Circular 1159. U.S. Geological Survey.
DWR, 2004. San Joaquin Valley Groundwater Basin, Modesto Subbasin, SanJoaquin River Hydrologic Region, California's Groundwater, Bulletin 118.California Department of Water Resources (Online Description).
Esser, B., 2013. Groundwater ages for on-site domestic wells sampled duringthe UC Davis dairy project in the San Joaquin Valley, California. Memo,Unpublished Data.
Faunt, C.C. (Ed.), 2009. Groundwater Availability of the Central Valley Aquifer,California. : Professional Paper 1766. United States Geological Survey.
Grassi, S., Cortecci, G., Squarci, P., 2007. Groundwater resource degradationin coastal plains: the example of the Cecina area (Tuscany–Central Italy).Applied Geochemistry 22, 2273–2289.
Gronberg, J.M., Dubrovsky, N.M., Kratzer, C.R., Domagalski, J.L., Brown, L.R.,Burow, K.R., 1998. Environmental settings of the San Joaquin — TulareBasins, California. Water-resources Investigations Report 97-4205. U.S.Geological Survey.
Hamilton, P.A., Helsel, D.R., 1995. Effects of agriculture on ground-waterquality in five regions of the United States. Ground Water 33, 217–226.
Harter, T., 2009. Agricultural impacts on groundwater nitrate. SouthwestHydrology 8, 22–35.
Harter, T., Romesser, E., 2001. Personal communication, unpublished data.Harter, T., Davis, H., Mathews, M.C., Meyer, R.D., 2002. Shallow groundwater
quality on dairy farms with irrigated forage crops. Journal of ContaminantHydrology 55, 287–315.
Harter, T., Lund, J.R., Darby, J., Fogg, G.E., Howitt, R., Jessoe, K.K., Pettygrove,G.S., Quinn, J.F., Viers, J.H., Boyle, D.B., Canada, H.E., DeLaMora, N.,Dzurella, K.N., Fryjoff-Hung, A., Hollander, A.D., Honeycutt, K.L., Jenkins,M.W., Jensen, V.B., King, A.M., Kourakos, G., Liptzin, D., Lopez, E.M.,Mayzelle, M.M., McNally, A., Medellin-Azuara, J., Rosenstock, T.S., 2012.Addressing nitrate in California's drinking water with a focus on TulareLake Basin and Salinas Valley groundwater. Report for the State WaterResources Control Board Report to the Legislature. Technical Report.Center for Watershed Sciences, University of California, Davis.
Helsel, D.R., 2005. Nondetects and Data Analysis: Statistics for CensoredEnvironmental Data. Wiley-Interscience.
Hollander, A.D., 2010. California augmented multisource landcover map.Technical Report. Information Center for the Environment, University ofCalifornia, Davis.
es of groundwater nitrate contamination in a large alluvialy (2013), http://dx.doi.org/10.1016/j.jconhyd.2013.05.008
105610571058105910601061106210631064106510661067106810691070107110721073107410751076107710781079108010811082108310841085108610871088108910901091
109210931094109510961097109810991100110111021103110411051106110711081109111011111112111311141115111611171118111911201121112211231124
1125
1126
15K.M. Lockhart et al. / Journal of Contaminant Hydrology xxx (2013) xxx–xxx
Horn, J.E., Harter, T., 2009. Domestic well capture zone and influence of thegravel pack length. Ground Water 47, 277–286.
Hu, K., Huang, Y., Li, H., Li, B., Chen, D., White, R.E., 2005. Spatial variability ofshallow groundwater level, electrical conductivity and nitrate concen-tration, and risk assessment of nitrate contamination in North ChinaPlain. Environment International 31, 896–903 (Soil Contamination andEnvironmental Health).
Kolpin, D.W., 1996. Agricultural chemicals in groundwater of the midwesternUnited States: relations to land use. Journal of Environmental Quality 26,1025–1037.
Kourakos, G., Klein, F., Cortis, A., Harter, T., 2012. A groundwater nonpointsource pollution modeling framework to evaluate long-term dynamicsof pollutant exceedance probabilities in wells and other dischargelocations. Water Resources Research 48.
Kretsinger, V., Angermann, T., Dalgish, B., 2010. Delineation of an arearecommended for the installation of a pilot groundwater monitoringnetwork designed for a group of existing dairies, Central Valley, California.Technical Report. Luhdorff and Scalmanini Consulting Engineers.
Majumder, R.K., Hasnat, M.A., Hossain, S., Ikeue, K., Machida, M., 2008. Anexploration of nitrate concentrations in groundwater aquifers of central-west region of Bangladesh. Journal of Hazardous Materials 159, 536–543.
McLay, C., Dragten, R., Sparling, G., Selvarajah, N., 2001. Predicting groundwaternitrate concentrations in a region of mixed agricultural land use: acomparison of three approaches. Environmental Pollution 115, 191–204.
Mueller, D.K., Helsel, D.R., 1996. Nutrients in the Nation's Waters — TooMuch of a Good Thing? Circular 1136. U.S. Geological Survey.
Nolan, B.T., Hitt, K.J., Ruddy, B.C., 2002. Probability of nitrate contaminationof recently recharged groundwaters in the conterminous United States.Environmental Science & Technology 36, 2138–2145. http://dx.doi.org/10.1021/es0113854.
Owens, L., Edwards, W., VanKeuren, R., 1992. Nitrate levels in shallowgroundwater under pastures receiving ammonium nitrate or slow-releasenitrogen fertilizer. Journal of Environmental Quality 21, 607–613.
Page, R., 1985. Geology of the fresh ground-water basin of the Central Valley,California, with texture maps and sections. Professional Paper 1401-C.U.S.Geological Survey.
UNCO
RREC
Please cite this article as: Lockhart, K.M., et al., Identifying sourcgroundwater basin with highly..., Journal of Contaminant Hydrolog
D P
RO
OF
Ruud, N., Harter, T., Naugle, A., 2003. A conjunctive use model for the Tulegroundwater sub-basin area in the Southern-Eastern San Joaquin Valley,California. Technical Report. Department of Land, Air, and WaterResources, University of California, Davis.
Ruud, N., Harter, T., Naugle, A., 2004. Estimation of groundwater pumping asclosure to the water balance of a semi-arid, irrigated agricultural basin.Journal of Hydrology 297, 51–73.
Siegel, S., Castellan, N., 1988. Nonparametric Statistics for the BehavioralSciences, 2 edition. McGraw-Hill College.
United States Department of Agriculture, 2009. National agriculture imageryprogram, aerial imagery, 1 m resolution.
United States Environmental Protection Agency, 2012. Region 9 strategicplan, 2011–2014. Technical Report.
van der Schans, M.L., Harter, T., Leijnse, A., Mathews, M.C., Meyer, R.D., 2009.Characterizing sources of nitrate leaching from an irrigated dairy farm inMerced County, California. Journal of Contaminant Hydrology 110, 9–21.
Vowinkel, E., Tapper, R., 1995. Indicators of the sources and distribution ofnitrate in water from shallow domestic wells in agricultural areas of theNew Jersey Coastal Plain. Water-resources Investigation Report 93-4178.U.S. Geological Survey.
Ward, M.H., Mark, S.D., Cantor, K.P., Weisenburger, D.D., Correa-Villaseñor, A.,Zahm, S.H., 1996. Drinking water nitrate and the risk of non-Hodgkin'slymphoma. Epidemiology 7, 465–471.
Weyer, P.J., Cerhan, J.R., Kross, B.C., Hallberg, G.R., Kantamneni, J., Breuer, G.,Jones, M.P., Zheng, W., Lynch, C.F., 2001. Municipal drinking water nitratelevel and cancer risk in older women: the Iowa women's health study.Epidemiology 12, 327–338.
WHO, 2007. Nitrate and nitrite in drinking-water, background document fordevelopment of WHO guidelines for drinking-water quality. TechnicalReport WHO/SDE/WSH/07.01/16. World Health Organization.
Zar, J.H., 2005. Spearman rank correlation. Encyclopedia of Biostatistics..Zhang, W., Tian, Z., Zhang, N., Li, X., 1996. Nitrate pollution of groundwater in
northern China. Agriculture, Ecosystems and Environment 59, 223–231.
E
Tes of groundwater nitrate contamination in a large alluvialy (2013), http://dx.doi.org/10.1016/j.jconhyd.2013.05.008


