
Refer to Important disclosures in the last page of this report
Kalbe Farma BUY (unchanged)
Company Update | Consumer Staples | KLBF IJ | 28 February 2020
Stock Data
Target price Rp1,500
Prior TP Rp1,800
Current price Rp1,220
Upside/downside +23%
Shares outstanding (mn) 46,875
Market cap (Rp bn) 57,188
Free float 43%
Avg. 6m daily T/O (Rp bn) 36.8
Price Performance
3M 6M 12M
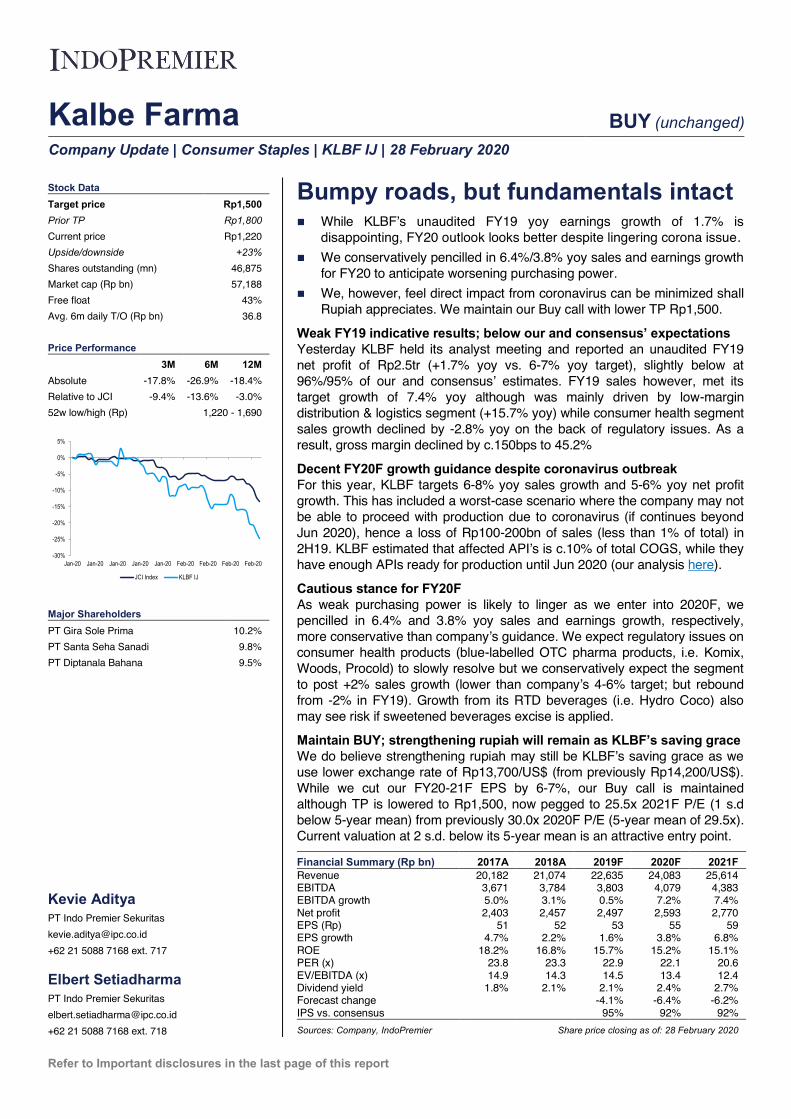
Absolute -17.8% -26.9% -18.4%
Relative to JCI -9.4% -13.6% -3.0%
52w low/high (Rp) 1,220 - 1,690
Major Shareholders
PT Gira Sole Prima 10.2%
PT Santa Seha Sanadi 9.8%
PT Diptanala Bahana 9.5%
Kevie Aditya
PT Indo Premier Sekuritas
+62 21 5088 7168 ext. 717
Elbert Setiadharma
PT Indo Premier Sekuritas
+62 21 5088 7168 ext. 718
Bumpy roads, but fundamentals intact While KLBF’s unaudited FY19 yoy earnings growth of 1.7% is
disappointing, FY20 outlook looks better despite lingering corona issue.
We conservatively pencilled in 6.4%/3.8% yoy sales and earnings growth
for FY20 to anticipate worsening purchasing power.
We, however, feel direct impact from coronavirus can be minimized shall
Rupiah appreciates. We maintain our Buy call with lower TP Rp1,500.
Weak FY19 indicative results; below our and consensus’ expectations
Yesterday KLBF held its analyst meeting and reported an unaudited FY19
net profit of Rp2.5tr (+1.7% yoy vs. 6-7% yoy target), slightly below at
96%/95% of our and consensus’ estimates. FY19 sales however, met its
target growth of 7.4% yoy although was mainly driven by low-margin
distribution & logistics segment (+15.7% yoy) while consumer health segment
sales growth declined by -2.8% yoy on the back of regulatory issues. As a
result, gross margin declined by c.150bps to 45.2%
Decent FY20F growth guidance despite coronavirus outbreak
For this year, KLBF targets 6-8% yoy sales growth and 5-6% yoy net profit
growth. This has included a worst-case scenario where the company may not
be able to proceed with production due to coronavirus (if continues beyond
Jun 2020), hence a loss of Rp100-200bn of sales (less than 1% of total) in
2H19. KLBF estimated that affected API’s is c.10% of total COGS, while they
have enough APIs ready for production until Jun 2020 (our analysis here).
Cautious stance for FY20F
As weak purchasing power is likely to linger as we enter into 2020F, we
pencilled in 6.4% and 3.8% yoy sales and earnings growth, respectively,
more conservative than company’s guidance. We expect regulatory issues on
consumer health products (blue-labelled OTC pharma products, i.e. Komix,
Woods, Procold) to slowly resolve but we conservatively expect the segment
to post +2% sales growth (lower than company’s 4-6% target; but rebound
from -2% in FY19). Growth from its RTD beverages (i.e. Hydro Coco) also
may see risk if sweetened beverages excise is applied.
Maintain BUY; strengthening rupiah will remain as KLBF’s saving grace
We do believe strengthening rupiah may still be KLBF’s saving grace as we
use lower exchange rate of Rp13,700/US$ (from previously Rp14,200/US$).
While we cut our FY20-21F EPS by 6-7%, our Buy call is maintained
although TP is lowered to Rp1,500, now pegged to 25.5x 2021F P/E (1 s.d
below 5-year mean) from previously 30.0x 2020F P/E (5-year mean of 29.5x).
Current valuation at 2 s.d. below its 5-year mean is an attractive entry point.
Financial Summary (Rp bn) 2017A 2018A 2019F 2020F 2021F
Revenue 20,182 21,074 22,635 24,083 25,614
EBITDA 3,671 3,784 3,803 4,079 4,383
EBITDA growth 5.0% 3.1% 0.5% 7.2% 7.4%
Net profit 2,403 2,457 2,497 2,593 2,770
EPS (Rp) 51 52 53 55 59
EPS growth 4.7% 2.2% 1.6% 3.8% 6.8%
ROE 18.2% 16.8% 15.7% 15.2% 15.1%
PER (x) 23.8 23.3 22.9 22.1 20.6
EV/EBITDA (x) 14.9 14.3 14.5 13.4 12.4
Dividend yield 1.8% 2.1% 2.1% 2.4% 2.7%
Forecast change
-4.1% -6.4% -6.2%
IPS vs. consensus
95% 92% 92%
Sources: Company, IndoPremier Share price closing as of: 28 February 2020
-30%
-25%
-20%
-15%
-10%
-5%
0%
5%
Jan-20 Jan-20 Jan-20 Jan-20 Jan-20 Feb-20 Feb-20 Feb-20 Feb-20
JCI Index KLBF IJ
28 February 2020
Consumer Staples
Kalbe Farma
Page 2 of 7 Refer to Important disclosures in the last page of this report
Fig. 1: KLBF’s indicative 4Q/FY19 results: Earnings slightly below our and consensus’ estimates
Sources: Company, IndoPremier
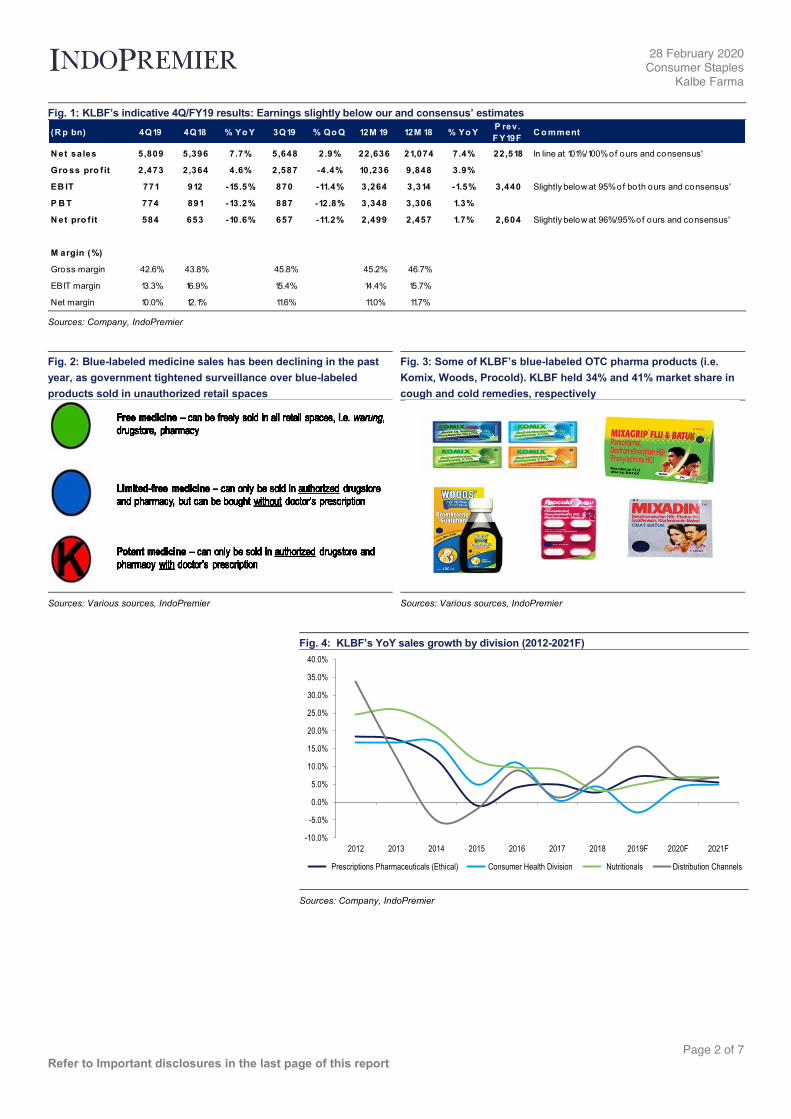
Fig. 2: Blue-labeled medicine sales has been declining in the past
year, as government tightened surveillance over blue-labeled
products sold in unauthorized retail spaces
Fig. 3: Some of KLBF’s blue-labeled OTC pharma products (i.e.
Komix, Woods, Procold). KLBF held 34% and 41% market share in
cough and cold remedies, respectively
Sources: Various sources, IndoPremier Sources: Various sources, IndoPremier
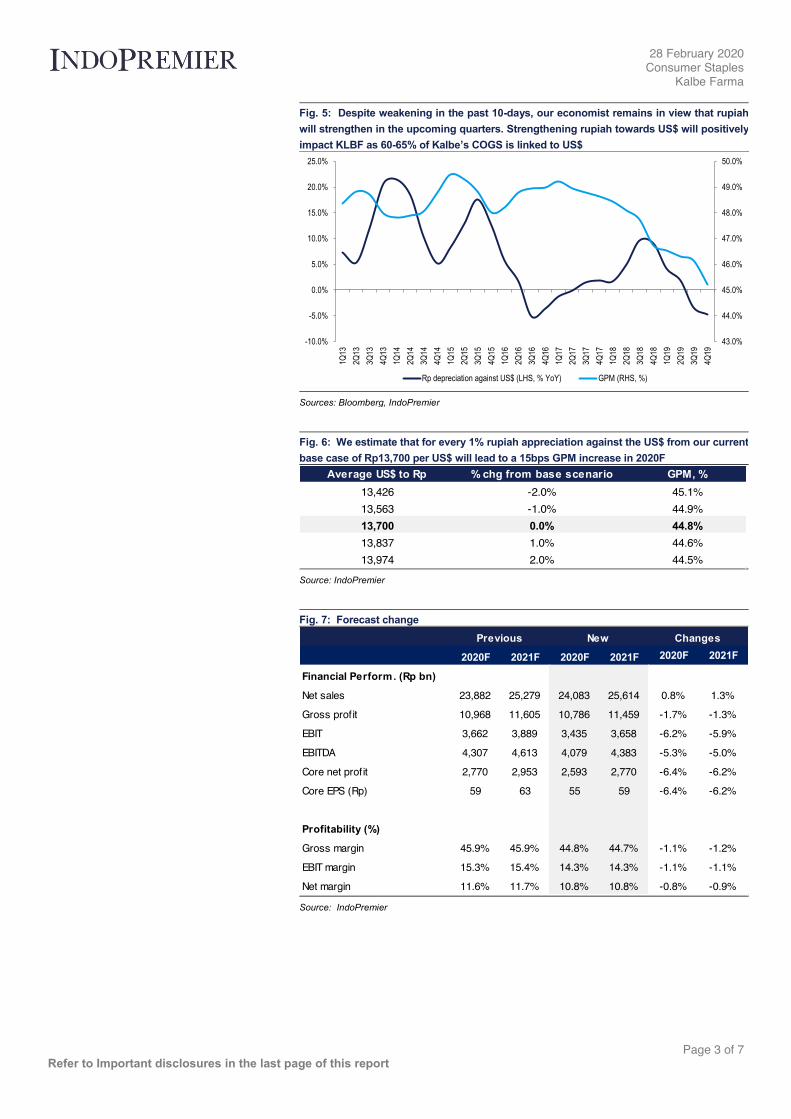
Fig. 4: KLBF’s YoY sales growth by division (2012-2021F)
Sources: Company, IndoPremier
(R p bn) 4Q19 4Q18 % Yo Y 3Q19 % Qo Q 12M 19 12M 18 % Yo YP rev.
F Y19FC o mment
N et sales 5,809 5,396 7.7% 5,648 2.9% 22,636 21,074 7.4% 22,518 In line at 101%/100% of ours and consensus'
Gro ss pro f it 2,473 2,364 4.6% 2,587 -4.4% 10,236 9,848 3.9%
EB IT 771 912 -15.5% 870 -11.4% 3,264 3,314 -1.5% 3,440 Slightly below at 95% of both ours and consensus'
P B T 774 891 -13.2% 887 -12.8% 3,348 3,306 1.3%
N et pro f it 584 653 -10.6% 657 -11.2% 2,499 2,457 1.7% 2,604 Slightly below at 96%/95% of ours and consensus'
M argin (%)
Gross margin 42.6% 43.8% 45.8% 45.2% 46.7%
EBIT margin 13.3% 16.9% 15.4% 14.4% 15.7%
Net margin 10.0% 12.1% 11.6% 11.0% 11.7%
-10.0%
-5.0%
0.0%
5.0%
10.0%
15.0%
20.0%
25.0%
30.0%
35.0%
40.0%
2012 2013 2014 2015 2016 2017 2018 2019F 2020F 2021F
Prescriptions Pharmaceuticals (Ethical) Consumer Health Division Nutritionals Distribution Channels
28 February 2020
Consumer Staples
Kalbe Farma
Page 3 of 7 Refer to Important disclosures in the last page of this report
Fig. 5: Despite weakening in the past 10-days, our economist remains in view that rupiah
will strengthen in the upcoming quarters. Strengthening rupiah towards US$ will positively
impact KLBF as 60-65% of Kalbe’s COGS is linked to US$
Sources: Bloomberg, IndoPremier
Fig. 6: We estimate that for every 1% rupiah appreciation against the US$ from our current
base case of Rp13,700 per US$ will lead to a 15bps GPM increase in 2020F
Source: IndoPremier
Fig. 7: Forecast change
Source: IndoPremier
43.0%
44.0%
45.0%
46.0%
47.0%
48.0%
49.0%
50.0%
-10.0%
-5.0%
0.0%
5.0%
10.0%
15.0%
20.0%
25.0%
1Q13
2Q13
3Q13
4Q13
1Q14
2Q14
3Q14
4Q14
1Q15
2Q15
3Q15
4Q15
1Q16
2Q16
3Q16
4Q16
1Q17
2Q17
3Q17
4Q17
1Q18
2Q18
3Q18
4Q18
1Q19
2Q19
3Q19
4Q19
Rp depreciation against US$ (LHS, % YoY) GPM (RHS, %)
Average US$ to Rp % chg from base scenario GPM, %
13,426 -2.0% 45.1%
13,563 -1.0% 44.9%
13,700 0.0% 44.8%
13,837 1.0% 44.6%
13,974 2.0% 44.5%
2020F 2021F 2020F 2021F 2020F 2021F
Financial Perform. (Rp bn)
Net sales 23,882 25,279 24,083 25,614 0.8% 1.3%
Gross profit 10,968 11,605 10,786 11,459 -1.7% -1.3%
EBIT 3,662 3,889 3,435 3,658 -6.2% -5.9%
EBITDA 4,307 4,613 4,079 4,383 -5.3% -5.0%
Core net profit 2,770 2,953 2,593 2,770 -6.4% -6.2%
Core EPS (Rp) 59 63 55 59 -6.4% -6.2%
Profitability (%)
Gross margin 45.9% 45.9% 44.8% 44.7% -1.1% -1.2%
EBIT margin 15.3% 15.4% 14.3% 14.3% -1.1% -1.1%
Net margin 11.6% 11.7% 10.8% 10.8% -0.8% -0.9%
Previous New Changes
28 February 2020
Consumer Staples
Kalbe Farma
Page 4 of 7 Refer to Important disclosures in the last page of this report
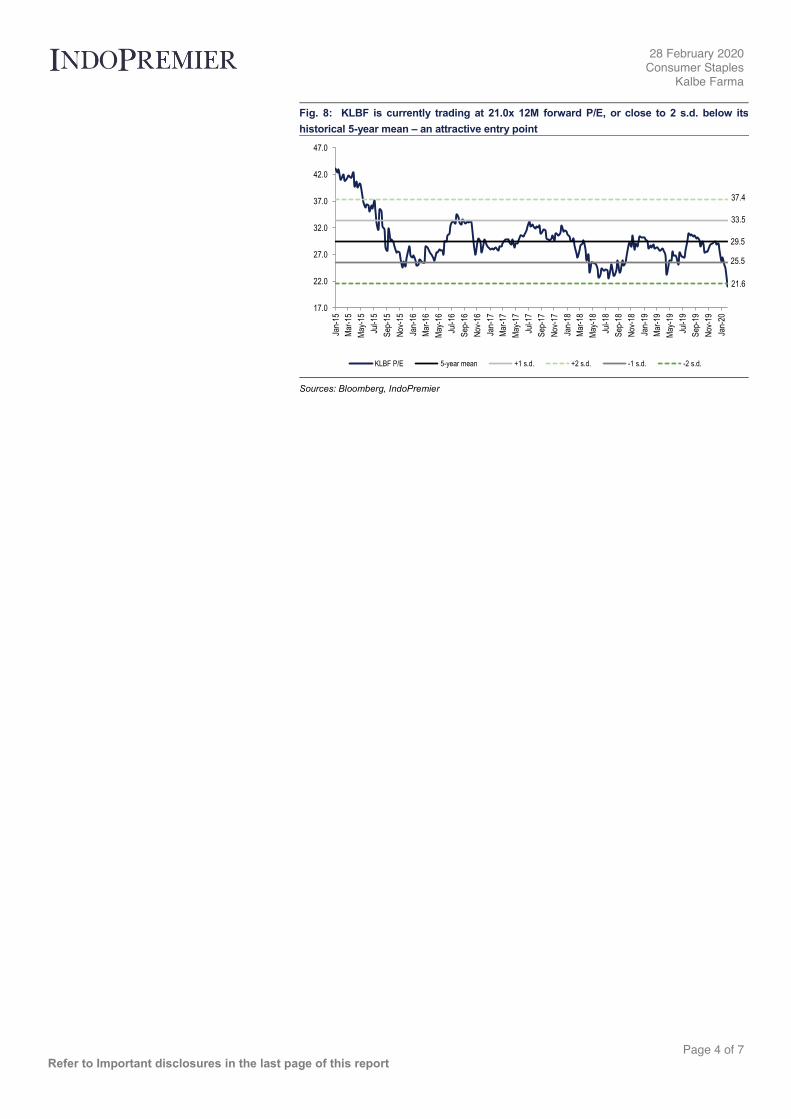
Fig. 8: KLBF is currently trading at 21.0x 12M forward P/E, or close to 2 s.d. below its
historical 5-year mean – an attractive entry point
Sources: Bloomberg, IndoPremier
29.5
33.5
37.4
25.5
21.6
17.0
22.0
27.0
32.0
37.0
42.0
47.0
Jan-
15
Mar
-15
May
-15
Jul-1
5
Sep
-15
Nov
-15
Jan-
16
Mar
-16
May
-16
Jul-1
6
Sep
-16
Nov
-16
Jan-
17
Mar
-17
May
-17
Jul-1
7
Sep
-17
Nov
-17
Jan-
18
Mar
-18
May
-18
Jul-1
8
Sep
-18
Nov
-18
Jan-
19
Mar
-19
May
-19
Jul-1
9
Sep
-19
Nov
-19
Jan-
20
KLBF P/E 5-year mean +1 s.d. +2 s.d. -1 s.d. -2 s.d.
28 February 2020
Consumer Staples
Kalbe Farma
Page 5 of 7 Refer to Important disclosures in the last page of this report
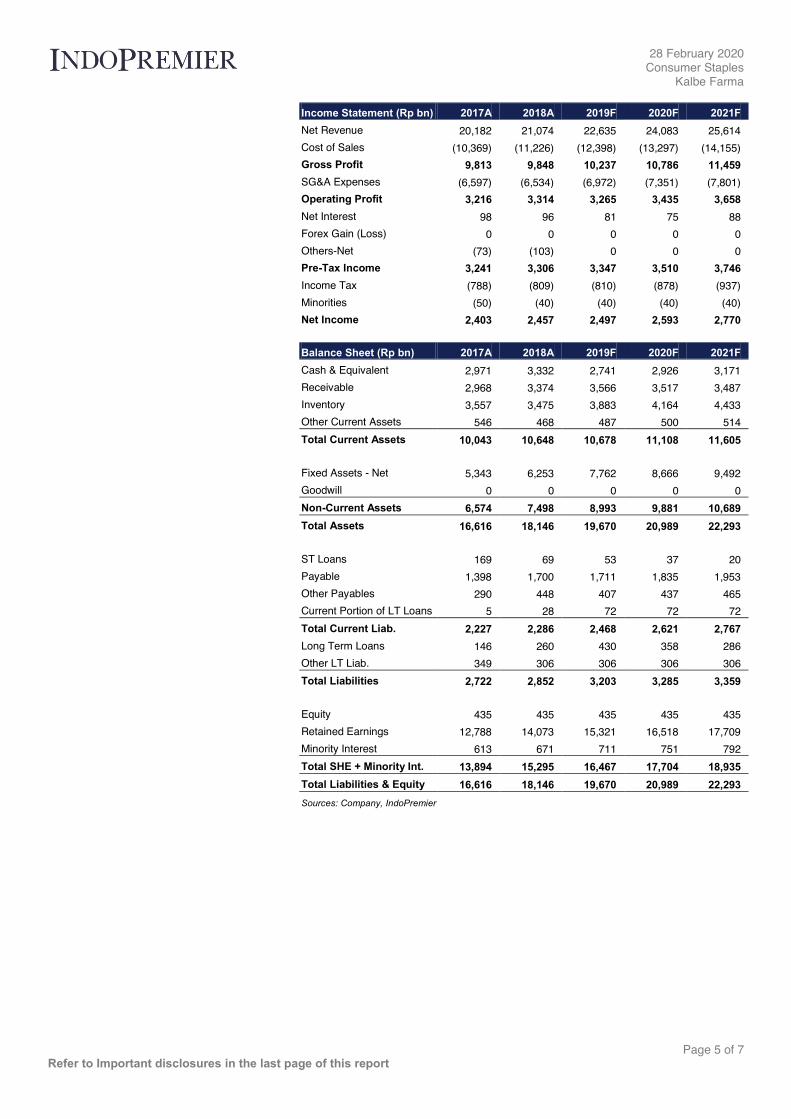
Income Statement (Rp bn) 2017A 2018A 2019F 2020F 2021F
Net Revenue 20,182 21,074 22,635 24,083 25,614
Cost of Sales (10,369) (11,226) (12,398) (13,297) (14,155)
Gross Profit 9,813 9,848 10,237 10,786 11,459
SG&A Expenses (6,597) (6,534) (6,972) (7,351) (7,801)
Operating Profit 3,216 3,314 3,265 3,435 3,658
Net Interest 98 96 81 75 88
Forex Gain (Loss) 0 0 0 0 0
Others-Net (73) (103) 0 0 0
Pre-Tax Income 3,241 3,306 3,347 3,510 3,746
Income Tax (788) (809) (810) (878) (937)
Minorities (50) (40) (40) (40) (40)
Net Income 2,403 2,457 2,497 2,593 2,770
Balance Sheet (Rp bn) 2017A 2018A 2019F 2020F 2021F
Cash & Equivalent 2,971 3,332 2,741 2,926 3,171
Receivable 2,968 3,374 3,566 3,517 3,487
Inventory 3,557 3,475 3,883 4,164 4,433
Other Current Assets 546 468 487 500 514
Total Current Assets 10,043 10,648 10,678 11,108 11,605
Fixed Assets - Net 5,343 6,253 7,762 8,666 9,492
Goodwill 0 0 0 0 0
Non-Current Assets 6,574 7,498 8,993 9,881 10,689
Total Assets 16,616 18,146 19,670 20,989 22,293
ST Loans 169 69 53 37 20
Payable 1,398 1,700 1,711 1,835 1,953
Other Payables 290 448 407 437 465
Current Portion of LT Loans 5 28 72 72 72
Total Current Liab. 2,227 2,286 2,468 2,621 2,767
Long Term Loans 146 260 430 358 286
Other LT Liab. 349 306 306 306 306
Total Liabilities 2,722 2,852 3,203 3,285 3,359
Equity 435 435 435 435 435
Retained Earnings 12,788 14,073 15,321 16,518 17,709
Minority Interest 613 671 711 751 792
Total SHE + Minority Int. 13,894 15,295 16,467 17,704 18,935
Total Liabilities & Equity 16,616 18,146 19,670 20,989 22,293
Sources: Company, IndoPremier
28 February 2020
Consumer Staples
Kalbe Farma
Page 6 of 7 Refer to Important disclosures in the last page of this report
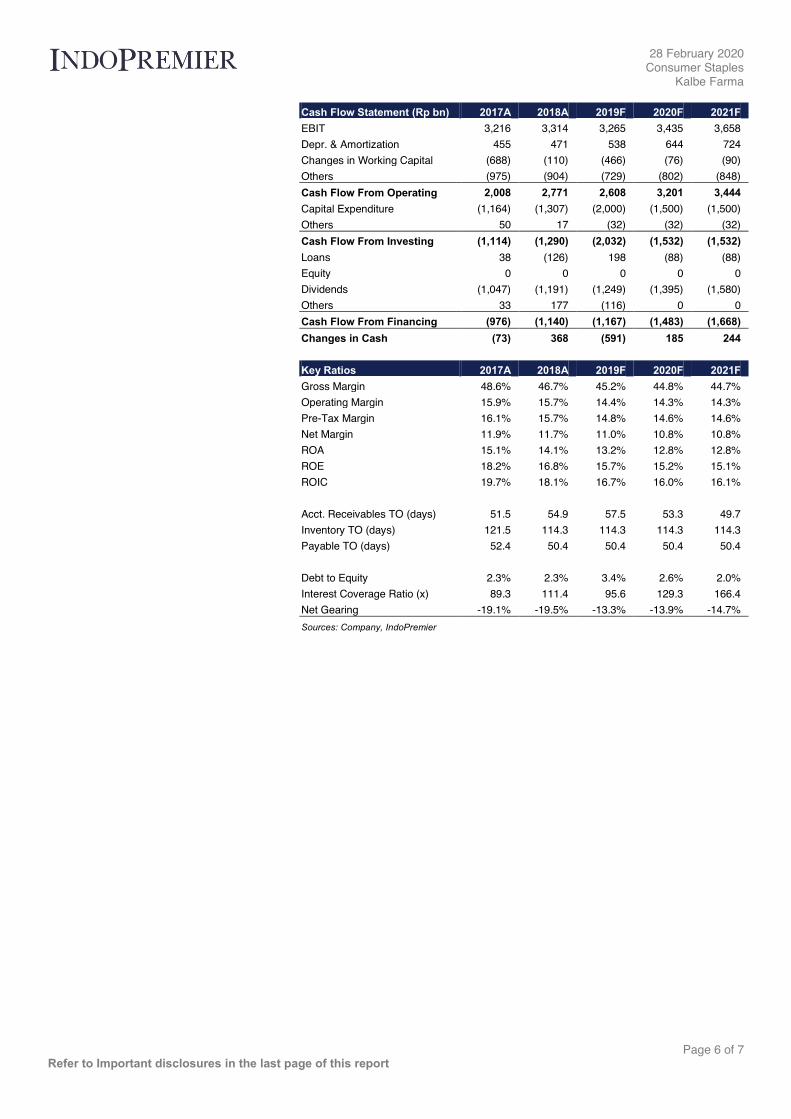
Cash Flow Statement (Rp bn) 2017A 2018A 2019F 2020F 2021F
EBIT 3,216 3,314 3,265 3,435 3,658
Depr. & Amortization 455 471 538 644 724
Changes in Working Capital (688) (110) (466) (76) (90)
Others (975) (904) (729) (802) (848)
Cash Flow From Operating 2,008 2,771 2,608 3,201 3,444
Capital Expenditure (1,164) (1,307) (2,000) (1,500) (1,500)
Others 50 17 (32) (32) (32)
Cash Flow From Investing (1,114) (1,290) (2,032) (1,532) (1,532)
Loans 38 (126) 198 (88) (88)
Equity 0 0 0 0 0
Dividends (1,047) (1,191) (1,249) (1,395) (1,580)
Others 33 177 (116) 0 0
Cash Flow From Financing (976) (1,140) (1,167) (1,483) (1,668)
Changes in Cash (73) 368 (591) 185 244
Key Ratios 2017A 2018A 2019F 2020F 2021F
Gross Margin 48.6% 46.7% 45.2% 44.8% 44.7%
Operating Margin 15.9% 15.7% 14.4% 14.3% 14.3%
Pre-Tax Margin 16.1% 15.7% 14.8% 14.6% 14.6%
Net Margin 11.9% 11.7% 11.0% 10.8% 10.8%
ROA 15.1% 14.1% 13.2% 12.8% 12.8%
ROE 18.2% 16.8% 15.7% 15.2% 15.1%
ROIC 19.7% 18.1% 16.7% 16.0% 16.1%
Acct. Receivables TO (days) 51.5 54.9 57.5 53.3 49.7
Inventory TO (days) 121.5 114.3 114.3 114.3 114.3
Payable TO (days) 52.4 50.4 50.4 50.4 50.4
Debt to Equity 2.3% 2.3% 3.4% 2.6% 2.0%
Interest Coverage Ratio (x) 89.3 111.4 95.6 129.3 166.4
Net Gearing -19.1% -19.5% -13.3% -13.9% -14.7%
Sources: Company, IndoPremier
28 February 2020
Consumer Staples
Kalbe Farma
INVESTMENT RATINGS
BUY : Expected total return of 10% or more within a 12-month period
HOLD : Expected total return between -10% and 10% within a 12-month period
SELL : Expected total return of -10% or worse within a 12-month period
ANALYSTS CERTIFICATION
The views expressed in this research report accurately reflect the analyst’s personal views about any and all of the
subject securities or issuers; and no part of the research analyst's compensation was, is, or will be, directly or
indirectly, related to the specific recommendations or views expressed in the report.
DISCLAIMERS
This research is based on information obtained from sources believed to be reliable, but we do not make any
representation or warranty nor accept any responsibility or liability as to its accuracy, completeness or correctness.
Opinions expressed are subject to change without notice. This document is prepared for general circulation. Any
recommendations contained in this document do not have any regard to the specific investment objectives, financial
situation and the particular needs of any specific addressee. This document is not and should not be construed as an
offer or a solicitation of an offer to purchase or subscribe or sell any securities. PT Indo Premier Sekuritas or its
affiliates may seek or will seek investment banking or other business relationships with the companies in this report.


