

June 28, 2012
Pharmaceuticals Institutional Equities
India Research
MANAGEMENT MEET NOTE
Cadila Healthcare HOLD
CMP (Rs) 765
Target Price (Rs) 850
Upside (%) 11
52 Week High/Low (Rs) 985/620
3m ADV (Rs mn /US$ mn) 57/1.0
Dishman Pharma BUY
CMP (Rs) 65
Target Price (Rs) 97
Upside (%) 50
52 Week High/Low (Rs) 102/33
3m ADV (Rs mn /US$ mn) 28/0.5
Torrent Pharma BUY
CMP (Rs) 587
Target Price (Rs) 700
Upside (%) 19
52 Week High/Low (Rs) 705/505
3m ADV (Rs mn /US$ mn) 23/0.4
Source; Bloomberg
Analysts Contact
Rahul Sharma
022 ‐ 6184 4310
Nishith Sanghvi
022 ‐ 6184 4326
Ahmedabad Visit Note In our recent trip to Ahmedabad, we visited three pharmaceutical
companies under our coverage i.e. Cadila Healthcare (Cadila), Torrent
Pharmaceuticals (Torrent Pharma) & Dishman Pharmaceuticals &
Chemicals (Dishman Pharma).
Previous vs. Current Recommendation
Earlier we recommended “BUY” on Cadila & Dishman, and “HOLD” on
Torrent. However, as we believe that most of the positives are captured amid
the price performance of Cadila, we change our rating to a “HOLD” with
marginally reduced target price. Meanwhile, we upgrade Torrent Pharma to a
“BUY” as the stock is quoting at reasonable valuations on FY14E basis, while
we maintain our “BUY” recommendation on Dishman Pharma on the back of
better revenue visibility.
Recent Observations
Cadila: The triggers in Cadila earlier were traction in domestic formulations
and the US FDA resolution on Moraiya plant. The scale‐up in the US market
was limited due to US FDA restriction on fresh approvals from the Moraiya
facility. In the recent visit, we observed that the Company is awaiting clean
chit from the US FDA for its Moraiya facility as certain observations have
been addressed post US FDA‐inspection. We believe that this will trigger new
launches in the US market, while the full impact of its acquisitions (Biochem &
Nesher) will be reflected in FY13E. We believe multiple revenue streams,
contract manufacturing and diversified geographical reach will aid Cadila in
sustaining its revenues going forward. We believe that Cadila’s margins are
likely to remain stable with upward bias in the aftermath of Prism II measures
taken by the Company in controlling overhead costs.
Torrent Pharma: It is observed from the recent visit that Torrent Pharma is
addressing key concerns on the domestic formulations front, while with better
traction in the US & Brazil its revenue is set to grow at 18.9% CAGR with
earnings CAGR of 39% in FY12‐14E period. We are upgrading margin
estimates of the Company owing to better hedging of forex exposure
reflecting higher realizations, while its EBIDTA would be accretive to the
extent of 150 bps, going forward
Dishman Pharma: Our positive stance on Dishman Pharma has further
strengthened with several of its business engines set to gradually fall in place
from FY13E onwards. The start of Vitamin D3, Disinfectants and Oncology
API unit would also add to the additional revenues streams. Our stance is
supported by renewed traction in Dishman India, new CEO in Carbogen
Amicis and better traction in Vitamin D3 business. We believe that slowdown
in capex would improve the return ratios of the Company from currently 11%
to 13‐15% over next three years.
We prefer Torrent Pharma in the mid‐cap space and Dishman Pharma
in the small‐cap space.

2
June 28, 2012
Pharmaceuticals
Exhibit 1: Valuation Summary
Cadila Healthcare Torrent Pharma Dishman Pharma
FY12 FY13E FY14E FY12 FY13E FY14E FY12 FY13E FY14E
Net Revenues (Rs. mn) 52,119 63,546 73,547 26,479 31,747 37,132 11,241 12,697 14,616
EBITDA Margin (%) 19.8 20.8 22.1 17.1 18.4 18.6 20 21.1 21.9
EPS (Rs.) 29.4 36.7 47.3 27.9 45.4 54.1 4.9 8.8 13.7
P/E (x) 26.1 20.9 16.2 21.0 12.9 10.8 13.2 7.4 4.7
EV/EBITDA(x) 16.7 13.3 10.6 10.3 7.8 6.4 5.8 4.2 2.9
P/S (x) 3.0 2.5 2.1 1.9 1.6 1.3 0.5 0.4 0.4
ROCE (%) 19.9 21.5 23.6 20.6 28 28.2 11.3 12.6 14.4
ROE (%) 25.7 27 28.8 25.6 28.9 28.2 5.5 7.7 9.9
Source: Karvy Institutional Research
Exhibit 2: Absolute Perf. From Junʹ2011
Source: Bloomberg, Karvy Institutional Research
Exhibit 3: Relative Perf. From Junʹ2011
Source: Bloomberg, Karvy Institutional Research
35
45
55
65
75
85
95
105
115
Jun‐11
Jul‐11
Aug‐11
Sep‐11
Oct‐11
Nov‐11
Dec‐11
Jan‐12
Feb‐12
Mar‐12
Apr‐12
May‐12
Sensex Torrent PharmaBSE HC Index Cadila HealthcareDishman Pharma
405060708090100110120130
Jun‐11
Jul‐11
Aug‐11
Sep‐11
Oct‐11
Nov‐11
Dec‐11
Jan‐12
Feb‐12
Mar‐12
Apr‐12
May‐12
Sensex Torrent PharmaBSE HC Index Cadila HealthcareDishman Pharma

Exhibit 4: Valuation Matrix
Rating CMP TP Up/Down MCap EPS P/E P/S EV/EBITDA ROE
(Rs) (Rs) side% (Rs bn) FY12E FY13E FY14E FY12E FY13E FY14E FY12E FY13E FY14E FY12E FY13E FY14E FY12E FY13E FY14E
Alembic Pharma BUY 48 81 69% 10 6.0 7.5 9.0 8.0 6.4 5.3 0.7 0.6 0.5 6.1 5.1 4.0 25.4 26.6 26.3
Aventis Pharma HOLD 2,170 2,200 1% 50 82.9 81.5 95.1 26.2 26.6 22.8 3.8 3.2 2.9 19.3 14.8 12.9 19.9 16.3 17.5
Cadila Healthcare HOLD 765 850 11% 156 29.4 36.7 47.3 26.1 20.9 16.2 3.0 2.5 2.1 16.7 13.3 10.6 25.7 27.0 28.8
Dishman Pharma BUY 65 97 49% 5 4.9 8.8 13.7 13.2 7.4 4.7 0.5 0.4 0.4 5.8 4.2 2.9 5.5 7.7 9.9
Divis Labs BUY 990 1135 15% 131 40.2 50.0 64.9 24.6 19.8 15.2 7.0 5.6 4.5 19.1 14.7 11.1 25.7 28.0 29.5
Cipla BUY 308 375 22% 247 13.4 17.0 19.7 22.9 18.1 15.6 3.6 3.1 2.7 15.7 12.5 10.7 15.8 17.8 18.1
Dr. Reddyʹs Labs BUY 1,610 1,950 21% 271 84.1 93.1 102.2 19.1 17.3 15.8 2.8 2.4 2.3 11.7 11.1 9.9 27.6 24.7 22.3
GlaxoSmithKline
Pharma SELL 2,003 2,130 6% 170 72.4 80.1 89.8 27.7 25.0 22.3 7.1 6.3 5.5 19.7 17.8 15.3 31.7 33.6 34.2
Indoco Remedies HOLD 55 62 13% 1 5.0 6.3 7.7 10.9 8.7 7.1 0.9 0.8 0.7 7.0 6.5 5.4 12.6 14.3 15.4
Ipca Labs. BUY 348 400 15% 44 21.8 27.0 33.1 15.9 12.9 10.5 1.9 1.6 1.4 9.5 8.1 6.7 24.0 24.4 24.3
Jubilant Life Sci. BUY 176 255 45% 27.9 0.9 20.7 28.7 191.6 8.5 6.1 0.7 0.6 0.5 7.8 6.6 2.3 0.6 12.9 15.7
Lupin Labs. HOLD 523 520 ‐1% 228 18.3 22.2 25.2 28.6 23.6 20.8 3.4 2.6 2.4 16.8 14.4 12.6 20.4 20.6 19.8
Ranbaxy Labs HOLD 488 530 9% 207 ‐68.7 25.0 25.3 ‐7.1 19.5 19.3 2.1 2.1 1.9 13.7 15.2 14.9 ‐6.9 31.1 24.1
Sun Pharma. HOLD 623 550 ‐12% 590 24.0 22.9 24.5 26.0 27.2 25.4 8.0 6.8 6.2 17.1 16.3 15.6 23.2 18.3 17.1
Torrent Pharma BUY 587 700 19% 50 27.9 45.4 54.1 21.0 12.9 10.8 1.9 1.6 1.3 10.3 7.8 6.4 25.6 28.9 28.2
Source: Company, Karvy Institutional Research

Pharmaceuticals June 28, 2012
Cadila Healthcare
Bloomberg: CDH INReuters: CADI.BO BUY
Institutional Equities
India Research
MANAGEMENT MEET NOTE
Recommendation
CMP: Rs765
Target Price: Rs850
Upside (%) 11%
Stock Information Market Cap. (Rs bn / US$ mn) 157/2,738
52‐week High/Low (Rs) 985/620
3m ADV (Rs mn /US$ mn) 57/1.0
Beta 0.4
Sensex/ Nifty 16,968/5,142
Share outstanding (mn) 205
Stock Performance (%) 1M 3M 12M YTD
Absolute 2.6 4.3 (15.9) 8.5
Rel. to Sensex (1.9) 6.1 (8.7) (1.1)
Performance
Source: Bloomberg, Karvy Institutional Research
Analysts Contact Rahul Sharma
022 ‐ 6184 4310
Nishith Sanghvi
022 ‐ 6184 4326
600
700
800
900
1,000
15,500
17,500
19,500
Jun‐11
Jul‐11
Sep‐11
Oct‐11
Nov‐11
Jan‐12
Feb‐12
Mar‐12
May‐12
Jun‐12
Sensex (LHS) Cadila Health. (RHS)
Momentum to improve
Cadila Healthcare (Cadila) is awaiting clean chit from the US FDA for its
Moraiya facility, which will trigger new launches in the US market, while
the full impact of its acquisitions (Biochem & Nesher) will be reflected in
the current year. We believe multiple revenue streams, contract
manufacturing and diversified geographical reach will aid in sustaining its
revenues going forward. We downgrade our earnings (on account of lower
traction in Nesher) and price target and maintain our “BUY” rating on the
stock.
Domestic Formulations – Growth in Excess of 15% (ex‐Biochem): Strong
growth in its key therapeutic segments i.e. Cardiac, Gastro Intestinal (GI),
Respiratory and Pain‐management in 2MFY13 signals the positive momentum
in this segment. We have factored 28.5% growth in FY13E due to inclusion of
Biochem (growth of 13%). Acquisition of Biochem was undertaken in order to
consolidate its position in the Anti‐infective segment.
US Business – Moraiya Facility Resolution & Likely Launch of Approved
Products to Provide Traction: The Moraiya facility overhang has acted as a
dampener for the US revenue scale‐up. Certain observations by the US FDA
post the inspection have been addressed. The clearance of the facility by the
US FDA will pave the way for 6‐7 new product launches. Launch of 10
approved products and 10 tentative approvals could also aid the US business.
Outlook & Valuation Cadila Healthcare’s performance will be aided with Biochem revenues and
integration being reflected in the ensuing quarters. Though the US FDA
resolution will act as a positive event for the Company, the upsides have been
built into a large extent. We marginally downgrade our EPS at Rs. 37.3 and Rs.
47.3 for FY13E and FY14E, respectively due to lower traction in Nesher. We
downgrade our price target by 3.4% to Rs. 850 per share based on 18xFY14E
and reiterate our “BUY” recommendation on the stock.
Key Financials
Rs Mn FY10 FY11 FY12 FY13E FY14E
Net sales 36,868 45,727 52,119 63,546 73,547
EBITDA 8,086 9,687 10,325 13,189 16,269
Net Profit 5,096 6,541 6,012 7,511 9,685
EPS(Rs) 24.9 31.9 29.4 36.7 47.3
EPS growth (%) 22.4 28.2 (8.1) 24.9 28.9
EBITDA margin (%) 21.9 21.2 19.8 20.8 22.1
PER(x) 30.7 23.9 26.0 20.8 16.2
EV/EBITDA (x) 20.4 17.0 16.6 13.2 10.6
Source: Company, Karvy Institutional Research Indian GAAP Consolidated
5
June 28, 2012
Cadila Healthcare
Domestic Formulations: Improved Growth on
Higher Scale
Cadila Healthcare has been witnessing improved traction in the domestic business
with the acquisition of Biochem giving it additional scale in the highly competitive
and largest therapeutic segment (anti‐infective) in the domestic market. The
Company has reported growth of 21.3% in 2MFY13 vis‐à‐vis domestic market
growth at 17.6%.
Key Products Growing in Double Digits: Key products in the domestic space
have been growing in double digits except for Falcigo (anti‐malarial) – impacted
by seasonality), Ocid (Omeprazole), Pantodac (Pantoprazole), and Primolut N
(Norethisterone).
Bio‐similars Biz: In India, bio‐similars are Rs. 500 mn business. Cadila Healthcare
is currently marketing five products in bio‐similar space, while two additional
products are likely from this business segment. The Company should register 12‐
15% growth in this segment, going forward on the products launched.
Exhibit 1: Product‐wise Growth (%) Brand 2M May’12
Zydus Total 21.3
ATEN 13.1
ATORVA 25.7
DERIPHYLLIN 26.2
PANTODAC 7.7
FALCIGO (2.2)
MIFEGEST KIT 17.4
OCID (1.0)
DEXONA 37.3
AMLODAC 15.8
PRIMOLUT N (8.1)
Source: AIOCD Awacs
Exhibit 2: Cadila Healthcare vs. IPM in 2MFY13
% of Domestic
Business
Cadila Growth for
2MFY13
IPM Growth for
2MFY13
Zydus Cadila 100.0 21.3 17.6
Cardiac 18.8 19.9 18.8
Gastro Intestinal 18.1 11.8 16.5
Gynaecological 13.4 8.0 14.1
Respiratory 10.0 33.3 13.6
Pain / Analgesics 8.5 50.1 15.1
Source: AIOCD, Awacs
Key Therapeutic Areas: Cadila Healthcare’s key therapeutic segments – which
have been outperforming the market – are: Cardiac, Respiratory & Pain‐
management. The Company is likely to register 28.5% growth in FY13E due to
inclusion of Biochem, which is expected to grow at 13% in FY13E.
Bayer Zydus Venture – Bayer to Launch More Products: The key therapy areas include Gynaecology, Diagnostics, CVS and Anti‐Diabetic, having 25‐30 products
with 400 MRs. The Company contributed Rs. 900 mn revenues to this venture. In
its aspiration to register higher‐than‐the‐market growth, the Company is likely to
launch certain innovative products from the Bayer platform, going forward.

6
June 28, 2012
Cadila Healthcare
Overseas Operations
A. Brazilian Market – Lackadaisical Growth due to
Quota‐based Products In Brazil, Cadila Healthcare is promoting its products in 5‐6 regions. It is currently
marketing over 20 branded products and over 15 generic‐generic products.
Branded sales constitute 65% of the Company’s revenues, whereas generic‐generic
sales constitute 35% of revenues. In FY12, sales remained flat in Real terms. The
key therapeutic segments in Brazil are: CVS & CNS. The Company has 2‐3 quota‐
based products, which form more than 10% of the Company’s Brazil revenues. In
FY 12 Cadila did not get expected sales from the same on account of raw material
constraints. We expect 15% growth in Brazil in FY13E and 12% in FY14E, as the
Company is likely to get approval for 2‐3 products, going ahead.
B. US Business – Moraiya Facility Resolution & Likely
Launch of Approved Products to Provide Traction: The resolution of the Moraiya facility will pave the way for 6‐7 products launches
which would also include 2 injectibles. Cadila has 10 final and 10 tentative
approvals – which are yet to be launched in the US market, as the Company
follows a policy of not selling below a certain margin. It is expected that scale up in
certain products may happen post initial high competitive intensity in those
products. We have factored launch of 12 and 15 product launches in FY13E and
FY14E, respectively. The launch of new products given in the following table will
aid 14% growth duly factored by us.
Exhibit 3: Products not launched in the US
Sl. No. Molecules
1. ALPRAZOLAM
2 AMIODARONE HYDROCHLORIDE
3 ATOMOXETINE HYDROCHLORIDE
4 BENAZEPRIL HYDROCHLORIDE
5 CLINDAMYCIN HYDROCHLORIDE
6 FINASTERIDE
7 GABAPENTIN
8 GALANTAMINE HYDROBROMIDE
9 GLIPIZIDE AND METFORMIN HYDROCHLORIDE
10 HYDRALAZINE HYDROCHLORIDE
11 INDOMETHACIN
12 LEVETIRACETAM
13 NAPROXEN
14 ZONISAMIDE
Source: Karvy Institutional Research
Moraiya facility: The Company has filed for 18 injectables, which are over 12‐
18 months old. Out of total injectables, 14 are pure contract manufacturing,
which are on cost + mark‐up.
Trans‐dermal Segment: In trans‐dermal segment, the Company has filed for 2
products and 6 products are in the pipeline. In FY14E, these two products will
probably be launched. As the number of competitors is less, the price erosion
will also lower in these products.
7
June 28, 2012
Cadila Healthcare
Inhalable Segment: In inhalable segment, the Company has 5 filings which
are 12‐18 months old. Azelastine was one such product for which Sun Pharma
has got the US FDA approval, hence the opportunity for Cadila has shrunk.
All products are in the nasal spray segment.
Cadila Healthcare’s policy for the US market has been to launch products at
certain margin, which has resulted in the Company registering negligible
market share in recently launched molecules. We expect the Company’s US
business to contribute US$275 mn in FY13E including Nesher revenues to the
tune of US$30 mn.
C. Nesher Acquisition – Long‐term Story Cadila Healthcare acquired Nesher for US$60 mn in Jun’11. Currently only one
product potassium chloride is sold from this platform, which contributes US$22
mn revenues to the Company. The revenues expected at US$30 mn and US$45‐50
mn for Nesher in FY13E and FY14E, respectively. The Company is expecting two
approvals in the latter half of the year. Though Metoprolol – a big product was
manufactured here – the Company is not going to launch the same from the
Nesher facility.
Nesher will earn company‐level margins on sales of US$60‐70 mn that could
happen post FY14E. We have lowered our revenues from US$ 45 mn in FY 13E to
US$30 mn and from US$ 70 mn in FY 14E to US$50 mn.
JV Business – Sustainable Stream of Revenues
Nycomed: It would launch 10 APIs, which are all generic in nature, not having
very huge potential.
Hospira: Cadila had originally formed a JV with Mayne, which was later
acquired by Hospira. Hospira has further added 16‐17 products on pure
contract manufacturing basis, which are over and above the 6 (Contract
manufacturing + profit sharing) products the Company is already selling.
Currently, EU and the US contribute equal amount of revenues in Hospira JV
for FY12.
Abbott: The margin from Abbott JV may be below Company’s margins as it is
a pure contract manufacturing arrangement. Abbott JV will pan out in a major
way only in FY14E.
Zydus Wellness: Though the Company will able to achieve 15% revenue
growth in this business, the margins will remain under pressure due to
promotional expenditure on the Actilife range. It should be able to maintain
last year’s margins in this venture.
Other Markets:
Mexico: The Company will start operations in FY14E, with revenues of sub
US$10 mn.
Japanese Market: The Company has 23‐25 products here, while 10% price cuts
have been implemented in 50% of these products.
8
June 28, 2012
Cadila Healthcare
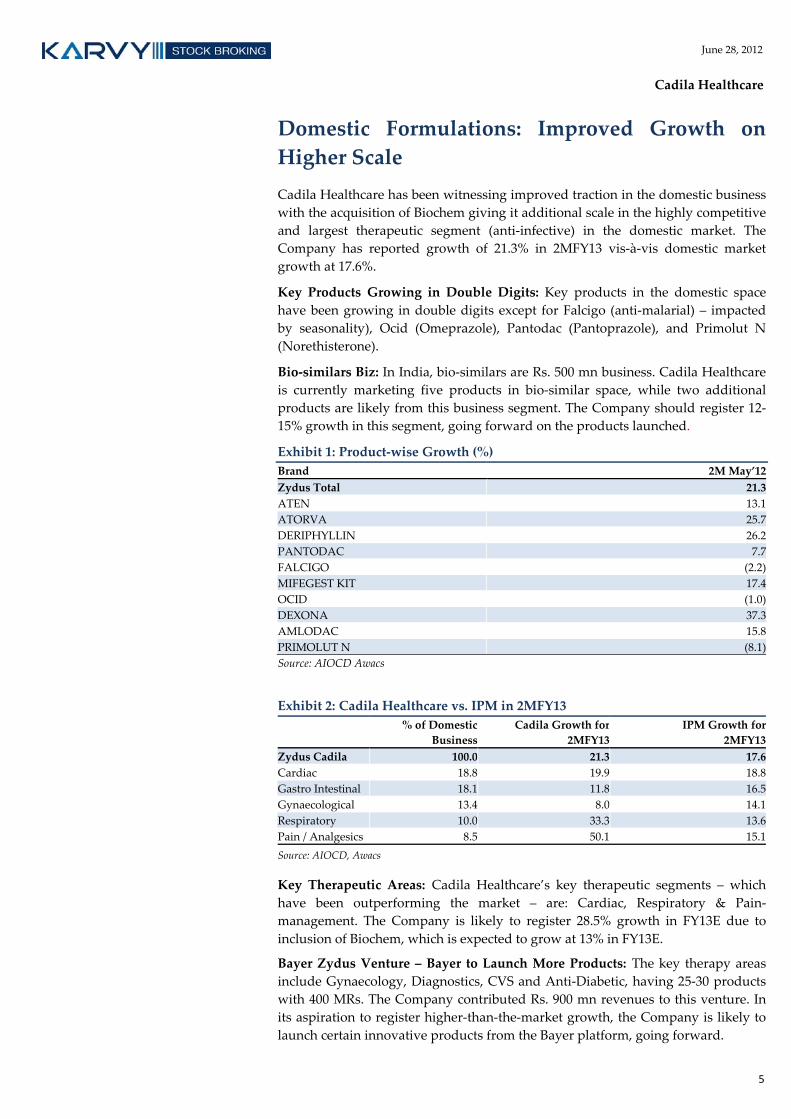
Price Performance vis‐à‐vis the BSE HC Index & Sensex
Cadila’s stock price performance over the last one year has been impacted due to
the warning letter at its Moraiya facility and uncertainty about the margins in
relation to the Biochem acquisition. The BSE HC Index has outperformed the
Sensex while Cadila has underperformed the sensex and BSE HC Index.
Exhibit 4: Absolute Perf. From Junʹ2011
Source: Bloomberg, Karvy Institutional Research
Exhibit 5: Relative Perf. From Junʹ2011
Source: Bloomberg, Karvy Institutional Research
We believe with the resolution at its Moraiya facility and synergy benefits in the
domestic market post the acquisition of Biochem, the company’s stock will start
reflecting positive bias.
70
75
80
85
90
95
100
105
110
Jun‐11
Jul‐11
Aug‐11
Sep‐11
Oct‐11
Nov‐11
Dec‐11
Jan‐12
Feb‐12
Mar‐12
Apr‐12
May‐12
Sensex Cadila Healthcare BSE HC Index
7580859095100105110115120125
Jun‐11
Jul‐11
Aug‐11
Sep‐11
Oct‐11
Nov‐11
Dec‐11
Jan‐12
Feb‐12
Mar‐12
Apr‐12
May‐12
Sensex Cadila Healthcare BSE HC Index

9
June 28, 2012
Cadila Healthcare
Exhibit 6: Profit & Loss Statement Rs. mn FY10 FY11 FY12 FY13E FY14E
Net Sales 36,868 45,727 52,119 63,546 73,547
% growth 25.9 24.0 14.0 21.9 15.7
Raw Material 11,784 14,754 16,794 20,610 24,164
Staff 3,930 5,493 7,512 9,118 10,212
Others Exps 13,068 15,793 17,489 20,629 22,902
Total Expenditure 28,782 36,040 41,795 50,357 57,278
EBITDA 8,086 9,687 10,325 13,189 16,269
EBITDA margin (%) 21.9 21.2 19.8 20.8 22.1
Other income 158 131 531 391 438
Interest 809 780 1,069 1,505 1,494
Depreciation 1,339 1,269 1,579 2,040 2,312
Profit Before Tax 6,084 7,850 7,428 10,035 12,900
Tax 741 1,064 1,130 2,208 2,838
Effective tax rate (%) 12.2 13.5 15.2 22.0 22.0
Net Profit 5,343 6,792 6,298 7,827 10,062
Minority Interest ‐247 ‐251 ‐286 ‐316 ‐377
Profit After Minority Interest 5,096 6,541 6,012 7,511 9,685
Extraordinaries ‐45 569 513 0 0
Reported Net Profit 5,051 7,110 6,525 7,511 9,685
Source: Company, Karvy Institutional Research
Exhibit 7: Balance Sheet Statement Rs. mn FY10 FY11 FY12 FY13E FY14E
Equity 682 1,024 1,024 1,024 1,024
Minority Interest 392 669 904 904 904
Reserves 15,603 20,691 24,712 29,342 36,686
Net worth 16,677 22,384 26,640 31,270 38,614
Short‐term Loans 6,593 6,580 9,325 10,454 12,109
Long‐term Loans 4,312 4,393 13,626 13,626 13,626
Total Loans 10,905 10,973 22,951 24,080 25,735
Deferred tax Liability 1,141 1,127 1,185 1,185 1,185
Liabilities 28,723 34,484 50,776 56,535 65,534
Gross Block 25,578 28,320 42,326 48,976 54,476
Depreciation 8,734 9,994 11,573 13,613 15,925
Net Block 16,844 18,326 30,753 35,363 38,551
Capital work‐in‐progress 2,482 4,310 2,565 2,415 1,915
Investments 207 207 212 212 212
Inventories 7,504 8,119 10,905 13,078 14,941
Debtors 4,668 7,652 8,863 9,864 11,498
Cash 2,507 2,952 7,517 5,735 9,080
Other Current assets 3,070 4,106 5,377 6,221 7,207
Total Current assets 17,749 22,829 32,662 34,898 42,726
Creditors 6,146 8,306 5,455 6,695 7,849
Other current liabilities 2,515 2,882 9,961 9,658 10,021
Total current liabilities 8,661 11,188 15,416 16,353 17,870
Net current assets 9,088 11,641 17,246 18,545 24,857
Forex Account 102 0 0 0 0
Total Assets 28,723 34,484 50,776 56,535 65,534
Source: Company, Karvy Institutional Research

10
June 28, 2012
Cadila Healthcare
Exhibit 8: Cash Flow Statement
Rs. mn FY10 FY11 FY12 FY13E FY14E
EBIT 6,747 8,418 8,746 11,148 13,957
(Inc.)/Dec in working capital ‐402 ‐2,108 ‐1,040 ‐3,081 ‐2,967
Cash flow from operations 6,345 6,310 7,706 8,067 10,989
Other income 158 131 531 391 438
Depreciation 1,339 1,269 1,579 2,040 2,312
Interest paid (‐) ‐809 ‐780 ‐1,069 ‐1,505 ‐1,494
Tax paid (‐) ‐741 ‐1,064 ‐1,130 ‐2,208 ‐2,838
Dividends paid (‐) ‐1,237 ‐1,529 ‐1,732 ‐1,977 ‐2,340
Extraordinaries ‐45 569 513 0 0
Minority interest ‐247 ‐251 ‐286 ‐316 ‐377
Forex ‐12 81 ‐780 0 0
Deferred Tax liability ‐175 ‐14 58 0 0
Net cash from operations 4,576 4,721 5,390 4,494 6,689
Capital Expenditure (‐) ‐3,478 ‐4,579 ‐12,261 ‐6,500 ‐5,000
Free Cash Flow 1,098 142 ‐6,872 ‐2,006 1,689
Inc./(Dec.) in short‐term borrowing ‐1,219 ‐13 2,745 1,129 1,655
Inc./(dec.) in long‐term borrowing ‐550 81 9,233 0 0
Inc./(dec.) in borrowings ‐1,769 68 11,978 1,129 1,655
(Inc.)/Dec. in Investments 42 0 ‐5 0 0
Equity issue/(Buyback) 440 452 333 0 0
Cash from Financial Activities ‐1,287 520 12,307 1,129 1,655
Others 179 ‐217 ‐870 ‐904
Opening cash 2,517 2,507 2,952 7,517 5,735
Closing cash 2,507 2,952 7,517 5,735 9,080
Change in Cash ‐10 445 4,565 ‐1,782 3,344
Source: Company, Karvy Institutional Research
Exhibit 9: Key Ratios
FY10 FY11 FY12 FY13E FY14E
EV/EBDITA 20.4 17.0 16.6 13.2 10.6
ROE (%) 35.3 34.8 25.7 27.0 28.8
ROCE (%) 24.9 27.3 19.9 21.5 23.6
PE (x) 30.7 23.9 26.0 20.8 16.2
P/S (x) 4.3 3.5 3.0 2.5 2.1
P/BV (x) 9.4 6.9 5.9 5.0 4.1
Source: Company, Karvy Institutional Research

Pharmaceuticals June 28, 2012
Dishman Pharma & Chemicals
Bloomberg: DISH INReuters: DISH.BO BUY
Institutional Equities
India Research
MANAGEMENT MEET NOTE
Recommendation
CMP: Rs65
Target Price: Rs97
Upside (%) 50%
Stock Information Market Cap. (Rs bn / US$ mn) 05/91
52‐week High/Low (Rs) 102/33
3m ADV (Rs mn /US$ mn) 28/0.5
Beta 0.9
Sensex/ Nifty 16,968/5,142
Share outstanding (mn) 81
Stock Performance (%) 1M 3M 12M YTD
Absolute 26.5 39.7 (27.6) 73.9
Rel. to Sensex 20.9 42.1 (21.5) 58.4
Performance
Source: Bloomberg, Karvy Institutional Research
Analysts Contact Rahul Sharma
022 ‐ 6184 4310
Nishith Sanghvi
022 ‐ 6184 4326
20
40
60
80
100
15,500
17,500
19,500
Jun‐11
Jul‐11
Sep‐11
Oct‐11
Nov‐11
Jan‐12
Feb‐12
Mar‐12
May‐12
Jun‐12
Sensex (LHS) Dishman Pharma. (RHS)
Treading Cautiously
Dishman Pharmaceuticals & Chemicals (Dishman Pharma) is quite upbeat
for FY13E with several of the Company’s business engines gradually
falling in place. The commencement of Vitamin D3, Disinfectants and
Oncology unit would add to the additional revenues streams. Renewed
traction in Dishman Pharma would also aid the profitability. We upgrade
our EPS estimates and reiterate our “BUY” recommendation on the stock.
Dishman Netherlands: Dishman Netherlands will clock Rs. 2.5 bn revenues
in FY13 as against Rs. 1.93 bn in FY12. The new Vitamin D3 plant will
contribute to the additional revenues coupled with firming up of cholesterol
prices from US$200/kg to US$275/kg. 25 % improvement in EBDITA is
envisaged on a y‐o‐y basis.
Carbogen Amicis: The Company has roped in its erstwhile CEO Mark
Griffith. The focus is on profitable business and not topline. All low‐value
products and APIs are transferred to India and Synprotec UK. The
Company’s revenues should move up from CHF 74 mn in FY 12 to CHF 85
mn in the current year.
Dishman India: Dishman India has 15 projects which are going on‐stream
and each project should contribute US$1‐3 mn. Dishman India revenues
should move up from Rs. 4.6 bn to Rs. 5.5 bn in FY13E. A new generic API
division (Oncology APIs ‐ initial focus) with a marketing strength of 15
people has been started to de‐risk from the volatile CRAMS revenues.
Outlook & Valuation
Dishman Pharma is confident of finishing the current year with revenues of
Rs. 12.5 bn and EBDITA to the tune of Rs. 2.65 bn. The first quarter results
may not be very good, as Solvay supplies will commence form 2nd quarter
onwards. We upgrade our EPS estimates for FY13E by 20% to Rs. 8.8 for
FY13E, mainly on account of lower depreciation and introduce FY14E EPS at
Rs. 13.7. We reiterate our “BUY” recommendation on the stock, while
revising the target price by 21% to Rs. 97 per share based 11xFY13E.
Key Financials
Rsmn FY10 FY11 FY12 FY13E FY14E
Net Sales 9,154 9,908 11,241 12,697 14,616
EBITDA 2,038 1,622 2,245 2,678 3,205
Net Profit 1,027 629 397 709 1,107
EPS (Rs) 12.7 7.8 4.9 8.8 13.7
EPS Growth (%) ‐29.7 ‐38.8 ‐36.8 78.3 56.3
EBITDA margin (%) 22.3 16.4 20.0 21.1 21.9
PER (x) 5.1 8.3 13.2 7.4 4.7
Source: Company, Karvy Institutional Research Indian GAAP Consolidated
12
June 28, 2012
Dishman Pharma
On management succession: The Managing Director’s son Arpit is handling the
Naroda plant for the around 2 years and now has been given the charge of the
Bavla plant from Jun’12 jointly with the CEO. The Company’s Disinfectant
business has been handled by the MD’s daughter Mansi. The Company has
commenced supplies to an Australian company for institutional business.
Carbogen Amicis: The completion of the restructuring resulted in removal of 80
people from the contract research side of the Company. Prior to the restructuring
and separation of employees, revenues were booked just to achieve the topline.
Carbogen Amicis’ contract research revenues have gone down from CHF 60 mn to
CHF 40 mn in FY12 post the restructuring.
The Hypo facility has gone on‐stream in India, which is a Class‐IV high
containment facility. This year the high containment facility should earn US$5‐6
mn revenues and the China low containment should earn US$5‐6 mn revenues. In
case the toll production with an MNC generic manufacturer takes place, then the
Company’s revenues should breach US$10 mn. As the Company’s Unit‐9 has a lot
of MNC customers, it should do well going ahead. One of the CRAMS majors,
having a facility in Europe, has booked the Unit 9 for the year.
The Company’s CVS drug is in the process of scaling up with approvals pending
in various countries. This product should earn around US$6‐7 mn revenues in
current year and US$10‐15 mn in FY14E.
Measures to Aid Financial Strength The Company’s board has gone in for a period of immense restraint and is now
planning a capex of Rs. 300 mn each for FY13E & FY14E.
The Company also has plans of debt repayment to the tune of CHF 8 mn in FY13E
and CHF 16 mn in FY14E.
The Company is in the process of de‐notifying its SEZ, which should enable the
Company to prepay the loans to the tune of Rs. 1 bn.
The Company has set its sights to cross the 13‐15% ROCE mark in the next two‐
three years.
Price Performance vis‐à‐vis BSE HC Index and Sensex The performance of Dishman has been impacted due to problems at Carbogen
Amcis. The company also witnessed execution delays in few of its projects.
Exhibit 1: Absolute Perf. From Junʹ2011
Source: Bloomberg, Karvy Institutional Research
Exhibit 2: Relative Perf. From Junʹ2011
Source: Bloomberg, Karvy Institutional Research
30405060708090100110120
Jun‐11
Jul‐11
Aug‐11
Sep‐11
Oct‐11
Nov‐11
Dec‐11
Jan‐12
Feb‐12
Mar‐12
Apr‐12
May‐12
Sensex Dishman Pharma BSE HC Index
405060708090100110120130
Jun‐11
Jul‐11
Aug‐11
Sep‐11
Oct‐11
Nov‐11
Dec‐11
Jan‐12
Feb‐12
Mar‐12
Apr‐12
May‐12
Sensex Dishman Pharma BSE HC Index

13
June 28, 2012
Dishman Pharma
Exhibit 3: Change in estimates
Rs. mn FY13E FY14E Comments
New Old Change (%)
Revenues 12,697 12,617 0.6 14,616
CRAMS 8,289 8,045 3.0 9,797 Better revenue traction in Carbogen Amcis
CVS 288 336 (14.3) 480
High Potency 325 260 25.0 780
MM 4,385 4,521 (3.0) 4,793 Migration from low value QUATS
Vitamin D3 2,470 2,101 17.6 2,720 New plant aiding scale up
Disinfectant 150 150 ‐ 250
EBITDA 2,678 2,638 1.5 3,205
EBITDA margin (in %) 21.1 20.9 21.9
Net Profit 709 592 19.7 1,107 Lower depreciation aiding profitability
EPS (in Rs.) 8.8 7.3 19.7 13.7
Source: Company, Karvy Institutional Research
Exhibit 4: Profit & Loss
FY10 FY11 FY12 FY13E FY14E
Net Revenues 9,154 9,908 11,241 12,697 14,616
% growth in Net Revenues (14.2) 8.2 13.4 13.0 15.1
Total Material Cost 2,780 3,552 3,842 4,317 4,969
Staff 2,541 2,804 2,942 3,236 3,624
Manufacturing Expenses 794 943 990 1,111 1,279
Administrative and other expenses 827 774 877 974 1,100
Selling & Dist 175 213 345 381 438
Total Expenditure 7,116 8,286 8,996 10,019 11,411
EBITDA 2,038 1,622 2,245 2,678 3,205
EBITDA margin (%) 22.3 16.4 20.0 21.1 21.9
Other Income 269 402 130 3 3
Interest 388 416 729 663 631
Depreciation 594 688 765 842 869
Profit Before Tax 1,325 921 880 1,173 1,705
Tax 150 108 312 293 426
Effective tax rate (%) 11.3 11.7 35.4 25.0 25.0
Profit After Tax 1,176 813 568 880 1,278
Adjustments 3 ‐14 0 0 0
Net Profit 1,179 800 569 880 1,279
Amortization of Goodwill on acquisition 151 171 171 171 171
Reported Net Profit 1,027 629 397 709 1,107
Source: Company, Karvy Institutional Research

14
June 28, 2012
Dishman Pharma
Exhibit 5: Balance Sheet
Rs. mn FY10 FY11 FY12 FY13E FY14E
Equity 161 161 161 161 161
Share Application Money 76 16 16 16 16
Reserves 8,801 9,839 10,612 11,879 13,545
Net worth 9,038 10,016 10,789 12,056 13,722
Short‐term Loans 1,443 2,863 3,591 3,668 4,027
Long‐term Loans 6,296 5,826 6,147 5,547 4,797
Total Loans 7,739 8,689 9,737 9,215 8,824
Deferred Tax Liabilities 316 323 323 323 323
Liabilities 17,220 19,027 20,849 21,593 22,868
Gross Block 10,834 13,322 16,438 17,238 17,538
Depreciation 2,481 3,279 4,044 4,886 5,755
Net Block 8,353 10,044 12,395 12,353 11,783
Capital work‐in‐progress 3,574 4,116 2,000 1,500 1,500
Good Will on acquisition 1,195 1,224 1,053 882 710
Long‐term Investments 14 14 15 15 15
Goodwill on Consolidation 77 77 77 77 77
Inventories 2,423 2,702 2,607 2,951 3,367
Debtors 1,131 1,737 2,028 1,967 2,245
Cash 455 425 2,058 3,327 4,804
Loans and Advances 1,871 1,680 1,792 1,972 2,189
Total Current assets 5,880 6,544 8,485 10,217 12,606
Current Liabilities 1,617 2,703 2,876 3,139 3,500
Provisions 256 289 299 310 322
Total current liabilities & provisions 1,873 2,991 3,175 3,449 3,822
Net current assets 4,007 3,552 5,310 6,768 8,783
Total Assets 17,220 19,027 20,849 21,593 22,868
Source: Company, Karvy Institutional Research
15
June 28, 2012
Dishman Pharma
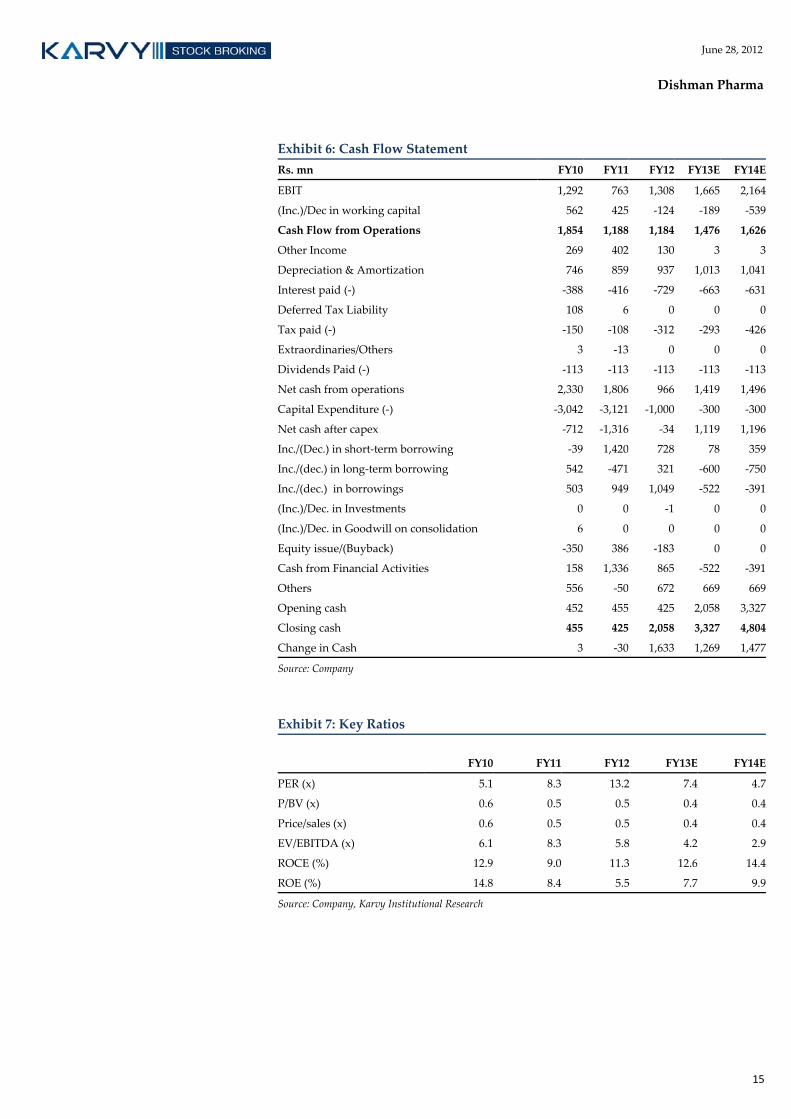
Exhibit 6: Cash Flow Statement
Rs. mn FY10 FY11 FY12 FY13E FY14E
EBIT 1,292 763 1,308 1,665 2,164
(Inc.)/Dec in working capital 562 425 ‐124 ‐189 ‐539
Cash Flow from Operations 1,854 1,188 1,184 1,476 1,626
Other Income 269 402 130 3 3
Depreciation & Amortization 746 859 937 1,013 1,041
Interest paid (‐) ‐388 ‐416 ‐729 ‐663 ‐631
Deferred Tax Liability 108 6 0 0 0
Tax paid (‐) ‐150 ‐108 ‐312 ‐293 ‐426
Extraordinaries/Others 3 ‐13 0 0 0
Dividends Paid (‐) ‐113 ‐113 ‐113 ‐113 ‐113
Net cash from operations 2,330 1,806 966 1,419 1,496
Capital Expenditure (‐) ‐3,042 ‐3,121 ‐1,000 ‐300 ‐300
Net cash after capex ‐712 ‐1,316 ‐34 1,119 1,196
Inc./(Dec.) in short‐term borrowing ‐39 1,420 728 78 359
Inc./(dec.) in long‐term borrowing 542 ‐471 321 ‐600 ‐750
Inc./(dec.) in borrowings 503 949 1,049 ‐522 ‐391
(Inc.)/Dec. in Investments 0 0 ‐1 0 0
(Inc.)/Dec. in Goodwill on consolidation 6 0 0 0 0
Equity issue/(Buyback) ‐350 386 ‐183 0 0
Cash from Financial Activities 158 1,336 865 ‐522 ‐391
Others 556 ‐50 672 669 669
Opening cash 452 455 425 2,058 3,327
Closing cash 455 425 2,058 3,327 4,804
Change in Cash 3 ‐30 1,633 1,269 1,477
Source: Company
Exhibit 7: Key Ratios
FY10 FY11 FY12 FY13E FY14E
PER (x) 5.1 8.3 13.2 7.4 4.7
P/BV (x) 0.6 0.5 0.5 0.4 0.4
Price/sales (x) 0.6 0.5 0.5 0.4 0.4
EV/EBITDA (x) 6.1 8.3 5.8 4.2 2.9
ROCE (%) 12.9 9.0 11.3 12.6 14.4
ROE (%) 14.8 8.4 5.5 7.7 9.9
Source: Company, Karvy Institutional Research

Pharmaceuticals June 28, 2012
Torrent Pharma
Bloomberg: TRP INReuters: TRP.BO BUY
Institutional Equities
India Research
MANAGEMENT MEET NOTE
Recommendation
CMP: Rs587
Target Price: Rs700
Upside (%) 19%
Stock Information Market Cap. (Rs bn / US$ mn) 50/868
52‐week High/Low (Rs) 705/505
3m ADV (Rs mn /US$ mn) 23/0.4
Beta 0.5
Sensex/ Nifty 16,968/5,142
Share outstanding (mn) 85
Stock Performance (%) 1M 3M 12M YTD
Absolute (8.1) (5) (4.6) 8.6
Rel. to Sensex (12.2) (3.3) 3.5 (1.1)
Performance
Source: Bloomberg, Karvy Institutional Research
Analysts Contact Rahul Sharma
022 ‐ 6184 4310
Nishith Sanghvi
022 ‐ 6184 4326
500550600650700750
15,500
17,500
19,500
Jun‐11
Jul‐11
Sep‐11
Oct‐11
Nov‐11
Jan‐12
Feb‐12
Mar‐12
May‐12
Jun‐12
Sensex (LHS) Torrent Pharma. (RHS)
Staging for a Comeback
With the company addressing key concerns on the domestic formulations
front and better traction in US and Brazil, the company is all set to
achieve 18.9 % CAGR revenue growth for the period FY 12‐14E and an
earnings CAGR of 39 %, we upgrade our rating on the stock to BUY.
Domestic Formulations – Back on Track: The primary reason for the
underperformance can be attributed due to cluttering of brands in the anti‐
infective and the pain management segment which led to inadequate
promotion of brands and hence the Company lost ground in these
segments. The company has recruited 200 additional MRs so as to impart
more focus. With the measures in place we believe the company would be
able to achieve the 12% and 14% growth factored by us for FY13E and
FY14E, respectively
Brazil – Growth in line with Branded Generics Market: The Company
would launch minimum 3‐4 products every year for the next two years
across geographies. With addition of 50 MRs for FY 13, better detailing and
a 10% INR depreciation vis‐à‐vis the Brazilian Real, the company is
confident of growing by 15 % for FY 13E and FY 14E.
Reasonable Scale in the US Market: Torrent Pharma will continue to
launch 5‐6 products every year and will continue to follow a policy to sell
products which are profitable. The company has been able to secure sizable
market share in certain products. With 60‐70 % of the products fully
backward integrated, the company would be able to scale Rs 3.2 bn
revenues in FY 13E and Rs 4.6 bn revenues in FY14E respectively.
Outlook & Valuation Torrent Pharma is among the few companies to have adopted accrual basis
for sales return and has provided additional R & D expenses on account of
the new GDUFA provisions for the pending ANDAs in Q4 FY 12. We
marginally upgrade our EPS for FY13E by 3.2% to Rs. 45.4, while we
maintain our FY14E EPS at Rs. 54.1. On account of price correction, we
upgrade the stock to “BUY” with a price target of Rs. 700 per share based
on 12.9xFY14E.
Key Financials
Rs Mn FY10 FY11 FY12 FY13E FY14E
Net Revenues 18,885 21,849 26,479 31,747 37,132
EBITDA 3,932 3,677 4,527 5,840 6,908
Net Profit 2,717 2,542 2,360 3,838 4,578
EPS(Rs) 32.1 30.0 27.9 45.4 54.1
EBITDA margin(%) 20.8 16.8 17.1 18.4 18.6
PER(x) 18.4 19.7 21.2 13.1 10.9
Source: Company, Karvy Institutional Research Indian GAAP Consolidated

18
June 28, 2012
Torrent Pharma
Domestic Formulations: Witnessing Improved
Traction
Torrent Pharma’s growth for 2MFY13 (Apr’12 & May’12) stood at 14.4%, while the
IPM growth during the same period was at 17.6%, as per AIOCD data.
Torrent Pharma’s all key brands in the Top‐10 except for Domstal, Topcef and
Droxyl (Cefadroxil) are witnessing good growth. The de‐growth witnessed in
Droxyl can be attributed to overall market degrowth.
Exhibit 1: Domestic Therapeutic breakup
Torrent Pharmaceuticals % of
DomesticTorrent Growth (%) IPM growth (%)
Cardiac 33.9 21.3 18.8
Neuro / CNS 21.0 12.3 13.2
Gastro Intestinal 17.7 15.7 16.5
Anti‐Infectives 12.1 ‐12.8 16.6
Anti Diabetic 5.9 10.5 29.5
Source: Company, AIOCD Awacs, Karvy Institutional Research
Segment‐wise Performance
The growth in Cardiac segment has outperformed the domestic market
growth
The growth in the Gastro Intestinal space has been in line with the market
The growth in anti‐diabetic market has been lower, as the Company is only
into oral anti‐diabetics.
Anti‐infectives therapy has been witnessing degrowth, as the Company did
not respond to downward price revisions undertaken by other players in the
industry.
Corrective Measures to Revive Growth in Anti‐Infective
Space The Company has taken the following measures to revive the growth in the anti‐
infective space.
Creation of a new division for the anti‐infectives business
Deploying an additional 200 dedicated MRs for anti‐infectives
Implementing incentive strategy based on growth and targets.
Our View: With more focus on the anti‐infectives space, the company will be able
to arrest the degrowth. Torrent Pharma will be launching 25‐30 products in the
domestic market, going ahead. Better focus on the laggard segments will enable
the company to grow by 12% and 14% in FY13E and FY14E, respectively.
Domestic formulations growth
2MFY13
Growth %
Torrent Total 14.4
ALPRAX 16.7
NIKORAN 30.2
DILZEM 8.7
DOMSTAL 2.2
NEBICARD 20.5
TOPCEF (30.8)
NEXPRO RD 44.8
AZULIX‐MF 14.1
NEXPRO 46.9
DROXYL (0.1)
Source: AIOCD

19
June 28, 2012
Torrent Pharma
US Market Torrent Pharma has not been able to scale up in certain products in the US market,
as it is the company’s policy not to sell below a certain margin. In certain key
products namely Isosorbide Mononitrate & Alfuzosin, the Company has been able
to reach a significant market share in very short time span.
Exhibit 2: Key Molecules in US
Molecule Name Market Share Launch in US
ZOLPIDEM TARTRATE 19.9%
CITALOPRAM HYDROBROMIDE 25.0%
PANTOPRAZOLE SODIUM 16.3%
DONEPEZIL HCL 16.2%
LOSARTAN/HYDROCHLOROTHI 18.0%
RISPERIDONE 4.9%
ISOSORBIDE MONONITRATE 25.0% 26/08/2011
ALFUZOSIN HCL 39.0% 22/07/2011
TOPIRAMATE 1.9%
LOSARTAN POTASSIUM 2.4%
PRAMIPEXOLE DI‐HCL 9.6%
LEVETIRACETAM 2.4%
LAMOTRIGINE 1.0%
VENLAFAXINE HCL 1.0%
CLOPIDOGREL BISULFATE 1.0% 18/05/2012
LEVOFLOXACIN 2.3% 5/8/2011
CARBAMAZEPINE 0.6%
SERTRALINE HCL 0.0%
OLANZAPINE 0.1% 28/10/2011
QUETIAPINE FUMARATE 0.0% 27/04/2012
AMLODIPINE BESYLATE 0.0% 13/04/2012
Source: Wolter Kluwerth, Company, Karvy Institutional Research
As Torrent Pharma has been witnessing pricing pressure, the Company is not
selling six products. It has 37 approvals (10 tentative) and is currently marketing
only 27 products. Around 60‐70% of the portfolio is backward‐integrated.
Brazil Market Torrent Pharma is the only company in domestic space having a substantial
presence in the Brazilian market. It markets over 30 products in Brazil, which falls
in CVS and CNS category. The company plans to launch 3‐4 products every year.
The approval timelines have now extended to 28‐30 months in this market.
The market share of products is in the range of 5‐50%. In 4‐5 molecules, the market
share is more than 50%. Torrent Pharma has 250 MRs in Brazil, while it plans to
add 50 more MRs this year. The cost per MR in Brazil is around US$70,000.
Currency depreciation for FY12 is seen at 10%. As Torrent Pharma has no
production unit outside India, the goods get transferred at transfer price. The
Brazilian generic‐generic market is growing at 60‐70%, while the branded generic
market is growing at 11%. The pricing of generic‐generic medicines is just 5‐10%
lower than branded generic at retail level, while the discount given to trade is 60‐
70%. Torrent Pharma’s Brazilian business is likely to grow at 15% going ahead, as
the Company has predominant presence in branded generic space.

20
June 28, 2012
Torrent Pharma
Hedging Policy to Boost EBITDA As 90% of the net exposure has been hedged at 53‐54, Torrent Pharma is expected
to benefit on the same to the tune of 1.5%.
Conservative Accounting Practices & Higher R&D Provisioning on account of
GDUFA Boost Confidence: Torrent Pharma has adopted the practice of shifting
from actual write‐off of sales return to accrual basis. Hence, the Company has
written off Rs. 654 mn for FY12 and FY11 on accrual basis. It has also provided for
additional R&D expenses on account of the new GDUFA filing in Q4FY12, which
makes Torrent Pharma as the only company to have done so.
Price Performance vis‐à‐vis BSE HC Index and Sensex Torrent’s stock price performance during Sep‐11 to Feb‐12 had remained below the
Sensex due to problems it was facing with regards to anti‐infectives segment in the
domestic formulations market. Torrent has outperformed the BSE HC Index
during July, 11‐Aug,11 and during April,12.
Exhibit 3: Absolute Perf. From Junʹ2011
Source: Bloomberg, Karvy Institutional Research
Exhibit 4: Relative Perf. From Junʹ2011
Source: Bloomberg, Karvy Institutional Research
The company has addressed the issues and growth in Q4FY12 in the domestic
business has shown an improvement which is the reason for the outperformance
from Mar‐12 to May‐12.
80
85
90
95
100
105
110
115
Jun‐11
Jul‐11
Aug‐11
Sep‐11
Oct‐11
Nov‐11
Dec‐11
Jan‐12
Feb‐12
Mar‐12
Apr‐12
May‐12
Sensex Torrent Pharma BSE HC Index
90
95
100
105
110
115
120
125
130
Jun‐11
Jul‐11
Aug‐11
Sep‐11
Oct‐11
Nov‐11
Dec‐11
Jan‐12
Feb‐12
Mar‐12
Apr‐12
May‐12
Sensex Torrent Pharma BSE HC Index

21
June 28, 2012
Torrent Pharma
Exhibit 5: Profit and Loss Statement Rs. mn FY10 FY11 FY12 FY13E FY14E
Net Sales 18,885 21,849 26,479 31,747 37,132
% growth 15.8 15.7 21.2 19.9 17.0
Raw Material 5,710 6,965 8,631 10,258 12,005
Staff 3,162 3,895 5,337 6,405 7,557
Others Exps 4,879 5,924 6,204 7,210 8,280
R&D expenses 1,202 1,388 1,780 2,035 2,381
Total Expenditure 14,952 18,173 21,953 25,906 30,224
EBITDA 3,932 3,677 4,527 5,840 6,908
EBITDA margin (%) 20.8 16.8 17.1 18.4 18.6
Other income 211 296 445 465 520
Interest 165 121 395 385 379
Depreciation 661 626 817 999 1,179
Provisions 0 0 654 0 0
Profit Before Tax 3,318 3,227 3,106 4,921 5,869
Tax 601 685 723 1,083 1,291
Effective tax rate (%) 18.1 21.2 23.3 22.0 22.0
Minorities interest 0 0 23 0 0
Net Profit 2,717 2,542 2,360 3,838 4,578
Extraordinaries ‐405 160 480 0 0
Reported Net Profit 2,312 2,702 2,840 3,838 4,578
Source: Company, Karvy Institutional Research
Exhibit 6: Balance Sheet Statement Rs. mn FY10 FY11 FY12 FY13E FY14E
Equity 423 423 423 423 423
Reserves 7,887 9,801 11,515 14,194 17,388
Networth 8,310 10,224 11,938 14,617 17,811
Short‐term Loans 1,255 996 1,381 1,660 1,942
Long‐term Loans 3,969 4,725 3,619 3,619 3,619
Total Loans 5,224 5,721 5,000 5,279 5,561
Minority Interest 0 16 35 35 35
Deferred tax Liability 499 480 514 514 514
Total Liabilities 14,033 16,440 17,488 20,445 23,922
Gross Block 8,129 9,643 11,911 14,429 16,661
Depreciation 2,718 3,287 4,105 5,103 6,282
Net Block 5,411 6,355 7,806 9,325 10,379
Capital work‐in‐progress 746 1,818 1,200 1,082 1,250
Capital Advances 352 368 150 150 150
Investments 1,412 1,460 375 375 375
Inventories 3,236 5,048 5,316 6,278 7,317
Debtors 2,982 3,404 5,228 6,284 7,351
Cash 3,883 4,788 7,326 8,718 10,443
Other Current assets 1,506 2,106 2,333 3,183 3,697
Total Current assets 11,607 15,346 20,203 24,462 28,809
Creditors 3,782 6,994 8,635 10,457 12,325
Other current liabilities 1,714 1,913 3,613 4,492 4,716
Total current liabilities 5,496 8,907 12,247 14,949 17,041
Net current assets 6,111 6,439 7,956 9,512 11,768
Total Assets 14,032 16,440 17,488 20,445 23,922
Source: Company, Karvy Institutional Research

22
June 28, 2012
Torrent Pharma
Exhibit 7: Cash Flow Statement
Rs. mn FY10 FY11 FY12 FY13E FY14E
EBIT 3,272 3,051 3,709 4,842 5,729
(Inc.)/Dec in working capital 350 576 1,022 ‐165 ‐530
Cash flow from operations 3,621 3,627 4,731 4,677 5,199
Other income 211 296 445 465 520
Depreciation 661 626 817 999 1,179
Interest paid (‐) ‐165 ‐121 ‐395 ‐385 ‐379
Deferred Tax Liability ‐85 ‐19 34 0 0
Tax paid (‐) ‐601 ‐685 ‐723 ‐1,083 ‐1,291
Dividends paid (‐) ‐676 ‐787 ‐836 ‐1,160 ‐1,383
Minority interest 0 0 ‐23 0 0
Extraordinaries ‐405 160 ‐174 0 0
Net cash from operations 2,562 3,098 3,877 3,512 3,844
Capital Expenditure (‐) ‐1,524 ‐2,657 ‐1,800 ‐2,400 ‐2,400
Free Cash Flow 1,038 441 2,077 1,112 1,444
Inc./(Dec.) in short‐term borrowing 499 ‐259 386 279 282
Inc./(dec.) in long‐term borrowing ‐102 756 ‐1,106 0 0
Inc./(dec.) in borrowings 398 497 ‐721 279 282
(Inc.)/Dec. in Investments ‐17 ‐48 1,085 0 0
Changes in minority interest 0 16 19 0 0
Cash from Financial Activities 381 464 383 279 282
Others 164 0 78 0 0
Opening cash 2,300 3,883 4,788 7,326 8,718
Closing cash 3,883 4,788 7,326 8,718 10,443
Change in Cash 1,583 905 2,538 1,391 1,726
Source: Company, Karvy Institutional Research
Exhibit 8: Key ratios
FY10 FY11 FY12 FY2013E FY14E
Price/Sales 2.7 2.3 1.9 1.6 1.3
Price/ BV 6.0 4.9 4.2 3.4 2.8
EV/ EBDITA 12.7 13.5 10.5 7.9 6.5
ROE 31.2 29.2 25.6 28.9 28.2
ROCE 26.8 22.0 20.6 28.0 28.2
Source: Company, Karvy Institutional Research

Institutional Equities Team Rangachari Muralikrishnan Head – Institutional Equities +91‐22 61844301 [email protected]
Shridhar Iyer Head ‐ Institutional Sales +91‐22 61844302 [email protected]
K. Anant Rao Head ‐ Sales‐Trading & Derivatives +91‐22 61844303 [email protected]
Uday Raval Karvy Inc. USA (212) 2674334 [email protected]
INSTITUTIONAL RESEARCH
Analysts Industry / Sector Desk Phone Email ID
Dwaipayan Poddar Derivatives/Technical Research +91‐22 61844372 [email protected]
Hatim Broachwala Banking +91‐22 61844329
Jagadishwar Pasunoori MidCap +91‐40‐44857912 [email protected]
Madhavi Arora Economy +91‐22 61844320 [email protected]
Manoj Kumar Manish Derivatives Research +91‐22 61844327 [email protected]
Maruti Kadam Auto & Auto Ancillaries +91‐22 61844326
Mitul Shah Auto & Auto Ancillaries +91‐22 61844312 [email protected]
Naushil Shah Technology +91‐22 61844314 [email protected]
Nishith Sanghvi Pharmaceuticals +91‐22 61844325 [email protected]
Naveen Trivedi FMCG +91‐22‐61844316 [email protected]
Pallav Agarwal Metals & Mining +91‐22 61844317 [email protected]
Paresh Jain BFSI +91‐22 61844324 [email protected]
Parikshit Kandpal Infra / Real Estate +91‐22 61844311 [email protected]
Rahul Sharma Pharmaceuticals +91‐22 61844310 [email protected]
Rahul Singh MidCap +91‐40‐44857912 [email protected]
Rajesh Kumar Ravi Cement & Logistics +91‐22 61844313 [email protected]
Rupesh Sankhe Power/Capital Goods +91‐22 61844315 [email protected]
Sameer Pardikar Telecom, Media and Oil & Gas +91‐22 61844323 [email protected]
Vinay Nair Oil & Gas +91‐22 61844319 [email protected]
INSTITUTIONAL SALES
Dinesh Bajaj Sales +91‐22 61844341 [email protected]
Dipesh Jain Sales +91‐22 61844342 [email protected]
R. Sriram Sales +91‐22 61844340 [email protected]
Sushant Kumar Sales +91‐22 61844344 [email protected]
Shabbir Dahodwala Sales (USA) +1‐212‐2674334 [email protected]
Tejash Gandhi Sales +91‐22 61844345 [email protected]
INSTITUTIONAL SALES TRADING & DEALING
Bhavesh Gandhi Institutional Dealer +91‐22 61844368 /69 [email protected]
Prashant Oza Institutional Dealer +91‐22 61844370 /71 [email protected]
Parag Shah Sales Trader +91‐22 61844364 /65 [email protected]
Sriram Jagdish Sales Trader +91‐22 61844366 /67 [email protected]
PRODUCTION
Asim Kumar Mohapatra Editor +91‐22 61844318 [email protected]
Vishal Randive Database +91‐22 61844321 [email protected]
Vijayalaxmi Moolya Production +91‐22 61844328 [email protected]
For further enquiries please contact:
Tel: +91‐22‐6184 4300
Disclosures Appendix
Analyst certification
The following analyst(s), who is (are) primarily responsible for this report, certify (ies) that the views expressed herein
accurately reflect his (their) personal view(s) about the subject security (ies) and issuer(s) and that no part of his (their)
compensation was, is or will be directly or indirectly related to the specific recommendation(s) or views contained in this
research report.
Disclaimer
The information and views presented in this report are prepared by Karvy Stock Broking Limited. The information
contained herein is based on our analysis and upon sources that we consider reliable. We, however, do not vouch for the
accuracy or the completeness thereof. This material is for personal information and we are not responsible for any loss
incurred based upon it. The investments discussed or recommended in this report may not be suitable for all investors.
Investors must make their own investment decisions based on their specific investment objectives and financial position and
using such independent advice, as they believe necessary. While acting upon any information or analysis mentioned in this
report, investors may please note that neither Karvy nor Karvy Stock Broking nor any person connected with any associate
companies of Karvy accepts any liability arising from the use of this information and views mentioned in this document.
The author, directors and other employees of Karvy and its affiliates may hold long or short positions in the above
mentioned companies from time to time. Every employee of Karvy and its associate companies are required to disclose their
individual stock holdings and details of trades, if any, that they undertake. The team rendering corporate analysis and
investment recommendations are restricted in purchasing/selling of shares or other securities till such a time this
recommendation has either been displayed or has been forwarded to clients of Karvy. All employees are further restricted to
place orders only through Karvy Stock Broking Ltd. This report is intended for a restricted audience and we are not
soliciting any action based on it. Neither the information nor any opinion expressed herein constitutes an offer or an
invitation to make an offer, to buy or sell any securities, or any options, futures nor other derivatives related to such
securities.
Karvy Stock Broking Limited Institutional Equities
Office No. 702, 7th Floor, Hallmark Business Plaza, Opp.‐Gurunanak Hospital, Mumbai 400 051
Regd Off : 46, Road No 4, Street No 1, Banjara Hills, Hyderabad – 500 034.
Karvy Stock Broking Research is also available on: Bloomberg ‐ KRVY <GO>, Thomson Publisher & Reuters.
Stock Ratings Absolute ReturnsBuy : > 15%Hold : 5‐15%Sell : < 5%


