
KENTUCKY DAIRY PRODUCERS SURVEY
RESULTS
Richard C. Maurer and Andrew J. Fast
University of Kentucky College of Agriculture
Department of Community and Leadership Development
Study sponsored by Kentucky Department of Agriculture, Kentucky Dairy Development Council, and University of Kentucky College of Agriculture
July 2007

1
EXECUTIVE SUMMARY Results from the Survey of Kentucky Dairy Producers
Richard C. Maurer and Andrew J. Fast
University of Kentucky
July 2007
THE STUDY In the spring of 2007, the Kentucky Department of Agriculture, The Kentucky Dairy Development Council, and the University of Kentucky College of Agriculture sponsored a survey of dairy producers in an attempt to assess how information is disseminated, services utilized, government programs, current operations and establish a demographic breakdown of current producers. Kentucky Dairy Producer Characteristics Nearly 600 surveys were collected from producers in 74 different counties. Of those responding 20% are between 20 to 39 years of age; 54% are 40 to 59; 24% are 60 years of age and older. The level of education was reported as follows: 29% less than High School completion; 42% graduated from High School; 14% completed some College; and 25% graduated College or Graduate School. 60% or producers described their farm as a “sole-ownership” practice and 36% said it was a family based partnership. The producers predominantly expressed their future plans were “uncertain” (38%); 23% indicated “no change”; 22% plan to “expand”; 11% said they would “retire”; and 6% will likely “disperse.” 12% indicated they plan on transitioning their farm ownership to another family member in the next 5 years. Producer Operations Twenty percent declared they relied on additional farm labor. Seventy percent stated one or more family members worked on the farm; 39% listed one or more local hired laborers; and 8% reported having one or more migrant laborers working on their farm. Nine and a half percent of producers reported milking 126 or more cows; 11.1% owned 31 or more dry cows; and 19% had more than 75 replacement heifers on their farm. When asked about access to computer and internet related sources of information 58% have a computer at their home/farm office, and 56% have internet access from their home or farm. The four highest selected sources for income other than dairy were: tobacco (33%), hay 31%), beef (31%), and grains (27%). Fifty-two percent reported that off-farm earnings were a portion of their household income. Important Issues, Services and Government Operations Producers were asked about issues and how they received valuable information, the five sources most frequently selected as most important were: dairy magazines/newspapers, other dairy producers, dairy field representatives, cooperative extension, and milk haulers. The three services most often utilized by producers were: nutritionist, herd health programs, and artificial breeding. Producers responded: they benefited from Phase I tobacco county program dollars (67%); would consider utilizing low interest loans to expand/improve (61%); and they attend local dairy producer meetings/events (61%). The two functions of the Kentucky Milk Safety Branch most widely reported were explanations on your farm inspection sheet being clear and understandable (94%), and being basically familiar with the Pasteurized Milk Ordinance (46%). The two primary objectives of the Federal Milk Market Order most commonly known were that the Federal Milk Marketing Orders operate testing laboratories to test various components (42%)
2
and they have a reasonably good understanding of the pricing system and how different “classes” of milk prices are determined (31%). UK Regulatory Services
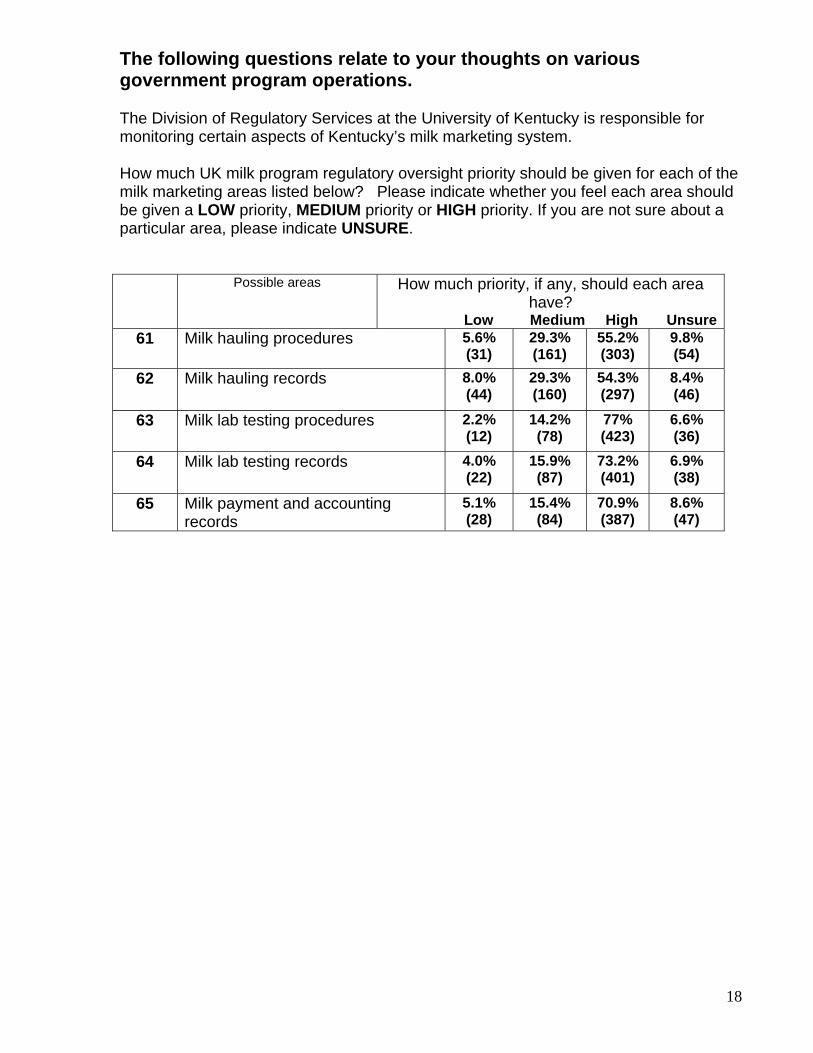
Over half of the participants ranked each of the following “high priority” with regard to the UK division of regulatory services: milk lab testing procedures (77%); milk lab testing records (73%); and milk payment and accounting records (71%); milk hauling procedures (55%); and milk hauling records (54%). Producers were most aware the UK regulatory services for herd bulk tank testing (50%) and UK personnel availability to reconstruct calibration charts at no charge (47%). SUMMARY The farmers reporting represented a very large and diverse group. A wide variety of ages, education, production levels, and interests were documented and several issues and programs were given extremely significant rates of response. This sample is the result of three reminder mailings accounting for over 50% of the original mailing. These findings suggest that the producers are eager to explore new methods and support additional research to hopefully improve the condition of the dairy industry in Kentucky. Among the key issues is milk pricing, and more UK and government supported programming which is widely believed to have the potential for positive impacts.
3
Kentucky Dairy Producers Survey Results
Richard C. Maurer and Andrew J. Fast University of Kentucky
July 2007
INTRODUCTION In the spring of 2007, The Kentucky Department of Agriculture, The Kentucky Dairy Development Council, and the University of Kentucky College of Agriculture sponsored a survey of dairy producers in an attempt to assess how information is received, how producer services are utilized, opinions about government programs, status of current operations, and the demographic breakdown of current producers. Consultation on survey design and methods and survey data analysis were provided by the Department of Community and Leadership Development at the University of Kentucky. 575 completed surveys were returned during the study, for a response rate of 51 percent. Respondents were from 74 counties in Kentucky. Survey data were analyzed at the University of Kentucky, and the reports were written by personnel at the University and presented to the Kentucky Department of Agriculture and the Kentucky Dairy Development Council. The following summarizes the responses to the survey questions. The actual response frequencies to each question are included in Appendix A. In addition to response frequencies, comparisons to responses based on number of cows milked on the farm and age of the producer were also analyzed, and important differences are reported. SURVEY RESULTS Basic questions on overall dairy producer issues Producers rated the sources they felt were either very effective, effective, or not very effective. The top 3 sources ranked (in order of highest percentage) “very effective” were dairy magazines/newspapers, other dairy producers, and dairy field representatives (27.8-15.1%). The 3 sources most responded to as “effective” were other dairy producers, dairy magazines/newspapers, and cooperative extension (62.9-54.4%). The 3 sources most often selected as “not very effective” were radio and television, internet sources (15% skipped rating this source altogether), and milk haulers (73.6-35.8%). The top 5 listed as “most important” were dairy magazines/newspapers, other dairy producers, dairy field representatives, cooperative extension, and milk haulers. Dairy operation utilizing the following services The producers were asked to answer if they utilized several different services in their dairy operation. The top 3 services they reported using were forage testing, back-up power generators, and artificial breeding (70.9-57.3%). The 3 services least used by producers were rBST (Posilac), custom crop harvesting, and financial analysis programs (92.8-86.1%). Of the 78.6% respondents who ranked one service “most important” the top 5 services were nutritionist and herd health program (tied), artificial breeding, forage testing, and production testing (20.1- 8.8%). Those currently milking more than 50 cows responded they used significantly more of the services than those milking 50 or fewer cows. Among the services used more frequently by
4
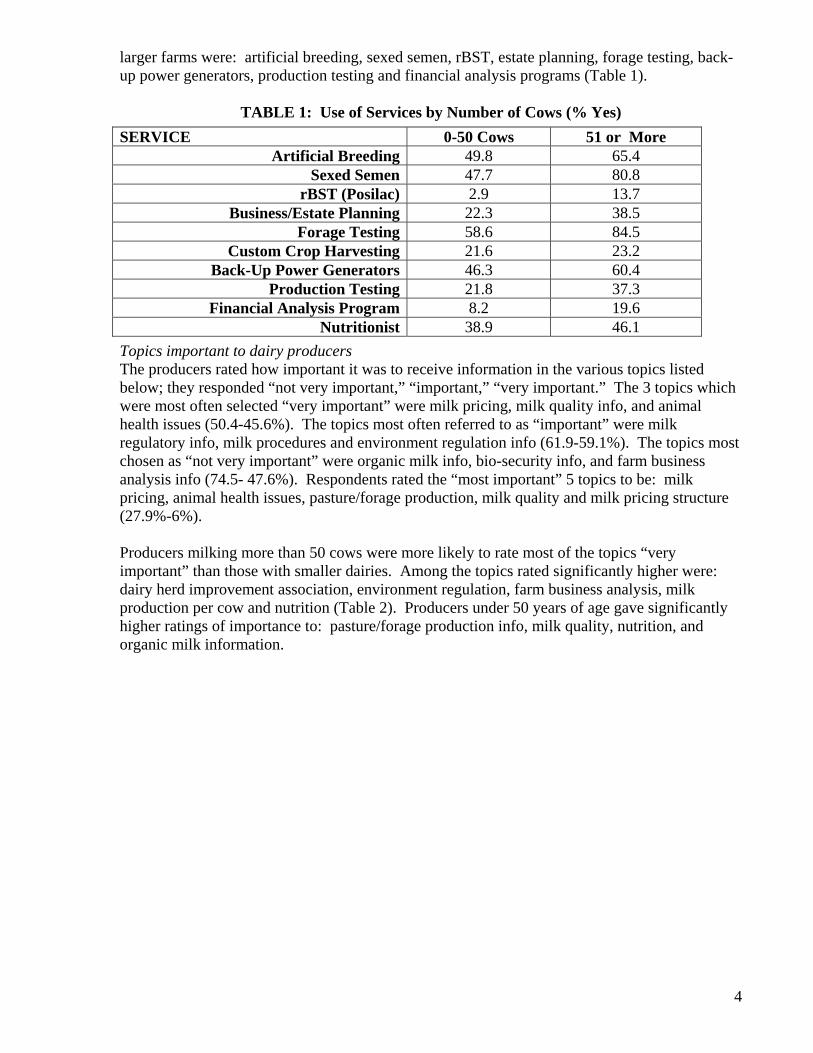
larger farms were: artificial breeding, sexed semen, rBST, estate planning, forage testing, back-up power generators, production testing and financial analysis programs (Table 1).
TABLE 1: Use of Services by Number of Cows (% Yes)
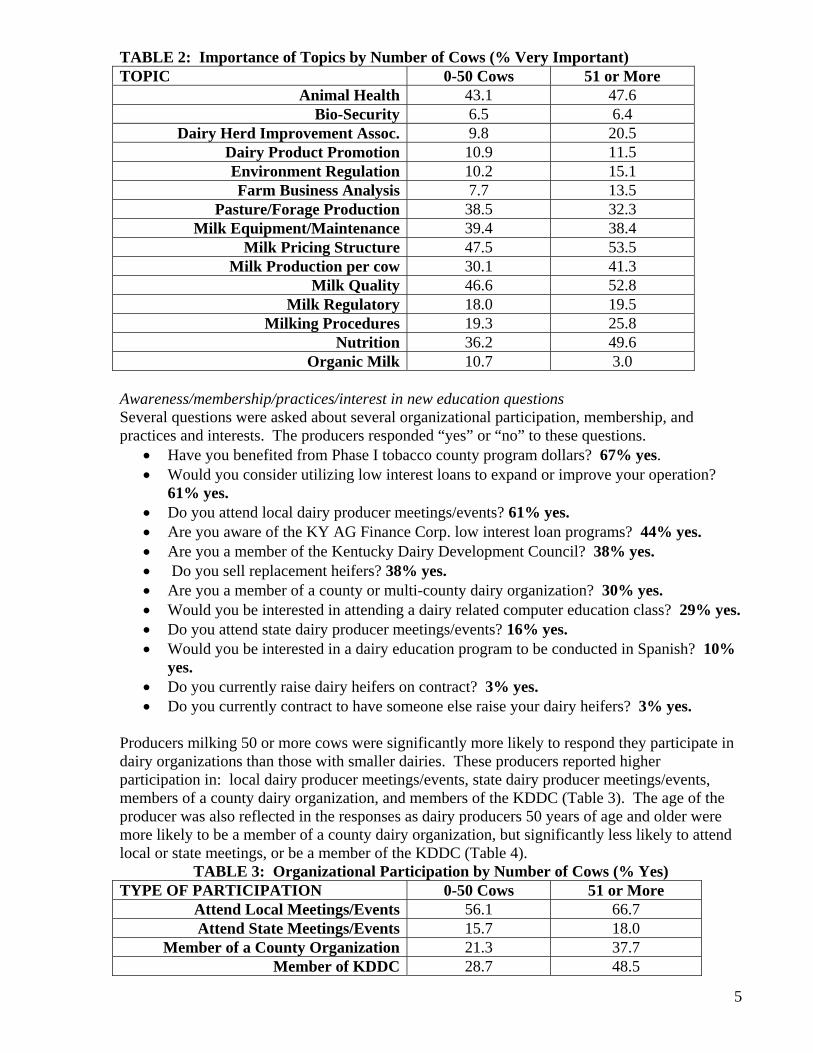
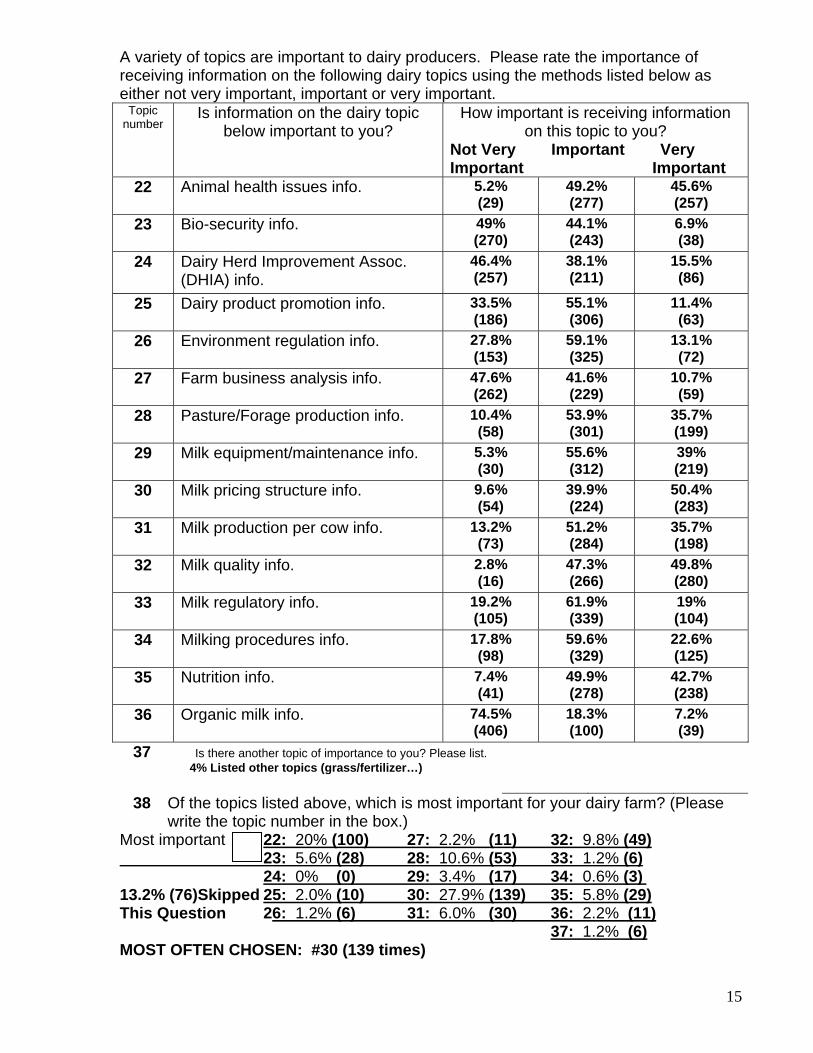
Topics important to dairy producers The producers rated how important it was to receive information in the various topics listed below; they responded “not very important,” “important,” “very important.” The 3 topics which were most often selected “very important” were milk pricing, milk quality info, and animal health issues (50.4-45.6%). The topics most often referred to as “important” were milk regulatory info, milk procedures and environment regulation info (61.9-59.1%). The topics most chosen as “not very important” were organic milk info, bio-security info, and farm business analysis info (74.5- 47.6%). Respondents rated the “most important” 5 topics to be: milk pricing, animal health issues, pasture/forage production, milk quality and milk pricing structure (27.9%-6%). Producers milking more than 50 cows were more likely to rate most of the topics “very important” than those with smaller dairies. Among the topics rated significantly higher were: dairy herd improvement association, environment regulation, farm business analysis, milk production per cow and nutrition (Table 2). Producers under 50 years of age gave significantly higher ratings of importance to: pasture/forage production info, milk quality, nutrition, and organic milk information.
SERVICE 0-50 Cows 51 or More Artificial Breeding 49.8 65.4
Sexed Semen 47.7 80.8 rBST (Posilac) 2.9 13.7
Business/Estate Planning 22.3 38.5 Forage Testing 58.6 84.5
Custom Crop Harvesting 21.6 23.2 Back-Up Power Generators 46.3 60.4
Production Testing 21.8 37.3 Financial Analysis Program 8.2 19.6
Nutritionist 38.9 46.1
5
TABLE 2: Importance of Topics by Number of Cows (% Very Important) TOPIC 0-50 Cows 51 or More
Animal Health 43.1 47.6 Bio-Security 6.5 6.4
Dairy Herd Improvement Assoc. 9.8 20.5 Dairy Product Promotion 10.9 11.5 Environment Regulation 10.2 15.1 Farm Business Analysis 7.7 13.5
Pasture/Forage Production 38.5 32.3 Milk Equipment/Maintenance 39.4 38.4
Milk Pricing Structure 47.5 53.5 Milk Production per cow 30.1 41.3
Milk Quality 46.6 52.8 Milk Regulatory 18.0 19.5
Milking Procedures 19.3 25.8 Nutrition 36.2 49.6
Organic Milk 10.7 3.0 Awareness/membership/practices/interest in new education questions Several questions were asked about several organizational participation, membership, and practices and interests. The producers responded “yes” or “no” to these questions.
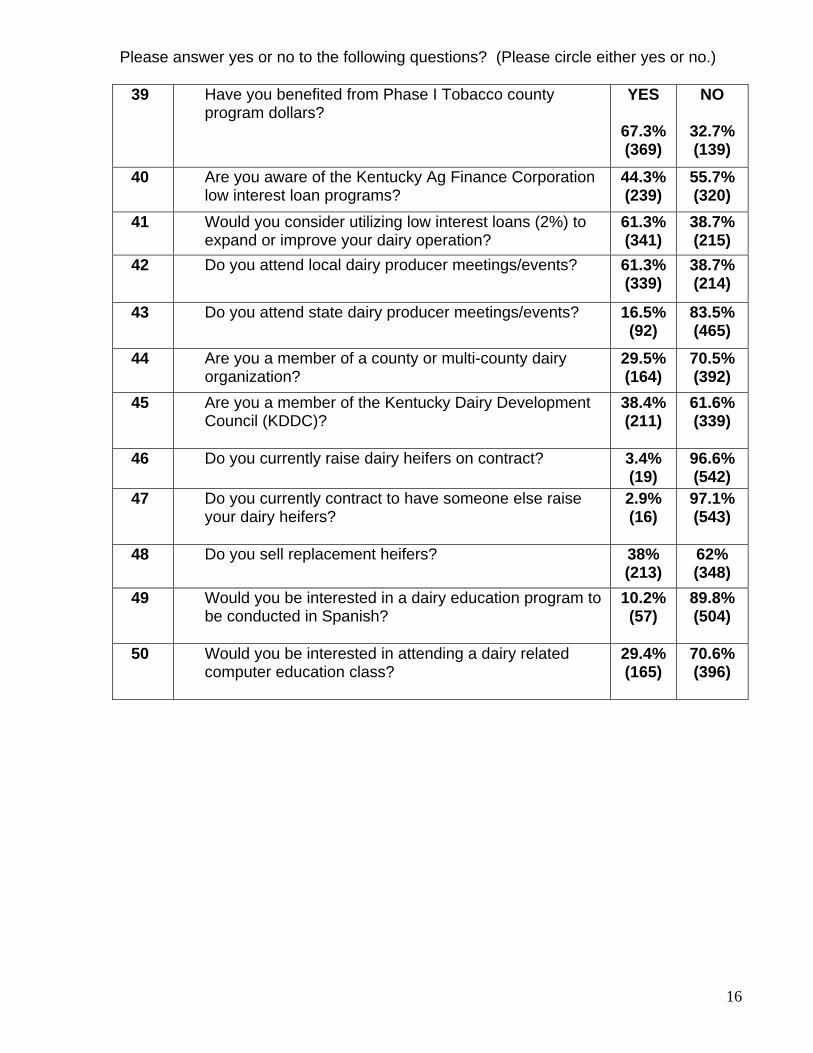
• Have you benefited from Phase I tobacco county program dollars? 67% yes. • Would you consider utilizing low interest loans to expand or improve your operation?
61% yes. • Do you attend local dairy producer meetings/events? 61% yes. • Are you aware of the KY AG Finance Corp. low interest loan programs? 44% yes. • Are you a member of the Kentucky Dairy Development Council? 38% yes. • Do you sell replacement heifers? 38% yes. • Are you a member of a county or multi-county dairy organization? 30% yes. • Would you be interested in attending a dairy related computer education class? 29% yes. • Do you attend state dairy producer meetings/events? 16% yes. • Would you be interested in a dairy education program to be conducted in Spanish? 10%
yes. • Do you currently raise dairy heifers on contract? 3% yes. • Do you currently contract to have someone else raise your dairy heifers? 3% yes.
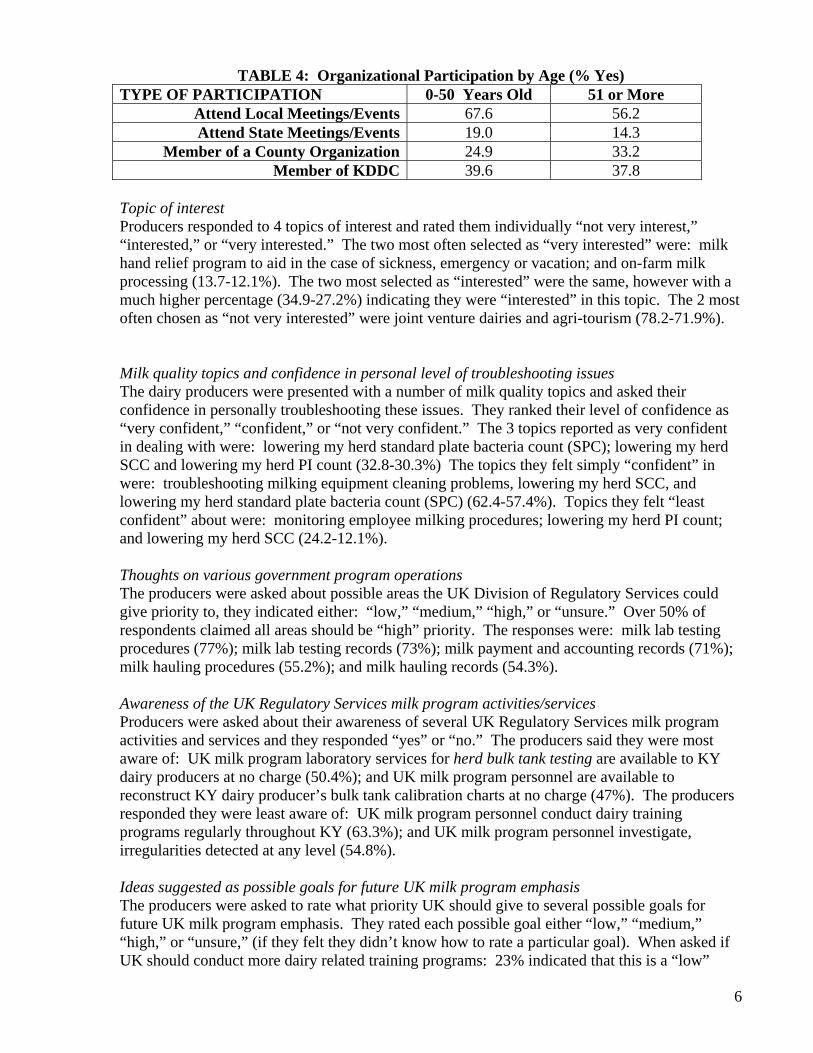
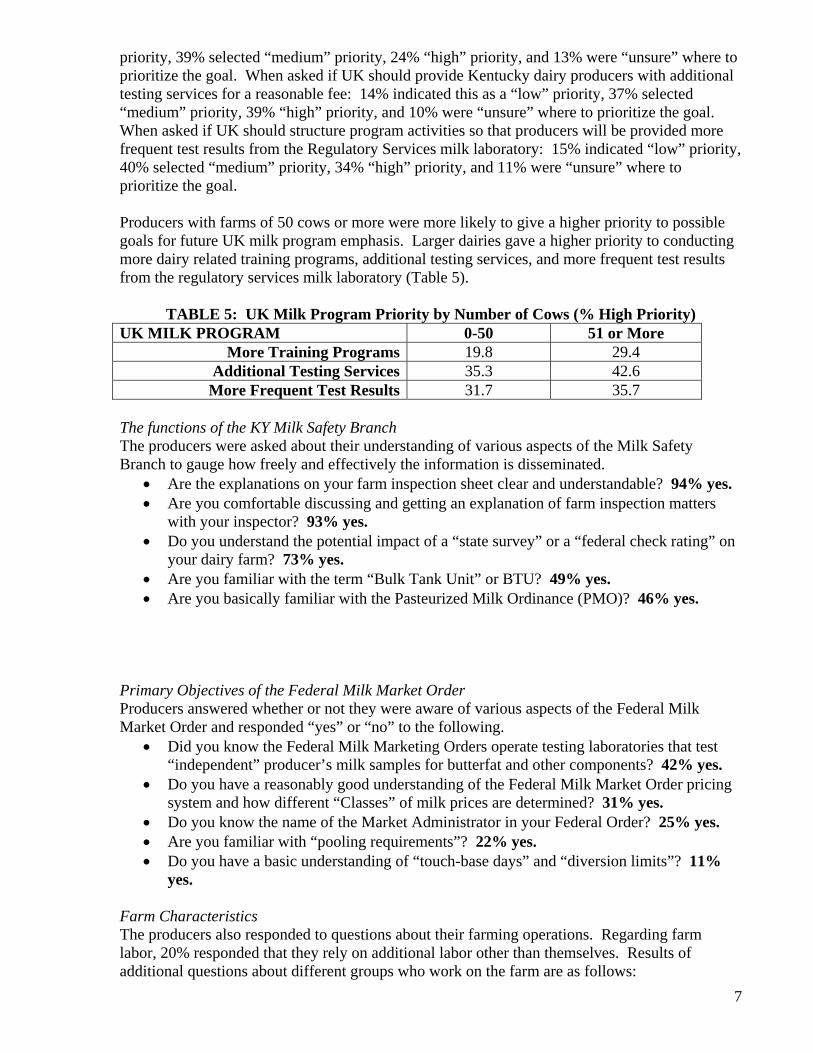
Producers milking 50 or more cows were significantly more likely to respond they participate in dairy organizations than those with smaller dairies. These producers reported higher participation in: local dairy producer meetings/events, state dairy producer meetings/events, members of a county dairy organization, and members of the KDDC (Table 3). The age of the producer was also reflected in the responses as dairy producers 50 years of age and older were more likely to be a member of a county dairy organization, but significantly less likely to attend local or state meetings, or be a member of the KDDC (Table 4).
TABLE 3: Organizational Participation by Number of Cows (% Yes) TYPE OF PARTICIPATION 0-50 Cows 51 or More
Attend Local Meetings/Events 56.1 66.7 Attend State Meetings/Events 15.7 18.0
Member of a County Organization 21.3 37.7 Member of KDDC 28.7 48.5
6
TABLE 4: Organizational Participation by Age (% Yes)
TYPE OF PARTICIPATION 0-50 Years Old 51 or More Attend Local Meetings/Events 67.6 56.2 Attend State Meetings/Events 19.0 14.3
Member of a County Organization 24.9 33.2 Member of KDDC 39.6 37.8
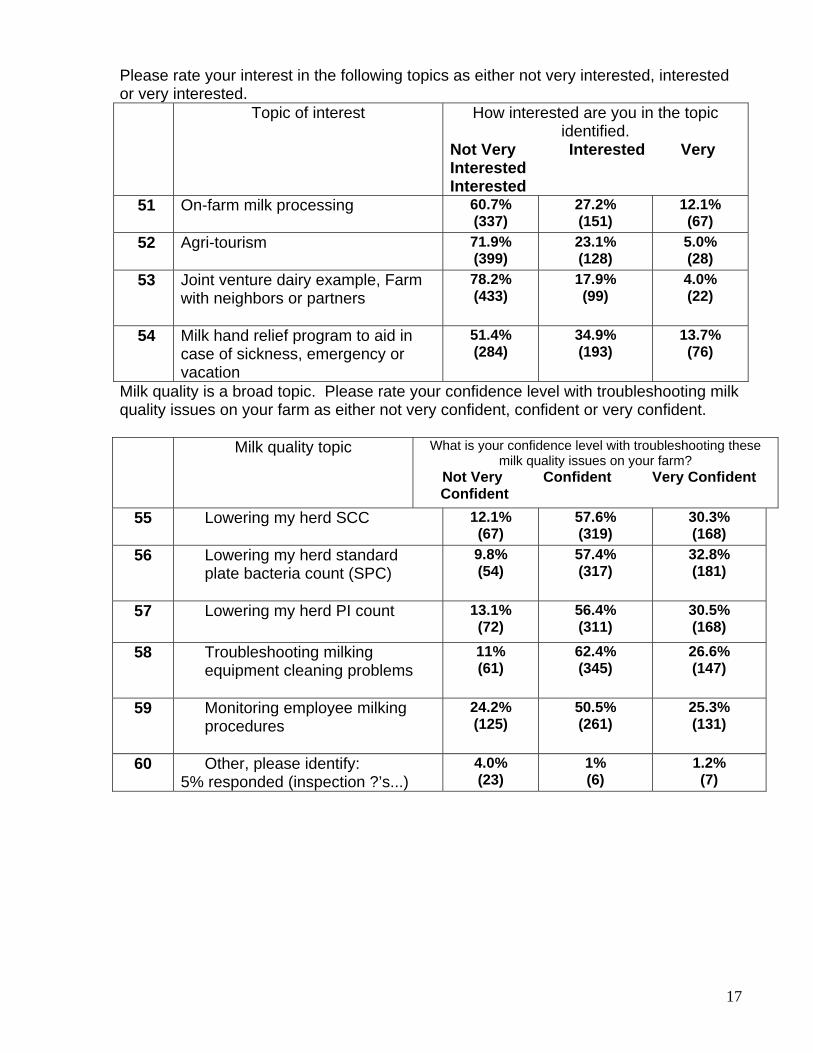
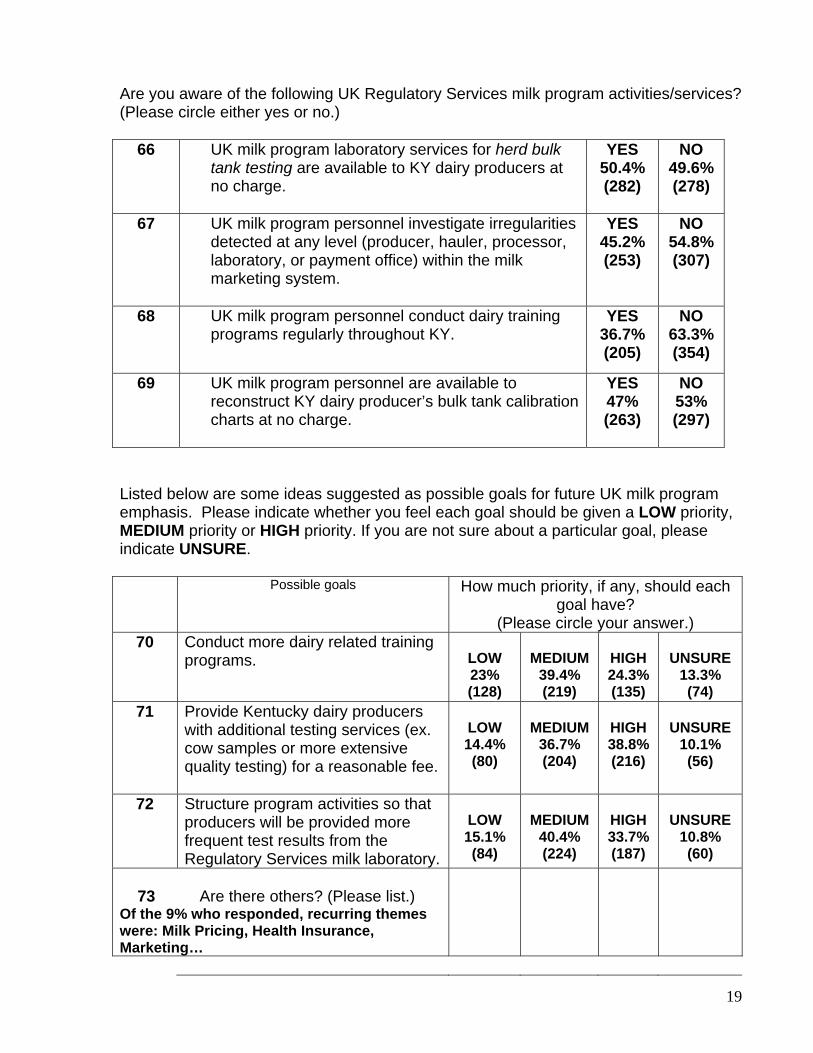
Topic of interest Producers responded to 4 topics of interest and rated them individually “not very interest,” “interested,” or “very interested.” The two most often selected as “very interested” were: milk hand relief program to aid in the case of sickness, emergency or vacation; and on-farm milk processing (13.7-12.1%). The two most selected as “interested” were the same, however with a much higher percentage (34.9-27.2%) indicating they were “interested” in this topic. The 2 most often chosen as “not very interested” were joint venture dairies and agri-tourism (78.2-71.9%). Milk quality topics and confidence in personal level of troubleshooting issues The dairy producers were presented with a number of milk quality topics and asked their confidence in personally troubleshooting these issues. They ranked their level of confidence as “very confident,” “confident,” or “not very confident.” The 3 topics reported as very confident in dealing with were: lowering my herd standard plate bacteria count (SPC); lowering my herd SCC and lowering my herd PI count (32.8-30.3%) The topics they felt simply “confident” in were: troubleshooting milking equipment cleaning problems, lowering my herd SCC, and lowering my herd standard plate bacteria count (SPC) (62.4-57.4%). Topics they felt “least confident” about were: monitoring employee milking procedures; lowering my herd PI count; and lowering my herd SCC (24.2-12.1%). Thoughts on various government program operations The producers were asked about possible areas the UK Division of Regulatory Services could give priority to, they indicated either: “low,” “medium,” “high,” or “unsure.” Over 50% of respondents claimed all areas should be “high” priority. The responses were: milk lab testing procedures (77%); milk lab testing records (73%); milk payment and accounting records (71%); milk hauling procedures (55.2%); and milk hauling records (54.3%). Awareness of the UK Regulatory Services milk program activities/services Producers were asked about their awareness of several UK Regulatory Services milk program activities and services and they responded “yes” or “no.” The producers said they were most aware of: UK milk program laboratory services for herd bulk tank testing are available to KY dairy producers at no charge (50.4%); and UK milk program personnel are available to reconstruct KY dairy producer’s bulk tank calibration charts at no charge (47%). The producers responded they were least aware of: UK milk program personnel conduct dairy training programs regularly throughout KY (63.3%); and UK milk program personnel investigate, irregularities detected at any level (54.8%). Ideas suggested as possible goals for future UK milk program emphasis The producers were asked to rate what priority UK should give to several possible goals for future UK milk program emphasis. They rated each possible goal either “low,” “medium,” “high,” or “unsure,” (if they felt they didn’t know how to rate a particular goal). When asked if UK should conduct more dairy related training programs: 23% indicated that this is a “low”
7
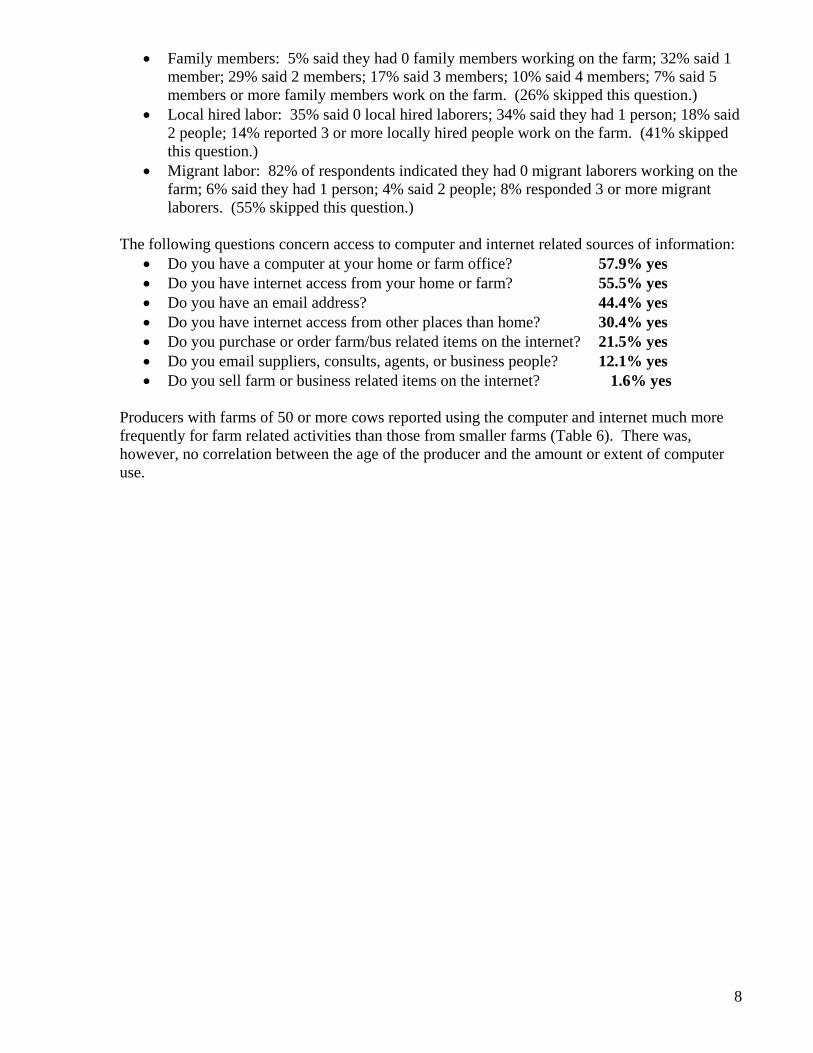
priority, 39% selected “medium” priority, 24% “high” priority, and 13% were “unsure” where to prioritize the goal. When asked if UK should provide Kentucky dairy producers with additional testing services for a reasonable fee: 14% indicated this as a “low” priority, 37% selected “medium” priority, 39% “high” priority, and 10% were “unsure” where to prioritize the goal. When asked if UK should structure program activities so that producers will be provided more frequent test results from the Regulatory Services milk laboratory: 15% indicated “low” priority, 40% selected “medium” priority, 34% “high” priority, and 11% were “unsure” where to prioritize the goal. Producers with farms of 50 cows or more were more likely to give a higher priority to possible goals for future UK milk program emphasis. Larger dairies gave a higher priority to conducting more dairy related training programs, additional testing services, and more frequent test results from the regulatory services milk laboratory (Table 5).
TABLE 5: UK Milk Program Priority by Number of Cows (% High Priority) UK MILK PROGRAM 0-50 51 or More
More Training Programs 19.8 29.4 Additional Testing Services 35.3 42.6 More Frequent Test Results 31.7 35.7
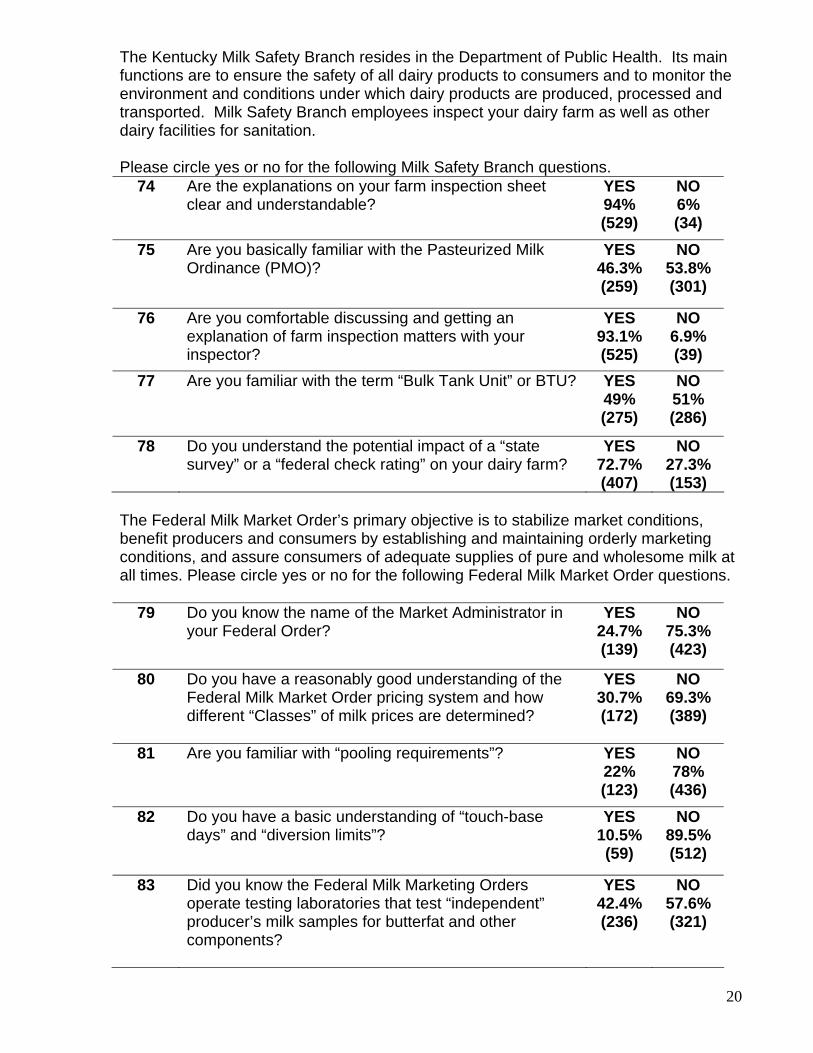
The functions of the KY Milk Safety Branch The producers were asked about their understanding of various aspects of the Milk Safety Branch to gauge how freely and effectively the information is disseminated.
• Are the explanations on your farm inspection sheet clear and understandable? 94% yes. • Are you comfortable discussing and getting an explanation of farm inspection matters
with your inspector? 93% yes. • Do you understand the potential impact of a “state survey” or a “federal check rating” on
your dairy farm? 73% yes. • Are you familiar with the term “Bulk Tank Unit” or BTU? 49% yes. • Are you basically familiar with the Pasteurized Milk Ordinance (PMO)? 46% yes.
Primary Objectives of the Federal Milk Market Order Producers answered whether or not they were aware of various aspects of the Federal Milk Market Order and responded “yes” or “no” to the following.
• Did you know the Federal Milk Marketing Orders operate testing laboratories that test “independent” producer’s milk samples for butterfat and other components? 42% yes.
• Do you have a reasonably good understanding of the Federal Milk Market Order pricing system and how different “Classes” of milk prices are determined? 31% yes.
• Do you know the name of the Market Administrator in your Federal Order? 25% yes. • Are you familiar with “pooling requirements”? 22% yes. • Do you have a basic understanding of “touch-base days” and “diversion limits”? 11%
yes.
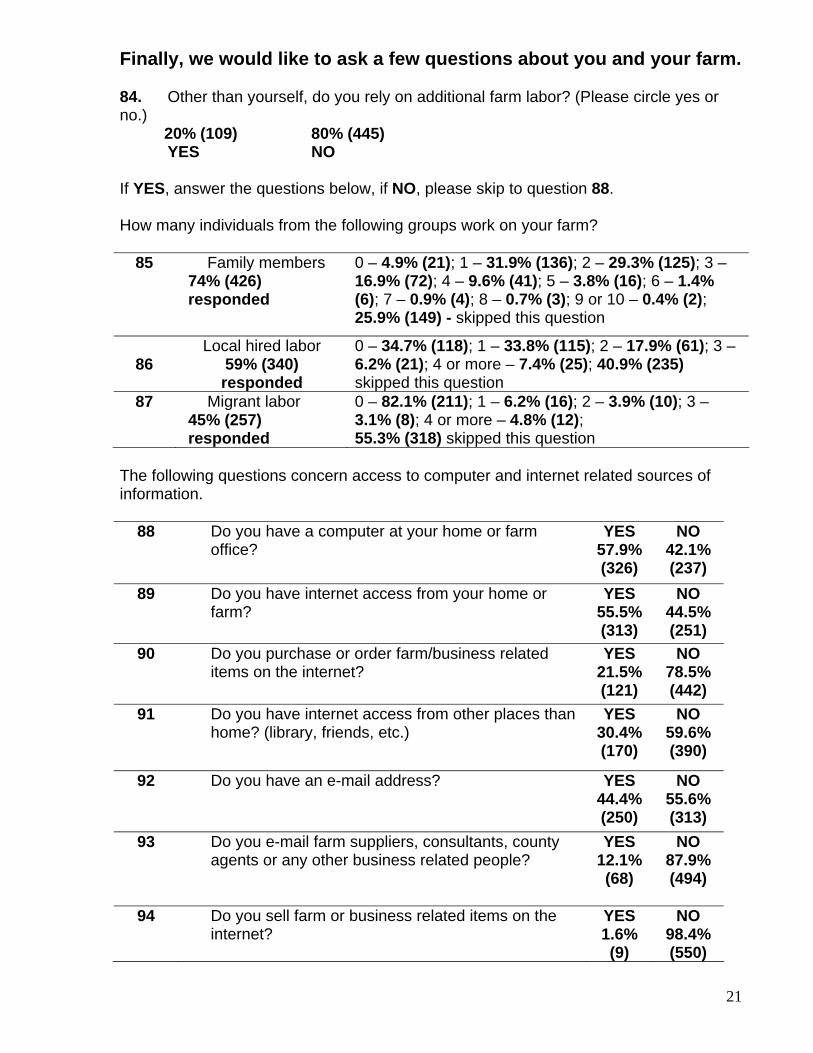
Farm Characteristics The producers also responded to questions about their farming operations. Regarding farm labor, 20% responded that they rely on additional labor other than themselves. Results of additional questions about different groups who work on the farm are as follows:
8
• Family members: 5% said they had 0 family members working on the farm; 32% said 1 member; 29% said 2 members; 17% said 3 members; 10% said 4 members; 7% said 5 members or more family members work on the farm. (26% skipped this question.)
• Local hired labor: 35% said 0 local hired laborers; 34% said they had 1 person; 18% said 2 people; 14% reported 3 or more locally hired people work on the farm. (41% skipped this question.)
• Migrant labor: 82% of respondents indicated they had 0 migrant laborers working on the farm; 6% said they had 1 person; 4% said 2 people; 8% responded 3 or more migrant laborers. (55% skipped this question.)
The following questions concern access to computer and internet related sources of information:
• Do you have a computer at your home or farm office? 57.9% yes • Do you have internet access from your home or farm? 55.5% yes • Do you have an email address? 44.4% yes • Do you have internet access from other places than home? 30.4% yes • Do you purchase or order farm/bus related items on the internet? 21.5% yes • Do you email suppliers, consults, agents, or business people? 12.1% yes • Do you sell farm or business related items on the internet? 1.6% yes
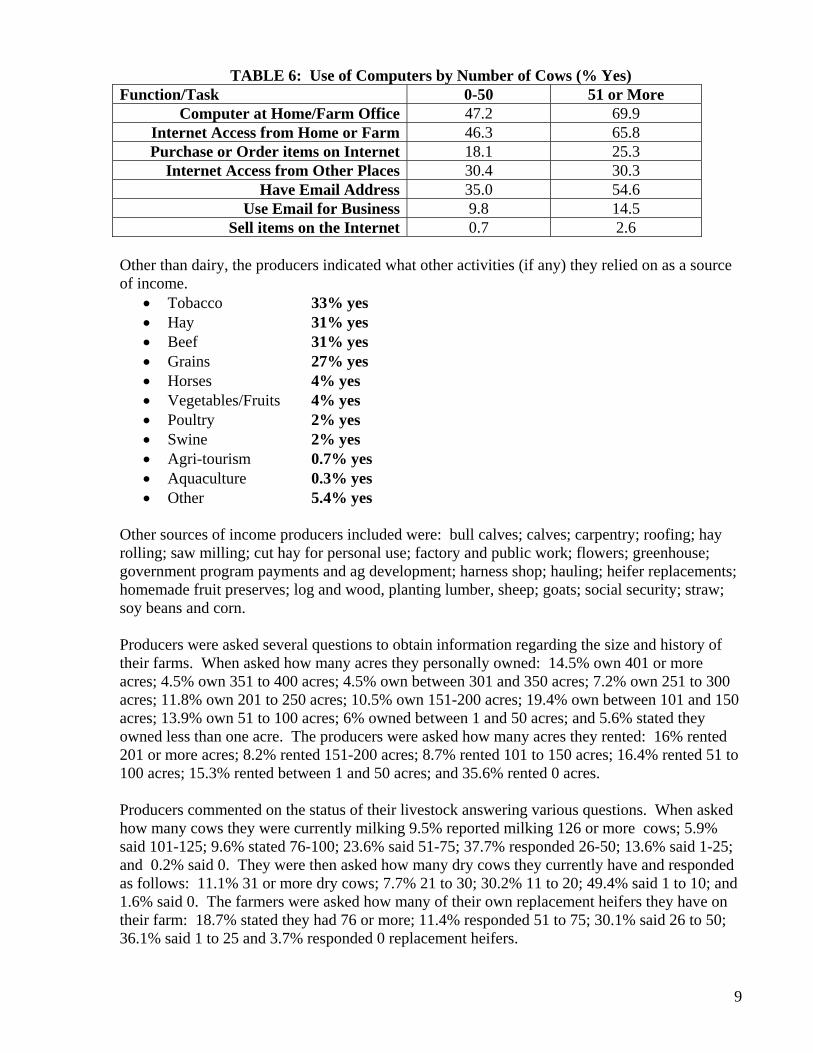
Producers with farms of 50 or more cows reported using the computer and internet much more frequently for farm related activities than those from smaller farms (Table 6). There was, however, no correlation between the age of the producer and the amount or extent of computer use.
9
TABLE 6: Use of Computers by Number of Cows (% Yes)
Function/Task 0-50 51 or More Computer at Home/Farm Office 47.2 69.9
Internet Access from Home or Farm 46.3 65.8 Purchase or Order items on Internet 18.1 25.3
Internet Access from Other Places 30.4 30.3 Have Email Address 35.0 54.6
Use Email for Business 9.8 14.5 Sell items on the Internet 0.7 2.6
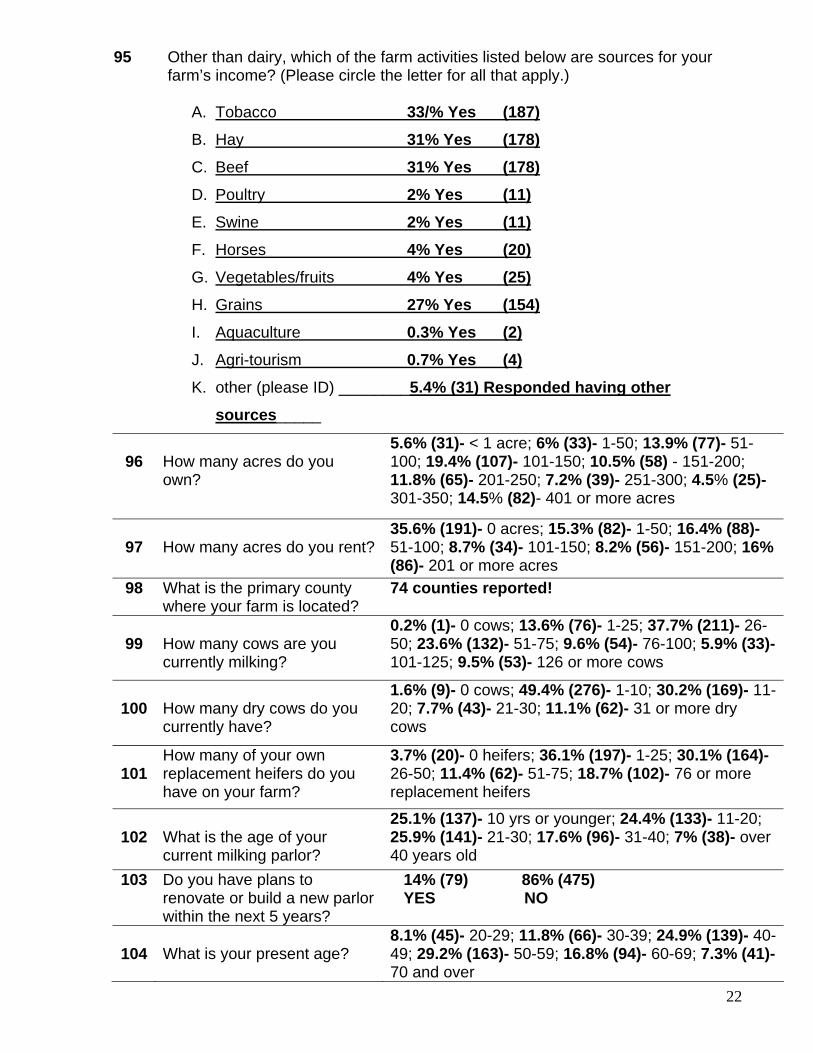
Other than dairy, the producers indicated what other activities (if any) they relied on as a source of income.
• Tobacco 33% yes • Hay 31% yes • Beef 31% yes • Grains 27% yes • Horses 4% yes • Vegetables/Fruits 4% yes • Poultry 2% yes • Swine 2% yes • Agri-tourism 0.7% yes • Aquaculture 0.3% yes • Other 5.4% yes
Other sources of income producers included were: bull calves; calves; carpentry; roofing; hay rolling; saw milling; cut hay for personal use; factory and public work; flowers; greenhouse; government program payments and ag development; harness shop; hauling; heifer replacements; homemade fruit preserves; log and wood, planting lumber, sheep; goats; social security; straw; soy beans and corn. Producers were asked several questions to obtain information regarding the size and history of their farms. When asked how many acres they personally owned: 14.5% own 401 or more acres; 4.5% own 351 to 400 acres; 4.5% own between 301 and 350 acres; 7.2% own 251 to 300 acres; 11.8% own 201 to 250 acres; 10.5% own 151-200 acres; 19.4% own between 101 and 150 acres; 13.9% own 51 to 100 acres; 6% owned between 1 and 50 acres; and 5.6% stated they owned less than one acre. The producers were asked how many acres they rented: 16% rented 201 or more acres; 8.2% rented 151-200 acres; 8.7% rented 101 to 150 acres; 16.4% rented 51 to 100 acres; 15.3% rented between 1 and 50 acres; and 35.6% rented 0 acres. Producers commented on the status of their livestock answering various questions. When asked how many cows they were currently milking 9.5% reported milking 126 or more cows; 5.9% said 101-125; 9.6% stated 76-100; 23.6% said 51-75; 37.7% responded 26-50; 13.6% said 1-25; and 0.2% said 0. They were then asked how many dry cows they currently have and responded as follows: 11.1% 31 or more dry cows; 7.7% 21 to 30; 30.2% 11 to 20; 49.4% said 1 to 10; and 1.6% said 0. The farmers were asked how many of their own replacement heifers they have on their farm: 18.7% stated they had 76 or more; 11.4% responded 51 to 75; 30.1% said 26 to 50; 36.1% said 1 to 25 and 3.7% responded 0 replacement heifers.

10
The producers were asked about their current milking parlor, general production figures, and general business information. 14% responded they were planning on renovating or building a new milking parlor within the next 5 years. 25.1% responded that their milking parlor was 10 years old or younger; 24.4% said it was between 11 and 20 years old; 25.9% indicated it was 21 to 30 years old; 17.6% said it was 31 to 40 years old; and 7% responded their milking parlor was over 40 years old. 58% of producers said they had specific goals identified to help get their farm operation to where they want it within 5 years. Farm business arrangements were reported in this range: 59.7% said they were the sole owner/proprietor; 35.7% said it was a family based partnership; 0.7% partnered with non-family members; 2.0% were in a tenant/landlord partnership; and 2.0% declared they were in an “other” type of dairy farm business arrangement. Dairy production questions were included to understand the production costs and raw data supplied by the farmers themselves. About how much milk do you ship from your farm per year: 29.5% 500,000 pounds or less; 34.1% between 501,000 to 1 million pounds; 16.3% 1.01 to 1.5 million pounds; 12.5% 1.51 to 2.5 million pounds; 6% 2.51 to 5 million pounds; and 1.6% reported 5.01 million pounds or more. The price per hundredweight of milk that is required for their businesses to be profitable were broken down in 2 dollar ranges and the results were: 5.7% require $12-13; 18.5% require $13-14; 57% require $15-16; and 18.8% require $17 or more to be profitable. The description of the individual’s type of dairy production system produced these findings: 45.7% primarily use pasture grazing; 42.5% use partial confinement; and 11.8% use confinement. When analyzing the data to compare the future plans of dairy producers with their minimum price per hundredweight there was a significant relationship between higher price needed and likelihood of retiring or dispersing in the next 5 years (Table 7).
TABLE 7: Price Needed Per Hundred Weight to be Profitable by Future Plans for 5 years
from now (% Respondents)
The producers were asked about their age, education, if they were covered by health insurance, and various personal goal and planning questions. 8.1% of producers are between 20-29 years old; 11.8% are between the ages of 30 to 39, 24.9% are 40-49 years old; 29.2% are 50-59; 16.8% are 60-69; and 7.3% are over 69 years of age. 71.7% of producers reported having health insurance. Of those 29.1% said it was obtained through off-farm employment. The breakdown of highest education level completed was as follows: 1.6% said they had no formal education; 18.8% reported completing grade school; 8.5% said they completed some high school; 41.7% said they completed high school; 14.2% have some college/technical school experience; 19.9% completed a 4-year degree; 2.0% completed some graduate school work; and 3.2% completed graduate school. 51.7% reported “yes,” that off-farm earnings were a portion of their families’ household income. 12.1% indicated they plan on transitioning their farm ownership to another family member during the next 5 years. When asked about their dairy plans in 5 years: 22.6% indicated “no change”; 22.1% said they plan to “expand”; 10.9% plan to “retire”’ 6.4% plan to “disperse”; and 38% were “uncertain” concerning their dairy farm plans five years from now.
Uncertain No Change Expand Retire Disperse $12-13 2.4 12.8 6.5 0.0 5.7 $13-14 13.8 24.0 23.6 13.3 20.0 $15-16 62.4 4936 56.1 65.0 42.9 $17+ 21.4 13.6 13.8 21.7 31.4
11
Extra Comments/Suggestions Respondents were given an opportunity to add any additional comments that they wanted to include with their survey responses. The following is a summary of the most common types of comments that were received. 35 people felt: Milk pricing needs improvement • Price of equipment skyrocketed (fertilizer, food, etc) price of milk still very low • Pay is depressing given long 16 hr/day 6-7day a week work schedules • Having to sell dairy and focus on other sources of income (vegetables, hay, tobacco…etc) • Same prices now as it was 20-30 years ago 17 people felt: Irate about situation • Demanding higher pay for milk • Disappointed with staff and initiatives • Why do we pay 90 cents to move milk/location adjustment fees • [company name] unfair practices, price gouging… • Dairying profession needs to be encouraged 9 people were: curious about new techniques/information • Requesting training and materials on self-processing • Low interest loans, high-quality grass • Other new technologies/developments • How to make high-quality butter from Jersey milk • Programs/instructional tapes in Spanish 17 People demand: more oversight from government • Change in structure (who inspects) • What inspectors are looking for, how they can better pass on information • How to survive bad months/years of pricing (quota system referenced) • Opening free markets 3 people felt: the government should stop meddling • With dairy interests/industry programs • A suspicion it will hurt farmers in the long run CONCLUSION Results from this survey represent a wide range of topics of interest and concern to the dairy industry, government agencies and programs, and producer associations. Respondents represent an excellent cross-section of size and type of dairy operations, producer characteristics, and geographic area across Kentucky. Findings will especially be useful to the Kentucky Dairy Development Council and the Kentucky Department of Agriculture as programs are review and planned for dairy producers and the dairy industry.
12
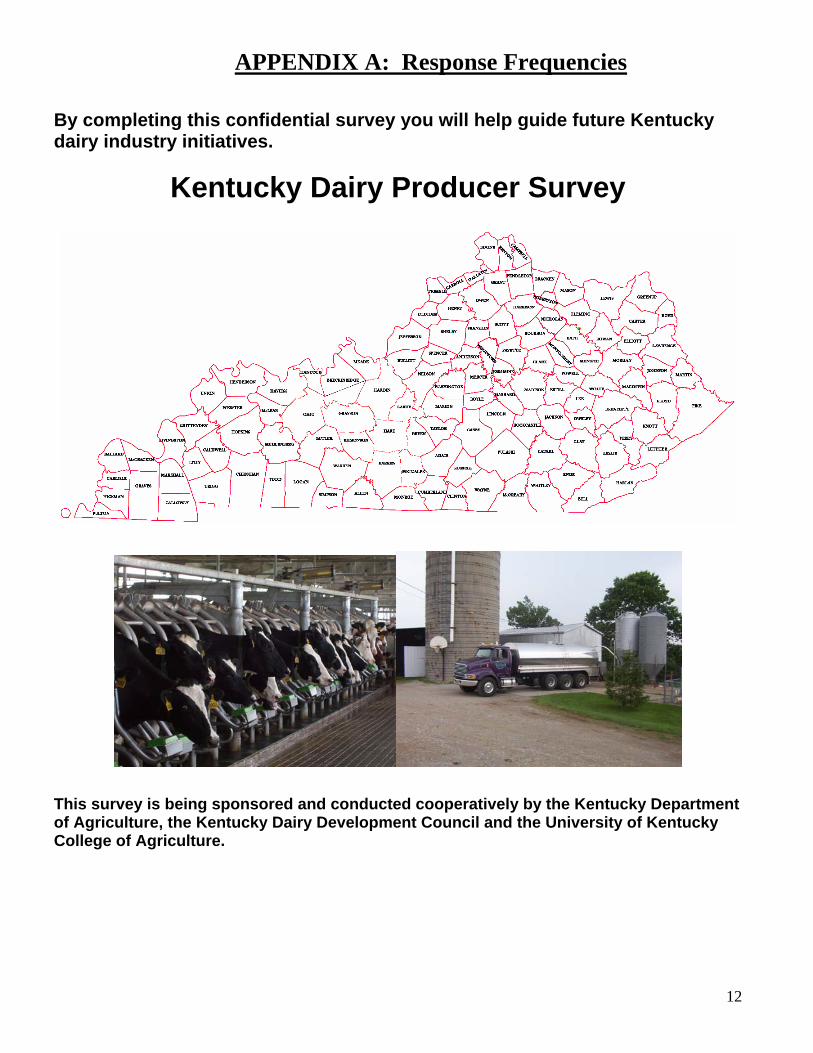
APPENDIX A: Response Frequencies
By completing this confidential survey you will help guide future Kentucky dairy industry initiatives.
Kentucky Dairy Producer Survey
This survey is being sponsored and conducted cooperatively by the Kentucky Department of Agriculture, the Kentucky Dairy Development Council and the University of Kentucky College of Agriculture.
13
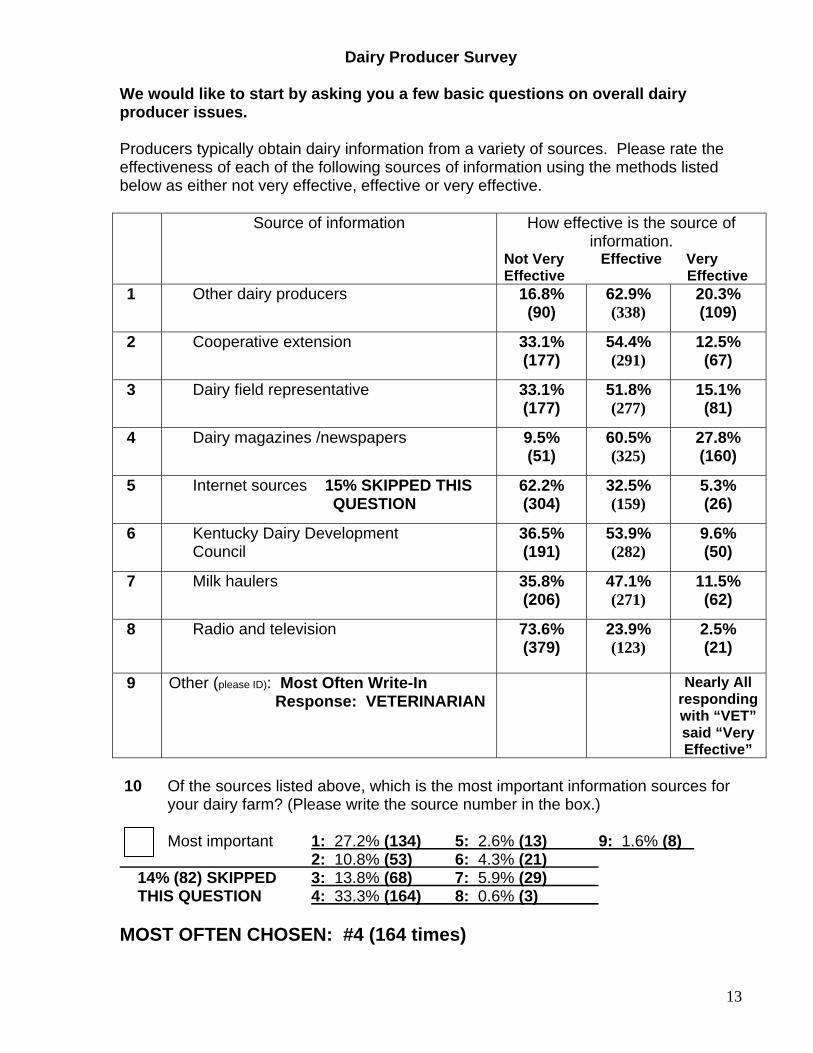
Dairy Producer Survey We would like to start by asking you a few basic questions on overall dairy producer issues. Producers typically obtain dairy information from a variety of sources. Please rate the effectiveness of each of the following sources of information using the methods listed below as either not very effective, effective or very effective.
Source of information How effective is the source of information.
Not Very Effective Very Effective Effective
1 Other dairy producers
16.8% (90)
62.9% (338)
20.3% (109)
2 Cooperative extension 33.1% (177)
54.4% (291)
12.5% (67)
3 Dairy field representative
33.1% (177)
51.8% (277)
15.1% (81)
4 Dairy magazines /newspapers
9.5% (51)
60.5% (325)
27.8% (160)
5 Internet sources 15% SKIPPED THIS QUESTION
62.2% (304)
32.5% (159)
5.3% (26)
6 Kentucky Dairy Development Council
36.5% (191)
53.9% (282)
9.6% (50)
7 Milk haulers 35.8% (206)
47.1% (271)
11.5% (62)
8 Radio and television
73.6% (379)
23.9% (123)
2.5% (21)
9 Other (please ID): Most Often Write-In Response: VETERINARIAN
Nearly All responding with “VET” said “Very Effective”
10 Of the sources listed above, which is the most important information sources for
your dairy farm? (Please write the source number in the box.)
Most important 1: 27.2% (134) 5: 2.6% (13) 9: 1.6% (8) 2: 10.8% (53) 6: 4.3% (21) 14% (82) SKIPPED 3: 13.8% (68) 7: 5.9% (29) THIS QUESTION 4: 33.3% (164) 8: 0.6% (3)
MOST OFTEN CHOSEN: #4 (164 times)

14
Does your dairy operation utilize the following services? (Please circle either yes or no.) 11 Artificial breeding (A.I.)
YES
57.3% (324)
NO 42.7% (241)
12 Sexed semen 63.8% (363)
36.2% (206)
13 rBST (Posilac®)
8.0% (46)
91.8% (515)
14 Business and estate planning
30% (169)
70% (394)
15 Forage testing
70.9% (402)
29.1% (165)
16 Custom crop harvesting
22.3% (126)
77.7% (438)
17 Back-up power generators
53% (300)
47% (266)
18 Production testing ex. DHIA or other program
29.1% (165)
70.9% (402)
19 Financial analysis program ex. Farm business analysis
13.9% (78)
86.1% (485)
20 Nutritionist (independent of feed company)
42% (235)
58% (324)
21 Of the services listed above, which is the most important information service for
your dairy farm? (Please write the source number in the box.)
Most important 11: 19% (18) 15: 12.8% (58) 19: 9.8% (49) 12: 8/2% (37) 16: 2.4% (11) 20: 20.1% (91) 21.4% (123) SKIPPED 13: 0.4% (2) 17: 20.1% (91) THIS QUESTION 14: 3.8% (17) 18: 8.8% (40) MOST OFTEN CHOSEN: #17 (91 times)
15
A variety of topics are important to dairy producers. Please rate the importance of receiving information on the following dairy topics using the methods listed below as either not very important, important or very important.
Topic number
Is information on the dairy topic below important to you?
How important is receiving information on this topic to you?
Not Very Important Very Important Important
22 Animal health issues info.
5.2% (29)
49.2% (277)
45.6% (257)
23 Bio-security info.
49% (270)
44.1% (243)
6.9% (38)
24 Dairy Herd Improvement Assoc. (DHIA) info.
46.4% (257)
38.1% (211)
15.5% (86)
25 Dairy product promotion info.
33.5% (186)
55.1% (306)
11.4% (63)
26 Environment regulation info.
27.8% (153)
59.1% (325)
13.1% (72)
27 Farm business analysis info.
47.6% (262)
41.6% (229)
10.7% (59)
28 Pasture/Forage production info.
10.4% (58)
53.9% (301)
35.7% (199)
29 Milk equipment/maintenance info.
5.3% (30)
55.6% (312)
39% (219)
30 Milk pricing structure info.
9.6% (54)
39.9% (224)
50.4% (283)
31 Milk production per cow info.
13.2% (73)
51.2% (284)
35.7% (198)
32 Milk quality info.
2.8% (16)
47.3% (266)
49.8% (280)
33 Milk regulatory info.
19.2% (105)
61.9% (339)
19% (104)
34 Milking procedures info.
17.8% (98)
59.6% (329)
22.6% (125)
35 Nutrition info.
7.4% (41)
49.9% (278)
42.7% (238)
36 Organic milk info.
74.5% (406)
18.3% (100)
7.2% (39)
37 Is there another topic of importance to you? Please list. 4% Listed other topics (grass/fertilizer…)
38 Of the topics listed above, which is most important for your dairy farm? (Please write the topic number in the box.)
Most important 22: 20% (100) 27: 2.2% (11) 32: 9.8% (49) 23: 5.6% (28) 28: 10.6% (53) 33: 1.2% (6) 24: 0% (0) 29: 3.4% (17) 34: 0.6% (3) 13.2% (76)Skipped 25: 2.0% (10) 30: 27.9% (139) 35: 5.8% (29) This Question 26: 1.2% (6) 31: 6.0% (30) 36: 2.2% (11) 37: 1.2% (6) MOST OFTEN CHOSEN: #30 (139 times)
16
Please answer yes or no to the following questions? (Please circle either yes or no.)
39 Have you benefited from Phase I Tobacco county program dollars?
YES
67.3% (369)
NO
32.7% (139)
40 Are you aware of the Kentucky Ag Finance Corporation low interest loan programs?
44.3% (239)
55.7% (320)
41 Would you consider utilizing low interest loans (2%) to expand or improve your dairy operation?
61.3% (341)
38.7% (215)
42 Do you attend local dairy producer meetings/events? 61.3% (339)
38.7% (214)
43 Do you attend state dairy producer meetings/events?
16.5% (92)
83.5% (465)
44 Are you a member of a county or multi-county dairy organization?
29.5% (164)
70.5% (392)
45 Are you a member of the Kentucky Dairy Development Council (KDDC)?
38.4% (211)
61.6% (339)
46 Do you currently raise dairy heifers on contract?
3.4% (19)
96.6% (542)
47 Do you currently contract to have someone else raise your dairy heifers?
2.9% (16)
97.1% (543)
48 Do you sell replacement heifers?
38% (213)
62% (348)
49 Would you be interested in a dairy education program to be conducted in Spanish?
10.2% (57)
89.8% (504)
50 Would you be interested in attending a dairy related computer education class?
29.4% (165)
70.6% (396)
17
Please rate your interest in the following topics as either not very interested, interested or very interested.
Topic of interest How interested are you in the topic identified.
Not Very Interested Very Interested Interested
51 On-farm milk processing
60.7% (337)
27.2% (151)
12.1% (67)
52 Agri-tourism
71.9% (399)
23.1% (128)
5.0% (28)
53 Joint venture dairy example, Farm with neighbors or partners
78.2% (433)
17.9% (99)
4.0% (22)
54 Milk hand relief program to aid in case of sickness, emergency or vacation
51.4% (284)
34.9% (193)
13.7% (76)
Milk quality is a broad topic. Please rate your confidence level with troubleshooting milk quality issues on your farm as either not very confident, confident or very confident.
Milk quality topic What is your confidence level with troubleshooting these milk quality issues on your farm?
Not Very Confident Very Confident Confident
55 Lowering my herd SCC
12.1% (67)
57.6% (319)
30.3% (168)
56 Lowering my herd standard plate bacteria count (SPC)
9.8% (54)
57.4% (317)
32.8% (181)
57 Lowering my herd PI count
13.1% (72)
56.4% (311)
30.5% (168)
58 Troubleshooting milking equipment cleaning problems
11% (61)
62.4% (345)
26.6% (147)
59 Monitoring employee milking procedures
24.2% (125)
50.5% (261)
25.3% (131)
60 Other, please identify: 5% responded (inspection ?’s...)
4.0% (23)
1% (6)
1.2% (7)
18
The following questions relate to your thoughts on various government program operations. The Division of Regulatory Services at the University of Kentucky is responsible for monitoring certain aspects of Kentucky’s milk marketing system. How much UK milk program regulatory oversight priority should be given for each of the milk marketing areas listed below? Please indicate whether you feel each area should be given a LOW priority, MEDIUM priority or HIGH priority. If you are not sure about a particular area, please indicate UNSURE.
Possible areas How much priority, if any, should each area have?
Low Medium High Unsure61 Milk hauling procedures
5.6% (31)
29.3% (161)
55.2% (303)
9.8% (54)
62 Milk hauling records
8.0% (44)
29.3% (160)
54.3% (297)
8.4% (46)
63 Milk lab testing procedures
2.2% (12)
14.2% (78)
77% (423)
6.6% (36)
64 Milk lab testing records 4.0% (22)
15.9% (87)
73.2% (401)
6.9% (38)
65 Milk payment and accounting records
5.1% (28)
15.4% (84)
70.9% (387)
8.6% (47)
19
Are you aware of the following UK Regulatory Services milk program activities/services? (Please circle either yes or no.)
66 UK milk program laboratory services for herd bulk tank testing are available to KY dairy producers at no charge.
YES 50.4% (282)
NO 49.6% (278)
67 UK milk program personnel investigate irregularities detected at any level (producer, hauler, processor, laboratory, or payment office) within the milk marketing system.
YES 45.2% (253)
NO 54.8% (307)
68 UK milk program personnel conduct dairy training programs regularly throughout KY.
YES 36.7% (205)
NO 63.3% (354)
69 UK milk program personnel are available to reconstruct KY dairy producer’s bulk tank calibration charts at no charge.
YES 47% (263)
NO 53% (297)
Listed below are some ideas suggested as possible goals for future UK milk program emphasis. Please indicate whether you feel each goal should be given a LOW priority, MEDIUM priority or HIGH priority. If you are not sure about a particular goal, please indicate UNSURE.
Possible goals How much priority, if any, should each goal have?
(Please circle your answer.) 70 Conduct more dairy related training
programs.
LOW 23% (128)
MEDIUM
39.4% (219)
HIGH 24.3% (135)
UNSURE
13.3% (74)
71 Provide Kentucky dairy producers with additional testing services (ex. cow samples or more extensive quality testing) for a reasonable fee.
LOW 14.4% (80)
MEDIUM
36.7% (204)
HIGH 38.8% (216)
UNSURE
10.1% (56)
72 Structure program activities so that producers will be provided more frequent test results from the Regulatory Services milk laboratory.
LOW 15.1% (84)
MEDIUM
40.4% (224)
HIGH 33.7% (187)
UNSURE
10.8% (60)
73 Are there others? (Please list.) Of the 9% who responded, recurring themes were: Milk Pricing, Health Insurance, Marketing…
20
The Kentucky Milk Safety Branch resides in the Department of Public Health. Its main functions are to ensure the safety of all dairy products to consumers and to monitor the environment and conditions under which dairy products are produced, processed and transported. Milk Safety Branch employees inspect your dairy farm as well as other dairy facilities for sanitation. Please circle yes or no for the following Milk Safety Branch questions.
74 Are the explanations on your farm inspection sheet clear and understandable?
YES 94% (529)
NO 6% (34)
75 Are you basically familiar with the Pasteurized Milk Ordinance (PMO)?
YES 46.3% (259)
NO 53.8% (301)
76 Are you comfortable discussing and getting an explanation of farm inspection matters with your inspector?
YES 93.1% (525)
NO 6.9% (39)
77 Are you familiar with the term “Bulk Tank Unit” or BTU?
YES 49% (275)
NO 51% (286)
78 Do you understand the potential impact of a “state survey” or a “federal check rating” on your dairy farm?
YES 72.7% (407)
NO 27.3% (153)
The Federal Milk Market Order’s primary objective is to stabilize market conditions, benefit producers and consumers by establishing and maintaining orderly marketing conditions, and assure consumers of adequate supplies of pure and wholesome milk at all times. Please circle yes or no for the following Federal Milk Market Order questions.
79 Do you know the name of the Market Administrator in your Federal Order?
YES 24.7% (139)
NO 75.3% (423)
80 Do you have a reasonably good understanding of the Federal Milk Market Order pricing system and how different “Classes” of milk prices are determined?
YES 30.7% (172)
NO 69.3% (389)
81 Are you familiar with “pooling requirements”?
YES 22% (123)
NO 78% (436)
82 Do you have a basic understanding of “touch-base days” and “diversion limits”?
YES 10.5% (59)
NO 89.5% (512)
83 Did you know the Federal Milk Marketing Orders operate testing laboratories that test “independent” producer’s milk samples for butterfat and other components?
YES 42.4% (236)
NO 57.6% (321)
21
Finally, we would like to ask a few questions about you and your farm. 84. Other than yourself, do you rely on additional farm labor? (Please circle yes or no.) 20% (109) 80% (445)
YES NO If YES, answer the questions below, if NO, please skip to question 88. How many individuals from the following groups work on your farm?
85 Family members 74% (426) responded
0 – 4.9% (21); 1 – 31.9% (136); 2 – 29.3% (125); 3 – 16.9% (72); 4 – 9.6% (41); 5 – 3.8% (16); 6 – 1.4% (6); 7 – 0.9% (4); 8 – 0.7% (3); 9 or 10 – 0.4% (2); 25.9% (149) - skipped this question
86
Local hired labor 59% (340) responded
0 – 34.7% (118); 1 – 33.8% (115); 2 – 17.9% (61); 3 – 6.2% (21); 4 or more – 7.4% (25); 40.9% (235) skipped this question
87 Migrant labor 45% (257) responded
0 – 82.1% (211); 1 – 6.2% (16); 2 – 3.9% (10); 3 – 3.1% (8); 4 or more – 4.8% (12); 55.3% (318) skipped this question
The following questions concern access to computer and internet related sources of information.
88 Do you have a computer at your home or farm office?
YES 57.9% (326)
NO 42.1% (237)
89 Do you have internet access from your home or farm?
YES 55.5% (313)
NO 44.5% (251)
90 Do you purchase or order farm/business related items on the internet?
YES 21.5% (121)
NO 78.5% (442)
91 Do you have internet access from other places than home? (library, friends, etc.)
YES 30.4% (170)
NO 59.6% (390)
92 Do you have an e-mail address?
YES 44.4% (250)
NO 55.6% (313)
93 Do you e-mail farm suppliers, consultants, county agents or any other business related people?
YES 12.1% (68)
NO 87.9% (494)
94 Do you sell farm or business related items on the internet?
YES 1.6% (9)
NO 98.4% (550)
22
95 Other than dairy, which of the farm activities listed below are sources for your farm’s income? (Please circle the letter for all that apply.)
A. Tobacco 33/% Yes (187) B. Hay 31% Yes (178) C. Beef 31% Yes (178) D. Poultry 2% Yes (11) E. Swine 2% Yes (11) F. Horses 4% Yes (20) G. Vegetables/fruits 4% Yes (25) H. Grains 27% Yes (154) I. Aquaculture 0.3% Yes (2) J. Agri-tourism 0.7% Yes (4) K. other (please ID) ________5.4% (31) Responded having other
sources_____
96
How many acres do you own?
5.6% (31)- < 1 acre; 6% (33)- 1-50; 13.9% (77)- 51-100; 19.4% (107)- 101-150; 10.5% (58) - 151-200; 11.8% (65)- 201-250; 7.2% (39)- 251-300; 4.5% (25)- 301-350; 14.5% (82)- 401 or more acres
97
How many acres do you rent?
35.6% (191)- 0 acres; 15.3% (82)- 1-50; 16.4% (88)- 51-100; 8.7% (34)- 101-150; 8.2% (56)- 151-200; 16% (86)- 201 or more acres
98 What is the primary county where your farm is located?
74 counties reported!
99
How many cows are you currently milking?
0.2% (1)- 0 cows; 13.6% (76)- 1-25; 37.7% (211)- 26-50; 23.6% (132)- 51-75; 9.6% (54)- 76-100; 5.9% (33)- 101-125; 9.5% (53)- 126 or more cows
100
How many dry cows do you currently have?
1.6% (9)- 0 cows; 49.4% (276)- 1-10; 30.2% (169)- 11-20; 7.7% (43)- 21-30; 11.1% (62)- 31 or more dry cows
101
How many of your own replacement heifers do you have on your farm?
3.7% (20)- 0 heifers; 36.1% (197)- 1-25; 30.1% (164)- 26-50; 11.4% (62)- 51-75; 18.7% (102)- 76 or more replacement heifers
102
What is the age of your current milking parlor?
25.1% (137)- 10 yrs or younger; 24.4% (133)- 11-20; 25.9% (141)- 21-30; 17.6% (96)- 31-40; 7% (38)- over 40 years old
103 Do you have plans to renovate or build a new parlor within the next 5 years?
14% (79) 86% (475) YES NO
104
What is your present age?
8.1% (45)- 20-29; 11.8% (66)- 30-39; 24.9% (139)- 40-49; 29.2% (163)- 50-59; 16.8% (94)- 60-69; 7.3% (41)- 70 and over
23
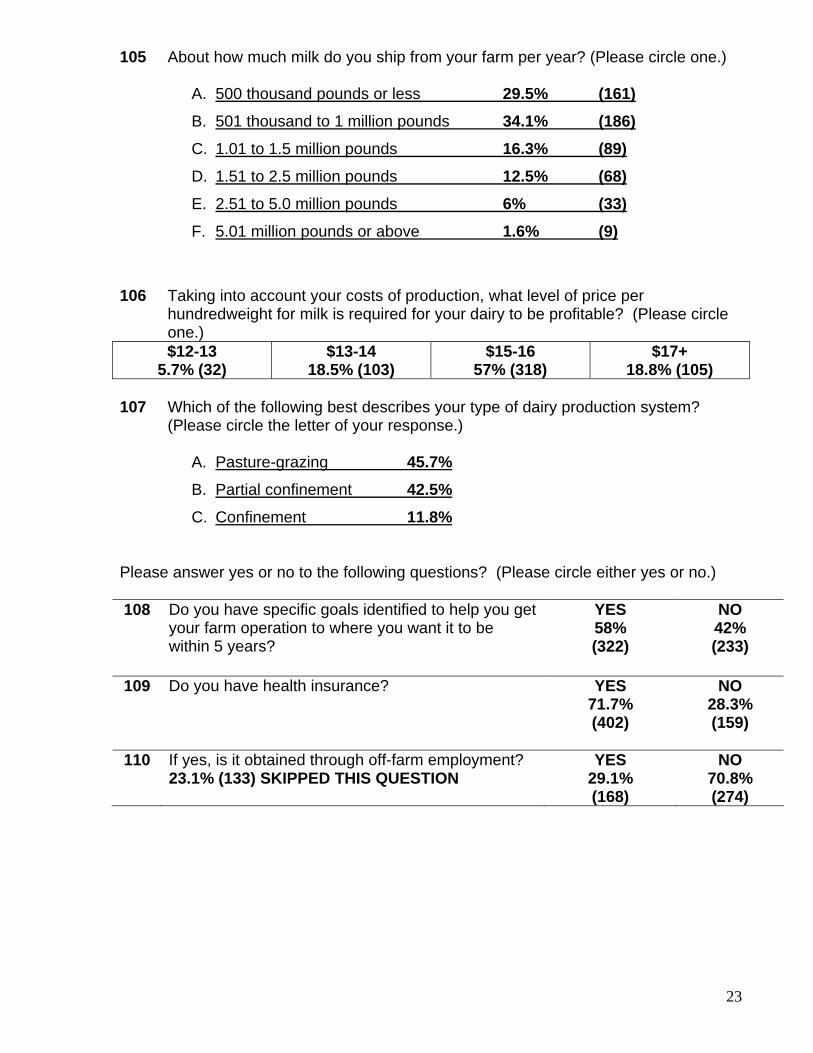
105 About how much milk do you ship from your farm per year? (Please circle one.)
A. 500 thousand pounds or less 29.5% (161) B. 501 thousand to 1 million pounds 34.1% (186) C. 1.01 to 1.5 million pounds 16.3% (89) D. 1.51 to 2.5 million pounds 12.5% (68) E. 2.51 to 5.0 million pounds 6% (33) F. 5.01 million pounds or above 1.6% (9)
106 Taking into account your costs of production, what level of price per
hundredweight for milk is required for your dairy to be profitable? (Please circle one.) $12-13
5.7% (32) $13-14
18.5% (103) $15-16
57% (318) $17+
18.8% (105) 107 Which of the following best describes your type of dairy production system?
(Please circle the letter of your response.)
A. Pasture-grazing 45.7%
B. Partial confinement 42.5%
C. Confinement 11.8%
Please answer yes or no to the following questions? (Please circle either yes or no.) 108 Do you have specific goals identified to help you get
your farm operation to where you want it to be within 5 years?
YES 58% (322)
NO 42% (233)
109 Do you have health insurance?
YES 71.7% (402)
NO 28.3% (159)
110 If yes, is it obtained through off-farm employment? 23.1% (133) SKIPPED THIS QUESTION
YES 29.1% (168)
NO 70.8% (274)
24
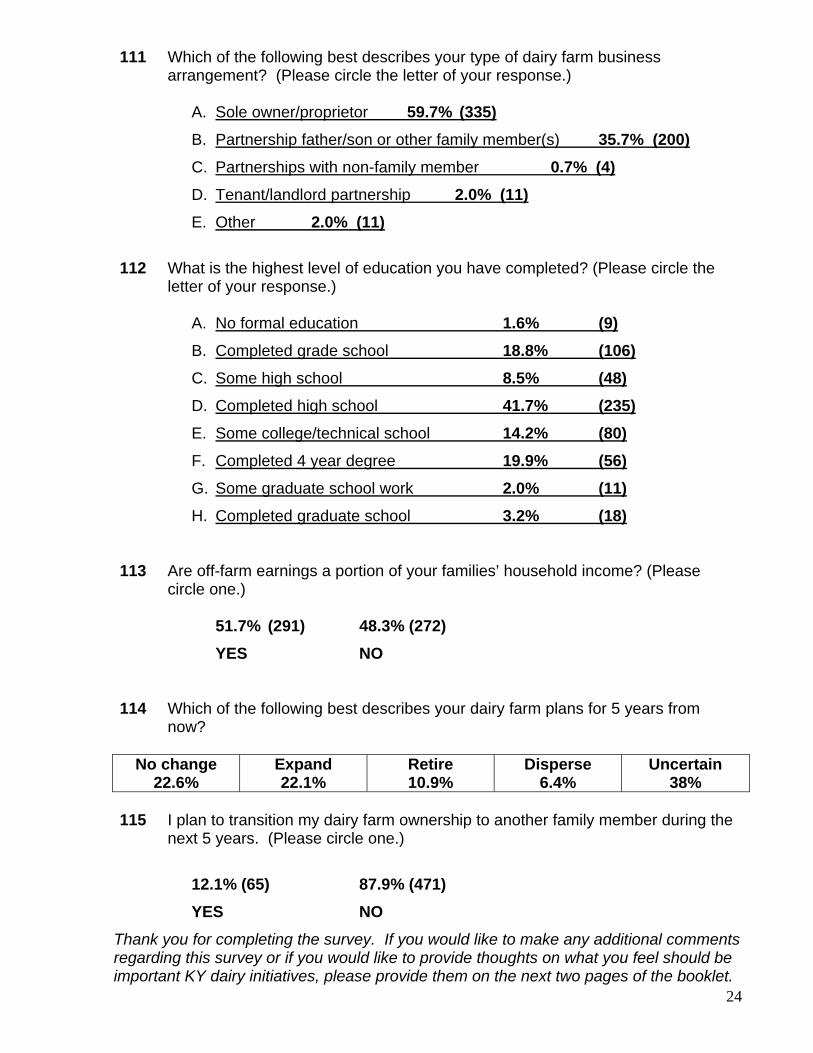
111 Which of the following best describes your type of dairy farm business arrangement? (Please circle the letter of your response.)
A. Sole owner/proprietor 59.7% (335) B. Partnership father/son or other family member(s) 35.7% (200) C. Partnerships with non-family member 0.7% (4) D. Tenant/landlord partnership 2.0% (11) E. Other 2.0% (11)
112 What is the highest level of education you have completed? (Please circle the
letter of your response.)
A. No formal education 1.6% (9) B. Completed grade school 18.8% (106) C. Some high school 8.5% (48) D. Completed high school 41.7% (235) E. Some college/technical school 14.2% (80) F. Completed 4 year degree 19.9% (56) G. Some graduate school work 2.0% (11) H. Completed graduate school 3.2% (18)
113 Are off-farm earnings a portion of your families’ household income? (Please circle one.)
51.7% (291) 48.3% (272) YES NO 114 Which of the following best describes your dairy farm plans for 5 years from
now?
No change 22.6%
Expand 22.1%
Retire 10.9%
Disperse 6.4%
Uncertain 38%
115 I plan to transition my dairy farm ownership to another family member during the
next 5 years. (Please circle one.) 12.1% (65) 87.9% (471) YES NO
Thank you for completing the survey. If you would like to make any additional comments regarding this survey or if you would like to provide thoughts on what you feel should be important KY dairy initiatives, please provide them on the next two pages of the booklet.

25
Please provide any additional comments below .
35 people felt: Milk pricing needs improvement • Price of equipment skyrocketed (fertilizer, food, etc) price of milk still very low • Pay is depressing given long 16 hr/day 6-7day a week work schedules • Having to sell dairy and focus on other sources of income (vegetables, hay,
tobacco…etc) • Same prices now as it was 20-30 years ago 17 people felt: Irate about situation • demanding higher pay for milk • disappointed with staff and initiatives • Why do we pay 90 cents to move milk/location adjustment fees • milk cooperatives unfair practices, price gouging… • Dairying profession needs to be encouraged 9 people were: curious about new techniques/information • requesting training and materials on self-processing • low interest loans, high-quality grass • other new technologies/developments • How to make high-quality butter from Jersey milk • Programs/instructional tapes in Spanish 17 People demand: more oversight from government • change in structure (who inspects) • what inspectors are looking for, how they can better pass on information • how to survive bad months/years of pricing (quota system referenced) • opening free markets 3 people felt: the government should stop meddling • With dairy interests/industry programs • A suspicion it will hurt farmers in the long run

26
Please provide any additional comments below.
27
The College of Agriculture is an Equal Opportunity Organization
Thank you for your help. Please return your survey in the enclosed postage paid envelope to the
Kentucky Department of Agriculture 100 Fair Oaks Lane, Suite 252
Frankfort, KY 40601


