
KeyBanc Capital Markets’ Debt Capital Markets
The KeyBanc Capital Markets® Debt Capital Markets team represents
one of the strongest full-service debt-side investment banking, sales,
trading and distribution platforms in the nation. We use a blend of real
world perspectives, backed by robust capabilities and relationships, to
help our clients use leverage to grow, make acquisitions, and enhance
operations.
For additional information regarding this
newsletter, please contact the individuals
listed below: Andrew Frawley 216.689.4288
Steve Rasoletti 216.689.3228
Disclosure: KeyBanc Capital Markets is a trade name under which corporate and investment banking products and services of KeyCorp and its subsidiaries, KeyBanc Capital Markets Inc., Member NYSE/FINRA/SIPC, and KeyBank National Association (“KeyBank N.A.”),
are marketed. Securities products and services are offered by KeyBanc Capital Markets Inc. and its licensed securities representatives, who may also be employees of KeyBank N.A. Banking products and services are offered by KeyBank N.A.
This report was not issued by our research department. The information contained in this report has been obtained from sources deemed to be reliable but is not represented to be complete, and it should not be relied upon as such. This report does not purport to be a
complete analysis of any security, issuer, or industry and is not an offer or a solicitation of an offer to buy or sell any securities. This report is prepared for general information purposes only and does not consider the specific investment objectives, financial situation and
particular needs of any individual person or entity.
Junior Debt Market Analysis
2
Executive Summary
KeyBanc Capital Markets (KBCM) conducts a quarterly survey of mezzanine and junior debt participants to measure
market conditions and transaction terms
The junior debt capital markets (including mezzanine, subordinated, second lien structures, etc.) are not as well documented or
organized as the senior debt markets or the equity or venture capital markets
– This challenge is even more pronounced in the lower end of the middle market (typically companies <$50 million of EBITDA)
Our survey and resulting newsletter is an attempt to address the lack of market information noted above
We have been conducting our survey since 2011 and have aggregated the data for review and analysis
Unless otherwise stated, statistics found in this analysis reflect the average of answers provided since inception of survey
I. Executive Summary
Junior Debt Market Analysis
3
Executive Summary (cont’d)
In a typical quarter since Q2 2011, junior capital providers who respond to our survey:
Transaction Flow /
Closed Transactions
Transaction
Structure Terms and Conditions Fund Overview
Source: KeyBanc Capital Markets Junior Debt Survey
I. Executive Summary
Invest across a wide range
of industries
Have $220.3 million
available to invest
A typical investment size of
$18.1 million per transaction
May or may not need to
begin fundraising in the next
twelve months, but expect
that process to take 10.9
months
Generally speaking, funds
are getting larger and capital
providers are looking to put
larger amounts of capital in
each transaction
See opportunities from a
range of sources, with 61.7%
involving a sponsor
On a quarterly basis:
– Review 44.8 opportunities
– Submit 7.5 LOIs
– Close 3.7 transactions
In 4Q16:
– Reviewed 41.7
opportunities
– Submitted 4.5 LOIs
– Closed 2.4 transactions
Of note, on average, ~23%
of funds do not close any
transactions during a given
quarter
For completed transactions
– Senior debt to EBITDA
multiple is 3.3x
– Total debt to EBITDA
multiple is 3.7x
The typical capital structure
includes
– 48.6% of senior debt
– 16.9% of junior debt
– 34.5% of equity
On a quarterly basis:
– Cash pay rate is 12.0%
– Average PIK rate is 2.0%
– Total expected IRR is
14.1%
– 59.8% of transactions
have warrants equal to
4.9% of the fully-diluted
equity
In 4Q16:
– Cash pay rate is 11.3%
– PIK rate is 2.0%
– Total expected IRR is
13.9%
Junior Debt Market Analysis
4
KBCM Junior Debt Market Analysis
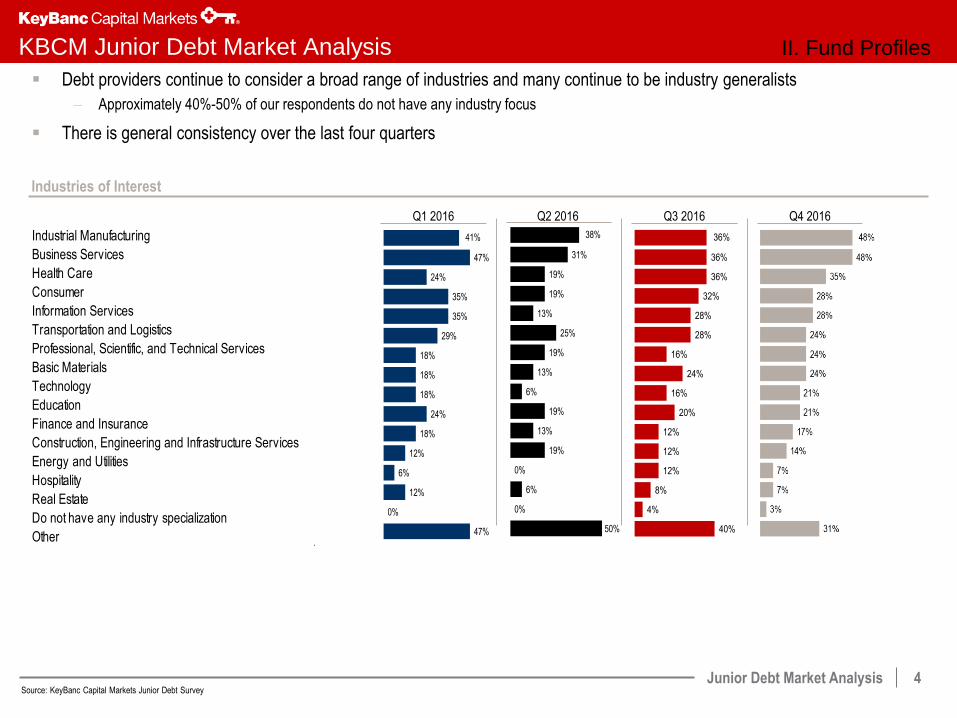
Debt providers continue to consider a broad range of industries and many continue to be industry generalists
– Approximately 40%-50% of our respondents do not have any industry focus
There is general consistency over the last four quarters
Industries of Interest
Source: KeyBanc Capital Markets Junior Debt Survey
II. Fund Profiles
Q1 2016 Q3 2016 Q4 2016 Q2 2016
Industrial Manufacturing
Business Services
Health Care
Consumer
Information Services
Transportation and Logistics
Professional, Scientific, and Technical Services
Basic Materials
Technology
Education
Finance and Insurance
Construction, Engineering and Infrastructure Services
Energy and Utilities
Hospitality
Real Estate
Do not have any industry specialization
Other
41%
47%
24%
35%
35%
29%
18%
18%
18%
24%
18%
12%
6%
12%
0%
47%
38%
31%
19%
19%
13%
25%
19%
13%
6%
19%
13%
19%
0%
6%
0%
50%
36%
36%
36%
32%
28%
28%
16%
24%
16%
20%
12%
12%
12%
8%
4%
40%
Junior Debt Market Analysis
5
KBCM Junior Debt Market Analysis
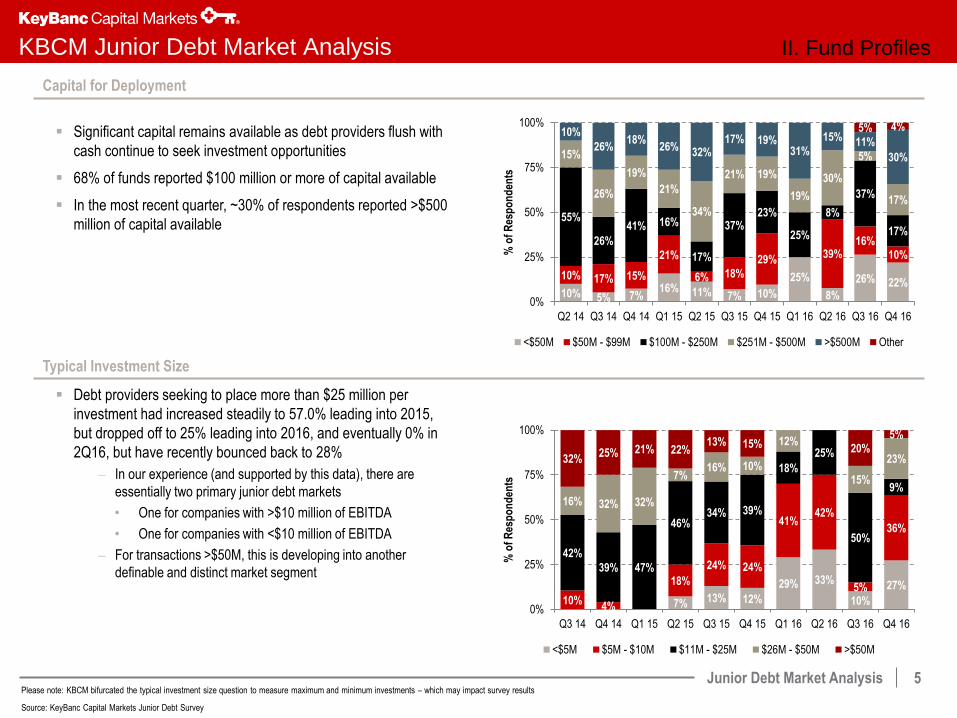
Capital for Deployment
Typical Investment Size
Significant capital remains available as debt providers flush with
cash continue to seek investment opportunities
68% of funds reported $100 million or more of capital available
In the most recent quarter, ~30% of respondents reported >$500
million of capital available
Debt providers seeking to place more than $25 million per
investment had increased steadily to 57.0% leading into 2015,
but dropped off to 25% leading into 2016, and eventually 0% in
2Q16, but have recently bounced back to 28%
– In our experience (and supported by this data), there are
essentially two primary junior debt markets
• One for companies with >$10 million of EBITDA
• One for companies with <$10 million of EBITDA
– For transactions >$50M, this is developing into another
definable and distinct market segment
Please note: KBCM bifurcated the typical investment size question to measure maximum and minimum investments – which may impact survey results
Source: KeyBanc Capital Markets Junior Debt Survey
II. Fund Profiles
10% 5% 7% 16% 11% 7% 10%
25%
8%
26% 22% 10% 17% 15%
21%
6% 18%
29% 39% 16%
10%
55%
26%
41% 16%
17%
37% 23%
25%
8%
37%
17%
15%
26%
19%
21%
34%
21% 19%
19%
30%
5%
17%
10%
26% 18%
26% 32% 17% 19%
31%
15% 11%
30%
5% 4%
0%
25%
50%
75%
100%
Q2 14 Q3 14 Q4 14 Q1 15 Q2 15 Q3 15 Q4 15 Q1 16 Q2 16 Q3 16 Q4 16
% o
f R
esp
on
den
ts
<$50M $50M - $99M $100M - $250M $251M - $500M >$500M Other
7% 13% 12%
29% 33%
10%
27%
10% 4%
18%
24% 24%
41% 42%
5%
36%
42%
39% 47%
46% 34% 39%
18%
25%
50%
9% 16% 32% 32%
7% 16% 10%
12%
15%
23% 32% 25% 21% 22%
13% 15% 20% 5%
0%
25%
50%
75%
100%
Q3 14 Q4 14 Q1 15 Q2 15 Q3 15 Q4 15 Q1 16 Q2 16 Q3 16 Q4 16
% o
f R
esp
on
den
ts
<$5M $5M - $10M $11M - $25M $26M - $50M >$50M
Junior Debt Market Analysis
6
KBCM Junior Debt Market Analysis
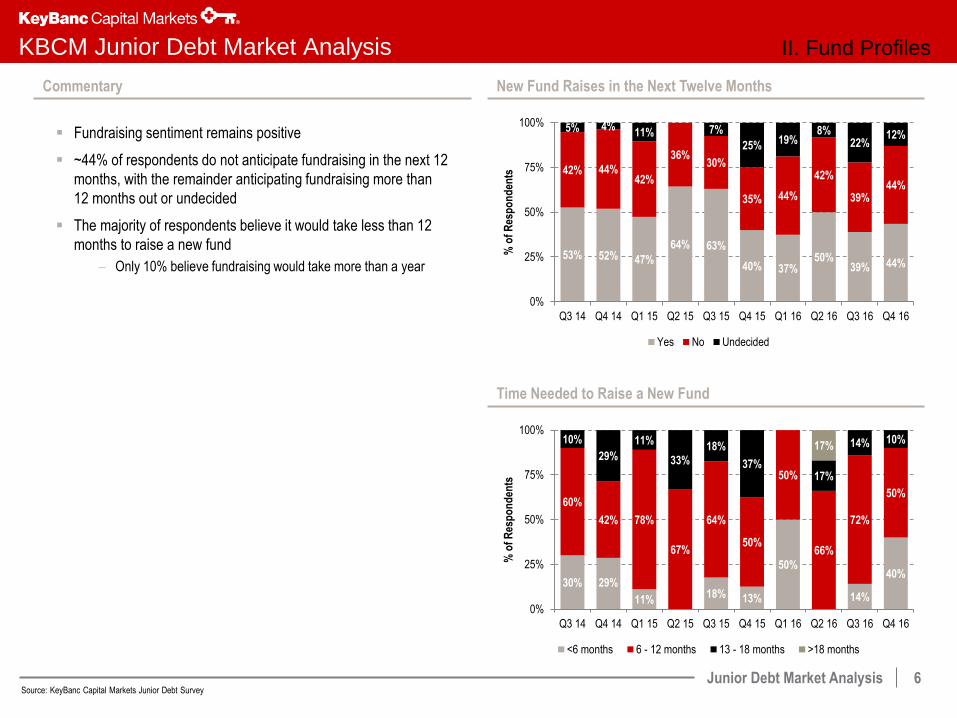
Commentary
Fundraising sentiment remains positive
~44% of respondents do not anticipate fundraising in the next 12
months, with the remainder anticipating fundraising more than
12 months out or undecided
The majority of respondents believe it would take less than 12
months to raise a new fund
– Only 10% believe fundraising would take more than a year
New Fund Raises in the Next Twelve Months
Time Needed to Raise a New Fund
Source: KeyBanc Capital Markets Junior Debt Survey
II. Fund Profiles
53% 52% 47%
64% 63%
40% 37% 50%
39% 44%
42% 44% 42%
36% 30%
35% 44%
42%
39% 44%
5% 4% 11% 7%
25% 19% 8%
22% 12%
0%
25%
50%
75%
100%
Q3 14 Q4 14 Q1 15 Q2 15 Q3 15 Q4 15 Q1 16 Q2 16 Q3 16 Q4 16
% o
f R
esp
on
den
ts
Yes No Undecided
30% 29%
11% 18% 13%
50%
14%
40%
60%
42% 78%
67%
64%
50%
50%
66%
72%
50%
10%
29%
11%
33%
18%
37% 17%
14% 10% 17%
0%
25%
50%
75%
100%
Q3 14 Q4 14 Q1 15 Q2 15 Q3 15 Q4 15 Q1 16 Q2 16 Q3 16 Q4 16
% o
f R
esp
on
den
ts
<6 months 6 - 12 months 13 - 18 months >18 months
Junior Debt Market Analysis
7
KBCM Junior Debt Market Analysis
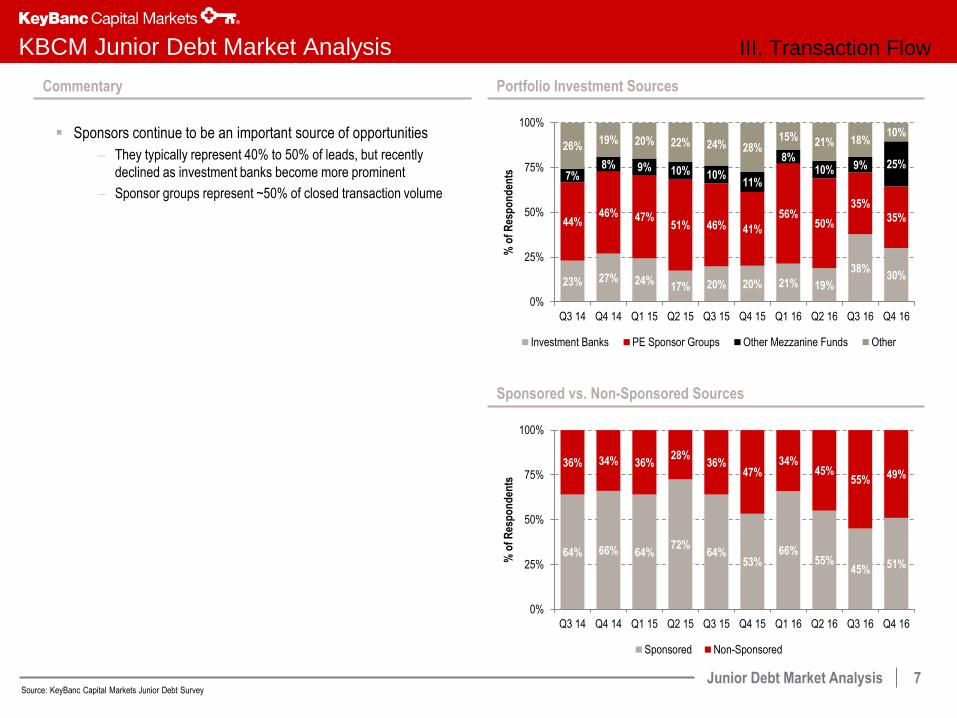
Commentary Portfolio Investment Sources
Sponsors continue to be an important source of opportunities
– They typically represent 40% to 50% of leads, but recently
declined as investment banks become more prominent
– Sponsor groups represent ~50% of closed transaction volume
Sponsored vs. Non-Sponsored Sources
Source: KeyBanc Capital Markets Junior Debt Survey
III. Transaction Flow
23% 27% 24% 17% 20% 20% 21% 19%
38% 30%
44% 46% 47%
51% 46% 41%
56% 50%
35% 35%
7% 8% 9% 10% 10%
11%
8% 10% 9% 25%
26% 19% 20% 22% 24% 28%
15% 21% 18% 10%
0%
25%
50%
75%
100%
Q3 14 Q4 14 Q1 15 Q2 15 Q3 15 Q4 15 Q1 16 Q2 16 Q3 16 Q4 16
% o
f R
esp
on
den
ts
Investment Banks PE Sponsor Groups Other Mezzanine Funds Other
64% 66% 64% 72%
64% 53%
66% 55%
45% 51%
36% 34% 36% 28%
36% 47%
34% 45%
55% 49%
0%
25%
50%
75%
100%
Q3 14 Q4 14 Q1 15 Q2 15 Q3 15 Q4 15 Q1 16 Q2 16 Q3 16 Q4 16
% o
f R
esp
on
den
ts
Sponsored Non-Sponsored
Junior Debt Market Analysis
8
KBCM Junior Debt Market Analysis
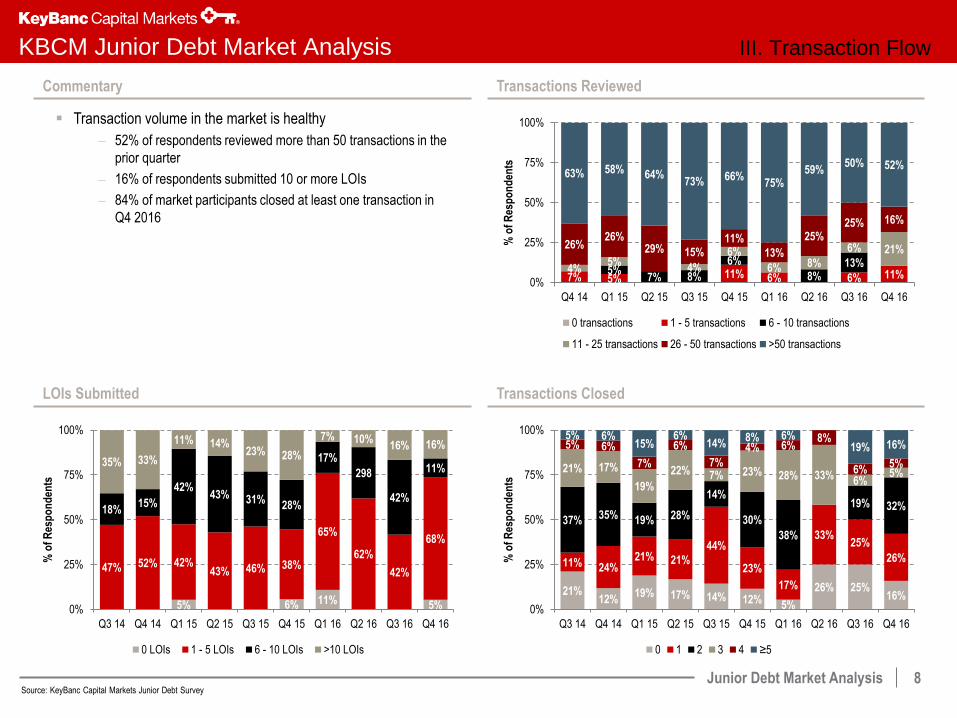
Commentary
LOIs Submitted
Transactions Reviewed
Transaction volume in the market is healthy
– 52% of respondents reviewed more than 50 transactions in the
prior quarter
– 16% of respondents submitted 10 or more LOIs
– 84% of market participants closed at least one transaction in
Q4 2016
Transactions Closed
Source: KeyBanc Capital Markets Junior Debt Survey
III. Transaction Flow
7% 5% 11% 6% 6% 11% 5% 7% 8%
6%
8% 13%
4% 5%
4%
6%
6% 8%
6% 21% 26% 26%
29% 15% 11%
13%
25% 25% 16%
63% 58% 64% 73% 66%
75% 59%
50% 52%
0%
25%
50%
75%
100%
Q4 14 Q1 15 Q2 15 Q3 15 Q4 15 Q1 16 Q2 16 Q3 16 Q4 16
% o
f R
esp
on
den
ts
0 transactions 1 - 5 transactions 6 - 10 transactions
11 - 25 transactions 26 - 50 transactions >50 transactions
5% 6% 11% 5%
47% 52% 42% 43% 46% 38%
65%
62%
42%
68%
18% 15%
42% 43% 31%
28%
17%
298
42%
11% 35% 33%
11% 14% 23% 28%
7% 10% 16% 16%
0%
25%
50%
75%
100%
Q3 14 Q4 14 Q1 15 Q2 15 Q3 15 Q4 15 Q1 16 Q2 16 Q3 16 Q4 16
% o
f R
esp
on
den
ts
0 LOIs 1 - 5 LOIs 6 - 10 LOIs >10 LOIs
21% 12%
19% 17% 14% 12% 5%
26% 25% 16%
11% 24% 21% 21%
44%
23%
17%
33% 25%
26%
37% 35% 19% 28%
14%
30%
38%
19% 32%
21% 17%
19%
22% 7% 23% 28% 33% 6% 5%
5% 6%
7%
6%
7%
4% 6% 8%
6% 5%
5% 6% 15%
6% 14%
8% 6% 19% 16%
0%
25%
50%
75%
100%
Q3 14 Q4 14 Q1 15 Q2 15 Q3 15 Q4 15 Q1 16 Q2 16 Q3 16 Q4 16
% o
f R
esp
on
den
ts
0 1 2 3 4 ≥5
Junior Debt Market Analysis
9
KBCM Junior Debt Market Analysis
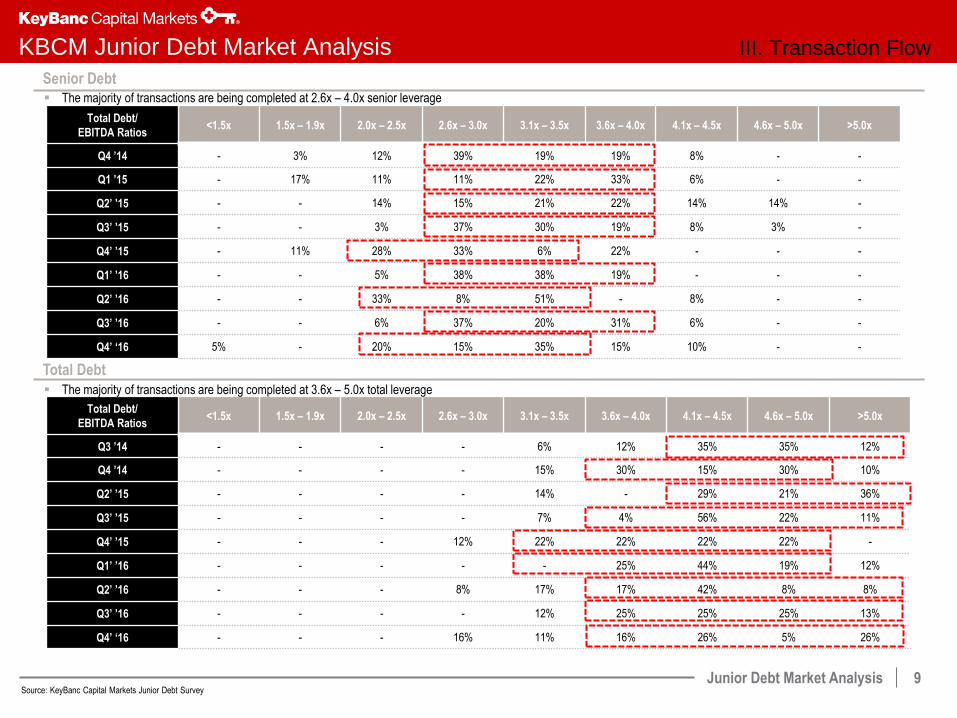
Total Debt/
EBITDA Ratios <1.5x 1.5x – 1.9x 2.0x – 2.5x 2.6x – 3.0x 3.1x – 3.5x 3.6x – 4.0x 4.1x – 4.5x 4.6x – 5.0x >5.0x
Q3 ’14 - - - - 6% 12% 35% 35% 12%
Q4 ’14 - - - - 15% 30% 15% 30% 10%
Q2’ ’15 - - - - 14% - 29% 21% 36%
Q3’ ’15 - - - - 7% 4% 56% 22% 11%
Q4’ ’15 - - - 12% 22% 22% 22% 22% -
Q1’ ’16 - - - - - 25% 44% 19% 12%
Q2’ ’16 - - - 8% 17% 17% 42% 8% 8%
Q3’ ’16 - - - - 12% 25% 25% 25% 13%
Q4’ ‘16 - - - 16% 11% 16% 26% 5% 26%
Total Debt/
EBITDA Ratios <1.5x 1.5x – 1.9x 2.0x – 2.5x 2.6x – 3.0x 3.1x – 3.5x 3.6x – 4.0x 4.1x – 4.5x 4.6x – 5.0x >5.0x
Q4 ’14 - 3% 12% 39% 19% 19% 8% - -
Q1 ’15 - 17% 11% 11% 22% 33% 6% - -
Q2’ ’15 - - 14% 15% 21% 22% 14% 14% -
Q3’ ’15 - - 3% 37% 30% 19% 8% 3% -
Q4’ ’15 - 11% 28% 33% 6% 22% - - -
Q1’ ’16 - - 5% 38% 38% 19% - - -
Q2’ ’16 - - 33% 8% 51% - 8% - -
Q3’ ’16 - - 6% 37% 20% 31% 6% - -
Q4’ ‘16 5% - 20% 15% 35% 15% 10% - -
Senior Debt
Total Debt
The majority of transactions are being completed at 2.6x – 4.0x senior leverage
The majority of transactions are being completed at 3.6x – 5.0x total leverage
Source: KeyBanc Capital Markets Junior Debt Survey
III. Transaction Flow
Junior Debt Market Analysis
10
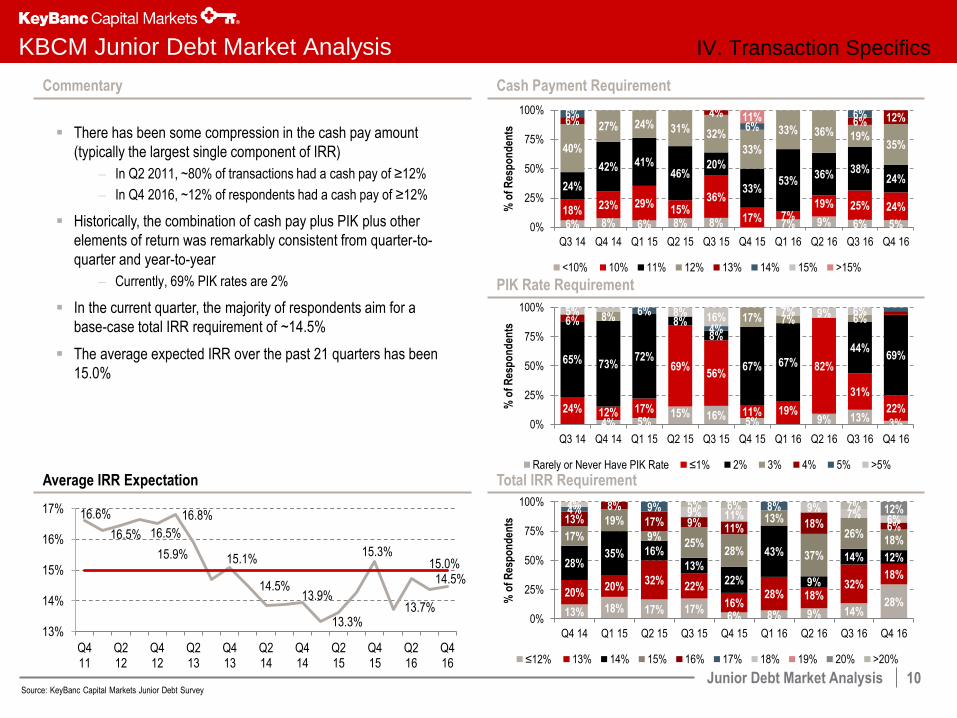
Cash Payment Requirement
Total IRR Requirement
PIK Rate Requirement
There has been some compression in the cash pay amount
(typically the largest single component of IRR)
– In Q2 2011, ~80% of transactions had a cash pay of ≥12%
– In Q4 2016, ~12% of respondents had a cash pay of ≥12%
Historically, the combination of cash pay plus PIK plus other
elements of return was remarkably consistent from quarter-to-
quarter and year-to-year
– Currently, 69% PIK rates are 2%
In the current quarter, the majority of respondents aim for a
base-case total IRR requirement of ~14.5%
The average expected IRR over the past 21 quarters has been
15.0%
Commentary
Average IRR Expectation
Source: KeyBanc Capital Markets Junior Debt Survey
KBCM Junior Debt Market Analysis IV. Transaction Specifics
6% 8% 6% 8% 8% 7% 9% 6% 5% 18% 23% 29%
15% 36%
17% 7% 19% 25% 24%
24%
42% 41% 46%
20%
33% 53%
36% 38% 24%
40%
27% 24% 31% 32%
33%
33% 36% 19% 35%
6% 4%
6% 12% 6% 6%
6% 11%
0%
25%
50%
75%
100%
Q3 14 Q4 14 Q1 15 Q2 15 Q3 15 Q4 15 Q1 16 Q2 16 Q3 16 Q4 16
% o
f R
esp
on
den
ts
<10% 10% 11% 12% 13% 14% 15% >15%
4% 5% 15% 16%
5% 9% 13% 3%
24% 12% 17%
69% 56%
11% 19%
82%
31%
22%
65% 73% 72%
8%
8%
67% 67%
44% 69%
8% 17% 7% 6% 6% 6%
4%
5% 8% 16% 7% 9% 6%
0%
25%
50%
75%
100%
Q3 14 Q4 14 Q1 15 Q2 15 Q3 15 Q4 15 Q1 16 Q2 16 Q3 16 Q4 16
% o
f R
esp
on
den
ts
Rarely or Never Have PIK Rate ≤1% 2% 3% 4% 5% >5%
13% 18% 17% 17% 6% 8% 9% 14%
28% 20%
20% 32%
22%
16% 28% 18%
32% 18%
28% 35% 16%
13%
22%
43%
9%
14% 12%
17%
19%
9% 25%
28%
13%
37%
26% 18%
13% 8%
17% 9% 11% 18% 6%
4% 9% 8% 4% 9% 11%
9% 7% 6%
12% 5% 6% 7%
0%
25%
50%
75%
100%
Q4 14 Q1 15 Q2 15 Q3 15 Q4 15 Q1 16 Q2 16 Q3 16 Q4 16
% o
f R
esp
on
den
ts
≤12% 13% 14% 15% 16% 17% 18% 19% 20% >20%
16.6%
16.5% 16.5%
16.8%
15.9% 15.1%
14.5% 13.9%
13.3%
15.3%
13.7%
14.5% 15.0%
13%
14%
15%
16%
17%
Q411
Q212
Q412
Q213
Q413
Q214
Q414
Q215
Q415
Q216
Q416
Junior Debt Market Analysis
11
KBCM Junior Debt Market Analysis
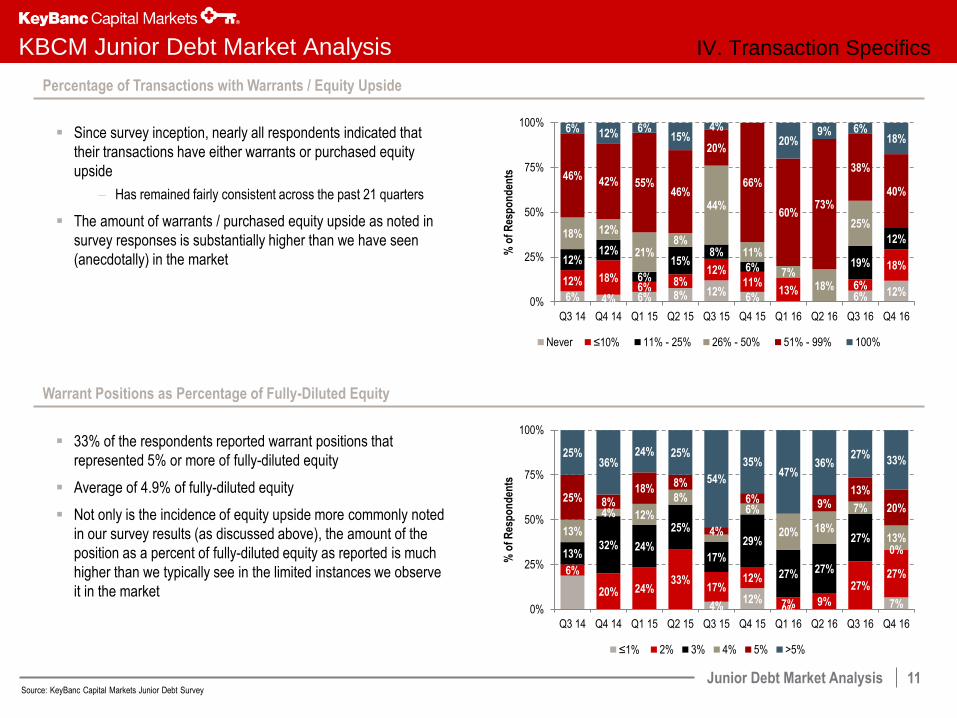
Percentage of Transactions with Warrants / Equity Upside
Warrant Positions as Percentage of Fully-Diluted Equity
Since survey inception, nearly all respondents indicated that
their transactions have either warrants or purchased equity
upside
– Has remained fairly consistent across the past 21 quarters
The amount of warrants / purchased equity upside as noted in
survey responses is substantially higher than we have seen
(anecdotally) in the market
33% of the respondents reported warrant positions that
represented 5% or more of fully-diluted equity
Average of 4.9% of fully-diluted equity
Not only is the incidence of equity upside more commonly noted
in our survey results (as discussed above), the amount of the
position as a percent of fully-diluted equity as reported is much
higher than we typically see in the limited instances we observe
it in the market
Source: KeyBanc Capital Markets Junior Debt Survey
IV. Transaction Specifics
6% 4% 6% 8% 12% 6% 6% 12%
12% 18% 6%
8% 12%
11% 13% 6%
18% 12% 12%
6%
15% 8%
6% 19%
12% 18% 12%
21% 8%
44%
11%
7% 18%
25%
46% 42% 55%
46%
20%
66%
60% 73%
38%
40%
6% 12% 6% 15%
4%
20% 9% 6%
18%
0%
25%
50%
75%
100%
Q3 14 Q4 14 Q1 15 Q2 15 Q3 15 Q4 15 Q1 16 Q2 16 Q3 16 Q4 16
% o
f R
esp
on
den
ts
Never ≤10% 11% - 25% 26% - 50% 51% - 99% 100%
4% 12%
0% 7%
6%
20% 24% 33%
17% 12%
7% 9%
27% 27%
13% 32% 24%
25%
17%
29%
27% 27%
27% 0%
13%
4% 12%
8% 6%
20% 18%
7%
13%
25% 8% 18%
8%
4%
6% 9% 13%
20%
25% 36%
24% 25%
54%
35% 47%
36% 27%
33%
0%
25%
50%
75%
100%
Q3 14 Q4 14 Q1 15 Q2 15 Q3 15 Q4 15 Q1 16 Q2 16 Q3 16 Q4 16
% o
f R
esp
on
den
ts
≤1% 2% 3% 4% 5% >5%
Junior Debt Market Analysis
12
KBCM Junior Debt Market Analysis
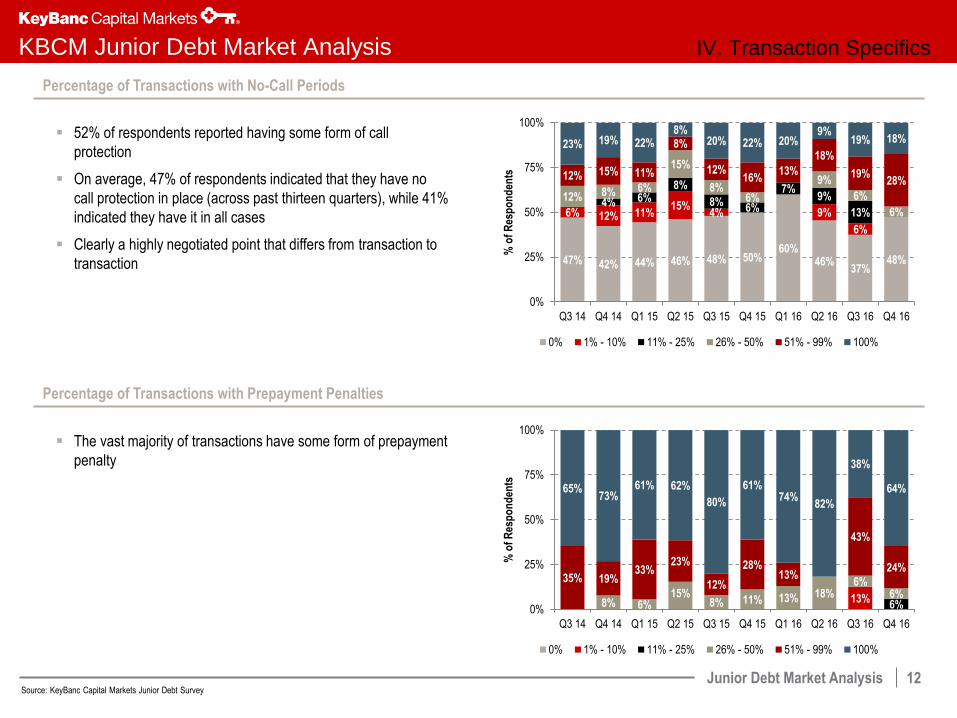
Percentage of Transactions with No-Call Periods
Percentage of Transactions with Prepayment Penalties
The vast majority of transactions have some form of prepayment
penalty
52% of respondents reported having some form of call
protection
On average, 47% of respondents indicated that they have no
call protection in place (across past thirteen quarters), while 41%
indicated they have it in all cases
Clearly a highly negotiated point that differs from transaction to
transaction
Source: KeyBanc Capital Markets Junior Debt Survey
IV. Transaction Specifics
47% 42% 44% 46% 48% 50% 60%
46% 37%
48%
6% 12% 11% 15%
4% 9%
6%
4% 6% 8%
8% 6%
7% 9%
13%
12% 8% 6%
15%
8% 6%
9%
6%
6%
12% 15% 11%
8%
12% 16%
13%
18%
19% 28%
23% 19% 22% 8%
20% 22% 20% 9%
19% 18%
0%
25%
50%
75%
100%
Q3 14 Q4 14 Q1 15 Q2 15 Q3 15 Q4 15 Q1 16 Q2 16 Q3 16 Q4 16
% o
f R
esp
on
den
ts
0% 1% - 10% 11% - 25% 26% - 50% 51% - 99% 100%
13% 6% 8% 6%
15% 8% 11% 13% 18%
6% 6%
35% 19% 33%
23%
12%
28% 13%
43%
24%
65% 73%
61% 62%
80%
61% 74%
82%
38%
64%
0%
25%
50%
75%
100%
Q3 14 Q4 14 Q1 15 Q2 15 Q3 15 Q4 15 Q1 16 Q2 16 Q3 16 Q4 16
% o
f R
esp
on
den
ts
0% 1% - 10% 11% - 25% 26% - 50% 51% - 99% 100%
Junior Debt Market Analysis
13
KBCM Junior Debt Market Analysis
Commentary
Second Lien Providers are Active Market Participants
Willingness to Complete a Second Lien Deal
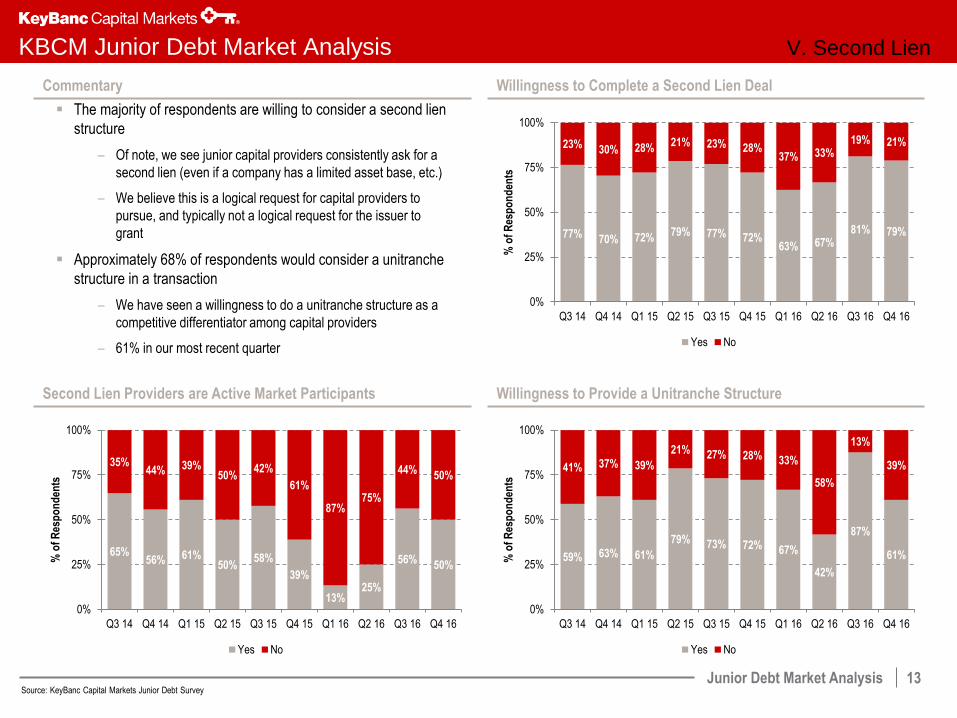
The majority of respondents are willing to consider a second lien
structure
– Of note, we see junior capital providers consistently ask for a
second lien (even if a company has a limited asset base, etc.)
– We believe this is a logical request for capital providers to
pursue, and typically not a logical request for the issuer to
grant
Approximately 68% of respondents would consider a unitranche
structure in a transaction
– We have seen a willingness to do a unitranche structure as a
competitive differentiator among capital providers
– 61% in our most recent quarter
Willingness to Provide a Unitranche Structure
Source: KeyBanc Capital Markets Junior Debt Survey
V. Second Lien
77% 70% 72% 79% 77% 72%
63% 67% 81% 79%
23% 30% 28% 21% 23% 28%
37% 33% 19% 21%
0%
25%
50%
75%
100%
Q3 14 Q4 14 Q1 15 Q2 15 Q3 15 Q4 15 Q1 16 Q2 16 Q3 16 Q4 16
% o
f R
esp
on
den
ts
Yes No
59% 63% 61%
79% 73% 72% 67%
42%
87%
61%
41% 37% 39%
21% 27% 28% 33%
58%
13%
39%
0%
25%
50%
75%
100%
Q3 14 Q4 14 Q1 15 Q2 15 Q3 15 Q4 15 Q1 16 Q2 16 Q3 16 Q4 16
% o
f R
esp
on
den
ts
Yes No
65% 56% 61%
50% 58%
39%
13% 25%
56% 50%
35% 44% 39%
50% 42%
61%
87% 75%
44% 50%
0%
25%
50%
75%
100%
Q3 14 Q4 14 Q1 15 Q2 15 Q3 15 Q4 15 Q1 16 Q2 16 Q3 16 Q4 16
% o
f R
esp
on
den
ts
Yes No
Junior Debt Market Analysis
14
KBCM Junior Debt Market Analysis VI. Conclusion
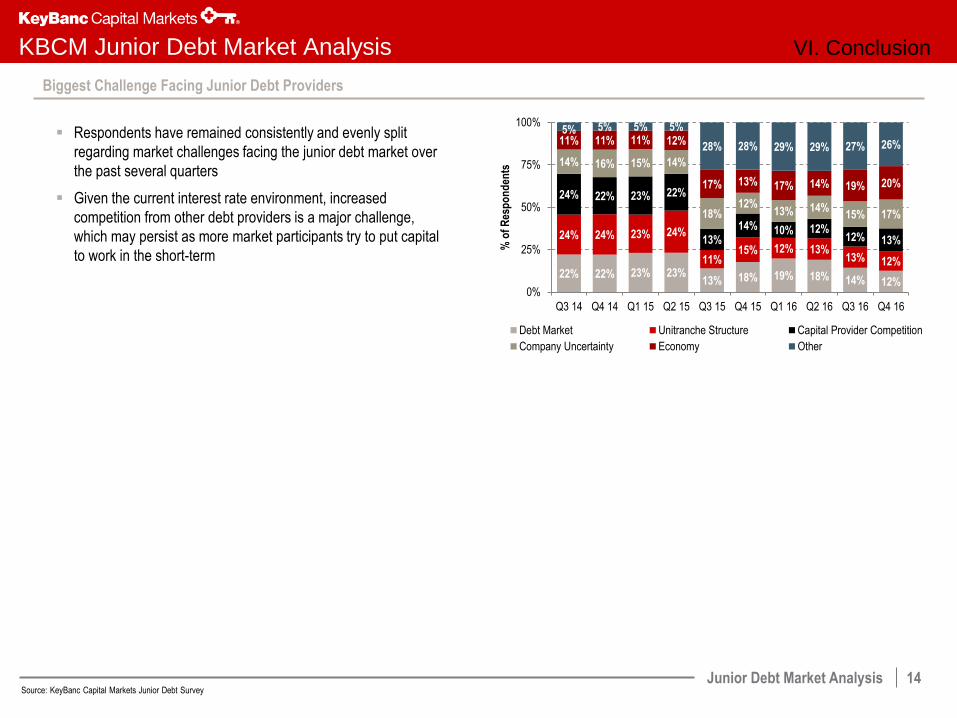
Biggest Challenge Facing Junior Debt Providers
Respondents have remained consistently and evenly split
regarding market challenges facing the junior debt market over
the past several quarters
Given the current interest rate environment, increased
competition from other debt providers is a major challenge,
which may persist as more market participants try to put capital
to work in the short-term
Source: KeyBanc Capital Markets Junior Debt Survey
22% 22% 23% 23% 13% 18% 19% 18% 14% 12%
24% 24% 23% 24%
11% 15% 12% 13%
13% 12%
24% 22% 23% 22%
13%
14% 10% 12% 12% 13%
14% 16% 15% 14%
18% 12%
13% 14% 15% 17%
11% 11% 11% 12%
17% 13% 17% 14% 19% 20%
5% 5% 5% 5%
28% 28% 29% 29% 27% 26%
0%
25%
50%
75%
100%
Q3 14 Q4 14 Q1 15 Q2 15 Q3 15 Q4 15 Q1 16 Q2 16 Q3 16 Q4 16
% o
f R
esp
on
den
ts
Debt Market Unitranche Structure Capital Provider Competition
Company Uncertainty Economy Other


