

Knowledge spillovers from renewable, clean, and smart energy technologies
Kimmo Ollikka*, Hanna-Liisa Kangas**, Kim Yukyeong** * VATT Institute for Economic Research, Finland ** Finnish Environment Institute SYKE IAEE Wien, September 2017

Note:
Results are very preliminary!

Climate Change – two externalities
• Negative externality of greenhouse gas pollution – Policies: Carbon pricing by Pigouvian tax or emissions
trading
• Positive externality of technology developement – Mitigation of climate change requires a switch from fossil
fuels to renewable energy sources
– Learning related to R&D and technology diffusion lowers the costs of renewable energy
– However, knowledge spillovers lower firms’ incentives of renewable energy R&D and investments
– Policies: R&D support, feed-in-tariffs, green certificates…
– Problem: The choice and targeting of policy instruments??

Smart energy transition
• Increasing share of intermittent electricity production poses challenges to electric power systems.
• Intermittent energy production causes more and frequent demand-supply mismatches and thus a need of flexibility to the power grid.
• New energy innovations that combine renewable energy solutions together with ICT solutions are becoming more valuable.

OBJECTIVES • We investigate the value of renewable, clean, and smart energy
innovations in terms of knowledge spillovers
METHODS • We use patent citations as indicator of knowledge spillovers generated
by patents in 1970 – 2011 • World Patent Statistical database PATSTAT (EPO) • We study
1. do smart energy inventions that are co-classified both as an energy technology and ICT receive more citations than pure energy technology inventions
2. differences in knowledge spillovers between energy technologies
• We utilize Poisson fixed effects (and zero-inflated Poisson regression) model
RESULTS • Smart energy patents receive more citations than pure energy patents. • Particularly, co-classified patents receive more citations from ICT
patents. • PV and wind energy patents are two most cited technology fields of
energy technologies.

Technologies (299 373 inventions) Cooperative patent classification (CPC) International Patent Classification (IPC)
1. Renewable energy technologies – Solar thermal energy (CPC: Y02E 10/40) – Photovoltaic (PV) energy (CPC: Y02E 10/50) – Wind energy (CPC: Y02E 10/70)
2. Clean combustion technologies – Combustion technologies with climate change mitigation potential
(CPC: Y02E 20/10, Y02E 20/30)
3. Combustion technologies – Combustion apparatus, combustion processes (IPC: F23)
• Smart technologies – ICT-related patents are classified based on the OECD identification – Semiconductor devices (IPC: H01L) are exluded from ICT class,
because most PV patents are also H01L-patents.

Numbers of renewable energy inventions have risen dramatically since the millennium
(A) Annual energy inventions (B) Shares of smart energy inventions

Dependent variable: forward citations
• Count of citations one invention, filed in year t, has received from other patents, which have been applied after year t
• Patent data and citation counts have been widely used in studying knowledge spillovers
• Citation counts underestimate the total effect of knowledge spillovers and are a noisy measure of knowledge flows: – All inventions are not patented
– Patent offices have different citation practices
– Self-citations: citation counts include also citations made to patents by the same inventor
– Truncation: new patents have not had time to receive as much citations than old patents

No clear trends in average citation counts
(A) Citations without self-citations
(B) Citations from ICT patents
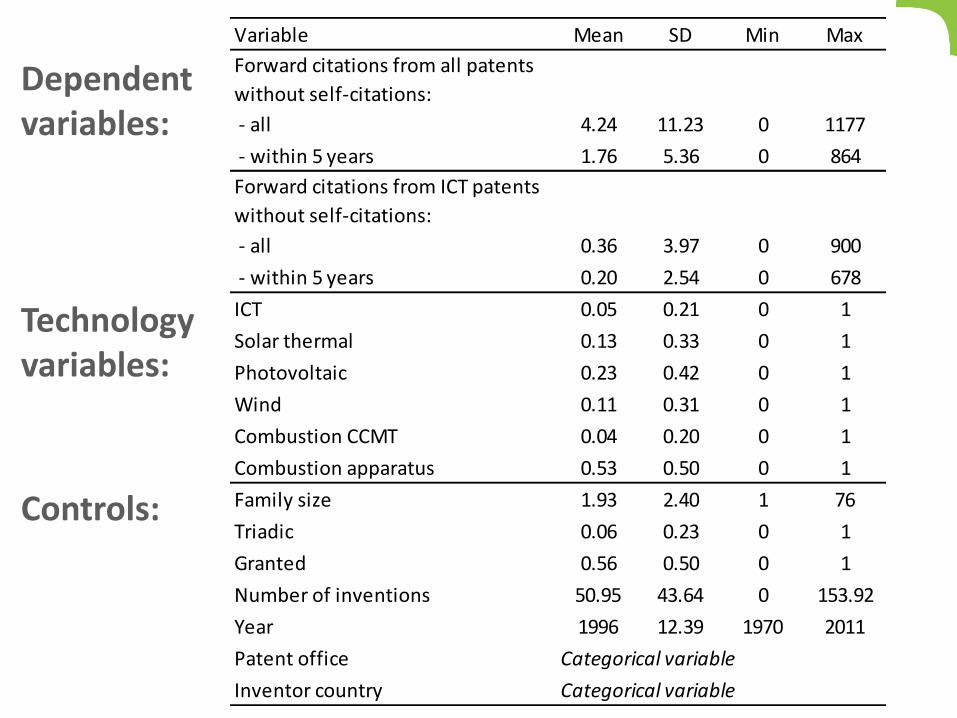
Dependent variables:
Variable Mean SD Min Max
Forward citations from all patents
without self-citations:
- all 4.24 11.23 0 1177
- within 5 years 1.76 5.36 0 864
Forward citations from ICT patents
without self-citations:
- all 0.36 3.97 0 900
- within 5 years 0.20 2.54 0 678
ICT 0.05 0.21 0 1
Solar thermal 0.13 0.33 0 1
Photovoltaic 0.23 0.42 0 1
Wind 0.11 0.31 0 1
Combustion CCMT 0.04 0.20 0 1
Combustion apparatus 0.53 0.50 0 1
Family size 1.93 2.40 1 76
Triadic 0.06 0.23 0 1
Granted 0.56 0.50 0 1
Number of inventions 50.95 43.64 0 153.92
Year 1996 12.39 1970 2011
Patent office Categorical variable
Inventor country Categorical variable
Technology variables:
Controls:

Estimation equation – Poisson fixed effects model
where – 𝐶𝑖 - number of citations to invention 𝑖 (count data) – 𝐼𝐶𝑇𝑖 – 1 if technology is co-classified as Energy + ICT – 𝑇𝑒𝑐ℎ𝑖 - technology of invention 𝑖 – 𝑋𝑖 - vector of controls: family size, triadic (1/0), granted (1/0), number
of inventions, country of inventor – Fixed effects: year-by-office – 휀𝑖 - error term
• Over-dispersion problem – Robust standard errors by Poisson pseudo-maximum likelihood.
• Problem: an excess of zero counts
– Zero-inflated Poisson model is also estimated
expi i i i i i iICT T TC ICT Tech ICT Tech X

All Within 5 years All Within 5 years
(1) (2) (3) (4)
Family size 0.056*** 0.060*** 0.056*** 0.057***
(0.002) (0.003) (0.005) (0.005)
Triadic 0.224*** 0.139*** -0.074 -0.196
(0.029) (0.033) (0.082) (0.101)
Granted 0.521*** 0.439*** 0.594*** 0.499***
(0.025) (0.023) (0.047) (0.050)
Number of inventions -0.004*** -0.005*** 0.004** -0.000
(0.000) (0.001) (0.001) (0.001)
ICT 0.309*** 0.273*** 2.713*** 2.474***
(0.063) (0.063) (0.130) (0.135)
Solar thermal 0.305*** 0.244*** 0.224*** 0.079
(0.022) (0.039) (0.066) (0.074)
Photovoltaic 0.661*** 0.563*** 1.599*** 1.363***
(0.020) (0.026) (0.085) (0.058)
Wind 0.598*** 0.361*** 0.911*** 0.817***
(0.024) (0.031) (0.113) (0.091)
Combustion CCMT 0.173*** 0.014 0.051 -0.016
(0.028) (0.043) (0.095) (0.090)
Combustion app. -0.059 0.056 -0.856*** -0.320***
(0.037) (0.097) (0.135) (0.091)
ICT : Solar thermal 0.023 -0.098 -0.211* -0.183
(0.061) (0.078) (0.097) (0.124)
ICT : Photovoltaic -0.209*** -0.063 -1.325*** -0.962***
(0.055) (0.053) (0.119) (0.100)
ICT : Wind -0.142* -0.001 -0.371** -0.292*
(0.059) (0.057) (0.127) (0.119)
ICT : Combustion CCMT -0.221* -0.132 0.020 0.005
(0.090) (0.108) (0.162) (0.177)
ICT : Combustion app. -0.055 0.030 0.258 0.176
(0.092) (0.085) (0.150) (0.140)
Controls / Fixed effects:
Year-by-office yes yes yes yes
Inventor country yes yes yes yes
N 298448.0 296000.0 278946.0 276301.0
Log pseudolikelihood -979318.4 -561742.5 -201439.8 -130860.5
Chi2 9956.1 8935.1 12232.6 14276.3
Dependent variable: Forward citations without self-citations
From all patents From ICT patents
Estimation results:
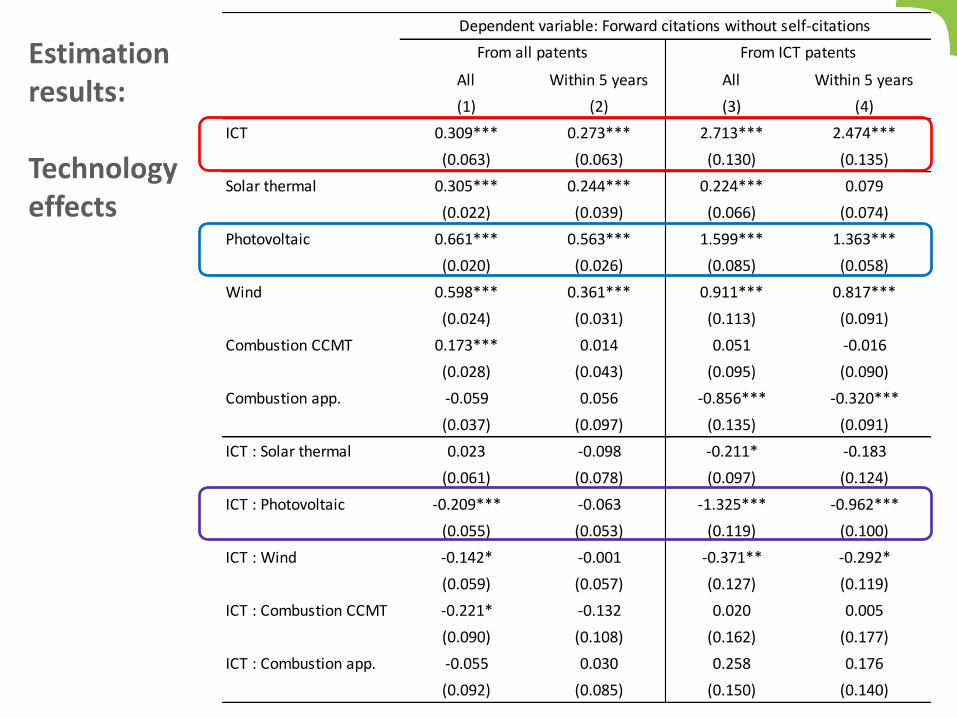
Estimation results: Technology effects
All Within 5 years All Within 5 years
(1) (2) (3) (4)
ICT 0.309*** 0.273*** 2.713*** 2.474***
(0.063) (0.063) (0.130) (0.135)
Solar thermal 0.305*** 0.244*** 0.224*** 0.079
(0.022) (0.039) (0.066) (0.074)
Photovoltaic 0.661*** 0.563*** 1.599*** 1.363***
(0.020) (0.026) (0.085) (0.058)
Wind 0.598*** 0.361*** 0.911*** 0.817***
(0.024) (0.031) (0.113) (0.091)
Combustion CCMT 0.173*** 0.014 0.051 -0.016
(0.028) (0.043) (0.095) (0.090)
Combustion app. -0.059 0.056 -0.856*** -0.320***
(0.037) (0.097) (0.135) (0.091)
ICT : Solar thermal 0.023 -0.098 -0.211* -0.183
(0.061) (0.078) (0.097) (0.124)
ICT : Photovoltaic -0.209*** -0.063 -1.325*** -0.962***
(0.055) (0.053) (0.119) (0.100)
ICT : Wind -0.142* -0.001 -0.371** -0.292*
(0.059) (0.057) (0.127) (0.119)
ICT : Combustion CCMT -0.221* -0.132 0.020 0.005
(0.090) (0.108) (0.162) (0.177)
ICT : Combustion app. -0.055 0.030 0.258 0.176
(0.092) (0.085) (0.150) (0.140)
Dependent variable: Forward citations without self-citations
From all patents From ICT patents

Smart energy inventions receive more citations than pure energy inventions
From all patents From ICT patents
All citations Within 5 years All citations Within 5 years
Mean | 0i i
C ICT 4.09 1.67 0.23 0.13
IRR, expICT
1.36 1.31 15.08 11.87
Mean | 0 1i i
C ICTE 5.56 2.20 3.46 1.56
Mean | 1i i
C ICT 7.34 3.60 3.01 1.70
On average (incidence rate ratio, IRR):
• 1.3 – 1.4 times more citations from all patents
• 11.9 – 15.1 times more citations from ICT patents.

Developement of the ICT coefficient estimate 𝜶𝑰𝑪𝑻

Technology effects - Incidence rate ratios
Pure energy patents: 𝒆𝒙𝒑 𝜷𝑻𝒆𝒄𝒉
𝒆𝒙𝒑 𝜷𝑪𝒐𝒎𝒃.𝒂𝒑𝒑.
Smart energy patents: 𝒆𝒙𝒑 𝜷𝑻𝒆𝒄𝒉+𝜶𝑰𝑪𝑻+𝜸𝑻𝒆𝒄𝒉
𝒆𝒙𝒑 𝜷𝑪𝒐𝒎𝒃.𝒂𝒑𝒑.
All
citations
Within 5
years
All
citations
Within 5
years
Solar thermal 1.4 1.2 2.9 1.5
Photovoltaic 2.1 1.7 11.6 5.4
Wind 1.9 1.4 5.9 3.1
Combustion CCMT 1.3 1.0 2.5 1.4
Combustion apparatus 1 1 1 1
ICT - Solar thermal 2.0 1.4 35.9 14.7
ICT - Photovoltaic 2.3 2.1 46.7 24.4
ICT - Wind 2.3 1.8 60.9 27.6
ICT - Combustion CCMT 1.4 1.1 38.1 16.2
ICT - Combustion apparatus 1.3 1.4 19.5 14.2
From all patents From ICT patents
Pure
energy
patents
Smart
energy
patents

Conclusions
• On average smart energy inventions receive more citations than pure energy inventions.
• PV and wind energy patents are most cited technology fields.
• When technology fields are converging, as it is the case with new energy and ICT technologies, the knowledge spreads widely also to other fields of technology.
• Supporting renewable energy R&D is a recommended policy option – not only for supporting the development of renewable energy
technologies narrowly – but supporting the development of clean and reliable energy
markets more widely.

Related literature
• Dechezleprêtre et al. (2014) – Patent citations as indicator of knowledge spillovers – Relative intensity of knowledge spillovers in clean and dirty
technologies in (i) energy production, and (ii) transportation. – Main result: Clean patents receive on average 43% more citations
than dirty patents.
• Noailly and Shestalova (2016)
– Knowledge spillovers generated by different renewable energy technologies and flows of them to other technological fields
– Wind, storage and solar patents tend to be the most frequently cited patents.
– Innovations in solar energy and storage technological fields find applications outside the field of power generation.
– Wind technologies mainly find applications within their own technological field.

Renewable and cumbustion technologies with climate change mitigation potential - Cooperative patent classification (CPC) Model variable Technology CPC code
Number of
inventions
Energy + ICT
inventions
- Geothermal energy Y02E 10/10 4175 99 (2%)
- Hydro energy Y02E 10/20 25233 394 (2%)
- Energy from sea Y02E 10/30 8077 60 (1%)
Solar thermal Solar thermal energy Y02E 10/40 47009 1437 (3%)
Photovoltaic Photovoltaic [PV] energy Y02E 10/50 88598 7592 (9%)
- Thermal-PV hybrids Y02E 10/60 1572 23 (1%)
Wind energy Wind energy Y02E 10/70 43504 2119 (5%)
Combustion
CCMT
Combined combustion Y02E 20/10 12015 436 (4%)
Technologies for a more efficient
combustion or heat usage Y02E 20/30 3522 61 (2%)
Model variable Technology IPC code Number of
inventions
Energy + ICT
inventions
Combustion
apparatus
Combustion apparatus,
combustion processes F23 178533 5335 (3%)
Combustion technologies - International Patent Classification (IPC)

Information and communication technologies - International Patent Classification (IPC)
Model
variable Technology IPC code
ICT
Telecommunications
G01S, G08C, G09C, H01P, H01Q,
H01S 3/(025, 043, 063, 067, 085, 0933, 0941, 103, 133,
18, 19, 25),
H01S5, H03B, H03C, H03D, H03H, H03M, H04B, H04J,
H04K, H04L, H04M, H04Q
Consumer electronics G11B, H03F, H03G, H03J, H04H, H04N, H04R, H04S
Computer, office machinery B07C, B41J, B41K, G02F, G03G, G05F, G06, G07, G09G,
G10L, G11C, H03K, H03L
Other ICT
G01B, G01C, G01D, G01F, G01G, G01H, G01J, G01K, G01L,
G01M, G01N, G01P, G01R, G01V, G01W, G02B6, G05B,
G08G, G09B, H01B11,
H01J (11/, 13/, 15/, 17/, 19/, 21/, 23/, 25/, 27/, 29/,
31/, 33/, 40/, 41/, 43/, 45/)
• ICT-related patents are classified based on the OECD identification – Semiconductor devices (H01L) are exluded from ICT class, because
most PV patents are also H01L-patents.

Technology Inventions
Family size
(mean) Triadic (%) Granted (%) ICT (%)
Solar thermal 38 481 1.74 2.5 % 51.5 % 3.3 %
Photovoltaic 67 366 2.12 9.8 % 52.3 % 9.2 %
Wind 32 405 2.14 4.7 % 52.7 % 4.6 %
Combustion CCMT 12 984 2.81 11.1 % 59.5 % 3.2 %
Combustion apparatus 158 750 1.85 4.5 % 58.8 % 3.1 %
Total 299 373 1.93 5.5 % 55.8 % 4.6 %
Inventions of energy technologies in 1970 – 2011

Top 5 patent offices
NSolar
thermalPV Wind
Comb.
CCMT
Comb.
app.Mean SD Max
Japan 121 355 8 % 26 % 4 % 4 % 60 % 2.20 6.82 1133
USA 37 362 16 % 26 % 12 % 7 % 46 % 14.56 20.56 1177
Germany 24 221 19 % 15 % 15 % 6 % 50 % 4.51 8.19 268
China 21 885 26 % 19 % 21 % 3 % 34 % 1.77 3.05 80
Korea (South) 16 686 9 % 40 % 16 % 2 % 36 % 1.51 4.07 252
Other offices 63 335 16 % 10 % 16 % 3 % 59 % 2.29 6.60 390
Multiple offices 14 529 11 % 37 % 16 % 7 % 36 % 9.60 20.41 838
Total 299 373 13 % 23 % 11 % 4 % 53 % 4.24 11.23 1177
InnovationsForward citations without
self-citations

Estimation results: Controls
All Within 5 years All Within 5 years
(1) (2) (3) (4)
Family size 0.056*** 0.060*** 0.056*** 0.057***
(0.002) (0.003) (0.005) (0.005)
Triadic 0.224*** 0.139*** -0.074 -0.196
(0.029) (0.033) (0.082) (0.101)
Granted 0.521*** 0.439*** 0.594*** 0.499***
(0.025) (0.023) (0.047) (0.050)
Number of inventions -0.004*** -0.005*** 0.004** -0.000
(0.000) (0.001) (0.001) (0.001)
Controls / Fixed effects:
Year-by-office yes yes yes yes
Inventor country yes yes yes yes
N 298448.0 296000.0 278946.0 276301.0
Log pseudolikelihood -979318.4 -561742.5 -201439.8 -130860.5
Chi2 9956.1 8935.1 12232.6 14276.3
Note: * p<0.05, ** p<0.01, *** p<0.001
Dependent variable: Forward citations without self-citations
From all patents From ICT patents

• Incidence rate ratios for coefficient estimates: – Non-ICT: 𝒆𝒙𝒑 𝜷𝑻𝒆𝒄𝒉
– ICT: 𝒆𝒙𝒑 𝜷𝑻𝒆𝒄𝒉 + 𝜶𝑰𝑪𝑻 + 𝜸𝑻𝒆𝒄𝒉
Technology effects: citations without self-citations

• Incidence rate ratios for coefficient estimates: – Non-ICT: 𝒆𝒙𝒑 𝜷𝑻𝒆𝒄𝒉
– ICT: 𝒆𝒙𝒑 𝜷𝑻𝒆𝒄𝒉 + 𝜶𝑰𝑪𝑻 + 𝜸𝑻𝒆𝒄𝒉
Technology effects: citations without self-citations within 5 years
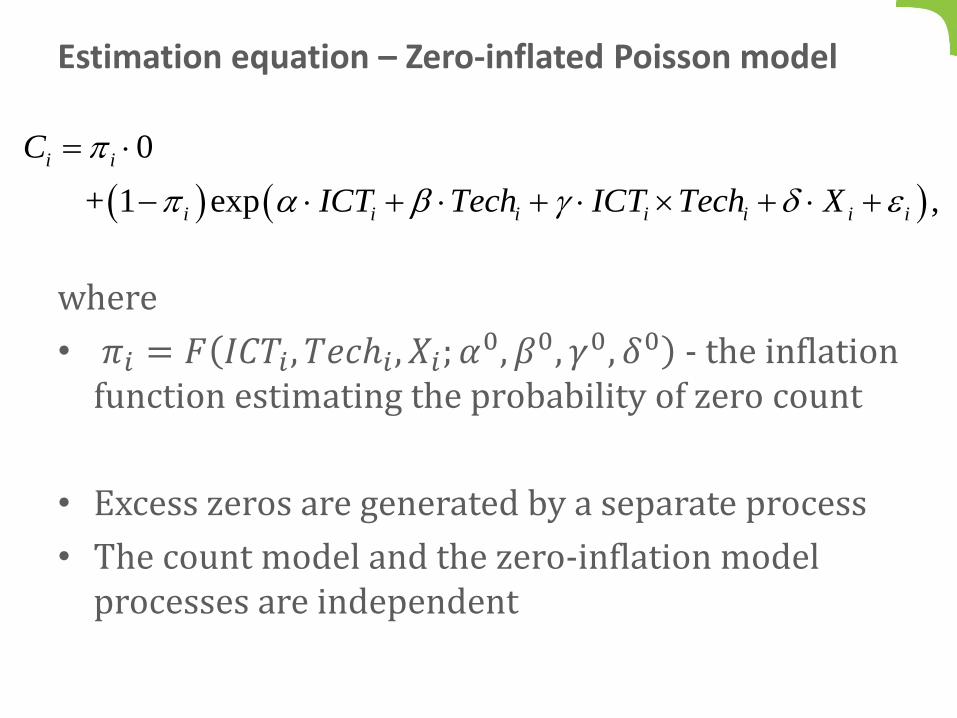
Estimation equation – Zero-inflated Poisson model
where
• 𝜋𝑖 = 𝐹 𝐼𝐶𝑇𝑖 , 𝑇𝑒𝑐ℎ𝑖 , 𝑋𝑖; 𝛼0, 𝛽0, 𝛾0, 𝛿0 - the inflation
function estimating the probability of zero count
• Excess zeros are generated by a separate process
• The count model and the zero-inflation model processes are independent
0
+ 1 exp ,
i i
i i i i i i i
C
ICT Tech ICT Tech X

All
citations
Within 5
years
All
citations
Within 5
years
Solar thermal 1.5 1.3 3.4 1.9
Photovoltaic 2.3 1.9 10.4 5.5
Wind 2.0 1.5 5.5 3.2
Combustion CCMT 1.4 1.2 3.2 2.0
Combustion apparatus 1 1 1 1
ICT - Solar thermal 2.3 1.6 37.7 16.7
ICT - Photovoltaic 2.5 2.3 47.3 26.7
ICT - Wind 2.5 2.2 70.0 32.3
ICT - Combustion CCMT 1.6 1.3 41.6 19.7
ICT - Combustion apparatus 1.3 1.3 21.5 14.1
Pure
energy
patents
Smart
energy
patents
From all patents From ICT patents
Zero-inflated Poisson model - Technology effects
, ,exp 1 Pr 0
PV ICT PV ICT PV ICT PV ICTIRR C


