

Land Use Land Cover Change Detection
Using Remote Sensing Data and GIS Tools :
A Case Study of Delhi State
Submitted for partial fulfillment of the degree of
MASTER OF SCIENCE
In
GEO-INFORMATICS
By
RAJENDER KUMAR MEHTA
Regn. No. 820867661
SIKKIM MANIPAL UNIVERSITY
GANGTOK, SIKKIM
2011

SIKKIM MANIPAL UNIVERSITY
GANGTOK, SIKKIM
CERTIFICATE
This is certify that this dissertation entitled “Land Use Land Cover Change Detection
Using Remote Sensing Data and GIS Tools : A Case Study of Delhi State” that is being
submitted to Sikkim Manipal University, Gangtok, Sikkim in partial fulfillment of the degree
of Master of Science, has not been submitted elsewhere for any other degree or diploma. This
is my original research carried out at Centre for Inter-disciplinary Studies of Mountain & Hill
Environment, University of Delhi.
Supervisor Candidate
(Dr. Dawa Dorje) (Rajender Kumar Mehta)
Centre for Inter-disciplinary Studies of
Mountain & Hill Environment
University of Delhi,
Delhi
Head
(Professor Maharaj K. Pandit)
Department of Environmental Biology
University of Delhi, Delhi

ACKNOWLEDGEMENT
First, I would like to thank my mentor Professor Maharaj K. Pandit, Head,
Department of Environmental Studies and Director, Centre for Inter-disciplinary Studies of
Mountain & Hill Environment (CISMHE), University of Delhi, Delhi for giving me the
guidance, support, encouragement, valuable time and most importantly for creating
opportunities for me to work in GIS lab at CISMHE which helped me to broaden my
knowledge and experience. I would like to acknowledge sincere gratitude to Dr. Dorje Dawa,
Supervisor, CISMHE, University of Delhi for his cooperation and insightful comments and
thoughtful evaluation to carry out this dissertation work.
I am grateful to Dr. J.P. Bhatt, Dr. D.C. Nautiyal, Sr. Scientists at CISMHE,
University of Delhi for their academic guidance and emotional support. I am also thankful to
Mr. Ajay Kumar Gaur who has always supported and encouraged me during this study. I am
thankful to Mrs. Sheela, Mr. Satpal, Ms. Laxmi, Mr. Basudev Singh, Mr. Rohit Kumar, Ms.
Sudha, Mr. Dharam Singh, Mr. Yeshpal, Mr. Kalam Singh and Mr. Digambar Singh for their
cooperation.
I am especially thanks to my family, loving wife and children for their support.
Finally, I wish to acknowledge sincere gratitude towards my father and heavenly
mother for being me throughout the project.
(RAJENDER KUMAR MEHTA)

Preface
This dissertation work is aimed at describing the change detection of land use/ land
cover using remotely sensed data and geographic information systems (GIS) tools. Chapter 1
introduces the human population growth, spatial spread of built-up area and loss of arable
land and natural vegetation in major cities such as Delhi, Mumbai, Kolkata, Chennai, etc.
Chapter 2 gives the state of the art of Land use/ Land cover change in urbanized cities
in India and a detailed literature review was carried out for Urbanization in NCT Delhi. The
literature review shows that only a few studies have been conducted on land use/ land cover
change using the modern tools and technique of Remote sensing and GIS. In fact, multi-
temporal satellite data has not been much used in the NCT Delhi to study the phenomenon of
land use land cover change. Chapter 3 discusses detailed methodology and models developed
for this investigation as well as different sources of satellite database and softwares.
Chapter 4 gives the analysis and interpretation of results of the satellite data for three
different time periods to quantify the spatial growth and urban sprawl pattern in NCT Delhi.
Chapter 5 entails the conclusions of the study.
The broad results of the study show that natural areas such as forests as well as
agricultural land are being transformed into built up areas. Much of the agricultural land
areas are getting converted into impervious areas - residential colonies and road
infrastructure. The pattern of spatial sprawl exhibits a positive correlation with roads and
settlements. The spatial database developed in this study would help in carrying out more
elaborate studies on land use and land cover changes in Delhi NCR and help in proper land
use planning.

CONTENTS
Page No.
1. INTRODUCTION 1
1.1 Statement of the Problem 3
1.2 Study Area 4
1.3 Objective of the Study Area 7
2. REVIEW OF LITERATURE 8
3. METHODOLOGY 12
3.1 Introduction 12
3.2 Data Source 12
3.3 Base Map Preparation 14
3.4 Software and Pla tforms 15
3.5 Geo-reference Properties 15
3.6 Geometric Correction 18
3.7 Radiometric Correction 20
3.8 Noise Removal 24
3.9 Image Enhancement 25
3.10 Image Classification 26
3.11 Post Classification Smoothing 28
4. DATA ANALYSIS AND INTERPRETATION 30
4.1 Introduction 30
5. SUMMARY AND CONCLUSION 41
5.1 Future Studies 42
6. BIBLIOGRAPHY 43

LIST OF TABLES
Table 1. Data source
Table 2. District-wise population in NCT of Delhi, 1981-2011
Table 3. Area (ha) and percentage of the land use/ land cover categories of different
years (1987, 1999 & 2006) of the study area
Table 4. Area (ha) difference between land use/ land cover categories in different years

LIST OF FIGURES
Figure 1.1 The growth of population in Delhi state
Figure 1.2 Map showing Delhi state in National Capital Region (NCR)
Figure 1.3 District map of Delhi state
Figure 3.1 Flow chart for land use/ land cover map classification
Figure 3.2 Landsat TM 1987 satellite imagery scene of the study area
Figure 3.3 Landsat ETM+ 1999 satellite imagery scene of the study area
Figure 3.4 IRS-P6, LISS-III 2006 satellite imagery scene of the study area
Figure 3.5 Matrix of geometrically correct output pixels superimposed on matrix of
original, distorted input pixels
Figure 3.6 Radiometric response function for an individual TM channel
Figure 4.1(a-c) Human population growth vs. built-up Area
Figure 4.2 Land use/ land cover map generated from Landsat TM scene, 1987 of the study
area
Figure 4.3 Land use/ land cover map generated from Landsat ETM+, 1999 of the study
area
Figure 4.4 Land use/ land cover map generated from IRS-P6 LISS-III, 2006 of the study
area
Figure 4.5 Comparative built-up areas of the study area during different years
Figure 4.6 The spread of built-up area during different years
Figure 4.7 Overlay of built-up area in the years of 1987 to 1999
Figure 4.8 Overlay of built-up area in the years 1999 to 2006
Figure 4.9 Area (ha) of forest types and cultivated area in different years
Figure 4.10 Map showing loss of forest and cultivated area in different years

Chapter 1
Introduction

Land Use Land Cover Change Detection Using A Case Study of Delhi State Remote Sensing Data and GIS Tools
Rajender Kumar Mehta, Regn. No. 820867661 - M.Sc. - 2011 1
1
INTRODUCTION
Urbanization is one of the most widespread anthropogenic causes of the loss of arable land
(Lopez, et al., 2001), habitat destruction (Alphan, 2003), and the decline in natural vegetation
cover. One of the major reasons of urbanization is rapid population growth in the urban area.
Apparently, the urban population has grown exponentially and by 2011, for the first time in
human history, more people in the world will be living in cities and towns than in rural areas.
Furthermore, by 2017 the developing world is likely to have become more urban in character
than rural, therefore, the vast majority of urban growth is now occurring in the developing
world (UN-Habitat, 2003). It is very much true in case of India, China, Bangladesh, etc.
where urbanization is going on at a high environmental cost.
In India 79 million people lived in urban areas in 1961 but this figure has reached to
285 million people in the 2001 year (Rahman, et al., 2011). Consequently, the metropolitan
cities are magnified spatially and large areas are being transformed into built-up areas such as
colonies, industrial development and infrastructure projects. In 1991, there were 23
metropolitan cities in India (Census, 1991) which increased to 35 in 2001 (Census, 2001).
Some of the large urbanized areas in India are Mumbai, Delhi, Kolkata and Chennai, etc.
As urban population increases, the demand of land for various urban activities also
increases. In India the process of urbanization gained momentum with the start of industrial
revolution and globalization way back in 1970s. Forests, grasslands, wetlands and croplands

Land Use Land Cover Change Detection Using A Case Study of Delhi State Remote Sensing Data and GIS Tools
Rajender Kumar Mehta, Regn. No. 820867661 - M.Sc. - 2011 2
were encroached upon under the influence of expanding cities, yet never as fast as in the last
decade. Various studies have revealed that main basis of urbanization is the socio-economic
transformations and in particular the growth of secondary and tertiary occupation in urban
areas (Fazal, 2001).
Therefore, the increased rate of population in major cities has led to many
environmental and socio-economic consequences like urban expansion, inadequate housing,
poor transportation system, poor sewerage, erratic electric supply, insufficient drinking
water, etc. The phenomena of accelerated urbanization is the main culprit, wherein besides
bringing higher standard of living has also brought problems of growth of dense and
unplanned residential areas, environmental pollution, non-availability of services and
amenities and solid waste generation and growth of slums. Therefore, the present study is
aimed at assessing the urbanization in Delhi over the period of 19 years (1987-2006) using
remote sensing technology and spatial functionalities technique in Geographical information
system (GIS).
In the past decade rapid advancement of information technology (IT) and Remote
Sensing science, which not only enabled to develop high quality spatial data layers. e.g.,
IKONOS but also provided low cost global spatial data (Landsat TM & ETM+, SRTM). This
database source forms an important component for preliminary studies on urbanization and
environmental studies (Zomer and Ives, 2002). One of the objectives of this study is to
prepare urban-GIS database which further aims at providing a platform for future
environmental studies subjected to Land Use Land Cover (LULC) change. The key role of
this study would be to contribute in preliminary impact analysis of urbanization. Therefore
Geographic Information System (GIS) and remote sensing are powerful and cost effective

Land Use Land Cover Change Detection Using A Case Study of Delhi State Remote Sensing Data and GIS Tools
Rajender Kumar Mehta, Regn. No. 820867661 - M.Sc. - 2011 3
tools for assessing the spatial and temporal dynamics of LULC (Lillesand & Kiefer, 2000).
Remote sensing data provide valuable and moreover spatio-temporal data on the processes
and patterns of LULC change, and GIS is useful for mapping and analyzing these patterns
(Taubenbock et.al, 2009). In this study I explore the temporal and spatial characteristics of
urban expansion and LULC change of Delhi from 1987 to 2006.
1.1 Statement of the Problem
Delhi and its adjoining satellite cities with large number of public sectors, private sectors,
industrial establishment, infrastructural and large residential colonies is now providing large
number of opportunities to different classes of the society. Moreover it has now become a
major opportunity hub in India for working population. Therefore the national capital region
Delhi has drawn people from all parts of India. Delhi has witnessed a phenomenal population
growth during the past century. As shown in the Figure 1.1 from the population census data
the population of Delhi has dramatically increased from 0.46 million in 1901 to 16.7 million
in 2011 (Census, 2011). Now Delhi has (4.1%) of highest population growth of all the mega
cities in the world (Taubenbock et.al, 2009).
With the population growth, built-up areas in Delhi are rapidly increasing and it is
leading to several environmental consequences (air and water pollution, traffic congestion,
urban heat island formation, etc.) On the other hand there is growing socio-economic
disparity (epidemic break outs, social disparity, informal economy). Hence the urban
environment in Delhi is under severe stress due to the pressure of rapid urbanization.
Consequently urbanization has deteriorated the overall quality of the urban environment in
Delhi. In order to mitigate and minimize the detrimental effects associated with urban growth

Land Use Land Cover Change Detection Using A Case Study of Delhi State Remote Sensing Data and GIS Tools
Rajender Kumar Mehta, Regn. No. 820867661 - M.Sc. - 2011 4
on the environment and to maintain optimal ecosystem functioning, spatial and temporal
LULC patterns, and the factors affecting these changes are considerably important in
developing rational economic, social and environmental policies.
1.2 Study Area
The study area covers an area of 1483 sq km which falls under Delhi Metropolitan city as per
Census, 1991. Delhi city is the capital of India and it is located in the coordinates of 76.96o E,
28.44o N, by 77.40oE, 28.76o N. Besides Delhi is adjoined by couple of large satellite cities
which is also called as National Capital region (NCR). Some of the large satellite cities
comprise Gurgaon, Noida, Faridabad and Ghaziabad (Figure 1.2). In the larger geographic
context Delhi is situated between the Himalayas in the north and Aravalis mountains and the
Yamuna in the southern and eastern parts, respectively. The elevation of the city ranges
between 213 m and 290 m. The area is characterized by hot and dry summers and fairly cold
winters with summer time high temperatures that can reach 45oC. Rainfall is dominated by
monsoonal weather pattern, with maximum rainfall occurring from June to September.
Union territory status of Delhi continued till the introduction of the National Capital
Territory (Delhi) Act 1991, by which Delhi became the National Capital Territory of Delhi
with effect from January, 1992. During the time of 1961 census, Delhi had only one district
and one tehsil. From 1971-1991 Census, Delhi revenue district was divided into two tehsils,
known as Delhi tehsil and Mehrauli tehsil. The situation changed in 1996, as shown in
Figure 1.3 Delhi was divided into 9 revenue districts and 27 sub-divisions coterminous with
tehsils. This was the administrative set up that prevailed during the 2001 census, and stands
unchanged.

Land Use Land Cover Change Detection Using A Case Study of Delhi State Remote Sensing Data and GIS Tools
Rajender Kumar Mehta, Regn. No. 820867661 - M.Sc. - 2011 5
1.3 Objective of the Study
The main objectives of the study are as follows :
• To prepare multi-temporal GIS database for the future LULC change studies
• Provide a platform for future environmental studies concerned with LULC change.
• To assess the spatial and multi-temporal LULC change of Delhi and to evaluate the
LULC changes between 1987-2006
• To explore the spatial and temporal characteristics of urban expansion in this period
• To analyze the driving forces of land use and land cover change and urban expansion.

Figure 1.1 The growth of population in Delhi state (Source: Census, 2011)
0
2000
4000
6000
8000
10000
12000
14000
16000
18000
1901 1911 1921 1931 1941 1951 1961 1971 1981 1991 2001 2011
Year
Po
pu
lati
on
('00
0)

Figure 1.2 Map showing Delhi state in National Capital Region (NCR)

Figure 1.3 District map of Delhi state

Chapter 2
Literature Review

Land Use Land Cover Change Detection Using A Case Study of Delhi State Remote Sensing Data and GIS Tools
Rajender Kumar Mehta, Regn. No. 820867661 - M.Sc. - 2011 6
2
LITERATURE REVIEW
Land Use Land Cover (LULC) in urbanized areas is often a mosaic of human induced land
uses; infrastructure (roads, bridges, railways), built-up area, agricultural land, drainage/
water-bodies, waste land, etc. Therefore, conventional ground methods of land use mapping
become labor intensive and time consuming. These maps soon become outdated with the
passage of time, particularly in a rapidly changing environment. In fact, according to
Olorunfemi (1983), monitoring changes and time series analysis is quite difficult with
traditional method of surveying. In the last three decades there are large numbers of studies
carried out on LULC change. Many authors have convincingly argued that LULC change in
urbanized area is different from that of non-urbanized area (Cohen, 2006). Urbanized areas
are predominantly covered with impervious area or built-up area with scattered & fragmented
natural area.
Emergence of low cost satellite imageries from Global Land Cover Facility mapping
(GLCF, http://glcfapp.umiacs.umd.edu:8080/esdi/index.jsp) has now made it possible to
study the historical LULC data and monitor changes at regular intervals of time. Ever since
the launch of the first remote sensing satellite (Landsat-1) in 1972, LULC studies were
carried out on different scales for different users. Xiaomei Y et al. (1999) noted that
information about change is necessary for updating land cover maps and the management of
natural resources.

Land Use Land Cover Change Detection Using A Case Study of Delhi State Remote Sensing Data and GIS Tools
Rajender Kumar Mehta, Regn. No. 820867661 - M.Sc. - 2011 7
Hence by using the historical/ multi-temporal data and with the help of GIS
functionalities we can now access and evaluate the land use/ land cover change over a given
period of time of an area and it is called as change detection technique. Change detection
technique has proved to be of immense use in studying the processes of urbanization and
spatial growth of urban features. Therefore, Singh (1989) defined change detection technique
as a process of identifying differences in the state of an object or phenomenon by observing it
at different times. Besides it is an important process in monitoring and managing natural
resources and urban development because it provides quantitative analysis of spatial land
cover and land use. Macleod and Congation (1998) list four aspects of change detection: i)
Detecting the changes that have occurred, ii) identifying the nature of the change, iii)
measuring the area extent of the change, and iv) assessing the spatial pattern of the change.
Therefore data on land use change are of great importance to planners and environmentalist
in monitoring the environmental consequences of land use change. Such data and techniques
are of value to resources management and agencies that plan and assess land use patterns and
in modeling and predicting future changes. In this study change detection technique has also
been used to assess the LULC change in Delhi.
LULC has become widely studied phenomenon in landscape ecology, climate change,
earth science and ecology. Therefore, directly or indirectly LULC change affects the climate,
geology and environmental process. One of the first exercises carried out in land use land
cover change in NCR was that by CISMHE (1993) which was perhaps a maiden attempt to
record the land use change over the three decades of urbanization and its impact of Delhi’s
environmental resource base. The study also made some important recommendations to the
Central Ministry of Environment & Forests, Government of India. Pandy and Nathawat

Land Use Land Cover Change Detection Using A Case Study of Delhi State Remote Sensing Data and GIS Tools
Rajender Kumar Mehta, Regn. No. 820867661 - M.Sc. - 2011 8
(2006) carried out a study on land use land cover mapping of Panchkula, Ambala and
Yamunanger districts of Haryana state in India. They observed that the heterogeneous
climate and physiographic conditions in these districts has resulted in the development of
different land use land cover in these districts. A maiden study on Himalayan land use land
cover was carried out recently by Pandit et al. (2007) wherein the authors highlighted the
extensive deforestation in the region with serious consequences on native biodiversity.
Beside there are large number of studies carried out in developing countries on LULC
mappings and change. Moreover, the studies related to urbanization in the least developed
countries are significantly increasing over the last decade. Most of the techniques and
methods used are conventional ground mapping, GIS and remote sensing technique and
survey methods (Taubenbock et.al, 2009).
It is also true in case of India having a large numbers of studies conducted on
urbanization and LULC change in the last decade. Literature review on LULC change and
urbanization in India has resulted in 35 published scientific papers. Out of which most of the
studies have been carried out using remote sensing technology. A comprehensive study on
LULC change and urbanization in India was carried out by Taubenböck et al. (2009). This
study was carried out in 12 major cities, namely: i) Mega cities like Mumbai, Kolkatta and
Delhi, ii) incipient mega cities including Hyderabad, Bengaluru, Ahmadabad, Chennai, and
iii) urban agglomeration comprising Pune, Jaipur, Kanpur, Surat and Lucknow. These
authors used remote sensing technology and change detection technique. They assessed the
similarities and difference between spatial growth patterns in the 12 cities. Beside they
quantified the spatio-temporal growth pattern and found that incipient mega cities are
mimicking the spatial growth pattern of mega cities.

Land Use Land Cover Change Detection Using A Case Study of Delhi State Remote Sensing Data and GIS Tools
Rajender Kumar Mehta, Regn. No. 820867661 - M.Sc. - 2011 9
Furthermore, a detailed literature survey on LULC change in Delhi was carried out
simultaneously and more precisely by Wentz et al. (2007). These authors conducted a study
on urban LULC change of Delhi and later a comparative study with Phoenix Arizona, USA
was carried out. They used an expert system transferability model developed by Stefanov and
Netzband (2005) for Phoenix. Expert system transferability model is based on the spectral
signatures of remotely sensed data. However, they failed to address the LULC change and
they lacked the spatio-temporal data for the study. In an another study Rahman et al. (2011)
carried out a detail study of LULC change in the eastern district of Delhi, however, they
failed to address the issue over the entire study area. Moreover the study was focused on the
quality of urban environment. They assessed the urban environmental quality with built-up
area, open spaces, household density, occupancy ratio, population density, accessibility to
roads, noise and smell affected area. The study depicts that urban environment has been
largely degraded when compared from 1982 and 2003. Therefore, this present study will
cover entire Delhi and moreover the LULC change will be studied for three different time
periods (1987, 1999 & 2006) using the GIS and remote sensing technology.

Chapter 3
Methodology

Land Use Land Cover Change Detection Using A Case Study of Delhi State Remote Sensing Data and GIS Tools
Rajender Kumar Mehta, Regn. No. 820867661 - M.Sc. - 2011 10
3
METHODOLOGY
3.1 Introduction
The procedure adopted in the research work forms the basis for deriving statistics of land
use/ Land cover and subsequently the change. Land use land cover of entire Delhi NCT was
carried out from three sets of satellite imageries retrieved for three different time periods
(1987, 1999 & 2006). Hybrid land use land cover classification technique was used for image
processing. In addition, ground truthing was carried out for several points (Figure 3.1).
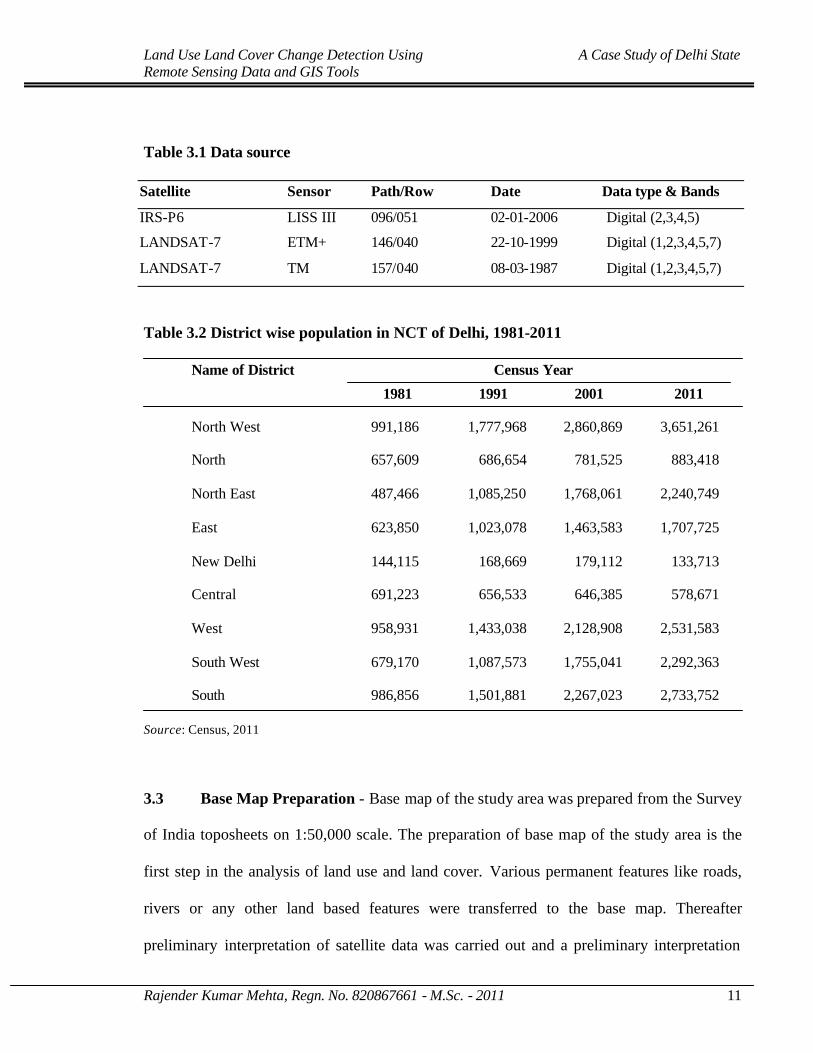
3.2 Data Source
For the study, Landsat satellite images of Delhi state were acquired for three time periods;
1987, 1999 from Global Land Cover Facility, an earth science data interface (GLCF,
http://glcfapp.umiacs.umd.edu:8080/esdi/index.jsp) while IRS-P6 LISS-III, for the year 2006
was obtained from NRSA, Hyderabad (Table 3.1). The administrative state boundary map
was also brought to Universal Transverse Mercator project in zone 43 and later the satellite
imageries were clipped with the administrative boundary of Delhi. As shown in the Figures
3.2-3.4 the different False Colour Composite (FCC) of Delhi for different periods were
prepared. Furthermore, population census of Delhi was also acquired from Census data,
2011. Population of Delhi from 1981-2011 was used and it was divided district-wise (see
Table 3.2).

Figure 3.1 Flow chart for land use/ land cover map classification
Raw Satellite Data
Downloading of Data
Translation of Data
Generation of FCC
Land use/land cover Map of Study Area
- Geometric Correction Pre Processing Radiometric Correction
Image smoothing (3x3 majority filter)
Classified Output (Land use/ land cover classes)
Classification
Using A priori Knowledge Ground Truth
Hybrid classification
Transformation
model
Creation of
Mask Files
Land Use Land Cover Change Detection Using A Case Study of Delhi State Remote Sensing Data and GIS Tools
Rajender Kumar Mehta, Regn. No. 820867661 - M.Sc. - 2011 11
Table 3.1 Data source
Satellite Sensor Path/Row Date Data type & Bands
IRS-P6 LISS III 096/051 02-01-2006 Digital (2,3,4,5)
LANDSAT-7 ETM+ 146/040 22-10-1999 Digital (1,2,3,4,5,7)
LANDSAT-7 TM 157/040 08-03-1987 Digital (1,2,3,4,5,7)
Table 3.2 District wise population in NCT of Delhi, 1981-2011
Name of District Census Year
1981 1991 2001 2011
North West 991,186 1,777,968 2,860,869 3,651,261
North 657,609 686,654 781,525 883,418
North East 487,466 1,085,250 1,768,061 2,240,749
East 623,850 1,023,078 1,463,583 1,707,725
New Delhi 144,115 168,669 179,112 133,713
Central 691,223 656,533 646,385 578,671
West 958,931 1,433,038 2,128,908 2,531,583
South West 679,170 1,087,573 1,755,041 2,292,363
South 986,856 1,501,881 2,267,023 2,733,752
Source: Census, 2011
3.3 Base Map Preparation - Base map of the study area was prepared from the Survey
of India toposheets on 1:50,000 scale. The preparation of base map of the study area is the
first step in the analysis of land use and land cover. Various permanent features like roads,
rivers or any other land based features were transferred to the base map. Thereafter
preliminary interpretation of satellite data was carried out and a preliminary interpretation

Land Use Land Cover Change Detection Using A Case Study of Delhi State Remote Sensing Data and GIS Tools
Rajender Kumar Mehta, Regn. No. 820867661 - M.Sc. - 2011 12
key was prepared. The preliminary interpreted maps thus prepared were taken to field for
ground checking.
3.4 Software and Platforms : Image processing was carried out by standard method
followed by ground truth collection. Preparation of thematic maps from the digital satellite
data was carried out by using ERDAS Imagine ver. 9.1 and ArcGIS ver. 9.1. Standard
methods, which included use of image elements like tone, texture, shape, location,
association, pattern, etc., of digital image processing were adopted for vegetation mapping
and ancillary information like elevation and landforms. These interpretation elements were
followed by the preparation of interpretation key. This entire work was carried out at GIS-
Remote Sensing Laboratory at CISMHE, University of Delhi.
3.5 Geo-reference Properties
The shape of the earth is approximately spherical, locations on the earth’s surface are often
described in an angular coordinate or geographical system, with latitude and longitude
specified in degrees (o), minutes (’) and seconds (”). This system originated in ancient Greece
and now it is familiar with most users globally. Unfortunately, the calculation of distances and
areas in an angular coordinate system is complex. More significantly, it is impossible to
accurately represent the three-dimensional surface of the earth on the two-dimensional planner
surface of a map or image without introducing distortion in one or more of the following
elements: shape, size, distance and direction. The transformation process is referred to as a map
projection.

Land Use Land Cover Change Detection Using A Case Study of Delhi State Remote Sensing Data and GIS Tools
Rajender Kumar Mehta, Regn. No. 820867661 - M.Sc. - 2011 13
While many types of map projections have been defined, they can be grouped into
several broad categories based either on the geometric models used or on the spatial
properties that are preserved or distorted by the transformation. Geometric models for map
projection include cylindrical, conic, and azimuthal or planar surfaces. A conformal map
projection preserves angular relationships or shapes; an azimuthal projection preserves
absolute directions; an equidistance projection preserves equal distances and an equivalent
projection preserves equal areas. In addition to the map projection associated with a given
GIS data layer, it is also often necessary to consider the datum used for that map projection.
A datum is a mathematical definition of the three-dimensional solid which is used to
represent the surface of the earth (Remote Sensing and Image Interpretation).
3.6 Geometric Correction
The geometric correction process is normally implemented as a two-step procedure. First,
those distortions that are systematic or predictable are considered. Second, those distortions
that are essentially random or unpredictable are considered.
Systematic distortions are well understood and easily corrected by applying formulas
derived by modeling the sources of the distortions mathematically. For example, a highly
systematic source of distortion involved in multispectral scanning from satellite altitudes is
the eastward rotation of the earth beneath the satellite during imaging. This causes each
optical sweep of the scanner to cover an area slightly to the west of the previous sweep. This
is known as skew distortion. The process of deskewing the resulting imagery involves
offsetting each successive scan line slightly to the west. The skewed-parallelogram

Land Use Land Cover Change Detection Using A Case Study of Delhi State Remote Sensing Data and GIS Tools
Rajender Kumar Mehta, Regn. No. 820867661 - M.Sc. - 2011 14
appearance of satellite multispectral scanner data is a result of this correction (Remote
Sensing and Image Interpretation).
Random distortions and residual unknown systematic distortions are corrected by
analyzing well-distributed ground control points (GCPs) occurring in an image. GCPs are
features of known ground location that can be accurately located on the digital imagery. In
the correction process numerous GCPs are located both in terms of their two image
coordinates (column, row numbers) on the distorted image and in terms of their ground
coordinates (typically measured from a map, or GPS located in the field, in terms of UTM
coordinates or latitude and longitude). These values are then submitted to a least squares
regression analysis to determine coefficients for two coordinate transformation equations
that can be used to inter-relate the geometrically correct (map) coordinates and the distorted-
image coordinates. Once the coefficients for these equations are determined, the distorted-
image coordinates for any map position can be precisely estimated. Expressing this in
mathematic notation,
x = f1 (X, Y) y = f2 (X, Y)
where,
(x,y) = distorted-image coordinates (column, row)
(X, Y) = correct (map) coordinates
f1, f2 = transformation functions
Figure 3.5 shows the geometrically correct output matrix of cells (solid lines)
superimposed over the original, distorted matrix of image pixels (dashed lines). After
producing the transformation function, a process called resampling is used to determine the
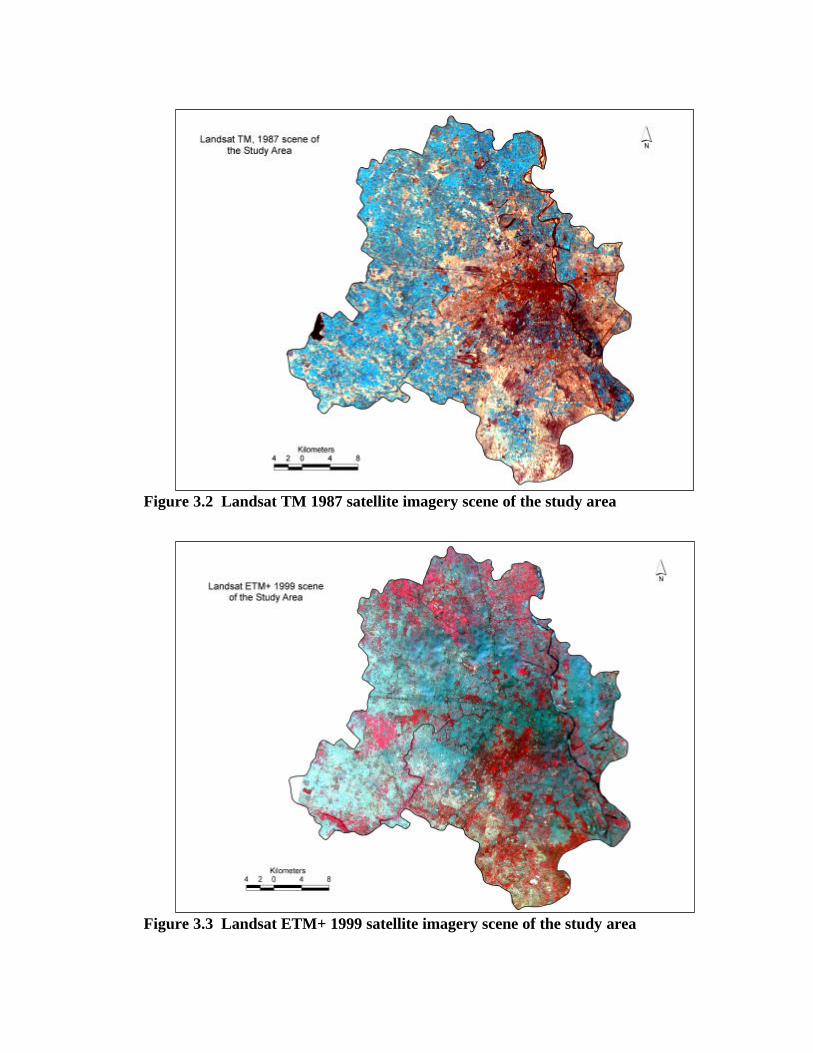
Figure 3.2 Landsat TM 1987 satellite imagery scene of the study area
Figure 3.3 Landsat ETM+ 1999 satellite imagery scene of the study area

Figure 3.4 IRS-P6, LISS-III 2006 satellite imagery scene of study area
Figure 3.5 Matrix of geometrically correct output pixels superimposed on matrix of
original, distorted input pixels
c c c c c a b c c b b b c c c c
Output matrix (geometrically correct)
Image matrix (distorted)

Land Use Land Cover Change Detection Using A Case Study of Delhi State Remote Sensing Data and GIS Tools
Rajender Kumar Mehta, Regn. No. 820867661 - M.Sc. - 2011 15
pixel values to fill into the output from the original image matrix. This process is performed
using the following operations.
1. The coordinates of each element in the undistorted output matrix are transformed
to determine their corresponding location in the original input (distorted image)
matrix.
2. In general, a cell in the output matrix will not directly overlay a pixel in the input
matrix. Accordingly, the intensity value or digital number (DN) eventually
assigned to a cell in the output matrix is determined on the basis of the pixel
values that surround its transformed position in the original input matrix.
A number of different resampling schemes can be used to assign the appropriate DN
to an output cell or pixel. The DN for this pixel could be assigned simply n the basis of the
DN of the closest pixel in the input matrix, disregarding the slight offset.
3.7 Radiometric Correction
As with geometric correction, the type of radiometric correction applied to any given digital
image data set varies widely among sensors. Other things being equal, the radiance measured
by any given system over a given object is influenced by such factors as changes in scene
illumination, atmospheric conditions, viewing geometry, and instrument response
characteristics. Some of these effects, such as viewing geometry variations, are greater in the
case of airborne data collection than in satellite image acquisition. Also, the need to perform
correction for any or all of these influences depends directly upon the particularly application
at hand (Remote Sensing and Image Interpretation).

Land Use Land Cover Change Detection Using A Case Study of Delhi State Remote Sensing Data and GIS Tools
Rajender Kumar Mehta, Regn. No. 820867661 - M.Sc. - 2011 16
In case of satellite sensing in the visib le and near- infrared portion of the spectrum, it
is often desirable to generate mosaics of images taken at different times or to study the
changes in the reflectance of ground features at different times or locations. In such
applications, it is usually necessary to apply a sun elevation correction and an earth-sun
distance correction. Through this process, image data acquired under different solar
illumination angles are normalized by calculating pixel brightness-values assuming the sun
was at the zenith on each date of sensing. The correction is usually applied by dividing each
pixel value in a scene by the sine of the solar elevation angle for the particular time and
location of imaging.
The earth-sun distance correction is applied to normalize for the seasonal changes in
the distance between the earth and the sun. The earth-sun distance is usually expressed in
astronomical units. The irradiance from the sun decreases as the square of the earth-sun
distance.
Ignoring atmospheric effects, the combined influence of solar zenith angle and earth-
sun distance on the irradiance incident on the earth’s surface can be expressed as
E0 cos θ0 E = d2 where E = normalized solar irradiance E0 = solar irradiance at mean earth-sun distance θ0 = sun’s angle from the zenith d = earth-sun distance, in astronomical units
The atmosphere affects the radiance measured at any point in the scene in two
contradictory ways. First, it attenuates (reduces) the energy illuminating a ground object.

Land Use Land Cover Change Detection Using A Case Study of Delhi State Remote Sensing Data and GIS Tools
Rajender Kumar Mehta, Regn. No. 820867661 - M.Sc. - 2011 17
Second, it acts as a reflector itself, adding a scattered, extraneous “path radiance” to the
signal detected by a sensor.
For convenience, haze correction routines are often applied uniformly throughout a
scene. This may or may not valid, depending on the uniformity of the atmosphere over a scene.
When extreme viewing angles are involved in image acquisition, it is often necessary to
compensate for the influence of varying the atmospheric path length through which the scene is
recording. In such cases off-nadir pixel values are usually normalized to their nadir equivalents.
Another radiometric data processing activity involved in many quantitative
applications of digital image data is conversion of DNs to absolute radiance values. This
operation accounts for the exact form of the A-to-D response functions for a given sensor and
is essential in applications where measurement of absolute radiances is required. For
example, such conversions are necessary when changes in the absolute reflectance of objects
are to be measured over time using different sensors (e.g., the multispectral scanner on
Landsat-3 versus that on Landsat-5).
Normally, detectors and data systems are designed to produce a linear response to
incident spectral radiance. For example, Figure 3.6 shows the linear radiometric response
function typical of an individual TM channel. Each spectral band of the sensor has its own
response function and its characteristics are monitored using onboard calibration lamps. The
absolute spectral radiance output of the calibration sources is known from prelaunch
calibration and is assumed to be stable over the life of the sensor. Thus, the onboard
calibration sources form the basis for constructing the radiometric response function by
relating known radiance values incident on the detectors to the resulting DNs.

Figure 3.6 Radiometric response function for an individual TM channel
LMIN LMAX 0
255
L = Spectral radiance
o o
o
o
o
o
o
o o Spectral radiance of internal
calibration standards
DN
= D
igita
l num
ber
Slope = channel gain (G)

Land Use Land Cover Change Detection Using A Case Study of Delhi State Remote Sensing Data and GIS Tools
Rajender Kumar Mehta, Regn. No. 820867661 - M.Sc. - 2011 18
It can be seen from Figure 3.5 that a linear fit to the calibration data results in the
following relationship between radiance and DN values for any given channel :
DN = GL + B
Where DN = digital number value recorded
G = slope of response function (channel gain)
L = spectral radiance measured
B = intercept of response function (channel offset)
Note that the slope and intercept of the above function are referred to as the gain and
offset of the response function, respectively. In Figure 3.6 LMIN is the spectral radiance
corresponding to a DN response of 0 and LMAX is the minimum radiance required to
generate the maximum DN (here 255). That is, LMAX represents the radiance at which the
channel saturates. The range from LMIN to LMAX is the dynamic range for the channel.
3.8 Noise Removal
Image noise is any unwanted disturbance in image data that is due to limitations in the
sensing, signal digitization, or data recording process. Noise can either degrade or totally
mask the true radiometric information content of a digital image. Hence, noise removal
usually precedes any subsequent enhancement or classification of the image data. The
objective is to restore an image to as close an approximation of the original scene as possible
(Remote Sensing and Image Interpretation).
As with geometric restoration procedures, the nature of noise correction required in
any given situation depends upon whether the noise is systematic (periodic), random, or
some combination of the two. For example, multispectral scanners that sweep multiple scan

Land Use Land Cover Change Detection Using A Case Study of Delhi State Remote Sensing Data and GIS Tools
Rajender Kumar Mehta, Regn. No. 820867661 - M.Sc. - 2011 19
lines simultaneously often produce data containing systematic striping or banding. This
stems from variations in the response of the individual detectors used within each band. Such
problems were particularly prevalent in the collection of early Landsat MSS data. While the
six detectors used for each band were carefully calibrated an matched prior to launch, the
radiometric response of one or more tended to drift over time, resulting in relatively higher or
lower values along every sixth line in the image data.
Several destriping procedures have been developed to deal with the type of problem
described above. One method is to compile a set of histograms for the image – one for each
detector involved in a given band. For MSS data this means that for a given band one
histogram is generated for scan lines 1, 7, 13, and so on; a second is generated for lines 2, 8,
14, and so on; and so forth. These histograms are then compared in terms of their mean and
median values to identify the problem detector(s). A gray-scale adjustment factor(s) can then
be determined to adjust the histogram(s) for the problem lines to resemble those for the
normal data lines. This adjustment factor is applied to each pixel in the problem lines and the
others are not altered.
Another line-oriented noise problem sometimes encountered in digital data is line
drop. In this situation, a number of adjacent pixels along a line (or an entire line) may contain
spurious DNs. This problem is normally addressed by replacing the defective DNs with the
average of the values for the pixels occurring in the lines just above and below. Alternatively,
the DNs from the preceding line can simply be inserted in the defective pixels.
Random noise problems in digital data are handled quite differently. This type of
noise is characterized by non-systematic variations in gray levels from pixel to pixel called

Land Use Land Cover Change Detection Using A Case Study of Delhi State Remote Sensing Data and GIS Tools
Rajender Kumar Mehta, Regn. No. 820867661 - M.Sc. - 2011 20
bit errors. Bit errors are handled by recognizing that noise values normally change much
more abruptly than true image values.
3.9 Image Enhancement
Enhancement operations are normally applied to image data after the appropriate restoration
procedures have been performed. Noise removal is an important precursor to most
enhancements. Without it, the image interpreter is left with the prospect of analyzing
enhanced noise.
Three techniques for digital enhancement can be categorized as contrast
manipulation, spatial feature manipulation or multi-image manipulation.
1. Contrast manipulation. Gray- level thresholding, level slicing and contrast
stretching.
2. Spatial feature manipulation. Spatial filtering, edge enhancement and Fourier
analysis.
3. Multi-image manipulation. Multispectral band ratioing and differencing, principal
components, canonical components, vegetation components, intensity-hue-
saturation (IHS) color space transformations and decorrelation stretching.
3.10 Image Classification
Image classification procedure is to automatically categorize all pixels in an image into land
cover classes or themes. Normally, multispectral data are used to perform the classification
and, the spectral pattern present within the data for each pixel is used as the numerical basis
for categorization. That is, different feature types manifest different combinations of DNs

Land Use Land Cover Change Detection Using A Case Study of Delhi State Remote Sensing Data and GIS Tools
Rajender Kumar Mehta, Regn. No. 820867661 - M.Sc. - 2011 21
based on their inherent spectral reflectance and remittance properties. Spectral pattern
recognition refers to the family of classification procedures that utilizes this pixel-by-pixel
spectral information as the basis for automated land cover classification.
Spatial pattern recognition involves the categorization of image pixels on the basis of
their spatial relationship with pixels surrounding them. Spatial classifiers might consider such
aspects as image texture, pixel proximity, feature size, shape, directionality, repetition and
context. These types of classifiers attempt to replicate the kind of spatial synthesis done by
the human analyst during the visual interpretation process.
Temporal pattern recognition uses time as an aid in feature identification. In
agricultural crop surveys, for example, distinct spectral and spatial changes during a growing
season can permit discrimination on multi-date imagery that would be impossible given any
single date. For example, a field of winter wheat might be indistinguishable from bare soil
when freshly seeded in the fall and spectrally similar to an alfalfa field in the spring. An
interpretation of imagery from either date alone would be unsuccessful, regardless of the
number of spectral brands. If data were analysed from both dates, however, the winter wheat
fields could be readily identified, since no other field cover would be bare in late fall and
green in late spring.
As with the image restoration and enhancement techniques, image classifiers may be
used in combination in a hybrid mode. Also, there is no single “right” manner in which to
approach an image classification problem. The particular approach one might take depends
upon the nature of the data being analysed, the computation resources available, and the
intended application of the classified data.

Land Use Land Cover Change Detection Using A Case Study of Delhi State Remote Sensing Data and GIS Tools
Rajender Kumar Mehta, Regn. No. 820867661 - M.Sc. - 2011 22
To emphasize spectrally oriented classification procedures for land cover mapping.
Supervised Classification, the image analyst “supervises” the pixel categorization process by
specifying, to the computer algorithm, numerical descriptors of the various land cover types
present in a scene. To do this, representative sample sites of known cover type, called
training area, are used to a compile a numerical “interpretation key” that describes the
spectral attributes for each feature type of interest. Each pixel in the data set is then compared
numerically to each category in the interpretation key and labeled with the name of the
category it “looks most like”.
The other classification is Unsupervised Classification. This procedure is applied in
two separate steps. The fundamental difference between these techniques is that supervised
classification involves a training steps followed by a classification step. In the unsupervised
approach the image data are first classified by aggregating them into the natural spectral
groupings, or clusters, present in the scene. Then the image analyst determines the land cover
identity of these spectral groups by comparing the classified image data to ground reference
data.
3.11 Post Classification Smoothing
Classified data often manifest a salt-and-pepper appearance due to the inherent spectral
variability encountered by a classifier when applied on a pixel-by-pixel basis. For example,
in an agricultural area, several pixels scattered throughout a corn field may be classified as
soybeans, or vice versa. In such situation it is often desirable to “smooth” the classified
output to show only the dominant classification.

Land Use Land Cover Change Detection Using A Case Study of Delhi State Remote Sensing Data and GIS Tools
Rajender Kumar Mehta, Regn. No. 820867661 - M.Sc. - 2011 23
One means of classification smoothing involves the application of a statistical filter.
In such operations a moving window is passed through the classified data set and the
majority class within the window is determined. If the center pixel in the window is not the
majority class, its identity is changed to the majority class. If there is no majority class in the
window, the identity of the center pixel is not changed. As the window progresses through
the data set, the original class codes are continually used, not the labels as modified from the
previous window positions. The classified map was prepared in this manner, applying a 3 x 3
pixel medium filter to the data.
Medium filters can also incorporate some form of class and/or spatial weighting
function. Data may also be smoothed more than once. Certain algorithms can preserve the
boundaries between land cover regions and also involve a user-specified minimum area of
any given land cover type that will be maintained in the smoothed output.

Chapter 4
Data Analysis and Interpretation

Land Use Land Cover Change Detection Using A Case Study of Delhi State Remote Sensing Data and GIS Tools
Rajender Kumar Mehta, Regn. No. 820867661 - M.Sc. - 2011 24
4
DATA ANALYSIS AND INTERPRETATION
4.1 Introduction
One of the objectives of the study was to generate a spatial GIS database for the study area
and to understand the urbanization process in the past 2-3 decades. Secondly and most
importantly the main objective of this study is to quantify the sprawl of urbanization.
Therefore the built-up area was extracted and used to assess the urbanization. The results and
outcomes are presented in the form of maps, charts and statistical graphs.
4.1.1 LULC change and data interpretation
In this section Land Use Land Cover (LULC) maps of different years were compared. The
LULC of the study area had changed dramatically during the period of 19 years. Therefore,
the data interpretation and data analysis is based on the comparison of LULC for three
different periods during 19 year period. In the first part of this chapter population census v/s
built-up area were analyzed and presented in the form of statistical graphs. Furthermore,
sprawling nature of built-up area and loss of forest and agricultural land is discussed in the
second and third part, respectively.

Land Use Land Cover Change Detection Using A Case Study of Delhi State Remote Sensing Data and GIS Tools
Rajender Kumar Mehta, Regn. No. 820867661 - M.Sc. - 2011 25
1) Population Vs Built-up area
As shown in Figure 4.1(a-c) population data versus built-up area was plotted for all the
districts for three distinct years. The x-axis stands for population and y stands fo r built-up
area. Population data was extrapolated for three respective years i.e., 1987, 1999 and 2006 to
compare the population data with the built-up areas. As shown in the Figure 4.1(a-c) the
scatter plots exhibit positive correlation between population growth and built-up area
expansion. In all the three years, North West district is characterized by both high population
growth and relatively high increase in the built-up area (see Figures 4.2-4.6).
2) Sprawling of Built-up area
A simple superimposing technique was used to assess the spatial growth of built-up area for
the given period of 19 years. All the three LULC maps of Delhi are predominantly covered
with built-up area. The map is extracted in tabular form, as shown in Table 4.1 the built-up
area is predominantly covered with 25% of the total area of Delhi-NCT. During 1999 built-
up area had increased to 41%, with a sharp decrease in open forest, wasteland and
agricultural land areas. Between the year 1999 and 2006 there was a slight increase in built-
up class with only 1% increase i.e., 42% of the total administrative area of Delhi comprised
built up space. Over the period of 19 years built-up area had increased to 18% in Delhi.
However, urban sprawling had rate rather slowed down during 1999-2006. However, when
the two LULC maps of 1999 and 2006 were compared, one observed a marked difference in
the western part of Delhi (Figures 4.7 & 4.8).

0
500
1000
1500
2000
2500
0 5000 10000 15000 20000 25000
(Tho
usan
ds)
Builtup Area (ha)
Popula
tion
New Delhi
Central North
East
North East
West
South West
South
North West
0
200
400
600
800
1000
1200
1400
1600
0 2000 4000 6000 8000 10000 12000
(Tho
usan
ds)
Builtup Area
Popula
tion
New Delhi
Central
North East
North
East South West
West
North West
South
(ha) 1987 (a)
1999 (b)

Figure 4.1(a-c) Human population growth vs. Built-up Area
0
500
1000
1500
2000
2500
3000
3500
0 5000 10000 15000 20000 25000
(Tho
usan
ds)
Builtup Area (ha)
Po
pu
lati
on
New Delhi
Central
North
East
North East West
South
North West
South West
2006 (c)

Figure 4.2 Land use/ land cover map generated from Landsat TM scene, 1987 of the study area
Figure 4.3 Land use/land cover map generated from Landsat ETM+, 1999 of the study area

Figure 4.4 Land use/land cover map generated from IRS-P6 LISS-III, 2006 of the study area
Figure 4.5 Comparative built-up areas of the study area during different years
0
10000
20000
30000
40000
50000
60000
70000
Are
a (h
a)
1987 1999 2006Year

Figure 4.6 The spread of built-up area during different years

Figure 4.7 Overlay of built-up area in the years of 1987 to 1999
Figure 4.8 Overlay of built-up area in the years 1999 to 2006

Land Use Land Cover Change Detection Using A Case Study of Delhi State Remote Sensing Data and GIS Tools
Rajender Kumar Mehta, Regn. No. 820867661 - M.Sc. - 2011 26
Table 4.1 Area (ha) and percentage of the land use/ land cover categories of different years (1987, 1999 & 2006) of the study area
Land use/ land cover 1987 1999 2006 categories Area (ha) % Area (ha) % Area (ha) % Dense Forest 7622.62 5.14 9960.34 6.74 5768.87 3.89
Open Forest 26174.95 17.65 16329.70 11.05 16718.24 11.27
Plantations 12486.86 8.42 11556.40 7.82 7835.07 5.28
Cultivable Area 25018.21 16.87 19684.31 13.32 14503.74 9.78
Built-up Area 37045.34 24.98 60959.29 41.25 63146.14 42.58
Road/ Rail Network 3618.52 2.44 2113.26 1.43 7261.53 4.90
River/ Waterbody 6169.28 4.16 2438.37 1.65 2254.16 1.52
Waste Land 30164.22 20.34 24738.39 16.74 30816.74 20.78
Total 148304.49 147780.06 148300.00
3) Loss of Agricultural Land and Forest Land
During the course of 19 years, an area of around 10,000 ha of agricultural lands was lost to
built-up areas and road infrastructure. These agricultural lands were prominently spread in
the north-western and western part of the Delhi up to 1987. Forest land losses were also
accounted in the course of urbanization. Approximately 11,000 ha of forest lands (open
forest & dense forest) were lost during the study period (Table 4.2). Moreover, Delhi is
covered with open forest rather than dense forest, therefore, conversion of open forest to
other land uses was more prevalent. (Figures 4.9 & 4.10).

Figure 4.9 Area (ha) of forest types and cultivated area in different years
0
5000
10000
15000
20000
25000
30000
35000
Are
a (h
a)
1987 1999 2006Year
Forest typesCultivated Area

Figure 4.10 Map showing loss of forest and cultivated area in different years

Land Use Land Cover Change Detection Using A Case Study of Delhi State Remote Sensing Data and GIS Tools
Rajender Kumar Mehta, Regn. No. 820867661 - M.Sc. - 2011 27
Table 4.2 Area (ha) difference between land use/ land cover categories in different years
Land use 1987 1999 Diff- 1999 2006 Diff-
categories Area % Area % Area % Area % Area % Area %
Forest types 33797.57 22.79 26290.04 17.79 - 7507.53 - 5.00 26290.04 17.79 22487.11 15.16 - 3802.93 - 2.63
(Dense & Open)
Cultivated Area 25018.21 16.87 19684.31 13.32 - 5333.90 - 3.55 19684.31 13.32 14503.74 9.78 - 5180.57 - 3.54
Land use 1987 2006 Diff-
categories Area % Area % Area %
Forest types 33797.57 22.79 22487.11 15.16 - 11310.46 - 7.63
(Dense & Open)
Cultivated Area 25018.21 16.87 14503.74 9.78 - 10514.47 - 7.09

Chapter 5
Summary and Conclusion

Land Use Land Cover Change Detection Using A Case Study of Delhi State Remote Sensing Data and GIS Tools
Rajender Kumar Mehta, Regn. No. 820867661 - M.Sc. - 2011 28
5
SUMMARY AND CONCULSION
This research study demonstrates the ability of GIS and Remote Sensing in retrieving and
analyzing spatio-temporal data. An attempt was made in this study to develop a spatial data
base of LULC of Delhi metropolitan city. A comprehensive LULC map was developed for
three distinct years for a period of 19 years to study the urbanization in Delhi. Therefore,
LULC were distinctly developed for each study year but with more emphasis on built-up area
to assess and quantify the urbanization.
The study has demonstrated that urbanization and spatio temporal growth can be
quantified and compared across different years. Landsat & IRS data proved to be adequate
data source for the analysis of large and fast changing urban growth in Delhi. The main
findings and results address the objectives specified earlier in chapter 1.
• To prepare Multi- temporal GIS database for the future LULC change studies were
prepared
• The main objective of this study is to assess the spatial and multi- temporal LULC
change of Delhi has been met. The LULC changes between 1987-2006 has been
evaluated
• The study explored the spatial and temporal characteristics of urban expansion in this
period
Land Use Land Cover Change Detection Using A Case Study of Delhi State Remote Sensing Data and GIS Tools
Rajender Kumar Mehta, Regn. No. 820867661 - M.Sc. - 2011 29
• The driving forces of land use and land cover change and urban expansion were
explored and highlighted.
As discussed earlier that this study has managed to develop a comprehensive LULC
database for three time periods. Furthermore, it has enabled to assess spatio-temporal growth.
Spatio-temporal growth can be quantified by a built-up area for different periods. At last the
population growth vs built-up area (see Figure 4.1) shows a positive correlation i.e., higher
the population growth larger the built-up area.
5.1 Future Studies
The major impact of built-up area and urban expansion of Delhi state will exacerbate the
harsh climatic conditions during summers. More and more RCC structures in Delhi and its
suburbs are going to be critical for further warming due to urban heat island effect. This
phenomenon will only worsen under the impact of global climate change. With the growth of
urbanization and its associated infrastructure including roads and motor vehicles the
environmental conditions will turn for the worse. Remote sensing and GIS studies can play
an important role in warning us of these changes in spatial and temporal context. These
studies can also help in identifying areas that can be set aside for protection as green areas
and preserve existing green areas for future generations and for Delhi’s climate.

Chapter 6
Bibliography
Land Use Land Cover Change Detection Using A Case Study of Delhi State Remote Sensing Data and GIS Tools
Rajender Kumar Mehta, Regn. No. 820867661 - M.Sc. - 2011 30
6
BIBLIOGRAPHY
Allen, P.M. & Sanglier, M. (1979). A dynamic model of urban growth: II. Journal of Social
and Biological Structure, 2, 269-278.
Alphan, H. (2003). Land use change and urbanization in Adana, Turkey. Land Degradation
and Development, 14(6), 575–586.
Batty, M. & Howes, D. (2001). Predicting temporal patterns in urban development from
remote imagery. In J.P. Donnay, M.J. Barnsley, P.A. Longley (Hrsg.), Remote
Sensing and Urban Analysis (pp. 185-204). London: Taylor and Francis.
Census of India, New Delhi. (1991). www.censusindia. net.
Census of India, New Delhi. (2011). www.censusindia. net.
CISMHE (1993). Carrying capacity study based developmental planning of National Capital
Region. Ministry of Environment & Forests, Govt. of India.
Cohen, B. (2006). ‘Urbanization in Developing Countries: Current Trends, Future
Projections, and Key Challenges for Sustainability’. Technology in Society, 28 (1-2):
63-80
Coppin, P. & Bauer, M. (1996). Digital Change Detection in Forest Ecosystems with Remote
Sensing Imagery. Remote Sensing Reviews. Vol. 13. p. 207-234.
Daniel, et al. (2002). A comparison of Landuse and Landcover Change Detection Methods.
ASPRS-ACSM Annual Conference and FIG XXII Congress pg.2.

Land Use Land Cover Change Detection Using A Case Study of Delhi State Remote Sensing Data and GIS Tools
Rajender Kumar Mehta, Regn. No. 820867661 - M.Sc. - 2011 31
Dimyati, et al. (1995). An Analysis of Land Use/ Land Cover Change Using the
Combination of MSS Landsat and Land Use Map- A case study of Yogyakarta,
Indonesia, International Journal of Remote Sensing 17(5): 931– 944.
EOSAT (1992). Landsat TM Classification International Georgia Wetlands in EOSAT Data
User Notes, Vol. 7, No 1, EOSAT Company, Lanham, MD.
EOSAT (1994). EOSAT,s Statewide Purchase Plan Keeps South Carolina Residents in the
know, in EOSAT Notes, Vol. 9, No 1, EOSAT Company Lanham, MD.
ERDAS, Inc. (1992). ERDAS Production Services Map State for Georgia DNR in the
Monitor, Vol. 4, No 1, ERDAS, Inc, Atlanta, GA.
Fazal, S. (2001). “Land Reorganization Study along Major Roads,” Land Use Policy, Vol.
18, No. 2, 2001, pp. 191-199.
Fitzpatric- lins et al. (1987). Producing Alaska Interim Land Cover Maps from Landsat
Digital and Ancillary Data, in Proceedings of the 11th Annual William T. Pecora
Memorial Symposium: Satellite Land Remote Sensing: current programs and a look
into the future American Society of Photogrammetry and Remote Sensing, Pp. 339 –
347.
Global Land Cover Facility (GLCF). Department of Geography, University of Maryland,
NASA, New York.
Lillesand, T.M. & Kiefer, R.W. (2000). Remote Sensing and Image Interpretation. Fourth
edition. John Wiley & Sons, Inc. New York
Lopez, E., Bocco, G., Mendoza, M., & Duhau, E. (2001). Predicting land cover and land use
change in the urban fringe a case in Morelia City, Mexico. Landscape and Urban
Planning, 55(4), 271–285. 1), 81–97.

Land Use Land Cover Change Detection Using A Case Study of Delhi State Remote Sensing Data and GIS Tools
Rajender Kumar Mehta, Regn. No. 820867661 - M.Sc. - 2011 32
Macleod & Congalton. (1998). A Quantitative Comparison of Change Detection Algorithms
for Monitoring Eelgrass from Remotely Sensed Data. Photogrammetric Engineering
& Remote Sensing. Vol. 64. No. 3. p. 207-216.
Meyer, W.B. (1995). Past and Present Land-use and Land-cover in the U.S.A. Consequences.
p.24-33.
Moshen A. (1999). Environmental Land Use Change Detection and Assessment Using with
Multi – temporal Satellite Imagery. Zanjan University.
Olorunfemi J.F. (1983). Monitoring Urban Land – Use in Developed Countries – An aerial
photographic approach, Environmental Int.9, 27 – 32.
Pandit, M.K., Sodhi, N.S., Koh, L.P., Bhaskar, A., Brook, B.W. (2007). Unreported yet
massive deforestation driving loss of endemic biodiversity in Indian Himalaya.
Biodiverstiy Conservation. 16: 153-163.
Pandy, A.C. and Nathawat, M.S. (2006). Land Use Land Cover Mapping Through Digital
Image Processing of Satellite Data – A case study from Panchkula, Ambala and
Yamunanagar Districts, Haryana State, India.
Rahman, A., Kumar, Y., Fazal, S. and Bhaskaran, S. (2011). Urbanization and Quality of
Urban Environment Using Remote Sensing and GIS Techniques in East Delhi- India.
Journal of Geographic Information System. 3: 62-84.
Riebsame, W.E., Meyer, W.B., and Turner, B.L. II. (1994). Modeling Land-use and Cover as
Part of Global Environmental Change. Climate Change. Vol. 28. p. 45.
Seto, K.C. & Fragkias, M. (2005). quantifying spatiotemporal patterns of urban land-use
change in four cities of China with a time series of landscape metrics. Landscape
Ecology, 20, 871-888.

Land Use Land Cover Change Detection Using A Case Study of Delhi State Remote Sensing Data and GIS Tools
Rajender Kumar Mehta, Regn. No. 820867661 - M.Sc. - 2011 33
Singh, A. (1989). Digital Change Detection Techniques Using Remotely Sensed Data.
International Journal of Remote Sensing. Vol. 10, No. 6, p. 989-1003.
Stefanov, W.L. and Netzband, M. (2005). Assessment of ASTER land cover and MODIS
NDVI data at multiple scales for ecological characterization of an arid urban center.
Remote Sensing of Environment, 99, 31-43.
Taubenböck, H., Wegmann, M., Roth, A., Mehl, H. and Dech, S. (2009). Urbanization in
India: Spatiotemporal analysis using remote sensing data. Computers, Environment &
Urban Systems 33(3): 179-188.
UN (2004). United Nations Human Settlements Programme (UN-HABITAT). Water and
sanitation in the world’s cities: local action for global goals. London: Earthscan; 2003
Xiaomei Y. and Ronqing L.Q.Y. (1999). Change Detection Based on Remote Sensing
Information Model and its Application to Coastal Line of Yellow River Delta – Earth
Observation Center, NASDA, China.
Zomer, U.S. and Ives, J. (2002). Using satellite remote sensing for DEM extraction in
complex mountainous terrain: Landscape analysis of the Makalu Barun National Park
of Eastern Nepal. International Journal of Remote Sensing, 23:125 – 143


