
LATERAL HYPOTHALAMIC PROJECTIONS TO THE RAT VENTRAL TEGMENTAL AREA:
POTENTIAL ANATOMICAL SUBSTRATES FOR ADAPTIVE INTEGRATION OF BEHAVIORS MEDIATED BY ASCENDING DOPAMINE SYSTEMS
by
Judith Joyce Balcita-Pedicino
Bachelor of Arts, Washington and Jefferson College, 1993
Submitted to the Graduate Faculty of
Arts and Sciences in partial fulfillment
of the requirements for the degree of
Master of Science
University of Pittsburgh
2007
UNIVERSITY OF PITTSBURGH
School of Arts and Sciences
This thesis was presented
by
Judith Joyce Balcita-Pedicino
It was defended on
August 14, 2007
and approved by
Anthony A. Grace, PhD, Department of Neuroscience
Linda Rinaman, PhD, Department of Neuroscience
Thesis Director: Susan R. Sesack, PhD, Department of Neuroscience
ii

Copyright © by Judith Joyce Balcita-Pedicino
2007
iii
LATERAL HYPOTHALAMIC PROJECTIONS TO THE RAT VENTRAL TEGMENTAL AREA:
POTENTIAL ANATOMICAL SUBSTRATES FOR ADAPTIVE INTEGRATION OF BEHAVIORS MEDIATED BY ASCENDING DOPAMINE SYSTEMS
Judith Joyce Balcita-Pedicino, M.S.
University of Pittsburgh, 2007
Complex motor behaviors enable mammals to adapt to their internal and external environments.
The lateral hypothalamic area (LHA) contributes importantly to autonomic and endocrine
regulation, behavioral states, and energy balance. Orexin (Orx) neuropeptides, produced
exclusively by LHA cells, are crucial in the integration of sleep and arousal. The LHA projects
densely to the ventral tegmental area (VTA), a dopamine (DA) region that is essential for
modulating goal-directed behaviors. Extensive investigations of reward function implicate the
LHA-VTA connectivity, an arrangement not yet characterized in detail at the ultrastructural
level. The present research sought to clarify the precise interactions of LHA axons with VTA
cells. Considering reported physiological responses of VTA cells to LHA stimulation and Orx
actions, we hypothesized that both projections interact heavily with DA and GABA cell groups
in the VTA, and that LHA axons provide a predominant inhibitory innervation. We used
immunocytochemistry to visualize DA or GABA neurons in combination with 1) tract tracer
identification of LHA axons or 2) immunolabeling for Orx. Electron microscopic analysis of the
VTA revealed that, while the bulk of LHA and Orx projections pass through the VTA, their
connections with DA and GABA neurons are a complementary mixture of excitatory and
inhibitory synapses. The details of morphology herein suggest many different mechanisms of
signal transmission by which LHA axons might contribute information concerning interoceptive
state to the adaptive performance of complex motor behaviors modulated by the VTA.
iv
TABLE OF CONTENTS
LIST OF TABLES ................................................................................................................... VIII
LIST OF FIGURES .................................................................................................................... IX
PREFACE .................................................................................................................................... XI
1.0 GENERAL INTRODUCTION .............................................................................................. 1
1.1 A Question of Basic Anatomy ............................................................................................ 1
1.2 Neural Pathways Involved in LHA Function ................................................................... 2
1.3 The Importance of the LHA .............................................................................................. 4
1.4 The Importance of the VTA Dopamine and GABA Systems ......................................... 6
1.5 Evidence of Connectivity Between the LHA and VTA ................................................... 9
1.6 Summary and Conclusion ................................................................................................ 13
2.0 THE LATERAL HYPOTHALAMIC PROJECTION TO THE RAT VENTRAL
TEGMENTAL AREA: ULTRASTRUCTURAL INTERACTIONS WITH DA AND GABA
NEURONS ................................................................................................................................... 14
2.1 Abstract .............................................................................................................................. 14
2.2 Introduction ....................................................................................................................... 15
2.3 Materials and Methods ..................................................................................................... 18
2.3.1 Animals ....................................................................................................................... 18
2.3.2 Anterograde Tracer Injections ................................................................................. 18
2.3.3 Fixation and Tissue Sectioning ................................................................................. 19
2.3.4 Single Labeling Immunocytochemistry ................................................................... 20
2.3.5 Double Labeling Immunocytochemistry .................................................................. 20
2.3.6 Tissue Preparation for Electron Microscopy .......................................................... 21
v
2.3.7 Antibody Specificity ................................................................................................... 22
2.3.8 Ultrastructural Analysis ............................................................................................ 23
2.4 Results ................................................................................................................................ 24
2.4.1 Light Microscopic Immunolabeling for PHAL in the Rat LHA and VTA .......... 24
2.4.2 Electron Microscopic Visualization of LHA Axons within the VTA .................... 29
2.4.3 Ultrastructural Relationships between LHA Axons and TH-ir and GABA-ir
Structures in the VTA ........................................................................................................ 32
2.5 Discussion .......................................................................................................................... 37
2.5.1 Methodological Considerations ................................................................................ 37
2.5.2 Ultrastructural Features of the LHA Projection to the VTA ................................ 38
2.5.3 Functional Implications ............................................................................................. 41
3.0 OREXIN AXONS IN THE RAT VENTRAL TEGMENTAL AREA SYNAPSE
INFREQUENTLY ONTO DOPAMINE AND GABA NEURONS ....................................... 43
3.1 Abstract .............................................................................................................................. 43
3.2 Introduction ....................................................................................................................... 44
3.3 Materials and Methods ..................................................................................................... 46
3.3.1 Fixation and Tissue Sectioning ................................................................................. 46
3.3.2 Single Labeling with Immunoperoxidase ................................................................ 48
3.3.3 Single Labeling with Immunogold-silver ................................................................. 49
3.3.4 Double Labeling Immunocytochemistry .................................................................. 50
3.3.5 Tissue Preparation for Electron Microscopy .......................................................... 50
3.3.6 Specificity and Controls ............................................................................................ 51
3.3.7 Ultrastructural Analysis ............................................................................................ 54
vi
3.3.8 Estimation of Synaptic Incidence ............................................................................. 56
3.4 Results ................................................................................................................................ 57
3.4.1 Light Microscopic Labeling for Orx in the Rat LHA and VTA ............................ 57
3.4.2 Electron Microscopic Visualization of Orx within the VTA .................................. 61
3.4.3 Estimation of Synaptic Incidence ............................................................................. 71
3.4.4 Ultrastructural Relationships between Orx Axons and TH-ir Structures in the
VTA ...................................................................................................................................... 71
3.4.5 Ultrastructural Relationships between Orx Axons and GABA-ir Structures in the
VTA ...................................................................................................................................... 76
3.5 Discussion .......................................................................................................................... 79
3.5.1 Methodological Considerations ................................................................................ 79
3.5.2 Ultrastructural Features of Orx Axons in the VTA ............................................... 80
3.5.3 Relationships between Orx Varicosities and DA and GABA Neurons ................. 82
3.5.4 Functional Considerations ........................................................................................ 84
4.0 GENERAL DISCUSSION ................................................................................................... 87
4.1 The Structure-Function Question ................................................................................... 87
4.2 Comparative View of the LHA and Orx Projections in the VTA ................................ 89
4.3 Comparative View of the LHA Projection with Other Afferents of the VTA ............ 90
4.4 Functional Implications of the LHA projections in Terms of VTA Cell Activity ....... 91
4.5 Cataplexy: A Failure of Integrated Goal-directed Behavior ........................................ 93
4.6 Future Directions .............................................................................................................. 95
4.7 Conclusion ......................................................................................................................... 95
REFERENCES ............................................................................................................................ 97
vii
LIST OF TABLES
Ch. 1, Table 1. LHA Axons Contacting Dendrites in the VTA .................................................... 35
Ch. 2, Table 1. Animals Used for Orx Electron Microscopy Experiments .................................. 47
Ch. 2, Table 2. Orx-ir Axons Contacting Dendrites in the Rat VTA ........................................... 64
viii
LIST OF FIGURES
Ch. 1, Figure 1: Light microscopic images of coronal sections through the rat brain showing
representative injection sites and transport of PHAL and immunocytochemistry for TH. .......... 27
Ch. 1, Figure 2: Electron micrographs of the rat VTA illustrating the ultrastructural
characteristics of fibers labeled by immunoperoxidase for PHAL transported from the LHA. ... 30
Ch. 1, Figure 3: Electron micrographs of the rat VTA depicting dual immunoperoxidase labeling
for PHAL transported in LHA terminals and immunogold-silver labeling for TH. ..................... 33
Ch. 1, Figure 4: Electron micrographs of the rat VTA depicting dual immunoperoxidase labeling
for PHAL transported in LHA terminals synapsing onto dendrites containing immunogold-silver
labeling for GABA. ....................................................................................................................... 36
Ch. 2, Figure 1: Light micrographic images depicting coronal sections through the rat
hypothalamus and VTA. ............................................................................................................... 59
Ch. 2, Figure 2: Electron micrographs of the rat VTA illustrating the ultrastructural
characteristics of fibers labeled by immunoperoxidase for Orx A or Orx B. ............................... 62
Ch. 2, Figure 3: Electron micrographs of the rat VTA illustrating the ultrastructural
characteristics of axons labeled by immunogold-silver for Orx A or Orx B. ............................... 66
Ch. 2, Figure 4: Electron micrographs illustrating immunoreactivity for Orx B or Orx A within
profiles whose morphology is not readily indicative of axons. .................................................... 69
Ch. 2, Figure 5: Electron micrographs of the rat VTA depicting axons labeled by
immunoperoxidase for Orx A or Orx B in relationship to dendrites containing immunogold-silver
labeling for TH. ............................................................................................................................. 72
Ch. 2, Figure 6: Electron micrographs of the rat VTA illustrating infrequent synapses of
varicosities labeled for Orx A onto TH-labeled dendrites. ........................................................... 74
ix

Ch. 2, Figure 7: Electron micrographs of the rat VTA demonstrating infrequent associations of
varicosities immunoreactive for Orx A with dendrites containing immunogold-silver labeling for
GABA. .......................................................................................................................................... 77
x

xi
PREFACE
I would like to thank the members of my thesis committee for their valuable guidance.
I especially want to thank Dr. Susan Sesack, my advisor, for teaching me about the many fine
details of neuroanatomy, science, and life in general.
Much appreciation to past and present members of the Sesack Lab,
especially Dr. Aline Pinto Orr, Dr. Natalia Omelchenko, Neil Medvitz,
Dr. LeeAnn Miner, and Tom Harper for all their patience and insight in training me in
the methodology of electron microscopy.
My family and friends give precious meaningfulness to this accomplishment.
Thank you for your loving support and understanding: my husband and favorite person in
the world, Nic Pedicino - thank you for caring for me the way you do every day;
my parents, Drs. Arthur and Amelia Balcita; my brother, Arnel Balcita;
Connie and Janeanne Lopes, my mother and sister in-law; my best buddy, Layla Banihashemi.
This thesis is dedicated to my dearest nephew Qai Balcita.
1.0 GENERAL INTRODUCTION
1.1 A Question of Basic Anatomy
The perspective of the present research comes not from the question of whether lateral
hypothalamic area (LHA)-ventral tegmental area (VTA) connections are reward substrates per
se. Rather, the primary goal of these studies is to characterize the basic anatomy of this pathway
that has, for many decades, served as a valuable tool in the study of complex behaviors and
reward function. Understanding better the precise interactions of LHA neurons with VTA cell
groups might contribute useful information relevant to the study of motivated behavior, and more
specifically, to the study of what pathways might drive adaptive mammalian behavior in
accordance with interoceptive signals of the body and stimuli in the external environment. Much
evidence generated in the field of reward research and appetitive behavior has strongly inferred
connectivity between the LHA and VTA. Evidence, such as dopamine (DA) efflux in terminal
regions in response to LHA stimulation, is often interpreted in a manner that implicates a
presumed LHA-VTA connectivity in the processing of motivated or rewarding behavior. A
general overview of existing research will be given to make the case for hypothesizing that
specific ultrastructural interactions exist between LHA neurons and VTA DA and GABA cell
groups.
1
1.2 Neural Pathways Involved in LHA Function
The mammalian hypothalamus acts as a homeostatic control center, as neurons in this region and
their associated circuitry exert regulatory control over an extensive part of the internal milieu
(Rinaman, 2007; Ter Horst and Luiten, 1987; van den Pol, 2003). An array of metabolic,
endocrine, autonomic, and behavioral responses serves to maintain the body’s internal
homeostasis, a process in which the LHA plays a key role, especially in energy balance and food
intake (Schwartz et al., 2000).
The circuitry described in the following paragraphs focuses on pathways relevant to LHA
function (Berthoud, 2004; Johnstone et al., 2006). Internal state signals gain access to
hypothalamic nuclei through various routes, including metabolite sensors, hormone receptors,
and neural afferents, including intrahypothalamic pathways. Hypothalamic areas involved in
hunger and satiety interact and are influenced by signals regarding circadian rhythm, energy and
metabolic state. Reciprocal connections between the LHA and the arcuate, paraventricular, and
dorsomedial nuclei, and an input to ventromedial nuclei, are thought to integrate endocrine and
autonomic information. Integrated information from the LHA may contribute to goal-directed
movement in the external environment that partakes in the maintenance of the body’s internal
homeostasis.
The LHA projects to the thalamus, motor and sensory cortices, and limbic system
components. In 1952, MacLean introduced the term limbic system to designate the forebrain
structures relevant to feeding, sexual, and defense behaviors and associated with higher neural
processing of autonomic and endocrine responses for visceral regulations (Mogenson et al.,
1980). The prefrontal cortex (PFC) and limbic system components, including the hippocampus,
2
extended amygdala, and nucleus accumbens (NAc), mediate cognitive, memory, emotional, and
reward processing, and these areas have reciprocal projections with the LHA (Berthoud, 2004).
Arousal/attention systems of the midbrain and pons (VTA, substantia nigra pars compacta,
pedunculopontine/laterodorsal and raphe nuclei, locus coeruleus) receive LHA input and project
efferents back to the LHA. Midbrain regions controlling sensory-motor coordination also have
reciprocal connections with the LHA. Finally, reciprocal pathways exist between the LHA and
the parabrachial nucleus and nucleus of the solitary tract, brainstem areas important in visceral
sensory processing.
Of particular relevance to motivated behavior are mesocorticolimbic pathways (Kalivas
and Volkow, 2005). The VTA sends DA and GABA projections to its major terminal fields, the
NAc and PFC (Swanson, 1982; Van Bockstaele and Pickel, 1995). Synaptic connections have
been clearly demonstrated between identified DA and GABA cell populations and these areas,
the laterodorsal tegmentum (LDT) in addition (Carr et al., 1999; Carr and Sesack, 2000a; Carr
and Sesack, 2000b; Carr and Sesack, 2000c; Omelchenko and Sesack, 2005; Sesack and Pickel,
1992b). In addition, pathways connecting the LHA, PFC, NAc shell, and amygdala have been
strongly implicated in incentive motivation for natural reinforcers (Hur and Zaborszky, 2005;
Kelley, 2004).
Complex circuitry involving the LHA and VTA highlights the presence of an important
pathway connecting one region involved in internal homeostasis, the LHA and its associated
circuitry, with a region important in goal-directed motor behavior, the VTA. Therefore, I propose
that the LHA may be an important area that relays integrated signals regarding internal
homeostasis to the VTA and its associated circuitry. It is important to note, however, that the
LHA may not be the only hypothalamic area to serve this role, as several other hypothalamic
3
nuclei shown to project directly to the VTA (Geisler et al., 2007; Geisler and Zahm, 2005) may
contribute alternately and/or additionally to the full expression of goal-directed behavior. As of
yet, anatomical substrates by which LHA neurons might influence VTA function have not been
described in detail.
1.3 The Importance of the LHA
The hypothalamus sends projections along the medial forebrain bundle (MFB) to the VTA and
contributes to the initiation of goal-directed behaviors (Mogenson et al., 1980). The LHA plays a
significant role in multiple functions including regulation of the autonomic nervous system,
sensory motor integration, arousal, sleep, and ingestive behavior (Bernardis and Bellinger, 1996;
Gao and van den Pol, 2001). Electrical stimulation of the MFB at the level of the LHA has been
shown to elicit behavioral activation, including defensive attack, drinking, feeding, and mating,
while electrolytic lesions of the LHA disrupt these complex responses (Bernardis and Bellinger,
1996; Elmquist et al., 1999; Mogenson et al., 1980). Such range of functions gives basis to
suggest that the LH may mediate integrative functions related to emotion, reward, aversion, and
learning (Ono et al., 1986).
A classical view that identifies the LHA as the “feeding center” (Anand and Brobeck,
1951) has since been redefined by the identification of signaling molecules of intra- and
extrahypothalamic pathways involved in feeding and energy balance (Berthoud, 2004; Elmquist
et al., 1999; Hoebel, 1997; Huang et al., 2007; Stanley et al., 1996; Stricker and Zigmond, 1984;
Williams et al., 2001; Woods et al., 1998). LHA microinjections of kainic acid that destroyed
cell bodies and spared passing fibers, including those of DA, produced inability to eat and drink,
4
but without the persistent disturbances of arousal and sensory-motor function typically observed
in animals with LHA electrolytic lesions, likely involving passing fibers (Grossman et al., 1978;
Grossman and Grossman, 1982). These studies suggest that the observed ingestive behavior
effects are associated with LHA neuronal loss, and not destruction of fibers of passage, and
support the role of LHA neurons as major contributors to a network supporting appetitive
locomotion.
The recent discovery of the orexin peptide (Orx; also called hypocretin) has generated
significant growth in the research field of sleep/wake regulation, and emphasizes the importance
of LHA function in behavioral state regulation (de Lecea et al., 1998; Sakurai, 2007; Sakurai et
al., 1998). Orx is synthesized exclusively in the LHA (Swanson et al., 2005) and projects widely
throughout the neuraxis (Peyron et al., 1998; van den Pol, 1999), including to all components of
the ascending arousal system where its effects are primarily excitatory (Saper et al., 2001;
Sutcliffe and de Lecea, 2002). In human narcoleptic patients, Orx cells are absent, critically
implicating Orx deficit as the cause of the sleep disorder narcolepsy (Thannickal et al., 2003).
Subsequently, it was then shown that disruption of the Orx neuropeptides, cells, or receptors
produce symptoms of narcolepsy in dogs, rats, and mice (Chemelli et al., 1999; Hara et al., 2001;
Mochizuki et al., 2004). Manifold roles for Orx, reputed a behavioral state integrator, have
emerged in appetite, autonomic/endocrine/metabolic regulations, cognition, and reward-seeking
(Burdakov and Alexopoulos, 2005; Carr and Kalivas, 2006; Kelley et al., 2005; Nishino, 2007;
Wise, 2006) and suggest Orx signaling as a functional link between behavioral state and adaptive
behavior (Sakurai, 2007). Of particular interest, a potential role of Orx in addiction has drawn
much attention to the precise mechanisms by which it exerts its actions in the VTA (Borgland et
al., 2006; Harris et al., 2005).
5
Evidence from mutant mice suggests an important signaling role for Orx-containing
neurons in the formation of adaptive food-seeking responses to metabolic challenge. Orx/ataxin-
3 transgenic mice, in which Orx neurons are ablated, fail to increase wakefulness and activity in
response to food deprivation compared to wild-type mice (Yamanaka et al., 2003). Under
restricted feeding, Orx-neuron ablated mice failed to engage in normal increases in wakefulness
and locomotor activity during food-anticipatory periods (Mieda et al., 2004). This study also
showed that Orx neuron activity in wild-type mice increased during the food-anticipatory period.
Because the VTA is a region that supports locomotor activity, it may be argued that Orx
afferents to the VTA provide metabolic signaling relevant to and in coordination with
approach/exploratory behaviors occurring during feeding or other high-arousal states.
Another high-arousal state that the LHA is involved in is sexual behavior. While the
medial preoptic area of the hypothalamus is well established to play a major role in regulating
male sexual behavior (Dominguez and Hull, 2005), the LHA has also been shown to influence
copulatory behavior by an inhibitory action of serotonin (Lorrain et al., 1997; Lorrain et al.,
1999) and by orexin (Muschamp et al., 2007), both interacting with VTA DA neurons.
1.4 The Importance of the VTA Dopamine and GABA Systems
As described in 1964 by Dalhström and Fuxe, and later by other researchers (e.g. (Swanson,
1982), the A10 DA system is located in the VTA and exerts a profound influence in the
modulation of complex behaviors (Blackburn et al., 1992; Mogenson et al., 1980) that in turn,
help to maintain internal homeostasis. More specifically, mesolimbic DA neurons are not reward
neurons per se, but instead predict changes in reward magnitude and thus influence selection in
6

approaching incentives that preserve homeostasis (Koob, 1996). More conservatively, DA (in the
NAc) may be thought of as a behavior reinforcer (Hoebel, 1997). According to Schultz,
“…dopamine function is characterized by a multitude of processes involved in mediating the
reactivity of the organism to the environment to assure the survival of the animal” (Schultz,
2007b).
VTA DA neurons make important contributions to reward processing, motivation,
learning, attention, decision-making, adaptive behavior, and stress response (Blackburn et al.,
1992; Hernandez et al., 2006; Mogenson et al., 1980; Schultz, 1998; Thierry et al., 1976; Wise,
2005). While DA transmission has been the focus of intense research in such functions named
here, defining its exact role remains controversial (Kiyatkin, 2002) and difficult to unravel
(Schultz, 2007b). Considering this range of behavioral processes, the time courses over which
changes in DA activity occur do appear to play important and differing roles in many brain
functions, and these roles differ in relation to the temporal dynamics of the particular function
(Schultz, 2007b).
Studies utilizing measurements of DA efflux as a result of stimulating the MFB have
contributed a myriad of behavior-linked observations that may attribute particular roles to DA
transmission, especially its release in the NAc. The question often remains, however, regarding
what aspect of the observed behavior that DA efflux pattern may encode (Garris et al., 1999;
Neill et al., 2002). An important issue relates to the fact that as many as 50 topographically
identified fiber systems ascend and descend the MFB at the level of the LHA (Veening et al.,
1982). Therefore, many authors acknowledge that the extent of DA’s involvement may be
contingent upon precise electrode placement and various stimulation parameters (e.g., electrode
7
tip size, pulse duration, current intensity) (Hernandez et al., 2006; Ikemoto and Wise, 2004;
Murray and Shizgal, 1996; Neill et al., 2002; Yeomans, 1989).
Given these considerations, such thorough examinations have contributed valuable insight
in behavior-associated DA activity, specifically, how reinforcing effects of natural rewards and
drugs of abuse are related to mesocortolimbic DA activity (White, 1996). During LHA electrical
stimulation or feeding, DA efflux increased in the nucleus accumbens, suggesting a potential role
for DA in feeding behavior (Hernandez and Hoebel, 1988). Using intracranial electrical
stimulation of DA neurons in rats previously trained to self-stimulate, subsequent experimenter-
delivered stimulation always elicited DA release, while during subsequent self-stimulation, DA
release was rarely observed (Garris et al., 1999). The authors point out that this dissociation
indicates the brain’s use of potent mechanisms to suppress release from mesolimbic DA neurons,
and invite further investigation of underlying mechanisms that down-regulate DA release with
the aim to “define the link between transient biochemical regulation of neuronal processes and
behaviour” (Garris et al., 1999).
Activity modes and activity mode switching of VTA DA neurons are thought to play
important roles in reward-related and decision-making processes in response to novel and salient
events (Cooper, 2002; Heien and Wightman, 2006; Overton and Clark, 1997; Schultz, 1998;
White, 1996). Three modes of DA neuron activity observed in vivo include an inactive,
hyperpolarized state, a single-spike firing mode (tonic activity), and a burst firing mode (phasic
activity) (Grace et al., 2007). Afferent input has been shown to dynamically regulate phasic and
tonic DA transmission (Floresco et al., 2003). In particular, glutamatergic afferents to the VTA
are thought to exert potent influence on DA cell activity and are crucial for the production of
burst firing (Grace et al., 2007; Kitai et al., 1999; Lodge and Grace, 2006b) which conveys
8
motivationally relevant information to forebrain areas (Overton and Clark, 1997). It has recently
been shown that active input from the LDT to the VTA is essential for gating the responsiveness
of DA neurons to glutamate input (Grace et al., 2007; Lodge and Grace, 2006b).
Approximately one-third of VTA neurons are non-DA (presumed to be GABA neurons)
(Swanson, 1982). This large population of non-DA cells in the VTA was later confirmed to
contain GABA (as described in (Van Bockstaele and Pickel, 1995)). The presence of numerous
GABA neurons among VTA DA neurons suggests a target, other than DA neurons, for afferent
input. Consistent with this idea, the firing rate of VTA non-DA (GABA-immunoreactive)
neurons appears to be dependent on afferent input (Steffensen et al., 1998). Presumed VTA
GABA neurons display variable discharge profiles associated with MFB stimulation (Steffensen
et al., 2001). If afferents of VTA neurons influence the responsiveness of DA and GABA
neurons, the LHA may be an important contributor as well.
1.5 Evidence of Connectivity Between the LHA and VTA
Olds and Milner observed that rats will learn to press a lever for electrical stimulation of the
lateral hypothalamus (Olds and Milner, 1954) and continue to work vigorously for stimulation
even during limited times of food availability (Routtenberg and Lindy, 1965). Since then, a
literary history spanning over six decades has uncovered some possible neural substrates,
including circuitry linking the LHA and VTA, by which brain stimulation mediates rewarding
effects. Hoebel and colleagues have hypothesized that hypothalamic output circuits facilitating
specific behavior reflexes connect to the VTA, stimulating DA release in the forebrain for the
reinforcement of currently activated sensory-motor pathways (Hoebel et al., 1989).
9
The LHA innervation to the VTA has been demonstrated by anterograde autoradiography
(Saper et al., 1979) and neural tract tracing (Phillipson, 1979). More recent examination of this
pathway using the specific anterograde tracer PHAL provides congruent support that VTA-
projecting axons from LHA neurons forms a substantial fiber pathway (Geisler and Zahm, 2005).
Consistent with these results, injection of FG into the VTA revealed a considerable number of
retrogradely labeled neurons in the LHA, located predominantly ipsilateral to the injection site
with fewer cells contralateral (Fadel and Deutch, 2002; Zahm et al., 2001).
The LHA projection to the VTA supports neurochemical signaling of a mixed phenotype.
The LHA is the forebrain area expressing the largest proportion of type 2 vesicular glutamate
transporter mRNA-positive/VTA-projecting neurons, and thus, provides a considerable
glutamate afferent to the VTA (Geisler et al., 2007) that may capably control DA burst firing
(Overton and Clark, 1997). Several neuropeptides, having predominant or at least potential
origin in the LHA, have been shown to project to the VTA. These include dynorphin, melanin-
concentrating hormone (MCH), cocaine- and amphetamine-regulated transcript (CART),
neurotensin, and Orx (Bittencourt et al., 1992; Dallvechia-Adams et al., 2002; Fadel and Deutch,
2002; Pickel et al., 1993; Woulfe and Beaudet, 1992; Zahm et al., 2001). Hypothalamic
modulation of these neuropeptides likely influences their actions in the VTA (Dallvechia-Adams
et al., 2002). These studies demonstrate that at least individual subpopulations of LHA cells
project to the VTA, and even synapse onto VTA DA neurons (Dallvechia-Adams et al., 2002;
Pickel et al., 1993; Woulfe and Beaudet, 1992).
Coupled to these data, LHA peptide Orx exerts activating effects onto VTA DA and
presumed GABA neurons (Korotkova et al., 2003). Intra-VTA infusion of Orx increases DA
efflux in the PFC, but not the NAc (Vittoz and Berridge, 2006). Orx activity critically enhances
10
glutamate signaling in the VTA, a mechanism that may explain the conditioned-place preference
for addictive drugs (Borgland et al., 2006; Harris et al., 2005). These studies suggest a prominent
interaction of Orx and VTA neurotransmission. However, the morphological substrates by which
Orx might exert its actions in the VTA remain to be characterized.
Electrophysiological study offers evidence for excitatory and inhibitory projections from
the LHA to the VTA. Stimulation of the LHA in cats resulted in short and long latency excitation
as well as antidromic activation of the VTA, and inhibition in half of the responsive neurons. In
some of these neurons, the short latency onset of inhibition is suggestive of an inhibitory
pathway that is monosynaptic (Edinger et al., 1977). Additionally, some neurons with high
spontaneous activity displayed a late post-excitatory suppression in response to LHA stimulation,
raising the possibility that local recurrent inhibitory circuits may be present (Edinger et al.,
1977). A study in rats showed that high proportions of VTA neurons, likely to be DA and non-
DA based on differential firing correlates, responded to LHA stimulation with suppression
followed by activation (Maeda and Mogenson, 1981). Putative non-DA neurons displayed
predominant suppression with short onset latencies, again, suggestive of monosynaptic
transmission (Maeda and Mogenson, 1981). Overall, these findings suggest that LHA electrical
stimulation evokes a mixed excitatory and predominant inhibitory influence onto VTA neurons.
Parametric single-unit recordings suggest that the rewarding effects of MFB self-
stimulation are mediated, at least in part, by small myelinated, fast-conducting fibers with short
refractory periods (Yeomans, 1979; Yeomans et al., 1988). Psychophysical inspection of reward-
relevant elements infers that at least some of the directly activated fibers responsible for
rewarding self-stimulation are long, thin myelinated fibers descending the MFB (therefore ruling
out catecholamine fibers) and connecting the LHA and VTA in series (Bielajew and Shizgal,
11
1986; Shizgal, 1989; Shizgal et al., 1980; Wise and Bozarth, 1984). In vivo recordings showed
that fast conduction velocity and short refractory period of VTA non-DA (shown to be GABA-
immunoreactive) neurons (Steffensen et al., 1998) are within range for a neuronal transducer of
rewarding self-stimulation (Bielajew and Shizgal, 1982; Yeomans, 1979). The potential role of
non-DA mechanisms subserving rewarding self-stimulation (Arvanitogiannis et al., 1996;
Yeomans and Baptista, 1997; Yeomans, 1989) raises immediate consideration of other signaling
systems, including GABA neurons in the VTA that may serve as an integrator of brain
stimulation reward (Lassen et al., 2007).
Electrophysiology combined with neurochemical evidence directly implicates LHA-VTA
connectivity in mediating rewarding brain stimulation. Local perfusion of tetrodotoxin (TTX) in
the VTA blocked extracellular DA increases in both the VTA and NAc induced by electrical
self-stimulation of the LHA and strongly inhibited self-stimulation as well, confirming that these
effects depend on synaptic input to the VTA (You et al., 2001). In contrast, TTX perfusion in the
NAc only slightly decreased self-stimulation rates, while effectively blocking stimulation-
induced increases in NAc DA levels (You et al., 2001), suggesting that synaptic transmission
within the NAc is not as critical in mediating self-stimulation and that NAc DA levels are not
predictive of self-stimulation response. Furthermore, LHA self-stimulation induced a TTX-
sensitive increase in glutamate in the VTA while having no effect on NAc glutamate levels (You
et al., 2001). While this study further characterizes DA-related effects and infers a synaptic
substrate of rewarding self-stimulation, the specific cell sources of synaptic input (and glutamate
transmission) are unidentified.
12
1.6 Summary and Conclusion
In summary, psychophysical and parametric studies strongly infer the reward-relevant
connectivity of the LHA and VTA. Electrophysiological and neurochemical evidences reveal
that both VTA DA and GABA neurons are influenced by the LHA, suggesting the existence of a
functional connection. Finally, previous microscopy studies confirm LHA afferents of the VTA,
suggesting an anatomical substrate whereby this hypothalamic structure communicates
information concerning the internal milieu to the performance of complex motor tasks, such as
copulation and foraging, and perhaps even to behavioral phenomenon, as in non-ingestive food
hoarding (Shizgal et al., 2001).
The collective findings support the need to confirm the putative connectivity of the LHA
and VTA. Therefore, the main hypothesis of the present research predicts that the LHA
projection interacts with morphological features of the VTA and synapses onto DA and GABA
neurons. The goal of this research is first, to characterize the ultrastructure of the LHA projection
to the VTA in order to establish the morphological substrates by which LHA axons interact with
DA and GABA neurons in this region (Chapter 2). The use of specific anterograde tracer PHAL
will provide the additional benefit of tracing this projection from LHA cells and not fibers of
passage. The second goal is to characterize the ultrastructural interactions of Orx neurons, a
LHA-specific subset of neurons, with structures in VTA, including both DA and GABA neurons
(Chapter 3). The content of Chapter 3 appears as it does in publication form (Balcita-Pedicino
and Sesack, 2007).
13
2.0 THE LATERAL HYPOTHALAMIC PROJECTION TO THE RAT VENTRAL
TEGMENTAL AREA: ULTRASTRUCTURAL INTERACTIONS WITH DA AND GABA
NEURONS
2.1 Abstract
Extensive functional and anatomical evidence suggests that the lateral hypothalamic area (LHA),
a forebrain region important for internal homeostasis, mediates a critical regulation of ventral
tegmental area (VTA) dopamine (DA) neurons that, in turn, modulate goal-directed behavior.
Although a substantial projection from the LHA to the VTA has been described in light
microscopic studies, the synaptic organization of this pathway has not been examined at the
electron microscopic level. We sought to address this issue by using immunoperoxidase
detection of the selective anterograde tracer Phaseolus vulgaris leucoagglutinin (PHAL) in
combination with immunogold-silver labeling for the DA synthetic enzyme tyrosine hydroxylase
(TH) or for GABA. Ultrastructural examination of the VTA revealed that many LHA varicosities
and axons, including myelinated axon fibers, pass through the VTA or appose dendrites without
synapsing. A substantial synaptic input also derives from the LHA, with the majority of synapses
being of the symmetric type and contacting TH- or GABA-labeled dendrites with roughly equal
frequency. LHA axons forming asymmetric synapses were also observed and tended to synapse
preferentially onto TH-labeled dendrites. These findings suggest that the LHA mediates a
complex synaptic regulation of both DA and GABA VTA neurons. Many LHA terminals
contained dense-cored vesicles and exhibited intricate associations with glial processes,
suggesting additional extra-synaptic modes of communication. These observations have
important implications for understanding the mechanisms whereby LHA neurotransmission in
14
the VTA may serve as a functional link between internal homeostatic needs and approach-
avoidance behaviors that facilitate adaptive behavior.
2.2 Introduction
The VTA is the locus of mesolimbic and mesocortical DA neurons (Moore and Bloom, 1978;
Ungerstedt, 1971) and exerts a profound influence on the modulation of motivated behaviors
(Mogenson et al., 1980; Schultz, 2007b). Long lines of evidence have implicated midbrain DA
neurons in reward, locomotor activity, attention, and decision-making (Blackburn et al., 1992;
Hernandez et al., 2006; Mogenson et al., 1980; Wise, 2005). This literature has developed
alongside extensive studies that have identified the LHA as an area that integrates interoceptive
signals and participates in somatic motor systems that help to achieve homeostasis, such as
nutrient ingestion, mating and defensive behaviors (Bernardis and Bellinger, 1996; Berthoud,
2004; Cabeza de Vaca and Carr, 1998; Carr, 2002; Elmquist et al., 1999; Fulton et al., 2006b;
Hoebel, 1997; Huang et al., 2007; Lorrain et al., 1997; Stanley et al., 1996; Stricker and
Zigmond, 1984; Williams et al., 2001; Woods et al., 1998). This convergence of research in
ingestive behavior and reward (Berthoud, 2004; Kelley, 2004; Saper et al., 2002; Shizgal et al.,
2001; Wise, 2005) raises important questions regarding the functional role of the projection from
the LHA to the VTA.
The hypothalamus sends projections along the medial forebrain bundle (MFB) to the VTA
and contributes to the initiation of goal-directed behaviors (Mogenson et al., 1980). Neural tract
tracing demonstrates a dense axonal projection from the LHA to the VTA (Geisler and Zahm,
2005; Phillipson, 1979) that includes neuroactive peptides (Fadel and Deutch, 2002; Zahm et al.,
15
2001). However, the synaptic organization of the LHA-VTA projection has not been extensively
examined in ultrastructural studies. To date, the only electron microscopic study describing a
possible LHA-derived input to the VTA demonstrated that axons containing melanin-
concentrating hormone (MCH) synapse onto VTA neurons (Dallvechia-Adams et al., 2002).
While the MCH input probably derives mainly from the LHA (Bittencourt et al., 1992; Swanson
et al., 2005), it could also arise from other hypothalamic sources. Furthermore, it is unlikely to
compose the bulk of the pathway from the LHA to the VTA. For example, retrograde tract-
tracing studies indicate that Orx-containing cells in the LHA and PFA comprise 20% of the VTA
projection (Fadel and Deutch, 2002) and that the LHA is a major source of glutamate afferents to
the VTA (Geisler et al., 2007). Other transmitter phenotypes are expressed in the LHA, including
GABA and other peptides, and these probably contribute to the projections to the VTA (Chou et
al., 2001; Geisler and Zahm, 2006; Meister, 2007).
A likely role of the LHA in regulating the activity of VTA DA neurons is suggested by
physiological studies. Many investigators attempting to define the anatomical substrate for
rewarding brain stimulation have emphasized the importance of LHA-VTA connectivity within
the continuum of the MFB (Arvanitogiannis et al., 1996; Wise, 2005; Wise and Bozarth, 1984;
Yeomans, 1989). Psychophysical inspection infers that at least some of the directly activated
fibers responsible for rewarding self-stimulation descend the MFB and connect the LHA and
VTA in series (Bielajew and Shizgal, 1986; Shizgal, 1989; Shizgal et al., 1980). Moreover,
electrical self-stimulation of the LHA increases DA efflux in the NAc, a major VTA terminal
field, and this effect is blocked by intra-VTA perfusion of tetrodotoxin, confirming that these
effects depend on synaptic input to the VTA (You et al., 2001).
16
More direct cellular electrophysiological studies report that a high proportion of VTA
neurons respond to LHA stimulation and that the dominant response is suppression of firing rate,
in some cases followed by a post-suppression activation. Non-DA (putative GABA) neurons in
particular display predominant suppression (Maeda and Mogenson, 1981). Therefore, both
electrophysiological and anatomical evidence supports a multi-phenotype projection from the
LHA to the VTA that synapses directly onto DA and GABA cells and functions in reward
relevant behaviors.
In order to understand the potential impact of the LHA on VTA cell population activity,
and its functional implications, it is important to identify the precise morphological substrates by
which these areas might communicate information pertinent to motivated behavior, decision-
making processes, and survival. The present study hypothesizes that LHA axons interact heavily
with both DA and GABA cells in the VTA, providing a predominant inhibitory-type of synaptic
input to both VTA cell groups. To investigate the ultrastructure of this pathway, we used
immunoperoxidase detection of the anterograde tract-tracer Phaseolus vulgaris leucoagglutinin
(PHAL) (Gerfen and Sawchenko, 1984; Wouterlood and Groenewegen, 1985) in combination
with immunogold-silver labeling for the DA synthetic enzyme tyrosine hydroxylase (TH) or
GABA. We performed electron microscopic examination of axons originating from LHA and
PFA neurons and interacting with VTA neuronal phenotypes in the rat. Elucidating these
anatomical foundations may contribute to understanding the functional links between the
systems that regulate energy homeostasis and those that regulate motivated behavior.
17
2.3 Materials and Methods
2.3.1 Animals
Six adult male Sprague Dawley rats were maintained on a 12:12 hr light:dark cycle (start of light
at 7 am) and allowed access to food and water ad libitum. Animals were handled according to
procedures recommended by the NIH Guide for the Care and Use of Experimental Animals and
approved by the Institutional Animal Care and Use Committee at the University of Pittsburgh.
2.3.2 Anterograde Tracer Injections
Naïve rats, weighing 301-351 g (average 325 g) at the time of surgery, were deeply anesthetized
with chloral hydrate (8%; 0.6 ml/100 g, i.p.; 2 rats) or a mixture composed of ketamine, xylazine,
and acepromazine (34, 7, and 1 mg/kg, respectively) administered at 0.8 ml/kg, i.m. (4 rats).
Anesthesia supplements were given approximately every 30-60 min or as needed. The fur was
shaved along the crown between the ears and rats were then placed in a stereotaxic frame. Core
body temperature was regulated using a thermostatically-regulated heating pad. An incision was
made from the forehead to the back of the head, centered between the ears. The scalp was then
retracted and a burr hole was drilled in the skull. PHAL (Vector Laboratories, Burlingame, CA)
was injected by iontophoresis into the LHA bilaterally as a 2.5% solution in 0.01 M phosphate
buffered saline (pH 7.4; PBS) using borosilicate glass capillary tubes with 25-50 μm tip
openings. The stereotaxic coordinates relative to bregma were: −2.5 mm posterior and 1.4 mm
lateral. A ventral coordinate of 8.4 mm was used based on the position of the skull surface above
the site of injection, rather than at bregma. The dura mater was pierced with a scalpel blade
immediately before lowering the glass pipette tip into the targeted area. The brain tissue was
18

allowed to settle for 5 min before beginning iontophoretic injection. Each injection was delivered
for 20 min using an alternating (7 sec on/7 sec off), positive current of 5 μA delivered by a
constant current device. The tip was then left in place for another 5 min before being removed
from the brain. The scalp incision was cleaned with saline, closed with staples and treated with
Neosporin ointment containing pain medication. Animals were placed in a plastic cage on top of
a heating pad until fully mobile and then returned to their home cages for 10-14 days to allow
transport of the tracer.
2.3.3 Fixation and Tissue Sectioning
On the day of sacrifice, the tracer-injected rats, weighing 301-400 g (average of 353 g), were
deeply anesthetized with sodium pentobarbital 60-100 mg/kg, i.p., then injected with a zinc
chelator, sodium diethyldithiocarbamate (Sigma, St. Louis, MO), 1 g/kg, i.p. to prevent
artifactual silver deposition (Veznedaroglu and Milner, 1992). After 15 min, the rats were killed
by transcardial perfusion with solutions in the following order: approximately 10 ml of 1000
U/ml heparin saline (Elkins-Sinn); 50 ml of 3.75% acrolein (Electron Microscopy Sciences, Fort
Washington, PA) in 2% paraformaldehyde (Electron Microscopy Sciences); 400 ml of 2%
paraformaldehyde made in 0.1 M phosphate buffer, pH 7.4 (PB). Brains were post-fixed in 2%
paraformaldehyde for 30 min then rinsed in PB. Sections through the rostro-caudal extent of the
LHA and VTA were sliced on a vibratome at a thickness of 50 µm. For each animal, a series of 6
adjacent tissue sets was collected in cold PB. The tissue sections were processed for either light
or electron microscopy. Unless otherwise noted, all incubations and rinses were carried out at
room temperature and with continuous gentle agitation. All sections were treated with 1%
sodium borohydride (Sigma) in PB for 30 min, rinsed extensively in PB, rinsed in 0.1 M tris-
19
buffered saline (pH 7.6; TBS), and transferred for 30 min to blocking solution in TBS containing
1% bovine serum albumin, 3% normal goat serum, and either 0.3% or 0.04% Triton X-100
(Sigma) for light or electron microscopy, respectively. Sections were then treated with primary
antibodies in blocking solution for single labeling with immunoperoxidase or dual labeling with
immunoperoxidase plus immunogold-silver.
2.3.4 Single Labeling Immunocytochemistry
To assess tracer injections within the LHA and anterograde transport to the VTA, PHAL was
visualized using immunoperoxidase detection of rabbit anti-PHAL antibody (Vector, No. L-
1110; 1:1000). After overnight incubation (14-16 hr), tissue was rinsed in TBS, incubated for 30
min in biotinylated goat anti-rabbit secondary antibody (Vector, No. BA-1000; 1:400), rinsed
again and exposed for 30 min to avidin-biotin peroxidase complex (ABC elite, Vector). After
rinsing in TBS, bound peroxidase was reacted for 3.5-5 min with 0.022% diaminobenzidine
(Sigma) and 0.003% hydrogen peroxide in TBS to produce a visible product. The peroxidase
reaction was stopped by rinsing in TBS. Sections for light microscopic analysis were rinsed in
PBS, mounted on slides, then dehydrated and coverslipped. A few single-label PHAL sections
through the VTA were prepared for electron microscopic examination (see below) to ensure
exclusive anterograde transport. Otherwise, most sections were further processed through
immunogold-silver incubation steps.
2.3.5 Double Labeling Immunocytochemistry
Alternate tissue sections were processed for dual immunoperoxidase labeling of PHAL and
immunogold-silver detection of either TH or GABA in soma and dendrites in the VTA. Sections
20
were incubated simultaneously with anti-PHAL and either mouse anti-TH (Chemicon, Temecula,
CA; #MAB318; 1:5000) or mouse anti-GABA (Sigma; #A-0310; 1:1000-2000) antibodies.
Following detection of PHAL by avidin-biotin peroxidase (described above), the tissue was
transferred from PBS rinses and incubated for 30 min in washing buffer containing 0.8% bovine
serum albumin, 0.5% fish gelatin, and 3% normal goat serum (Sigma) in PBS. The tissue was
exposed overnight to washing buffer containing goat anti-mouse, 1 nm gold-conjugated
secondary antibody (Amersham, Piscataway, NJ; 1:50). Tissue sections were rinsed in washing
buffer followed by PBS, and then treated with 2% glutaraldehyde (Electron Microscopy
Sciences) in PBS for 10 min without agitation. The sections were rinsed thoroughly in PBS
before processing for silver enhancement of gold-conjugated antibody. Sections were transferred
through three 1 min rinses in 0.2 M sodium citrate buffer (pH 7.4) and then incubated for an
empirically determined time (4-6 min) in silver solution (IntenSE M, Amersham). The tissue was
then rinsed twice in citrate buffer and twice in PB before preparation for electron microscopy.
2.3.6 Tissue Preparation for Electron Microscopy
The labeled sections were processed for electron microscopic analysis by incubation for 1 hr in
2% osmium tetroxide (Electron Microscopy Sciences) in PB followed by rinsing in PB. The
tissue was then dehydrated in ascending concentrations of ethanol followed by propylene oxide
and then immersed overnight in a 1:1 mixture of propylene oxide and epoxy embedding resin
(EMbed-812, Electron Microscopy Sciences). The propylene oxide/epoxy mixture was then
replaced with pure epoxy resin for 2 hr. The sections were embedded between sheets of plastic
and cured for up to 48 hr at 60oC. Ultrathin sections (60-75 nm) through the VTA were collected
in serial order onto copper mesh grids. The grids were counterstained with 5% uranyl acetate and
21

Reynold’s lead citrate and analyzed on either a Zeiss 902 or FEI Morgagni 268 transmission
electron microscope. Analog micrographs were developed to desired contrast and brightness
using darkroom procedures, and then transferred to digital form. Digital electron micrographs
were collected using an AMT-XR 60 camera (Advanced Microscopy Techniques Corp.,
Danvers, MA) and adjusted to matching contrast and brightness using Photoshop. Digital light
microscopic images were likewise adjusted.
2.3.7 Antibody Specificity
The antibody against PHAL has been used widely in previous studies to visualize the
anterograde axonal transport of this tracer (Gerfen and Sawchenko, 1984; Sesack and Pickel,
1992b). Its specificity is evidenced by the absence of staining in brain regions that do not receive
afferents from the site of injection. We have used the antibodies against TH and GABA
repeatedly for labeling structures in the VTA and, in addition to others, described the specificity
of these reagents in previous publications (Aston-Jones et al., 2004; Carr and Sesack, 2000c;
Lewis et al., 1994; Omelchenko and Sesack, 2005; Sesack et al., 1995; Van Bockstaele and
Pickel, 1995; Waselus et al., 2005). The monoclonal TH antibody was raised against an N-
terminus 59-61 kDa protein isolated from PC12 cells. According to the supplier, western blot
analysis indicates that it does not recognize other monoamine synthesizing enzymes. The GABA
antibody raised in mouse was directed against GABA that had been purified and conjugated to
bovine serum albumin. As described by the manufacturer, dot blot immunoassay confirms that
the antibody does not recognize structurally related amino acids.
22
2.3.8 Ultrastructural Analysis
For each animal, 2-6 sections through the rostral VTA (-4.8 to -5.8 mm from Bregma) (Paxinos
and Watson, 1998) were examined for the presence of PHAL labeling. Sections singly labeled by
immunoperoxidase for PHAL were assessed for the specific confinement of transport to axonal
compartments within the VTA. Tissue sections dually labeled by immunoperoxidase for PHAL
and by immunogold-silver for TH or GABA were used for determining the synaptic organization
of the LHA input to the VTA in relation to these neuronal phenotypes. In these samples, analysis
was restricted to the surface where the tissue interfaces with the plastic resin and where
penetration of both gold and peroxidase immunoreagents was maximal.
We estimated the area of tissue sampled based on the number of grid squares analyzed, the
area of a grid square (3,025 µm2), and an estimation of the percentage of each square that
contained tissue versus plastic resin. For tissue dually labeled for PHAL and TH, the area
sampled ranged from 95,288 to 257,125 µm2 per animal (Table 1). For tissue labeled for PHAL
and GABA, sampling ranged from 106,631 to 331,238 µm2 per animal (Table 1).
Neuronal elements were identified by morphological features as described by Peters and
Palay (Peters and Palay, 1991). Axons were small diameter structures containing microtubules
and occasional vesicles and often localized to bundles. Varicosities were identified as being
larger in diameter and having more numerous vesicles and mitochondria. Synapses were defined
by parallel thickenings of the pre- and postsynaptic membranes, intercleft filaments, and vesicle
accumulations along the presynaptic density. Asymmetric synapses (correlated with an
excitatory physiology) were distinguished from symmetric synapses (correlated with inhibition)
by their more prominent postsynaptic thickening (Carlin, 1980). Perikarya were distinguished
from proximal dendrites by the presence of a nuclear membrane. Dendrites typically contained
23
large areas of cytoplasm accommodating mitochondria, microtubules, and few vesicles, and were
postsynaptic to axon terminals. Glial processes were identified by thin and irregular contours,
relatively vacant cytoplasm, and occasional formation of tight junctions.
Specific immunoperoxidase labeling for PHAL was defined as a flocculent, electron dense
material within axons. In most cases, PHAL-labeled profiles were examined in serial sections to
determine whether synaptic contacts were formed, to distinguish symmetric and asymmetric
synapses, and/or to observe complex spatial interactions with surrounding structures.
Occasionally, a PHAL-immunoreactive (-ir) terminal contacted more than one structure and was
counted as a single PHAL profile making multiple interactions. Immunogold-silver labeling for
TH or GABA was defined as specific when profiles contained at least three separate gold
particles and occurred within fields that contained at least one other instance of specific
immunogold labeling. This ensured sampling of only tissue depths where penetration of the less
sensitive immunogold reagents was adequate.
2.4 Results
2.4.1 Light Microscopic Immunolabeling for PHAL in the Rat LHA and VTA
The density of LHA afferents to the VTA observed in the present study agrees well with
previous light microscopic reports (Geisler and Zahm, 2005; Phillipson, 1979). Within the LHA,
immunoperoxidase detection of PHAL (Fig. 1A) revealed staining in numerous cell bodies and
dendrites. Labeled perikarya appeared in sharp contrast to a background cloud of diffuse
peroxidase deposit. Also labeled were fine mesh-like networks of axon fibers that surrounded the
labeled cells. The area of the largest cluster of PHAL-labeled cell bodies was interpreted as the
central core of each PHAL injection, based on prior characterizations (Gerfen and Sawchenko,
24
1984). The earliest studies with PHAL noted that the effective injection site (i.e. the source of
anterograde transport) was confined to the region containing clearly labeled cells (Gerfen and
Sawchenko, 1984). This strategy for defining injection sites was used here. However,
investigators have noted more recently a weaker expression of PHAL within soma at the
injection site, making it more difficult to define the site of effective transport. Hence, we cannot
be certain that some minor transport to the VTA did not originate from structures in the
immediate vicinity of the LHA.
A PHAL injection was considered to be well-placed and thus included in electron
microscopic analyses if it was centered within the LHA (Paxinos and Watson, 1998) and did not
involve the following areas, some of which send separate projections to the VTA (Geisler and
Zahm, 2005): dorsomedial, ventromedial, zona incerta, subthalamic nucleus, and lateral preoptic
area. Cases were also excluded if the pipette tip directly entered the mammillothalamic tract or
internal capsule. In some cases it was possible that subthalamic neurons situated near the lateral
edges of the LHA may have taken up tracer even though the injection site did not encompass the
subthalamic nucleus proper. In addition to cases in which the injection site was mainly within the
LHA, some animals had one of the bilateral injections centered mainly in the perifornical area
with occasional diffusion to lateral parts of the LHA (i.e. lateral to the fornix).
Immunolabeling of PHAL anterogradely transported to the VTA (Fig. 1B) revealed axons that
were heavily beaded (Fig. 1B, inset). PHAL injections centered in the LHA produced a dense
distribution of labeled axons throughout the rostral VTA, especially lateral to the fasciculus
retroflexus where beaded fibers were tightly packed and oriented relatively perpendicular to the
coronal plane. Dorsal, medial and ventral to this dense zone, axons appeared to traverse the VTA
within the coronal plane. Axon fiber staining was less dense following PHAL injections centered
25

mostly in the perifornical area. Light microscopic examination of VTA sections labeled with
immunogold-silver for TH (Fig. 1C) revealed perikarya and proximal and distal dendritic
branches with a distribution matching previous reports (Swanson, 1982).
26
Ch. 1, Figure 1
Ch. 1, Figure 1: Light microscopic images of coronal sections through the rat brain
showing representative injection sites and transport of PHAL and immunocytochemistry
for TH.
27
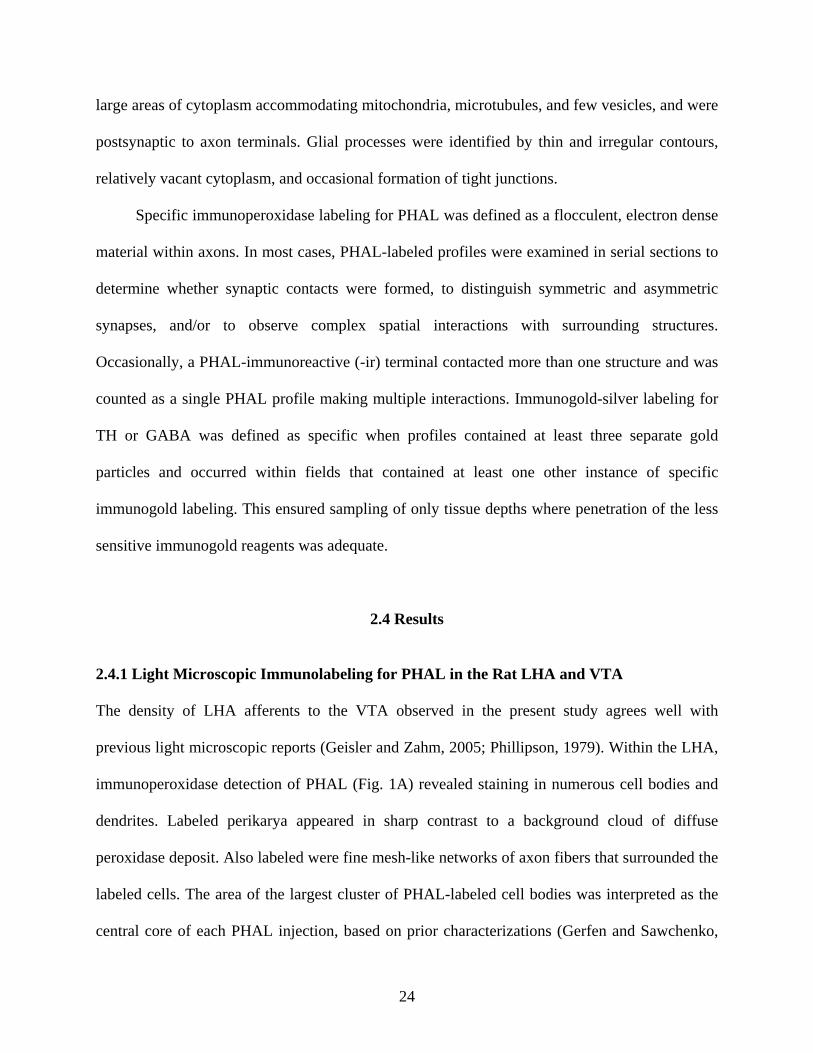
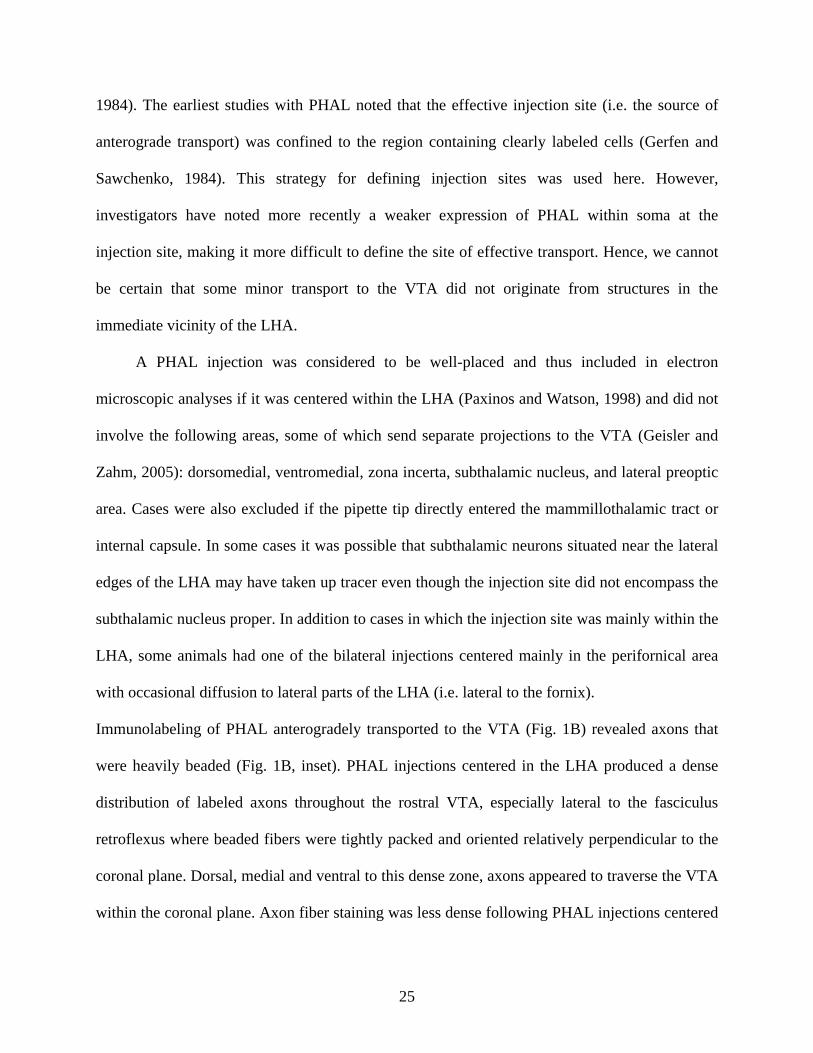
Ch. 1, Figure 1: Light microscopic images of coronal sections through the rat brain showing
representative injection sites and transport of PHAL and immunocytochemistry for TH.
A: This PHAL injection site is centered in the LHA and also includes the region immediately
adjacent to the entopeduncular nucleus. The injection site is bounded laterally by the internal
capsule (ic), dorsally by the mammillothalamic tract (mt) and ventrally by the fornix (f); 3V,
third ventricle. B: The anterograde transport of PHAL to the VTA is observed in numerous
axons with a highly branched and beaded morphology in a region lateral to the fasciculus
retroflexus (fr) and dorsal to the mammillary peduncle (mp). Arrows indicate the same cluster of
beaded axons at low and high magnification (inset). C: Immunogold-silver labeling for TH
appears within perikarya and proximal (large arrows) and distal (small arrows) dendrites. Scale
bar represents 500 μm in A and B and 62.5 µm in C and inset.
28

2.4.2 Electron Microscopic Visualization of LHA Axons within the VTA
Immunoperoxidase labeling for PHAL, anterogradely transported from the LHA, was observed
in axon fibers, and not within dendrites or soma, in the VTA. PHAL immunoreactivity appeared
flocculant and evenly diffuse within axon membrane bounds, with the most intense staining
surrounding vesicles. The majority of LHA axons appeared to be fibers passing through the
VTA, including some myelinated axons (Fig. 2A) ranging in size from 0.6 to 3.3 μm in diameter
taken at the widest width. Other passing LHA axons were small unmyelinated fibers traveling
within bundles of axons with similar morphology (Fig. 2B), and varicosities that lacked contact
with surrounding dendrites (Fig. 2B,C). Often, glial processes encircled LHA varicosities (Fig.
2B) and many of these axons contained dense-cored vesicles (Figs. 2C; 3C,D), consistent with
the localization of many peptides in LHA neurons. The majority of LHA axons were apposed to
dendrites in the VTA without forming synaptic specializations at these sites of contact (Table 1).
The remaining contacts were synapses primarily onto dendrites and rarely onto soma. LHA
terminals exhibited synapses with symmetric (presumably inhibitory; Fig. 2E,G) morphology
more frequently than asymmetric synapses (presumably excitatory; Fig. 2D,F). Both types of
synapses were observed onto proximal (Fig. 2E) and, sometimes, more distal (Fig. 2F,G)
dendrites, including infrequent dendritic spines. Occasionally, single LHA axons synapsed onto
multiple adjacent dendrites (data not shown).
29
Ch. 1, Figure 2
Ch. 1, Figure 2: Electron micrographs of the rat VTA illustrating the ultrastructural
characteristics of fibers labeled by immunoperoxidase for PHAL transported from the
LHA.
30
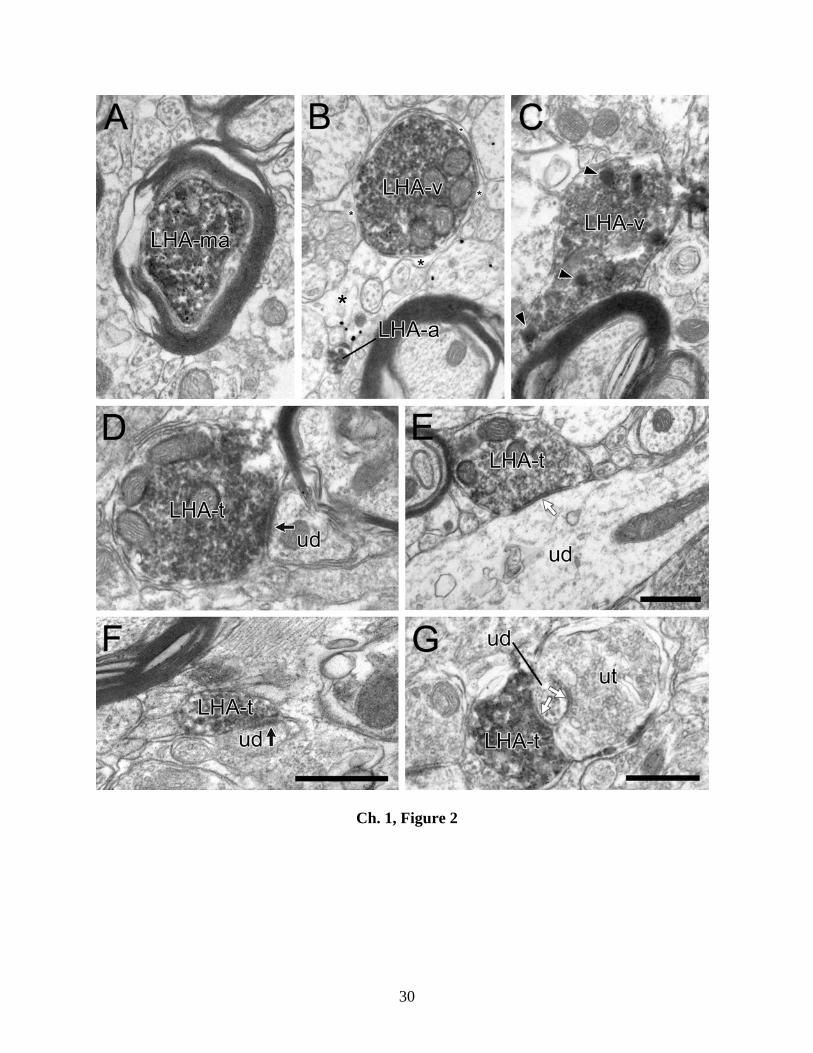
Ch. 1, Figure 2: Electron micrographs of the rat VTA illustrating the ultrastructural
characteristics of fibers labeled by immunoperoxidase for PHAL transported from the LHA.
A: LHA axons are occasionally myelinated (LHA-ma). B: Most LHA fibers are either
varicosities (LHA-v) or passing axons (LHA-a) that do not contact dendrites. Asterisks indicate
glial processes encircling the LHA-v; near the LHA-a, the glial process contains immunogold-
silver labeling for GABA. C: Some LHA varicosities (LHA-v) contain numerous dense-cored
vesicles (arrowheads). D-G: LHA terminal axons (LHA-t) occasionally form synapses of
asymmetric type (black arrows in D,F) and, more commonly, of symmetric morphology (white
arrows in E,G) onto unlabeled dendrites (ud). In some cases these dendrites are notably distal
(F,G). The distal dendrite in G also receives a second synapse from an unlabeled terminal (ut).
Scale bars = 0.5 μm. The scale bar in E also applies to B and C; the scale bar in G also applies to
A and D.
31
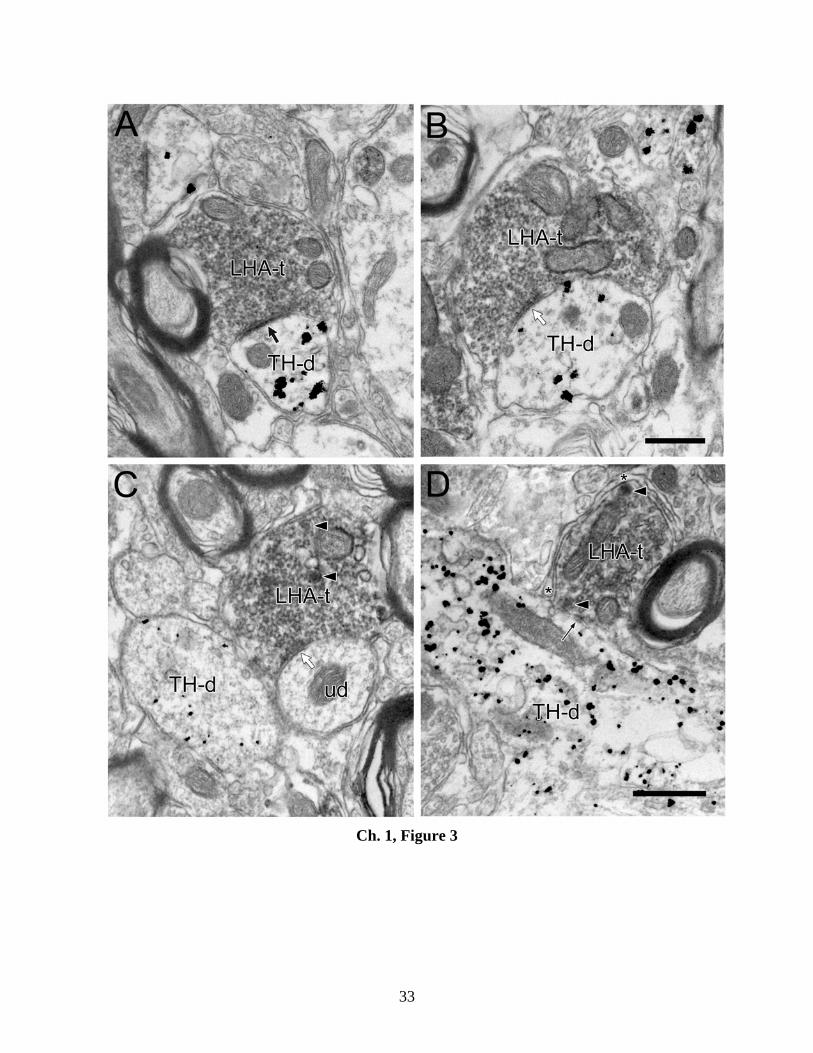
2.4.3 Ultrastructural Relationships between LHA Axons and TH-ir and GABA-ir
Structures in the VTA
Immunogold-silver labeling for TH was observed in dendrites and perikarya in the VTA. Within
this tissue, LHA axons synapsed onto both proximal and distal dendrites that were either labeled
or unlabeled for TH. Some of these synapses had asymmetric morphology, in which case the
majority of the targets were immunoreactive for TH (Fig. 3A; Table 1); the remaining targets
were unlabeled. The more numerous symmetric synapses contacted TH-labeled (Fig. 3B) and
unlabeled dendrites with roughly equal frequency (Table 1). In some cases, LHA terminals
synapsed onto unlabeled structures in the immediate vicinity of TH-labeled dendrites (Fig. 3C).
Other LHA axons were apposed to TH-labeled or unlabeled dendrites without synapsing on these
structures (Fig. 3D). The presence of dense-cored vesicles and the envelopment of these axons
by glial processes suggest possible non-synaptic modes of communication. Occasionally, LHA
axons were spatially separated from TH-labeled dendrites by glial processes. Serial analysis of
such axon profiles often confirmed the continuation of this glial separation across multiple
sections.
32
Ch. 1, Figure 3
Ch. 1, Figure 3: Electron micrographs of the rat VTA depicting dual immunoperoxidase
labeling for PHAL transported in LHA terminals and immunogold-silver labeling for TH.
33
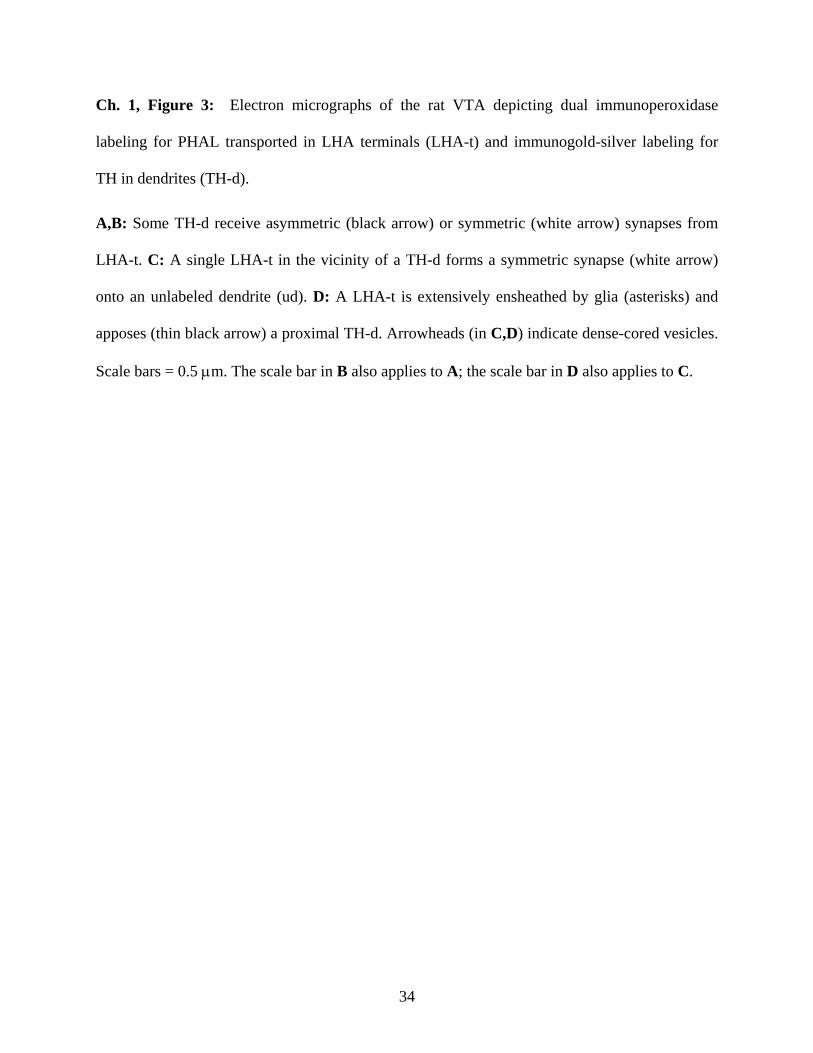
Ch. 1, Figure 3: Electron micrographs of the rat VTA depicting dual immunoperoxidase
labeling for PHAL transported in LHA terminals (LHA-t) and immunogold-silver labeling for
TH in dendrites (TH-d).
A,B: Some TH-d receive asymmetric (black arrow) or symmetric (white arrow) synapses from
LHA-t. C: A single LHA-t in the vicinity of a TH-d forms a symmetric synapse (white arrow)
onto an unlabeled dendrite (ud). D: A LHA-t is extensively ensheathed by glia (asterisks) and
apposes (thin black arrow) a proximal TH-d. Arrowheads (in C,D) indicate dense-cored vesicles.
Scale bars = 0.5 μm. The scale bar in B also applies to A; the scale bar in D also applies to C.
34

Ch. 1, Table 1. LHA Axons Contacting Dendrites in the VTA
All PHAL + TH PHAL + GABA
Number of rats 6 6 6Number of sections 34 17 17Area of tissue examined (µm2) 2,117,500 1,010,350 1,107,150Total number of PHAL-ir axons observed 1679 942 737Total number of contacts observeda 350/1679 (21%) 208/942 (22%) 142/737 (19%)
114/208 (55%) 63/142 (44%)
Number (%) of appositions 219/350 (63%) 136/208 (65%) 83/142 (58%)77/136 (57%) 39/83 (47%)
Number (%) of asymmetric synapses 29/350 (8%) 19/208 (9%) 10/142 (7%)13/19 (68%)b 3/10 (30%)b
Number (%) of symmetric synapses 102/350 (29%) 53/208 (25%) 49/142 (35%)24/53 (45%) 21/49 (43%)
a includes synapses and appositions with no glial separationsb not significantly different, Fisher's exact test
Tissue labeled for
Table 1. LHA Axons Contacting Dendrites in the Rat VTA
onto labeled dendrites
onto labeled dendrites
onto labeled dendrites
onto labeled dendrites
Immunogold-silver labeling for GABA was observed in axons, dendrites, soma, and glial
processes in the VTA. Within this tissue, LHA axons forming asymmetric synapses were
typically directed to unlabeled dendrites and less frequently observed to contact GABA-positive
dendrites (Fig. 4A,B; Table 1). Conversely, symmetric synapses formed by LHA axons were
more equivalently distributed to GABA-labeled (Fig. 4C,D) and unlabeled dendrites (Table 1).
Other LHA axons were apposed to either labeled or unlabeled dendrites without synapsing.
Occasionally, LHA axons containing immunoperoxidase labeling for PHAL also displayed
immunogold-silver labeling for GABA (Fig. 4D). When these dually-labeled axons formed
synapses, they were typically of the symmetric type.
35
Ch. 1, Figure 4
Ch. 1, Figure 4: Electron micrographs of the rat VTA depicting dual immunoperoxidase
labeling for PHAL transported in LHA terminals synapsing onto dendrites containing
immunogold-silver labeling for GABA.
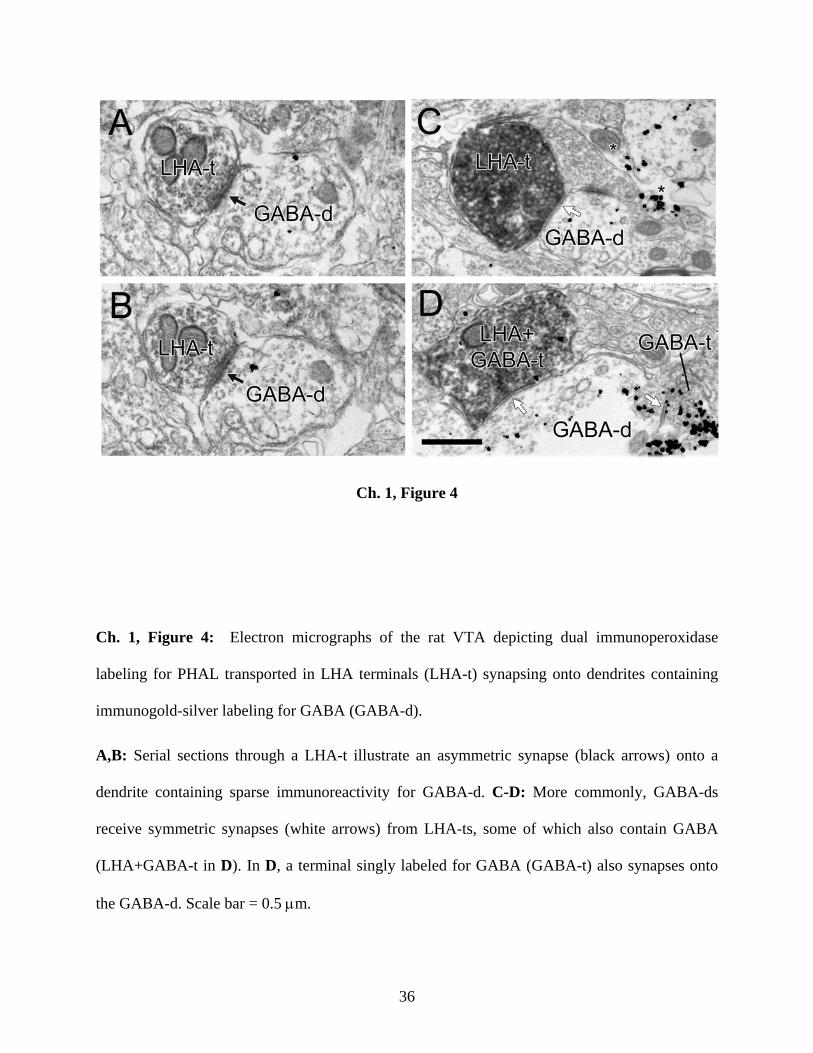
Ch. 1, Figure 4: Electron micrographs of the rat VTA depicting dual immunoperoxidase
labeling for PHAL transported in LHA terminals (LHA-t) synapsing onto dendrites containing
immunogold-silver labeling for GABA (GABA-d).
A,B: Serial sections through a LHA-t illustrate an asymmetric synapse (black arrows) onto a
dendrite containing sparse immunoreactivity for GABA-d. C-D: More commonly, GABA-ds
receive symmetric synapses (white arrows) from LHA-ts, some of which also contain GABA
(LHA+GABA-t in D). In D, a terminal singly labeled for GABA (GABA-t) also synapses onto
the GABA-d. Scale bar = 0.5 μm.
36

2.5 Discussion
The present study represents the first detailed ultrastructural examination of LHA afferents to the
VTA. The major findings are generally consistent with our hypothesis and demonstrate that: 1)
the majority of fibers in this pathway pass through the VTA without synapsing, 2) over a third of
the contacts made are synaptic, mainly exhibit morphological features correlated with inhibitory
physiology, and occur with similar incidence onto DA and GABA neurons, 3) the less common
excitatory-type synapses show a trend toward preferentially contacting DA neurons, 4) LHA
axons have ultrastructural features suggestive of extra-synaptic transmission via neuropeptides.
2.5.1 Methodological Considerations
The use of PHAL allowed us to trace and visualize axons in the VTA that originate from cell
bodies at the site of injections confined to specific hypothalamic areas. Iontophoretically
delivered PHAL is transported specifically by neurons whose dendrites extend into the core of
the injection site, and not by passing axons, as previously shown by failure to label axons in
terminal fields of PHAL-injected fiber tracts (Gerfen and Sawchenko, 1984). Hence, this
technique enables the precise study of axons originating from LHA-PFA neurons by excluding
the many passing fibers of the MFB (Veening et al., 1982) that may also project to the VTA.
Furthermore, differences in the density of cells taking up tracer in the LHA and/or PFA can be
correlated with the observed density of axonal labeling in the VTA to make qualitative
assessments of the relative topography of the projection from the hypothalamus.
Efforts were made to control for false negative counts that may be due to limited
penetration of antibodies (Sesack et al., 2006). TH and GABA antigens in high abundance in
37
dendrites were labeled with the less sensitive immunogold reagents, an approach that has been
used successfully in prior studies by this laboratory. However, we have noted a restriction in the
ability of antibodies to dually label axon varicosities in tissue prepared for electron microscopy.
For example, in GABA-labeled tissue, symmetric synapses of PHAL-ir terminals rarely
exhibited immunoreactivity for GABA, an observation at odds with previous studies showing an
abundance of LHA cells that express GAD mRNA (Meister, 2007; Rosin et al., 2003). Factors
that may have contributed to this issue include the inability to label an entire pathway with tract
tracing, spatial interference between multiple antibodies accessing the same small compartment,
and the unequal sensitivity of the two immunolabeling methods used. Hence, it is important to
acknowledge a potential underestimation of GABA labeling, particularly within axon terminals.
2.5.2 Ultrastructural Features of the LHA Projection to the VTA
The ultrastructural observation that many LHA axons seemed to be fibers of passage is
inconsistent with the light microscopic appearance of this pathway, which suggests extensive
synaptic contacts within the VTA. Of course, many LHA axons did synapse onto VTA dendrites,
and a number of passing fibers may simply be en route to more caudal portions of the VTA. Our
finding of a small proportion of myelinated LHA axons in the VTA is consistent with prior
electrophysiological estimates of conduction velocity, which suggest that less than 10% of the
axons passing through the MFB are myelinated (Yeomans, 1989). Although we did not conduct a
complete analysis of size, the approximate diameter of the myelinated LHA axons observed
within the VTA matches the range (0.5 to 2 µm) estimated by prior physiological analysis of
axons connecting the LHA and VTA that support MFB self-stimulation (Shizgal et al., 1980).
38
The finding of numerous dense-cored vesicles in LHA axons suggests that this projection
is likely to include many neuropeptides, consistent with studies demonstrating dense LHA inputs
to the VTA containing Orx, dynorphin, neurotensin, cocaine- and amphetamine- regulated
transcript (CART), and MCH (Bittencourt et al., 1992; Chou et al., 2001; Dallvechia-Adams et
al., 2002; Fadel and Deutch, 2002; Geisler and Zahm, 2006). Dense-cored vesicles are typically
localized at non-synaptic regions of the plasma membrane, suggesting neuropeptide release
outside of classically defined junctions and consequent volume transmission (Agnati et al., 1995;
Thureson-Klein and Klein, 1990). As described in the introduction, some of these peptides may
derive from additional sources outside the LHA. In this regard, dynorphin-containing axons from
striatal sources exhibit a distinctive convergence pattern onto VTA dendrites (Pickel et al., 1993)
that was not observed for LHA axons in the present study.
Glial processes and LHA axons were observed in several discriminate conformations
suggesting directive, dynamic control of neurochemical signaling (Hatton, 2004) of adjacent
LHA axons with the surrounding environment. Glial leaflets surrounding or separating LHA
varicosities from dendrites might serve as barriers against synaptic contact with adjacent
dendrites, while promoting non-synaptic communication with other targets, particularly in the
case of peptide release from extrasynaptic dense-cored vesicles (Oliet et al., 2001; Piet et al.,
2004; Sykova, 2004). The prominence of such glial arrangements around LHA axons noted here
raises the question of whether glia in the VTA might express receptors and/or transporters that
could influence the synthesis, transmission, and degradation of neurochemicals released from
LHA fibers.
The fact that the majority of LHA fibers in the VTA were passing axons and non-
contacting varicosities, does not trivialize the remaining 25% of this pathway that contacted
39
dendrites. That the majority of synapses formed by LHA terminals had symmetric morphology
suggests that this pathway is predominantly inhibitory to the VTA. This is consistent with the
extensive localization of GABA neurons throughout the LHA, as visualized by GAD mRNA
(Meister, 2007; Rosin et al., 2003). Our findings also agree with the predominant suppression of
VTA cell activity reported following electrical stimulation of the LHA (Maeda and Mogenson,
1981). Future studies using postembedding methods are needed to verify that the majority of
symmetric synapses formed by LHA axons contain immunoreactivity for GABA.
The presence of less numerous synapses of the asymmetric (presumed excitatory) type
suggests that the LHA also mediates a more modest excitatory influence on VTA neurons.
Whether these synapses release glutamate as a transmitter requires investigation by
postembedding techniques. However, the finding of asymmetric synapses is entirely consistent
with a recent study using retrograde tract-tracing to demonstrate that the LHA is a major source
of VTA afferents that express the type 2 vesicular transporter (Geisler et al., 2007). Moreover,
quantitative estimates suggest that the LHA may be the second largest source of glutamate
afferents to the VTA. Hence, despite being less common, asymmetric synapses formed by LHA
axons probably mediate an important excitatory influence on VTA cells. The tendency to
observe these synapses more often onto DA neurons suggests that the LHA may mediate a
preferential excitatory input onto DA versus GABA cells. Such signaling capacity gives reason
to consider whether an excitatory projection from the LHA directly regulates the DA burst
activity that signals behaviorally relevant events (Schultz, 1998).
The smaller proportion of asymmetric LHA synapses onto GABA dendrites, relative to
those onto DA dendrites, suggests that VTA GABA cells receive limited excitatory drive from
the LHA. However, direct inputs may not be the only means by which VTA cells are activated
40
by LHA inputs. Preliminary data from our lab demonstrates local connections of presumed
GABA neurons within the VTA onto other GABA cells as well as onto DA neurons
(Omelchenko and Sesack, 2006). Hence, symmetric, presumably inhibitory synapses from the
LHA onto VTA GABA cells provide the potential circuitry for disinhibitory influences on either
DA or GABA neurons.
2.5.3 Functional Implications
The present data indicate that the LHA to VTA pathway mediates a complex mixture of
excitation, inhibition, disinhibition and peptide modulation. Collectively, these afferents are
likely to provide a critical regulation of VTA cell activity that ultimately contributes to approach
or avoidance behaviors. The finding of primarily symmetric synapses formed by LHA axons
agrees with a mainly suppressive physiology of this pathway and suggests that the main effect of
the LHA on VTA DA neurons is to reduce firing and hence to favor avoidance behavior (Ono et
al., 1986). On the other hand, the asymmetric synapses formed by LHA axons tend to synapse
primarily onto DA cells, suggesting that LHA afferents might also directly increase DA cell
activity and release in forebrain target areas (Hernandez and Hoebel, 1988; You et al., 2001) in a
manner that facilitates approach to rewarding stimuli.
Extensive additional experimentation is needed to directly connect specific cell phenotypes
in the LHA with specific populations of neurons in the VTA. For example, it remains to be
determined whether LHA axons in the VTA synapse preferentially onto DA or GABA cells that
project to the PFC or to the NAc, the two major terminal fields of this system. A projection from
the LHA to mesoprefrontal neurons would likely provide information regarding interoceptive
experience to facilitate cognitive functions and executive motor control. An LHA input to
41
mesoaccumbens neurons would be expected to provide information regarding appetitive state to
facilitate approach/avoidance behaviors. Given the large number of neurochemical phenotypes in
the LHA to VTA projection, it is likely that the LHA as a whole contacts all the major cell
populations in the midbrain. However, more discrete studies might reveal that subsets of LHA
afferents are directed toward particular VTA cell types as defined by forebrain target and
transmitter phenotype.
In fact, the complex results of the present study highlight the need for more targeted
investigations of phenotypically discrete pathways from the LHA to the VTA, as exemplified by
the analysis of the orexin projection in Chapter 3. A profound synaptic influence from orexin
axons to VTA DA neurons is predicted based on the size of this pathway (Fadel and Deutch,
2002), the excitatory physiology of the peptide (Korotkova et al., 2006) and the demonstration of
mainly asymmetric synapses formed by orexin axons in other target regions (Horvath et al.,
1999b). This prediction is examined specifically in Chapter 3. Additional studies to address other
LHA phenotypes and their synaptic targets in the VTA are necessary in order to enhance
understanding of this complex but critical afferent system.
42
3.0 OREXIN AXONS IN THE RAT VENTRAL TEGMENTAL AREA SYNAPSE
INFREQUENTLY ONTO DOPAMINE AND GABA NEURONS
3.1 Abstract
Cells in the ventral tegmental area (VTA) facilitate motivated behaviors, and the activity of VTA
neurons is regulated by dense projections from the lateral hypothalamic area (LHA). Orexin
(Orx) neurons in the lateral and perifornical hypothalamus play important roles in arousal,
feeding and energy metabolism. Orx cells contribute substantially to the LHA projection to the
rat midbrain. However the morphological features of Orx fibers in the VTA and whether they
synapse onto dopamine (DA) or GABA neurons have not yet been investigated. We utilized
immunoperoxidase and immunogold-silver staining to examine the morphological features and
synaptic incidence of Orx-labeled axons in the VTA. We then combined immunoperoxidase
labeling for Orx with immunogold-silver labeling for GABA or for tyrosine hydroxylase (TH) in
DA neurons. Electron microscopic analysis revealed that the majority of Orx-labeled axons in
the VTA were passing fibers. The less common Orx varicosities were occasionally apposed to
TH- or GABA-labeled dendrites without synapsing. Only a small proportion of Orx-positive
axons synapsed onto dendrites or soma. The synapses included both asymmetric and symmetric
types and targeted TH- and GABA-labeled profiles with equal frequency. These findings suggest
that most Orx fibers in the VTA are axons passing to caudal brainstem structures. However, Orx
does mediate some direct synaptic influence onto VTA DA and GABA neurons. Additional non-
synaptic effects are suggested by the presence of numerous dense-cored vesicles. These studies
have important implications for understanding the mechanisms whereby Orx can alter behavior
through regulating VTA DA and GABA cell activity.
43
3.2 Introduction
Dopamine (DA) and GABA neurons in the ventral tegmental area (VTA) modulate locomotor
activity and support motivated behaviors via projections to cortical, limbic, and brainstem
structures (Laviolette and van der Kooy, 2001; Redgrave et al., 1999; Steffensen et al., 2001).
Physiological recording studies in primates indicate that the patterns of DA cell activity during
reward prediction tasks reflect their afferent drive from excitatory and inhibitory sources
(Schultz, 1998). Hence, it is essential to identify the specific afferents that drive the behavioral
response properties of DA neurons as well as GABA cells in the ventral midbrain. Convergent
information reaches the VTA by way of extensive afferent projections from the cortex, basal
ganglia, and various diencephalic and brainstem structures (Geisler and Zahm, 2005; Phillipson,
1979). Among these afferents, inputs from the hypothalamus provide one of the principal fiber
pathways to the VTA (Geisler and Zahm, 2005; Phillipson, 1979), suggesting that hypothalamic
afferents substantially influence the motivated behaviors regulated by this region (Hernandez and
Hoebel, 1988; Lorrain et al., 1999).
Anterograde and retrograde tracing studies indicate that the lateral hypothalamic area
(LHA) in particular projects densely to the VTA (Berk and Finkelstein, 1982; Phillipson, 1979;
Saper et al., 1979; Villalobos and Ferssiwi, 1987) via axons that exhibit a terminal-like
morphology (Fadel and Deutch, 2002; Geisler and Zahm, 2005). The LHA contributes to the
regulation of sleep-wakefulness, ingestive behavior, and reward functions (Bernardis and
Bellinger, 1996; DiLeone et al., 2003; Gerashchenko and Shiromani, 2004), suggesting that it
influences the fine-tuning of VTA neural activity by conveying information regarding arousal,
energy metabolism, and the salience of internal and external stimuli. LHA neurons include a
number of neurochemical phenotypes that might project to the VTA, including GABA,
44
glutamate and several neuropeptides (Bittencourt et al., 1992; Chou et al., 2001; Crocker et al.,
2005; Dallvechia-Adams et al., 2002; Rosin et al., 2003; Zahm et al., 2001). Among these
peptides, it has been estimated that 20% of the cells in the LHA and perifornical area (PFA) that
project to the VTA express immunoreactivity for orexin (Orx) (Fadel and Deutch, 2002).
Similarly, approximately 40% of cells in the LHA and PFA that are antidromically activated
from the VTA are immunoreactive for Orx (Mileykovskiy et al., 2005).
The peptides, Orx A and Orx B (also known as hypocretins 1 and 2) are synthesized in a
small number of hypothalamic cells, discretely concentrated in the LHA and PFA (Date et al.,
1999; Sakurai et al., 1998). Orx neurons project widely throughout the central nervous system
and contribute to a multitude of physiological functions, including behavioral state regulation,
energy homeostasis, endocrine/autonomic function, and sleep/wake regulation (Horvath et al.,
1999a; Sakurai et al., 1998; Siegel, 2004; Sutcliffe and de Lecea, 2002; van den Pol et al., 1998;
Willie et al., 2001; Zheng et al., 2005). The fact that relatively few Orx neurons project to many
distinct nuclei suggests an orchestrated influence of Orx on a range of neurotransmitter systems.
In particular, Orx fibers project to modulatory nuclei involved in the regulation of behavioral
state, including the basal forebrain, tuberomammillary nucleus, raphe nuclei, locus coeruleus,
and pedunculopontine tegmentum (Baldo et al., 2003; Peyron et al., 1998). For most of these
projections, ultrastructural studies have shown direct synaptic inputs from Orx axons to the
principal monoamine cells (Horvath et al., 1999b; Torrealba et al., 2003; Wang et al., 2003; Wu
et al., 2004; Yamanaka et al., 2002).
The VTA also receives an Orx innervation (Baldo et al., 2003; Cutler et al., 1999; Fadel
and Deutch, 2002; Korotkova et al., 2002; Peyron et al., 1998), although it is not known whether
Orx afferents synapse onto DA neurons or onto GABA cells, the major population of non-DA
45
neurons in this region (Carr and Sesack, 2000b; Swanson, 1982; Van Bockstaele and Pickel,
1995). Both of the Orx receptor subtypes 1 and 2 have been localized to the VTA (Marcus et al.,
2001; Narita et al., 2006) and shown to be expressed by DA and non-DA neurons (Korotkova et
al., 2003). Moreover, electrophysiological studies indicate that Orx increases the firing rate of
both DA and non-DA cells in the VTA via direct postsynaptic actions (Korotkova et al., 2003).
In the present study, we performed dual-labeling immunocytochemistry and semi-quantitative
electron microscopic analysis to examine the morphological features and synaptic incidence of
Orx axons that innervate the rat VTA and their synaptic input to DA and GABA neurons.
Considering the functional significance of the VTA and Orx systems in arousal-associated
behavior, and in light of the reported electrophysiological actions of Orx, we hypothesized that
Orx-containing fibers would synapse extensively onto both DA and GABA cells.
3.3 Materials and Methods
3.3.1 Fixation and Tissue Sectioning
Twelve adult male Sprague Dawley rats weighing 250-450 g were maintained on a 12:12 hr
light:dark cycle (start of light at 7 am) and allowed access to food and water ad libitum. Animals
were handled according to procedures recommended by the NIH Guide for the Care and Use of
Experimental Animals and approved by the Institutional Animal Care and Use Committee at the
University of Pittsburgh. Data for electron microscopy was collected from all 12 animals (Table
1). Tissue from 9 of these animals was also used for light microscopic observations.
46
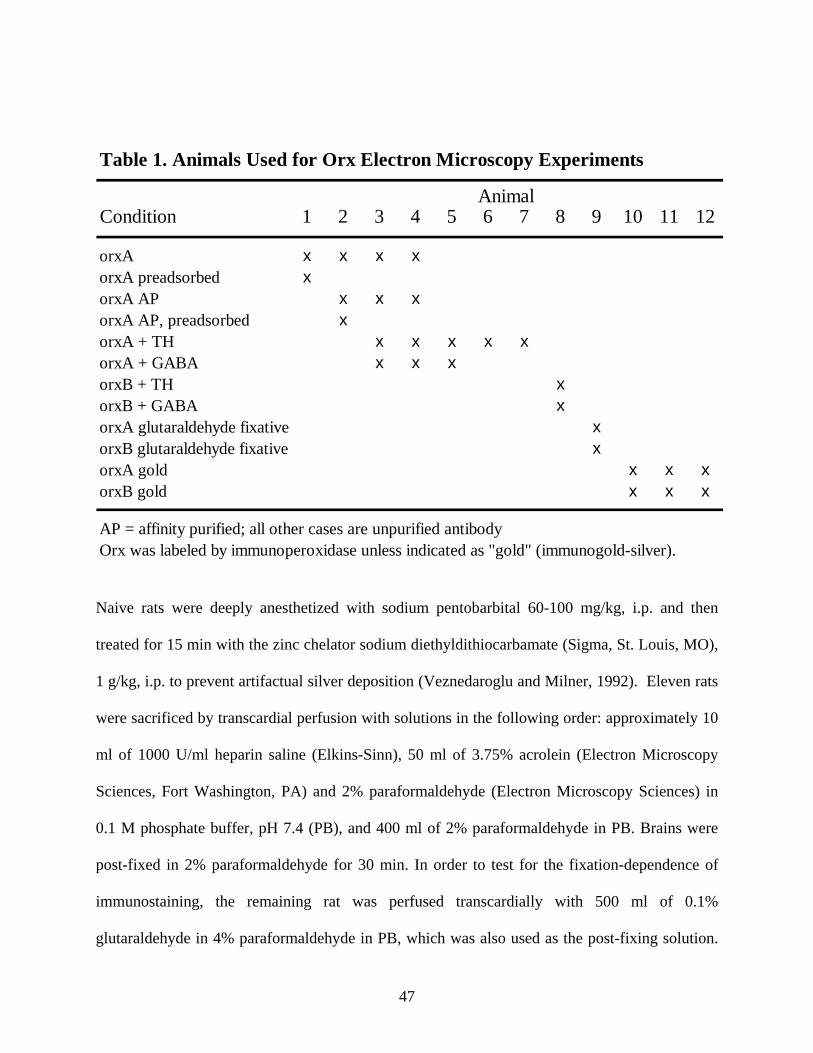
Ch. 2, Table 1. Animals Used for Orx Electron Microscopy Experiments
Condition 1 2 3 4 5 6 7 8 9 10 11 12
orxA x x x xorxA preadsorbed xorxA AP x x xorxA AP, preadsorbed xorxA + TH x x x x xorxA + GABA x x xorxB + TH xorxB + GABA xorxA glutaraldehyde fixative xorxB glutaraldehyde fixative xorxA gold x x xorxB gold x x x
AP = affinity purified; all other cases are unpurified antibodyOrx was labeled by immunoperoxidase unless indicated as "gold" (immunogold-silver).
Animal
Table 1. Animals Used for Orx Electron Microscopy Experiments
Naive rats were deeply anesthetized with sodium pentobarbital 60-100 mg/kg, i.p. and then
treated for 15 min with the zinc chelator sodium diethyldithiocarbamate (Sigma, St. Louis, MO),
1 g/kg, i.p. to prevent artifactual silver deposition (Veznedaroglu and Milner, 1992). Eleven rats
were sacrificed by transcardial perfusion with solutions in the following order: approximately 10
ml of 1000 U/ml heparin saline (Elkins-Sinn), 50 ml of 3.75% acrolein (Electron Microscopy
Sciences, Fort Washington, PA) and 2% paraformaldehyde (Electron Microscopy Sciences) in
0.1 M phosphate buffer, pH 7.4 (PB), and 400 ml of 2% paraformaldehyde in PB. Brains were
post-fixed in 2% paraformaldehyde for 30 min. In order to test for the fixation-dependence of
immunostaining, the remaining rat was perfused transcardially with 500 ml of 0.1%
glutaraldehyde in 4% paraformaldehyde in PB, which was also used as the post-fixing solution.
47

Sections through the rostro-caudal extent of the LHA and VTA were sliced on a vibratome at a
thickness of 50 µm. For each animal, a series of 6 adjacent tissue sets was collected in cold PB.
Unless otherwise noted, all rinses and incubations were carried out at room temperature and with
continuous gentle agitation. The tissue sections were processed for either light or electron
microscopy. All sections were treated with 1% sodium borohydride (Sigma) in PB for 30 min,
rinsed extensively in PB, rinsed in 0.1 M tris-buffered saline (pH 7.6; TBS), and transferred for
30 min to blocking solution in TBS containing 1-2% bovine serum albumin, 3-5% normal goat
serum, and either 0.3% or 0.04% Triton X-100 (Sigma) for light or electron microscopy,
respectively. Sections were then treated with primary antibodies in blocking solution for single
labeling with immunoperoxidase, single labeling with immunogold-silver, or double labeling
with immunoperoxidase plus immunogold-silver.
3.3.2 Single Labeling with Immunoperoxidase
Orx within perikarya in the LHA or within axons in the VTA was visualized using one of three
antibodies (see Table 1): 1) unpurified rabbit polyclonal anti-Orx A (Calbiochem, La Jolla, CA;
#Ab-2; 1:1000-2:000), 2) affinity purified rabbit anti-Orx A (Calbiochem, #Ab-1; 2-5 µg/ml) or
3) rabbit anti-hypocretin 2 (i.e., anti-Orx B; generous gift from Dr. A.N. van den Pol, Yale
University; 1:2500). After overnight incubation (14-16 hr), tissue was rinsed in TBS, incubated
for 30 min in biotinylated goat anti-rabbit secondary antibody (Sigma; 1:400), rinsed again and
exposed for 30 min to avidin-biotin peroxidase complex (ABC elite, Vector Laboratories,
Burlingame, CA). After rinsing in TBS, bound peroxidase was reacted for 3.5 min with 0.022%
diaminobenzidine (Sigma) and 0.003% hydrogen peroxide in TBS to produce a visible product.
The peroxidase reaction was stopped by rinsing in TBS followed by rinses in 0.01 M phosphate
48
buffered saline (pH 7.4; PBS). Sections for light microscopic analysis were mounted on slides,
dehydrated and coverslipped. Electron microscopic sections were placed in PB for subsequent
osmication, or otherwise remained in PBS for double labeling immunocytochemistry.
3.3.3 Single Labeling with Immunogold-silver
As immunoperoxidase labeling sometimes obscures subcellular details, tissue sections through
the VTA from three animals (Table 1) were processed by immunogold-silver labeling for either
OrxA or OrxB in order to achieve optimal detection of the morphological features and synapses
formed by Orx-labeled axons in the VTA. Adjacent sections were incubated in blocking solution
containing either unpurified rabbit polyclonal anti-Orx A (1:1000) or rabbit anti-Orx B (1:1000
for one animal, otherwise, 1:2500). After incubation overnight for 18-22 hr, the sections were
rinsed twice in blocking solutions, then rinsed twice in washing buffer containing 0.8% bovine
serum albumin, 0.5% fish gelatin, and 3% normal goat serum (Sigma) in PBS. Sections were
incubated for 30 min in washing buffer and exposed overnight to washing buffer containing goat
anti-rabbit, 1 nm gold-conjugated secondary antibody (Amersham; 1:50). Tissue was then rinsed
in washing buffer followed by PBS, and then treated with 2% glutaraldehyde (Electron
Microscopy Sciences) in PBS for 10 min without agitation. The sections were rinsed thoroughly
in PBS before processing for silver enhancement of gold-conjugated antibody. Sections were
processed through three 1 min rinses in 0.2 M sodium citrate buffer (pH 7.4) and then incubated
for an empirically determined time (4-6 min) in silver solution (IntenSE M, Amersham). Tissue
was then rinsed twice in citrate buffer and twice in PB before preparation for electron
microscopy.
49
3.3.4 Double Labeling Immunocytochemistry
Tissue sections through the VTA from six animals (Table 1) were processed for dual
immunoperoxidase labeling of Orx A or Orx B and immunogold-silver detection of either the
DA synthetic enzyme tyrosine hydroxylase (TH) or GABA in soma and dendrites in the VTA.
We used the more sensitive immunoperoxidase method (Chan et al., 1990) for detecting the
antigen in least abundance, in this case Orx. For these studies, sections were incubated
simultaneously with anti-Orx and either mouse anti-TH (Chemicon, Temecula, CA; #MAB318;
1:8000) or mouse anti-GABA (Sigma; #A-0310; 1:2000) antibodies. Following detection of Orx
by avidin-biotin peroxidase (as described above), the tissue was transferred out of PBS rinses
and into washing buffer (also described above). After a 30 min incubation, the tissue was
exposed overnight to washing buffer containing goat anti-mouse, 1 nm gold-conjugated
secondary antibody (Amersham, Piscataway, NJ; 1:50). The sections were subsequently treated
as described earlier for single labeling with immunogold-silver.
3.3.5 Tissue Preparation for Electron Microscopy
The labeled sections were prepared for electron microscopic examination by incubation for 1 hr
in 2% osmium tetroxide (Electron Microscopy Sciences) in PB. The tissue was then dehydrated
in ascending concentrations of ethanol followed by propylene oxide and then infiltrated
overnight in a 1:1 mixture of propylene oxide and epoxy embedding resin (EMbed-812, Electron
Microscopy Sciences). The propylene oxide/epoxy mixture was then replaced with pure epoxy
resin for 2 hr. The sections were flat-embedded and cured for up to 48 hr at 60oC. Ultrathin
sections (60-75 nm thick) through the VTA were collected in serial order onto copper mesh grids
50
or onto formvar-coated slot grids. The grids were counterstained with 5% uranyl acetate and
Reynold’s lead citrate and analyzed on either a Zeiss 902 or FEI Morgagni 268 transmission
electron microscope. Analog micrographs were developed to desired contrast and brightness
using darkroom procedures, and then transferred to digital form. Digital electron micrographs
were collected using an AMT-XR 60 camera (Advanced Microscopy Techniques Corp.,
Danvers, MA) and adjusted to matching contrast and brightness using Photoshop. Digital light
microscopic images were similarly adjusted.
3.3.6 Specificity and Controls
Both the purified and unpurified Orx A antibodies were directed against amino acid residues 14-
33 (CRLYELLHGAGNHAAGILTL) of the human Orx A peptide. The specificity of the
purified Orx A antibody was demonstrated previously by abolition of staining following
preadsorption with the antigenic peptide (Akiyama et al., 2004). In addition, Orx
immunoreactivity was nearly eliminated in hypothalamic regions of transgenic Orx/ataxin-3
mice in which Orx-containing neurons were postnatally-ablated at 15 weeks of age (Akiyama et
al., 2004).
Previous studies in the rat brain have also demonstrated the specificity of the unpurified
Orx A antibody by various tests; some of these were conducted following in-house affinity
purification (Hara et al., 2001; Nambu et al., 1999; Sakurai et al., 1998; Zheng et al., 2005). In
all cases, preadsorption with excess synthetic Orx A abolished the labeling of neurons in the
hypothalamus. In addition, Orx-immunoreactivity was shown not to be eliminated by
preincubation with NPY or angiotensin II (Nambu et al., 1999). Moreover, this Orx A antibody
was shown to stain prepro-orexin cDNA transfected but not mock transfected cells (Nambu et
51
al., 1999). Finally, immunostaining of tissue from the Orx neuron-ablated transgenic Orx/ataxin-
3 mice resulted in nearly complete elimination of Orx fiber-immunoreactivity (Hara et al., 2001).
The polyclonal Orx B antibody was raised against 27 of the 28 amino acids in the Orx B
sequence, as described in detail by van den Pol and colleagues, who also performed the tests for
specificity (de Lecea et al., 1998; van den Pol, 1999; van den Pol et al., 1998). These tests
included abolition of staining following preadsorption with the immunizing peptide, common
distribution of hypothalamic neurons labeled by this antibody or by in situ hybridization staining
for preprohypocretin mRNA, and similarity of immunoreactivity patterns using separate antisera
raised in different animals as well as another antiserum raised against the preprohypocretin
sequence. The specificity of this Orx B antiserum has been further characterized in rat and
primate (Horvath et al., 1999a; Horvath et al., 1999b), frog (Galas et al., 2001), human (van den
Pol, 1999), hamster (Mintz et al., 2001), mouse (Li et al., 2002; van den Pol, 1999), and goldfish
(Huesa et al., 2005).
In the present study, specificity was further tested by preadsorption controls (see Table 1).
For the purified Orx A antibody, this consisted of incubating Orx A peptide at 2 µg/ml with 25
µg of the immunizing peptide (Calbiochem) for 1 hr before application to the tissue. For the
unpurified Orx A antibody, 25 µg of Orx A peptide (Calbiochem) was added to a 1:1000 dilution
of the antibody, again for 1 hr prior to tissue application. In both cases, light microscopic
staining in the LHA was eliminated, as was axon varicosity labeling in the VTA at the
ultrastructural level. Moreover, removal of the primary antibody from some tissue sets resulted
in no detectable immunoreactivity, thus indicating the specificity of the secondary antibody.
The majority of data for the present study was acquired from sections labeled with the
unpurified Orx A antibody. In three animals, immunolabeling with this antiserum was directly
52

compared to tissue labeled with the affinity purified antibody. In all cases, the patterns of
immunoreactivity were indistinguishable, although the intensity of labeling was notably less for
the affinity purified antibody leading to an apparent reduction in the density of labeled axons in
the VTA. Both purified and unpurified Orx A immunoreagents were also compared to the Orx B
antibody. The latter produced more intense signal by light microscopic observation and more
evident beading of axons in the VTA. Nevertheless, electron microscopic examination of the
VTA revealed no detectable difference in the frequency of axon varicosities labeled with Orx B
compared to tissue treated with the unpurified Orx A antibody. This was true both in animals
perfused with acrolein as well as in the one control animal in which glutaraldehyde was used as
an alternative fixative. Hence, the quantitative results for labeled axons from tissue exposed to
Orx A or B antisera were combined.
We have used the antibodies against TH and GABA extensively for labeling structures in
the VTA, and previous publications from us and others have described the specificity of these
reagents (Aston-Jones et al., 2004; Carr and Sesack, 2000c; Lewis et al., 1994; Omelchenko and
Sesack, 2005; Sesack et al., 1995; Van Bockstaele and Pickel, 1995; Waselus et al., 2005). The
monoclonal TH antibody was raised against an N-terminus 59-61 kDa protein isolated from
PC12 cells. As described by the supplier, western blot analysis indicates that it does not
recognize other monoamine synthesizing enzymes. The GABA antibody raised in mouse was
directed against GABA that had been purified and conjugated to bovine serum albumin.
According to the manufacturer, the antibody does not recognize structurally related amino acids
in dot blot immunoassay.
53
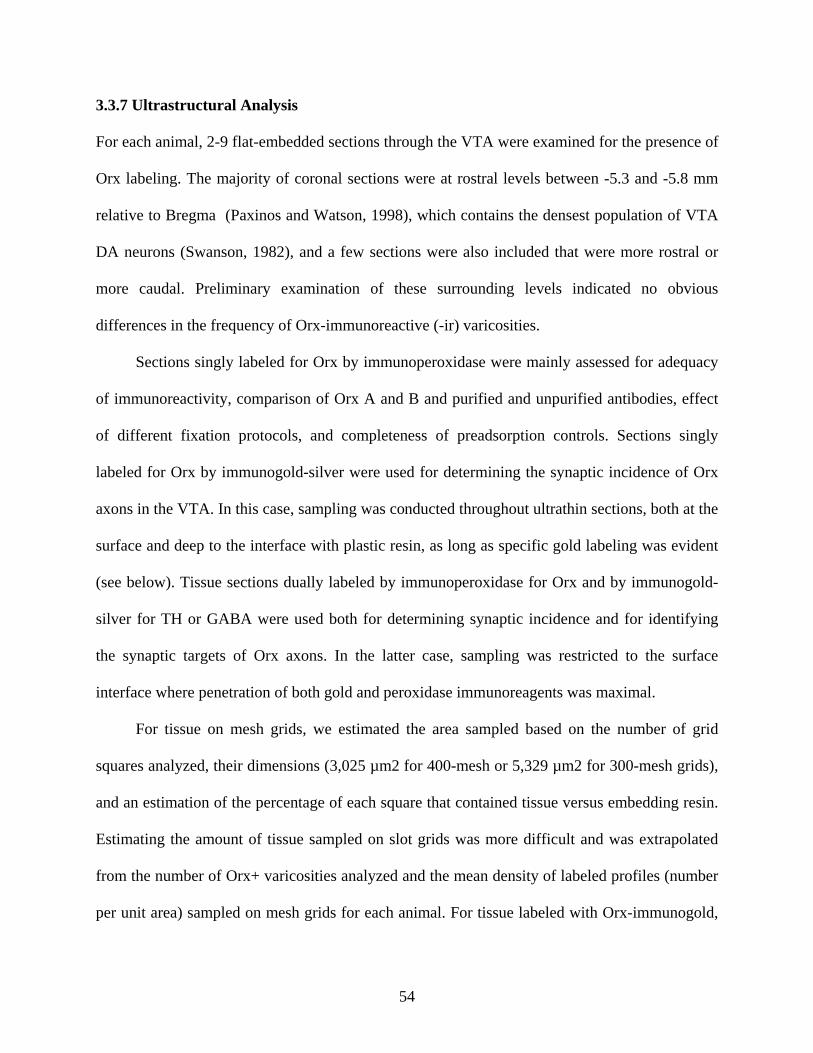
3.3.7 Ultrastructural Analysis
For each animal, 2-9 flat-embedded sections through the VTA were examined for the presence of
Orx labeling. The majority of coronal sections were at rostral levels between -5.3 and -5.8 mm
relative to Bregma (Paxinos and Watson, 1998), which contains the densest population of VTA
DA neurons (Swanson, 1982), and a few sections were also included that were more rostral or
more caudal. Preliminary examination of these surrounding levels indicated no obvious
differences in the frequency of Orx-immunoreactive (-ir) varicosities.
Sections singly labeled for Orx by immunoperoxidase were mainly assessed for adequacy
of immunoreactivity, comparison of Orx A and B and purified and unpurified antibodies, effect
of different fixation protocols, and completeness of preadsorption controls. Sections singly
labeled for Orx by immunogold-silver were used for determining the synaptic incidence of Orx
axons in the VTA. In this case, sampling was conducted throughout ultrathin sections, both at the
surface and deep to the interface with plastic resin, as long as specific gold labeling was evident
(see below). Tissue sections dually labeled by immunoperoxidase for Orx and by immunogold-
silver for TH or GABA were used both for determining synaptic incidence and for identifying
the synaptic targets of Orx axons. In the latter case, sampling was restricted to the surface
interface where penetration of both gold and peroxidase immunoreagents was maximal.
For tissue on mesh grids, we estimated the area sampled based on the number of grid
squares analyzed, their dimensions (3,025 µm2 for 400-mesh or 5,329 µm2 for 300-mesh grids),
and an estimation of the percentage of each square that contained tissue versus embedding resin.
Estimating the amount of tissue sampled on slot grids was more difficult and was extrapolated
from the number of Orx+ varicosities analyzed and the mean density of labeled profiles (number
per unit area) sampled on mesh grids for each animal. For tissue labeled with Orx-immunogold,
54

the total estimated amount of tissue sampled was 958,760 µm2 from 3 animals for Orx A, and
561,243 µm2 from 3 animals for Orx B. For tissue labeled with Orx by peroxidase and TH by
gold-silver, the area sampled ranged from 170,913 to 499,881 µm2 per animal, for a total of
1,868,513 µm2 from 6 animals. For tissue dually labeled for Orx and GABA, sampling ranged
from 413,574 to 761,544 µm2 per animal, for a total of 2,109,843 µm2 from 4 animals.
Neuronal profiles were identified by morphological features as described by Peters and
Palay (Peters and Palay, 1991). Axons were small diameter structures often localized in bundles
that contained microtubules and occasional vesicles. Varicosities were identified as being larger
in diameter and having more numerous vesicles and mitochondria. Synapses were defined by
parallel thickenings of the pre- and postsynaptic membranes, filaments in the cleft, and
accumulation of vesicles along the presynaptic density. Asymmetric synapses (correlated with an
excitatory physiology) were distinguished from symmetric synapses (correlated with inhibition)
by their more pronounced postsynaptic thickening (Carlin, 1980). Perikarya were identified by
the presence of a nucleus. Dendrites typically contained large areas of cytoplasm with few
vesicles, exhibited mitochondria and microtubules, and received synaptic input from axons. Glial
processes were identified by irregular contours and thin, vacant cytoplasm.
Specific immunoperoxidase labeling for Orx was defined as a flocculent, electron dense
material within axons. In most cases, Orx-ir profiles were examined in serial sections to
determine whether synaptic contacts were formed, to distinguish symmetric and asymmetric
synapses, and/or to analyze complex spatial interactions with surrounding structures.
Occasionally, an Orx-ir varicosity contacted more than one structure and was counted as a single
Orx profile making multiple interactions. Specific immunogold-silver labeling for Orx was
defined as clusters of at least two gold particles associated with a dense-cored vesicle or at least
55
four gold particles within a varicosity that showed additional gold particles in serial sections. All
immunogold-containing varicosities were photographed throughout the extent of available serial
sections. The criteria for specific gold-silver labeling prevented the assessment of Orx labeling
within passing axons, most of which contained only single gold particles and no dense-cored
vesicles. Hence, the presence of Orx within fibers of passage was determined solely by
immunoperoxidase labeling. For sections in which immunogold-silver was used to localize TH
or GABA, specific labeling was defined as dendritic profiles containing at least three separate
gold particles and occurring within fields containing at least one other instance of specific
immunogold labeling. This ensured that the immunogold reagents had penetrated to this depth.
3.3.8 Estimation of Synaptic Incidence
Initial assessments of VTA sections revealed that many Orx-labeled axons were fibers of passage
and that varicose portions of these axons formed few observable synapses. Nevertheless, true
synaptic incidence is often underestimated when synaptic specializations represent only a small
proportion of the overall varicosity size (Umbriaco et al., 1994). The use of serial sections can
aid the determination of synaptic frequency, but a complete set of sections through all Orx-ir
varicosities was not always available for this study. Hence, we utilized the approach of Umbriaco
(Umbriaco et al., 1994) to extrapolate an estimated synaptic incidence from randomized single
sections according to the formula of Beaudet and Sotelo (Beaudet and Sotelo, 1981):
extrapolated synaptic frequency (%) = observed synaptic frequency (%) (ls/D) x (2/π) + (t/D) where D = mean diameter of varicosities, ls = mean length of synapses, and t = mean thickness
of ultrathin sections, in this case 0.057 mm, as determined using the small fold method (De
Groot, 1988).
56
Synaptic incidence was estimated from all Orx-immunoreactive varicosities sampled in
tissue singly labeled by immunogold-silver for Orx or dually labeled by immunoperoxidase for
Orx and gold-silver for TH or GABA. Orx varicosities photographed in only one section were
considered as random encounters and were therefore included in the data set. For Orx profiles
photographed in serial sections, one section was chosen from the series using a random number
generator for analysis of size and synaptic incidence (Umbriaco et al., 1994). The diameter of
each Orx varicosity in mm was measured by hand using a transparent flexible ruler and then
adjusted to µm according to the enlargement scale. For elongated profiles, the diameter was
taken at the widest point perpendicular to the long axis. Synaptic length was defined by the
beginning and end of parallel membrane thickenings along the widened cleft region, taking into
account any slight curvature of the synapse. The extent of apparent intercleft filaments aided in
taking these measurements.
3.4 Results
3.4.1 Light Microscopic Labeling for Orx in the Rat LHA and VTA
As expected from prior studies (Baldo et al., 2003; Date et al., 1999; de Lecea et al., 1998;
Nambu et al., 1999; Peyron et al., 1998; Sakurai et al., 1998; Swanson, 1982; Swanson et al.,
2005) immunoperoxidase labeling for Orx A within the hypothalamus (Fig.1A) was detected in
cell bodies, proximal dendrites, and fibers encompassing mainly the lateral and perifornical
areas. Preadsorption with the immunizing peptide abolished this immunoreactivity (Fig.1B).
Within the VTA, Orx-immunoreactivity was moderately distributed within axons (Fig.1C), some
of which had a long and straight morphology, while others had shorter intervaricose segments
57

between prominent beads (Fig. 1C, inset). In adjacent tissue sections stained by immunogold-
silver for TH, labeled soma and dendrites were visible within the region innervated by Orx axons
(Fig.1D).
58
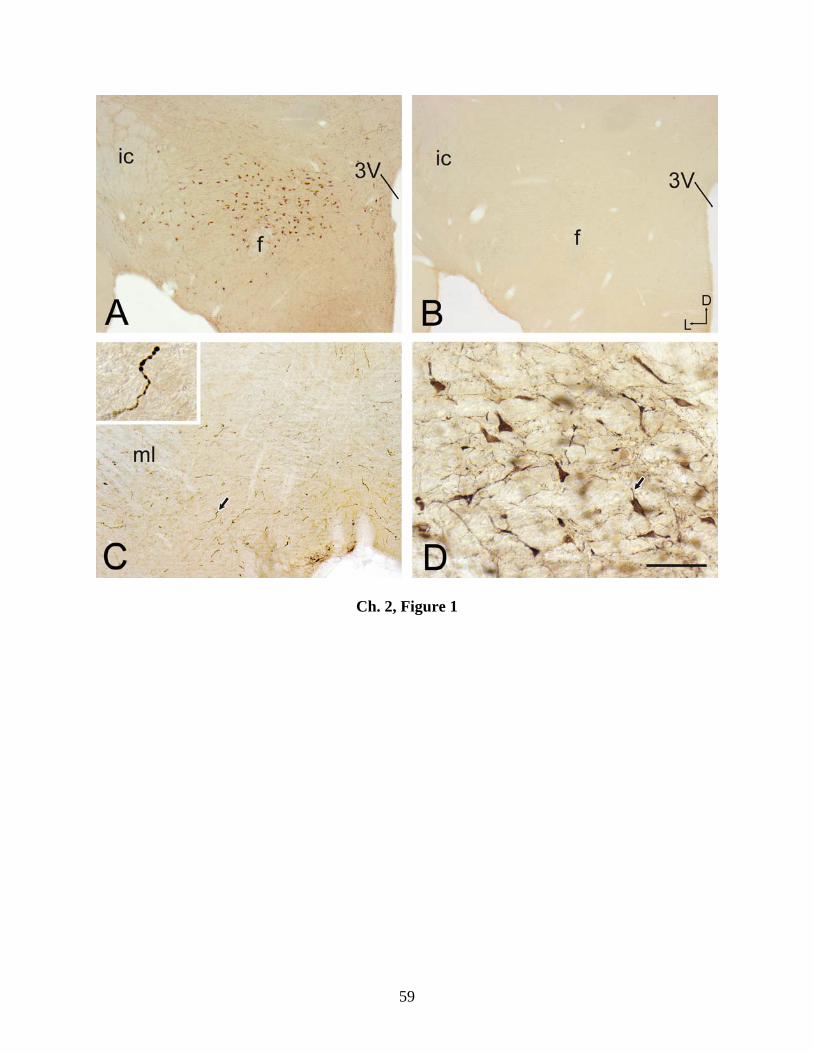
Ch. 2, Figure 1
Ch. 2, Figure 1: Light micrographic images depicting coronal sections through the rat
hypothalamus and VTA.
59

Ch. 2, Figure 1: Light micrographic images depicting coronal sections through the rat
hypothalamus (A,B) and VTA (C,D).
A: Immunoperoxidase labeling for the unpurified Orx A antibody is localized mainly in the
lateral and perifornical hypothalamic areas within soma, dendrites, and fibers. B: Orx-ir is
undetectable in an adjacent section through the hypothalamus incubated in unpurified Orx A
antibody preadsorbed with the antigenic peptide. C: Orx A-ir is visible within axons in the VTA.
The arrow points to an axon with markedly beaded morphology shown at higher magnification in
the inset. D: Immunogold-silver labeling for TH is visible within soma and dendrites (arrow) of
DA neurons in the VTA region innervated by Orx fibers. The dorsal (d) and lateral (l) orientation
for A-D is shown in B. Abbreviations: 3V, third ventricle; f, fornix; ic, internal capsule; ml,
medial lemniscus. Scale bar in D represents 500 µm in A,B; 250 µm in C; 62.5 µm in D; 31.25
µm in C inset.
60
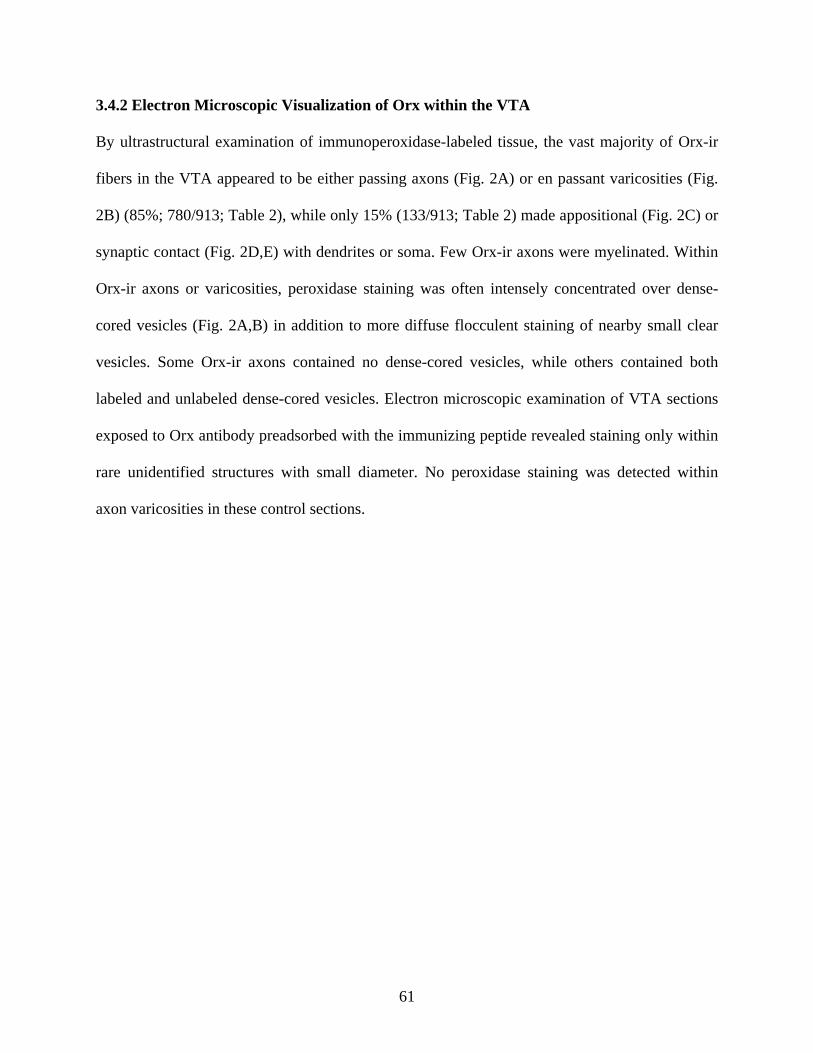
3.4.2 Electron Microscopic Visualization of Orx within the VTA
By ultrastructural examination of immunoperoxidase-labeled tissue, the vast majority of Orx-ir
fibers in the VTA appeared to be either passing axons (Fig. 2A) or en passant varicosities (Fig.
2B) (85%; 780/913; Table 2), while only 15% (133/913; Table 2) made appositional (Fig. 2C) or
synaptic contact (Fig. 2D,E) with dendrites or soma. Few Orx-ir axons were myelinated. Within
Orx-ir axons or varicosities, peroxidase staining was often intensely concentrated over dense-
cored vesicles (Fig. 2A,B) in addition to more diffuse flocculent staining of nearby small clear
vesicles. Some Orx-ir axons contained no dense-cored vesicles, while others contained both
labeled and unlabeled dense-cored vesicles. Electron microscopic examination of VTA sections
exposed to Orx antibody preadsorbed with the immunizing peptide revealed staining only within
rare unidentified structures with small diameter. No peroxidase staining was detected within
axon varicosities in these control sections.
61
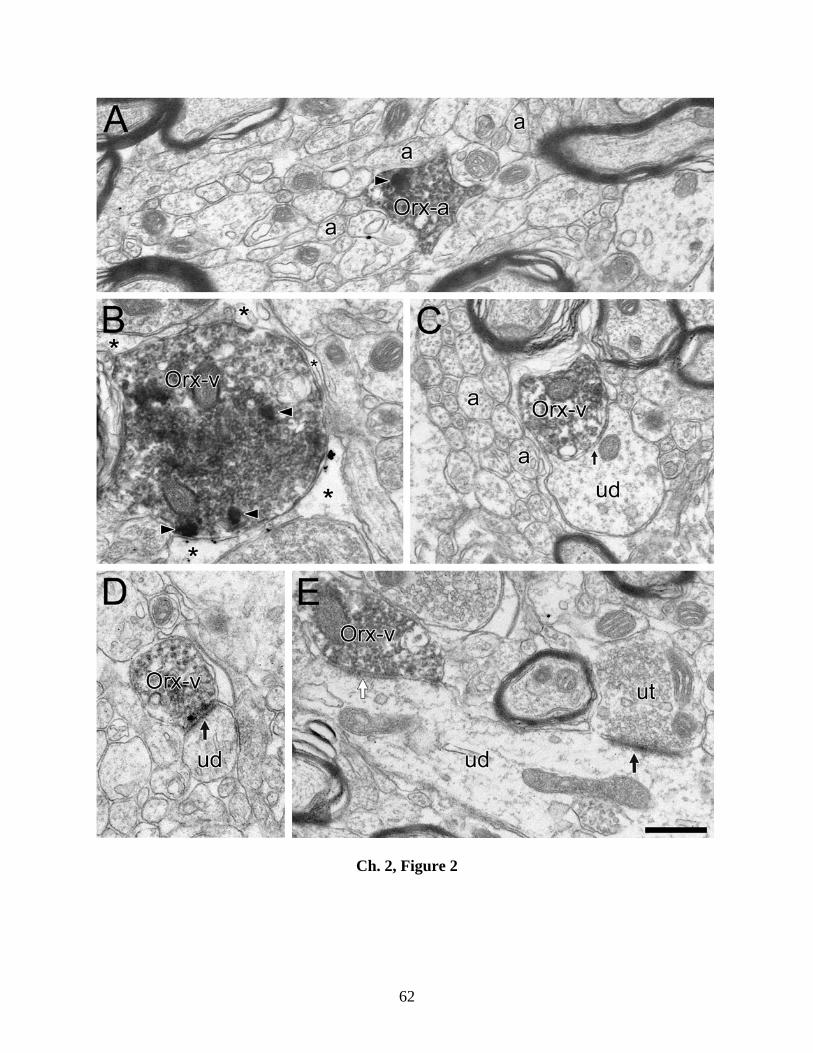
Ch. 2, Figure 2
Ch. 2, Figure 2: Electron micrographs of the rat VTA illustrating the ultrastructural
characteristics of fibers labeled by immunoperoxidase for Orx A or Orx B.
62
Ch. 2, Figure 2: Electron micrographs of the rat VTA illustrating the ultrastructural
characteristics of fibers labeled by immunoperoxidase for Orx A (B,C) or Orx B (A,D,E).
A: Most Orx axons (Orx-a) pass through the VTA within bundles of unlabeled axons (a). B:
Other Orx-labeled profiles are varicosities (Orx-v) that do not contact dendrites; some of these
are surrounded by glial processes (asterisks). C: Occasionally, some Orx-varicosities are
apposed (small arrow) to unlabeled dendrites (ud) without exhibiting obvious synaptic
specializations. In many cases, Orx-ir profiles contain intensely-labeled dense-cored vesicles
(arrowheads in A and B). D,E: Orx-vs infrequently form synapses of asymmetric (black arrow in
D) or symmetric (white arrow in E) type onto unlabeled dendrites (ud), either distal (D) or more
proximal (E). In E, an unlabeled terminal (ut) appears to synapse onto the same dendrite as the
Orx-v. Scale bar in E represents 0.5 µm in A-E.
63

Ch. 2, Table 2. Orx-ir Axons Contacting Dendrites in the Rat VTA
All Orx Orx + TH Orx + GABA
Number of rats 6 6 4Area of tissue examined (µm2) 3,978,356 1,868,513 2,109,843Total number of Orx-ir axons observed 913 481 432Total number of Orx-ir varicosities observed 334/913 (37%) 159/481 (33%) 175/432 (41%)Total number of contacts observedb 133/913 (15%) 69/481 (14%) 64/432 (15%)
Number (%) of appositions 87/913 (10%) 48/481 (10%) 39/432 (9%)25/48 (52%) 21/39 (54%)
Number (%) of synapses 46/913 (5%) 21/481 (4%) 25/432 (6%)10/21 (48%)c 7/25 (28%)c
animal 1 3/4 2/4animal 2 1/4 3/4animal 3 1/1 2/11animal 4 2/3 -animal 5 2/6 -animal 6 1/3 0/6
a includes profiles labeled for either Orx A or Orx Bb includes synapses and appositions with no glial separationsc not significantly different, Fisher's exact test
onto labeled dendrites
onto labeled dendrites
Tissue labeled for
Table 2. Orx-ira Axons Contacting Dendrites in the Rat VTA
Of all Orx-labeled axons in the VTA, approximately 10% (87/913; Table 2) involved
appositions to dendrites that exhibited no synaptic specializations (Fig. 2C). If calculated as a
proportion of just Orx-ir varicosities, these appositions constituted 26% (87/334). Of all Orx-
labeled axons, only 5% (46/913; Table 2) formed identifiable synapses; this figure corresponded
to 14% of Orx-positive varicosities (46/334). These synapses included either asymmetric (28/46,
61%; Fig. 2D) or symmetric (18/46, 39%; Fig. 2E) types, most commonly onto proximal or
distal dendritic shafts.
64
Consistent with observations from immunoperoxidase-labeled tissue, immunogold-silver
labeling for Orx was also found mainly in passing axons (Fig. 3A,B) and non-synaptic
varicosities (Fig. 3C,D). However, the conservative criteria for identifying specific gold labeling
(see Materials and Methods) led to the exclusion of most passing axons; consequently these
structures were poorly represented in the sample of Orx-ir profiles obtained with immunogold-
silver. Within labeled profiles, it was common to observe gold-silver particles for Orx
accumulated around dense-cored vesicles. Immunogold-silver visualization of Orx also revealed
some labeled profiles forming synaptic contacts. These had either asymmetric (63%, Fig. 3E) or
symmetric (38%, Fig. 3F) morphology in similar proportion to that observed using
immunoperoxidase.
65
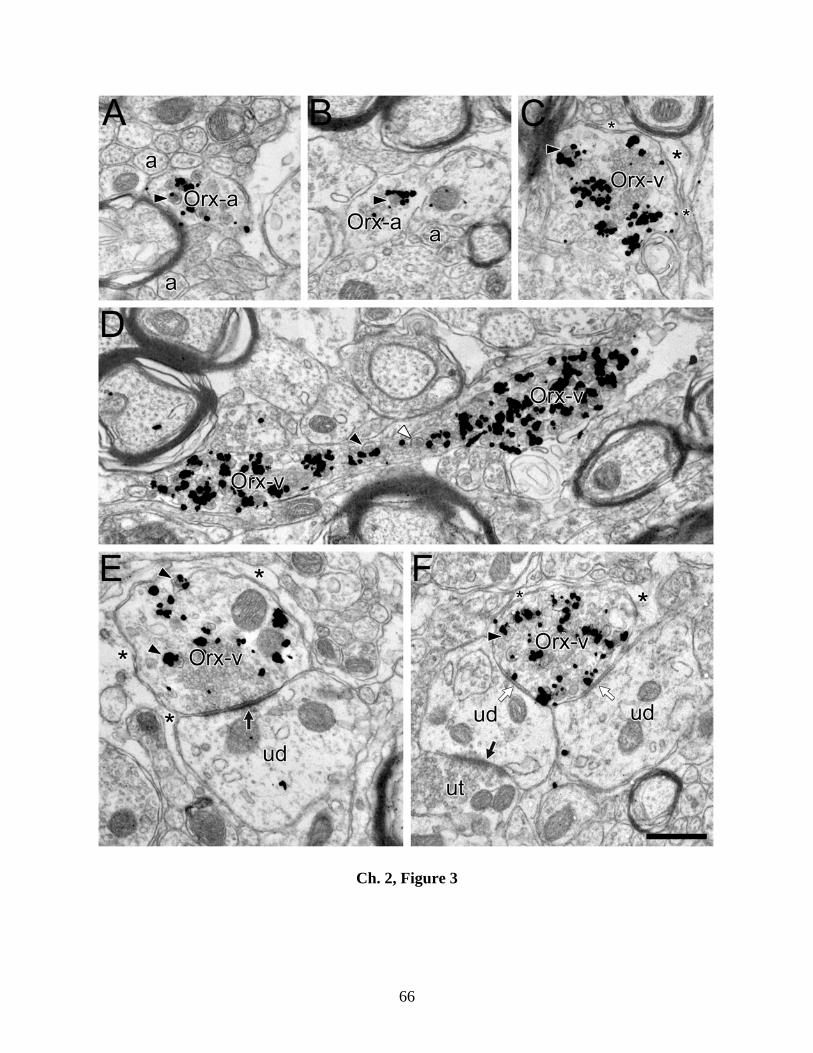
Ch. 2, Figure 3
Ch. 2, Figure 3: Electron micrographs of the rat VTA illustrating the ultrastructural
characteristics of axons labeled by immunogold-silver for Orx A or Orx B.
66
Ch. 2, Figure 3: Electron micrographs of the rat VTA illustrating the ultrastructural
characteristics of axons labeled by immunogold-silver for Orx A (A,D,E,F) or Orx B (B,C).
In most Orx-ir profiles, gold particles are accumulated around dense-cored vesicles (black
arrowheads). Occasionally, unlabeled dense-cored vesicles are evident within the same profiles
(white arrowhead in D). A,B: Most Orx-labeled fibers are passing axons (Orx-a) surrounded by
bundles of unlabeled axons (a). C: Some Orx-ir profiles are varicosities (Orx-v) that do not
contact dendrites and are commonly surrounded by glial processes (asterisks). D: A long Orx-ir
axon with multiple varicose portions was examined in many serial sections, and the varicosities
were never observed to form synaptic contacts. E,F: Some Orx-vs are encircled by glial
processes (asterisks) and exhibit asymmetric (black arrow in E) or dual symmetric synapses
(white arrows in F), onto unlabeled dendrites (ud), one of which also receives synaptic input
from an unlabeled axon terminal (ut). Scale bar in F represents 0.5 µm in A-F.
67

Previous ultrastructural studies of other target areas have reported evidence of Orx-ir
dendrite-like profiles (Guan et al., 2005; Guan et al., 2003; Wang et al., 2003), despite the fact
that true dendrites containing Orx are not possible outside of the hypothalamus. We also
observed such structures in the rat VTA (Fig. 4A) with both purified and unpurified Orx A
antibodies, with the Orx B antiserum, and with either immunoperoxidase or immunogold-silver
localization. However, further analyses revealed evidence suggesting that such dendrite-like
profiles are in fact axons sectioned in planes that do not readily allow clear morphological
identification. For example, some of these unusual Orx-ir profiles contained isolated dense-cored
vesicles (Fig. 4B), small clusters of vesicles (Fig. 4C), and/or microtubules (Fig. 4D) that might
be missed in different planes of section. Hence, our observations indicate that all Orx-ir profiles
in the VTA are likely to be axons, despite the occasional absence of morphological features that
would unequivocally identify them as axonal.
68

Ch. 2, Figure 4
Ch. 2, Figure 4: Electron micrographs illustrating immunoreactivity for Orx B or Orx A
within profiles whose morphology is not readily indicative of axons.
69
Ch. 2, Figure 4: Electron micrographs illustrating immunoreactivity for Orx B (A,B) or Orx A
(C,D) within profiles whose morphology is not readily indicative of axons.
A: An Orx profile contains light immunoperoxidase labeling and is apposed (small arrow) to an
unlabeled dendrite (ud) but contains no obvious axonal features. B: An Orx profile labeled by
immunogold-silver exhibits an intensely stained dense-cored vesicle (arrowhead) but does not
otherwise exhibit obvious morphological characteristics of an axon. C: This Orx profile contains
a few labeled vesicles only within the region that forms an asymmetric synapse (large arrow)
onto an unlabeled dendrite (ud). A different plane of section through this profile might reveal no
other morphological features of an axon. D: In a longitudinal plane of section, an Orx profile
contains immunoreactivity only in the region surrounding dense-cored vesicles. The identity of
this profile as an axon is further suggested by the presence of microtubules (white arrows). Scale
bar in D represents 0.5 µm in A-D.
70
3.4.3 Estimation of Synaptic Incidence
Based on a random sample of sections through Orx-ir varicosities (see Materials and Methods),
these profiles were estimated to have a mean diameter of 0.63 µm (± 0.26 stdev) and a mean
synaptic length of 0.37 µm (± 0.19 stdev). The observed synaptic incidence within this random
set of sections was 14%, and section thickness was estimated at 0.06 µm. These characteristics
were then used to calculate an extrapolated synaptic incidence for Orx-ir varicosities of 30%
(Beaudet and Sotelo, 1981; Umbriaco et al., 1994).
3.4.4 Ultrastructural Relationships between Orx Axons and TH-ir Structures in the VTA
Immunogold-silver labeling for TH was observed within perikarya and dendrites. Many Orx-
labeled axons were observed in the neuropil adjacent to these structures, but most were separated
from TH-ir profiles by glial processes (Fig. 5A) or intervening structures. Nevertheless, some
Orx-ir axons were directly apposed to TH-labeled dendrites without exhibiting synaptic
specializations (Fig. 5B,C). Other Orx-ir profiles synapsed onto unlabeled dendrites in the
immediate vicinity of TH-labeled structures (Fig. 5D-F). In only a few cases were Orx-ir axons
found to synapse onto TH-labeled structures (10/481, 2% of all axons; 10/159, 6% of all
varicosities; Table 2), including distal and proximal dendrites and, less frequently, cell bodies.
These synapses included both asymmetric (Fig. 6A-D) and symmetric (Fig. 6E) types. Given that
synaptic incidence is underestimated using the approach here, it is likely that additional synapses
of Orx-ir varicosities onto TH-labeled dendrites were overlooked.
71

Ch. 2, Figure 5
Ch. 2, Figure 5: Electron micrographs of the rat VTA depicting axons labeled by
immunoperoxidase for Orx A or Orx B in relationship to dendrites containing
immunogold-silver labeling for TH.
72
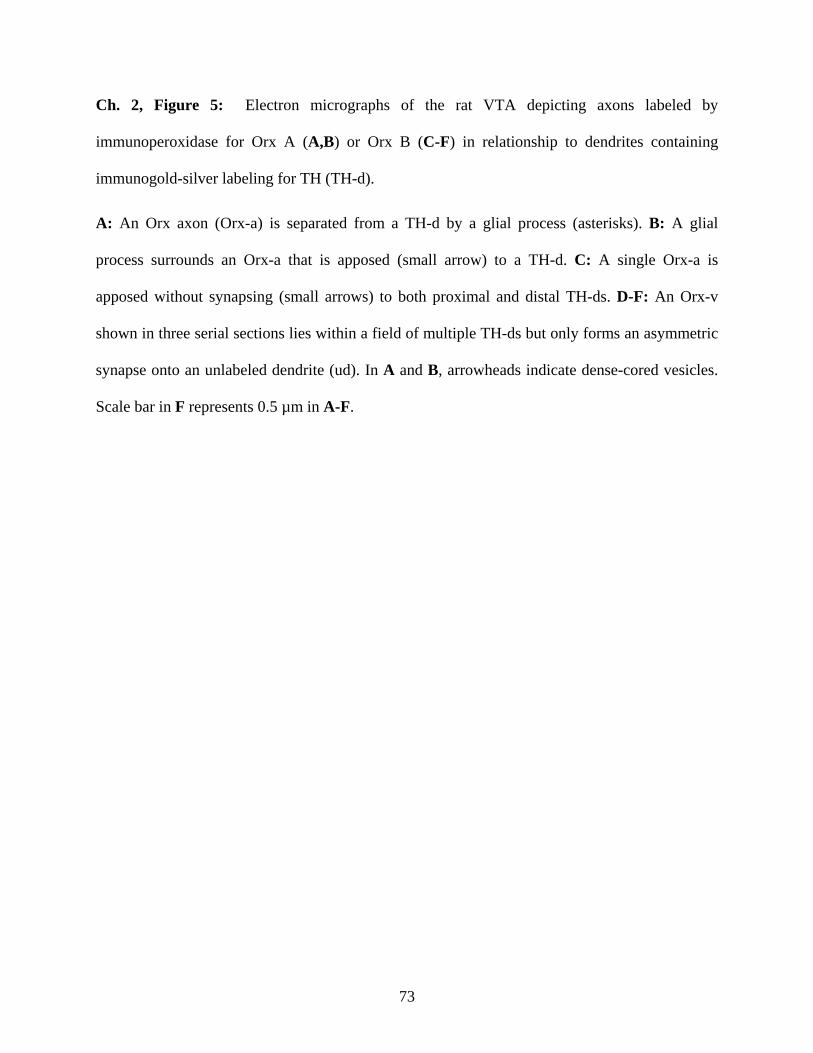
Ch. 2, Figure 5: Electron micrographs of the rat VTA depicting axons labeled by
immunoperoxidase for Orx A (A,B) or Orx B (C-F) in relationship to dendrites containing
immunogold-silver labeling for TH (TH-d).
A: An Orx axon (Orx-a) is separated from a TH-d by a glial process (asterisks). B: A glial
process surrounds an Orx-a that is apposed (small arrow) to a TH-d. C: A single Orx-a is
apposed without synapsing (small arrows) to both proximal and distal TH-ds. D-F: An Orx-v
shown in three serial sections lies within a field of multiple TH-ds but only forms an asymmetric
synapse onto an unlabeled dendrite (ud). In A and B, arrowheads indicate dense-cored vesicles.
Scale bar in F represents 0.5 µm in A-F.
73
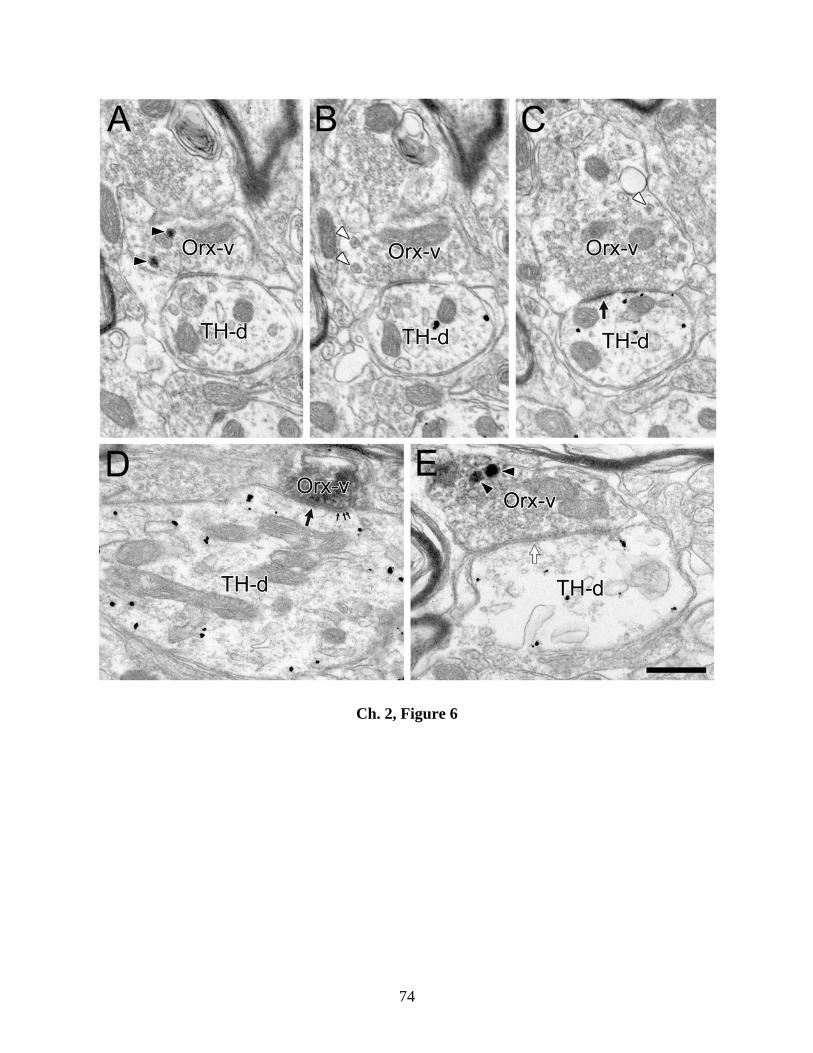
Ch. 2, Figure 6
Ch. 2, Figure 6: Electron micrographs of the rat VTA illustrating infrequent synapses of
varicosities labeled for Orx A onto TH-labeled dendrites.
74

Ch. 2, Figure 6: Electron micrographs of the rat VTA illustrating infrequent synapses of
varicosities labeled for Orx A onto TH-labeled dendrites (TH-d).
A-C: Serial sections through an Orx-ir varicosity (Orx-v) reveals an asymmetric synapse (black
arrow) onto a relatively distal TH-d. The Orx-v contains both unlabeled dense-cored vesicles
(white arrowheads) and dense-cored vesicles darkened by immunoperoxidase reaction product
for Orx (black arrowheads). D: An Orx-v forms a synapse with asymmetric morphology (the
black arrow indicates postsynaptic dense material) onto a proximal TH-d. Small arrows point to
filaments spanning the synaptic cleft. E: Peroxidase labeling for Orx is concentrated mainly in
dense-cored vesicles (arrowheads) within an Orx-v forming a symmetric synapse (white arrow
indicates parallel membranes and accumulated presynaptic vesicles) onto a TH-d. Scale bar in E
represents 0.5 µm in A-E.
75
3.4.5 Ultrastructural Relationships between Orx Axons and GABA-ir Structures in the
VTA
Immunogold-silver labeling for GABA was observed within perikarya, dendrites, axons and glia
within the VTA. In GABA-labeled tissue, some Orx-ir varicosities were separated from GABA-
labeled structures by glial processes (Fig. 7A). In other cases, Orx-labeled axons were directly
apposed to GABA-ir dendrites (Fig. 7B) without being observed to form synaptic contacts. Only
infrequently were Orx-ir axons found to synapse onto proximal or distal dendrites
immunoreactive for GABA (7/432, 2% of all axons, 7/175, 4% of all varicosities; Table 2); such
synapses were either symmetric (Fig. 7C) or asymmetric (Fig. 7D). Again, these figures probably
underestimate the actual incidence of Orx-ir varicosities synapsing onto GABA-labeled neurons.
Other Orx-labeled axons synapsed onto unlabeled dendrites in the neuropil adjacent to GABA-
positive structures. The frequency with which Orx-ir varicosities were observed to synapse onto
GABA- versus TH-labeled dendrites was not significantly different.
It should be noted that in one animal, GABA immunoreactivity was observed within a few
large Orx-labeled varicosities within the dorsal VTA at a rostral level between the medial
lemniscus and fasciculus retroflexus. It may be that a discrete subgroup of Orx terminals uses
GABA as a cotransmitter (but see (Rosin et al., 2003)). Alternatively, these Orx axons may have
the capacity to take up GABA from the extracellular space. Additional analyses are needed to
distinguish between these possibilities.
76
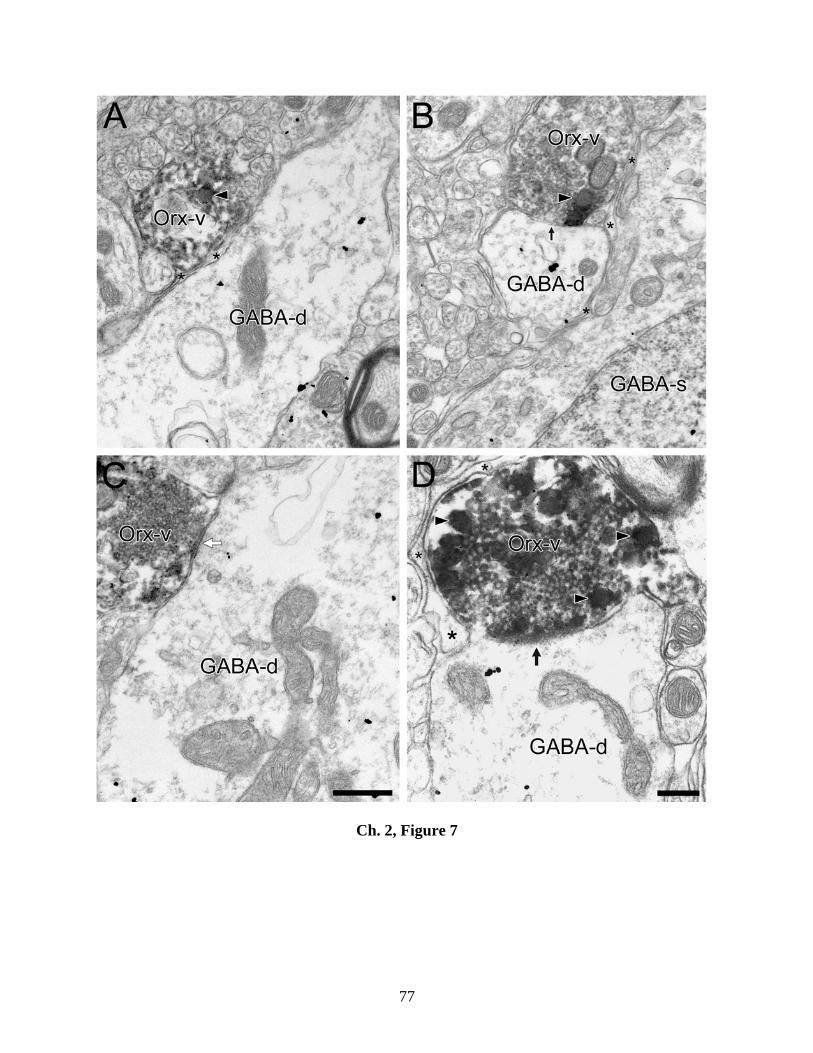
Ch. 2, Figure 7
Ch. 2, Figure 7: Electron micrographs of the rat VTA demonstrating infrequent
associations of varicosities immunoreactive for Orx A with dendrites containing
immunogold-silver labeling for GABA.
77
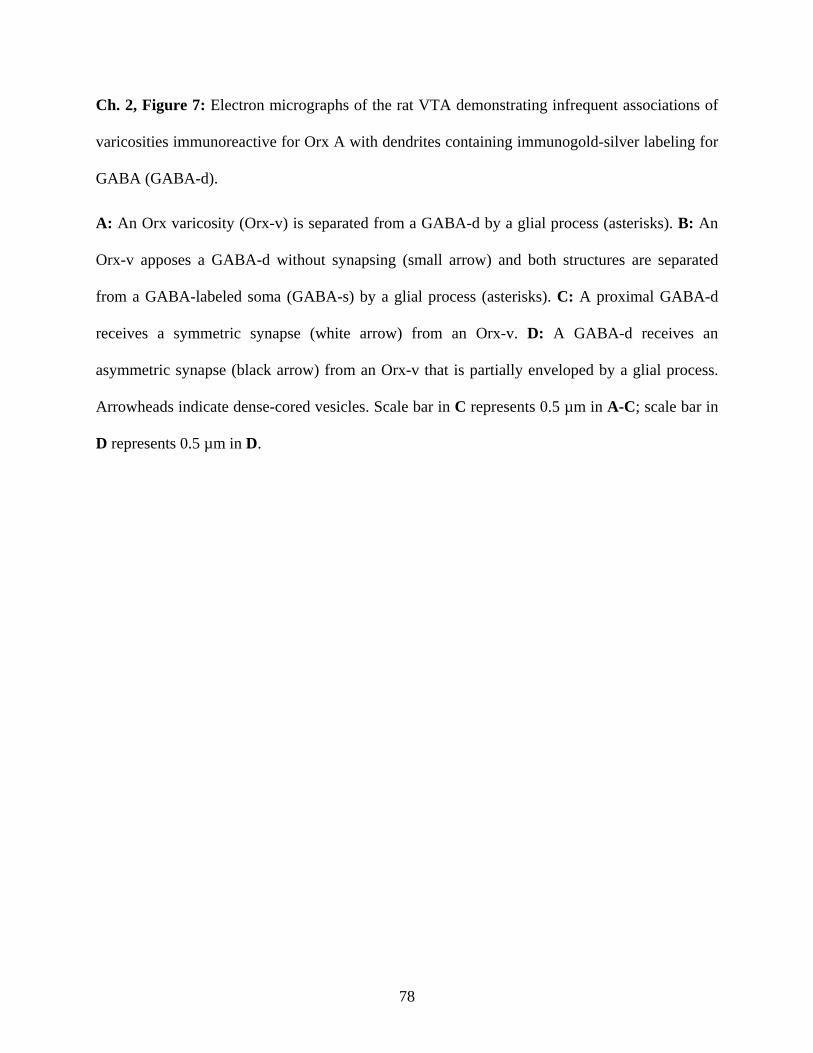
Ch. 2, Figure 7: Electron micrographs of the rat VTA demonstrating infrequent associations of
varicosities immunoreactive for Orx A with dendrites containing immunogold-silver labeling for
GABA (GABA-d).
A: An Orx varicosity (Orx-v) is separated from a GABA-d by a glial process (asterisks). B: An
Orx-v apposes a GABA-d without synapsing (small arrow) and both structures are separated
from a GABA-labeled soma (GABA-s) by a glial process (asterisks). C: A proximal GABA-d
receives a symmetric synapse (white arrow) from an Orx-v. D: A GABA-d receives an
asymmetric synapse (black arrow) from an Orx-v that is partially enveloped by a glial process.
Arrowheads indicate dense-cored vesicles. Scale bar in C represents 0.5 µm in A-C; scale bar in
D represents 0.5 µm in D.
78
3.5 Discussion
The present study represents the first ultrastructural examination of Orx in the VTA. The major
findings are that the majority of Orx fibers projecting to the VTA appear to pass through this
region without synapsing, and that the Orx varicosities that do form synapses exhibit no obvious
preference for DA versus GABA neurons. Hence, Orx afferents appear not to mediate a
substantial synaptic innervation of either VTA DA or GABA cells. Nevertheless, Orx may
contribute to excitatory and inhibitory signaling within the VTA via non-synaptic mechanisms in
addition to sparse synaptic inputs.
3.5.1 Methodological Considerations
As with most ultrastructural immunocytochemical studies, the major technical concern is the
extent of false-negative observations due to limited antibody penetration in sections processed
with low detergent levels. This limitation was minimized by examining the upper surface of the
tissue where reagent penetration was optimal. Moreover, the comparable results obtained with
multiple Orx antibodies support the validity of the findings. Nevertheless, the observation that
immunoreactivity for Orx was sometimes restricted to the region of dense-cored vesicles
suggests that the absence of Orx-containing dense-cored vesicles from portions of axons may
have lead to an underestimation of this fiber population. However, this limitation is unlikely to
have contributed to the observation of a low synaptic incidence for Orx-ir axons in the VTA.
First, axons containing other peptides localized to dense-cored vesicles are readily observed to
form synapses in this region (Dallvechia-Adams et al., 2002; Pickel et al., 1993; Sesack and
Pickel, 1992a). Second, Orx-ir fibers in more caudal brainstem structures form numerous
79
synapses onto target neurons (Horvath et al., 1999b; Wang et al., 2003). Finally, the possible
under-detection of Orx-immunoreactivity was unlikely to have affected differentially the
observation of contacts onto DA versus GABA cells.
The seemingly low incidence of synapses formed by Orx-ir profiles in the VTA in part
reflects the use of single or a limited number of serial sections, which can underestimate true
synaptic frequency (Beaudet and Sotelo, 1981; Umbriaco et al., 1994). Indeed, extrapolation of
an estimated synaptic incidence from randomized single sections reveals that approximately one-
third of Orx-ir varicosities do form synapses in the VTA. However, this estimate is based only on
Orx-ir varicosities and does not include the considerably larger number of profiles that are fibers
of passage. Hence, the extent to which the overall population of Orx axons in the VTA forms
synapses is rather low.
3.5.2 Ultrastructural Features of Orx Axons in the VTA
Given that only a small population of Orx neurons projects diffusely throughout the brain and
spinal cord (Peyron et al., 1998; van den Pol, 1999), it is to be expected that Orx axons terminate
strongly at some sites while traversing other sites along major pathway streams. Our findings
indicate that the VTA is more a region of passing than terminating Orx axons, consistent with the
description of Orx fibers as traversing midbrain areas via a ventral descending pathway (Peyron
et al., 1998). On the other hand, our preliminary findings with anterograde tract-tracing indicate
that the LHA as a whole provides extensive synaptic inputs to DA and GABA neurons in the
VTA (Balcita-Pedicino and Sesack, 2005). Hence, Orx and non-Orx inputs from the LHA appear
to differ substantially in their synaptic incidence within this region.
80

The frequent observation of Orx-ir dense-cored vesicles in passing axons and varicosities
suggests that these peptide storage and release compartments (Thureson-Klein and Klein, 1990)
are abundant along the fiber pathway traversing the VTA. Given the extensive connections
formed by Orx axons in downstream targets, including the dorsal raphe and locus coeruleus
(Baldo et al., 2003; Date et al., 1999; Horvath et al., 1999b; Liu et al., 2002; Peyron et al., 1998;
van den Pol, 1999; Wang et al., 2003), it is possible that many Orx-ir dense-cored vesicles
observed within the VTA represent peptide trafficking to caudal release sites. Nevertheless,
dense-cored vesicles are capable of exocytosis at extrasynaptic sites (Thureson-Klein and Klein,
1990), making it possible that Orx-ir dense-cored vesicles form a substrate for volume
transmission within the VTA (see below).
The finding that some Orx-positive varicosities containing dense-cored vesicles did form
symmetric or asymmetric synapses in the VTA suggests that Orx may exert peptidergic influence
in coordination with fast release of inhibitory or excitatory neurotransmitters, respectively
(Carlin, 1980). One likely candidate for co-release with Orx is glutamate, given that vesicular
glutamate transporters are expressed by LHA neurons and extensively colocalized with Orx
(Rosin et al., 2003; Ziegler et al., 2002). The observation that some Orx terminals formed
symmetric synapses suggests possible cotransmission of orexin and GABA. However, co-
expression of mRNA markers for Orx and GABA has not been observed (Rosin et al., 2003).
This is also consistent with estimates from the tuberomammillary nucleus, in which more than
90% of Orx terminals were found to colocalize glutamate but not GABA (Torrealba et al., 2003).
Finally, the fact that we observed unlabeled as well as labeled dense-cored vesicles within some
Orx-positive varicosities suggests that Orx is colocalized with other peptides, the most likely
81
candidates being dynorphin and neuronal activity-regulated pentraxin (NARP) (Chou et al.,
2001; Crocker et al., 2005; Lu et al., 2002).
3.5.3 Relationships between Orx Varicosities and DA and GABA Neurons
Although Orx can be released extrasynaptically from dense-cored vesicles, the juxtaposition of
axons to dendritic elements via appositions or synapses should facilitate Orx communication by
shortening the extracellular diffusion distance. The relatively equal frequency of contacts
involving Orx-ir axons and either DA (TH-labeled) or GABA targets suggests that Orx mediates
comparable signaling to these cell populations. The observation of Orx synapses onto unlabeled
profiles in both TH- and GABA-labeled tissue sections further suggests that Orx might interact
with another VTA cell population, such as the glutamate neurons reported recently (Kawano et
al., 2006; Yamaguchi et al., 2007). The common observation of glial processes enveloping
portions of Orx-ir axons suggests that astrocytic diffusion barriers (Hatton, 2004; Oliet et al.,
2004) may either facilitate or prevent extrasynaptic Orx communication at particular sites.
Finally, Orx may mediate important presynaptic actions to enhance glutamate synaptic
transmission in VTA DA cells (Borgland et al., 2006; Carr and Kalivas, 2006).
The finding of only a few synapses formed by Orx-ir axons onto DA neurons differs
markedly from the extent of such contacts reported in other monoamine nuclei. Within the locus
coeruleus, the substantially denser Orx innervation involves multiple synapses onto single
neurons (Horvath et al., 1999b). Orx inputs to histaminergic cells in the tuberomammillary
nucleus (Yamanaka et al., 2002) and cholinergic cells in the basal forebrain (Wu et al., 2004)
also appear to involve extensive synaptic contacts. Where it has been measured, the frequency of
synapse formation has been estimated to range from 25% in the dorsal raphe nucleus (Wang et
82
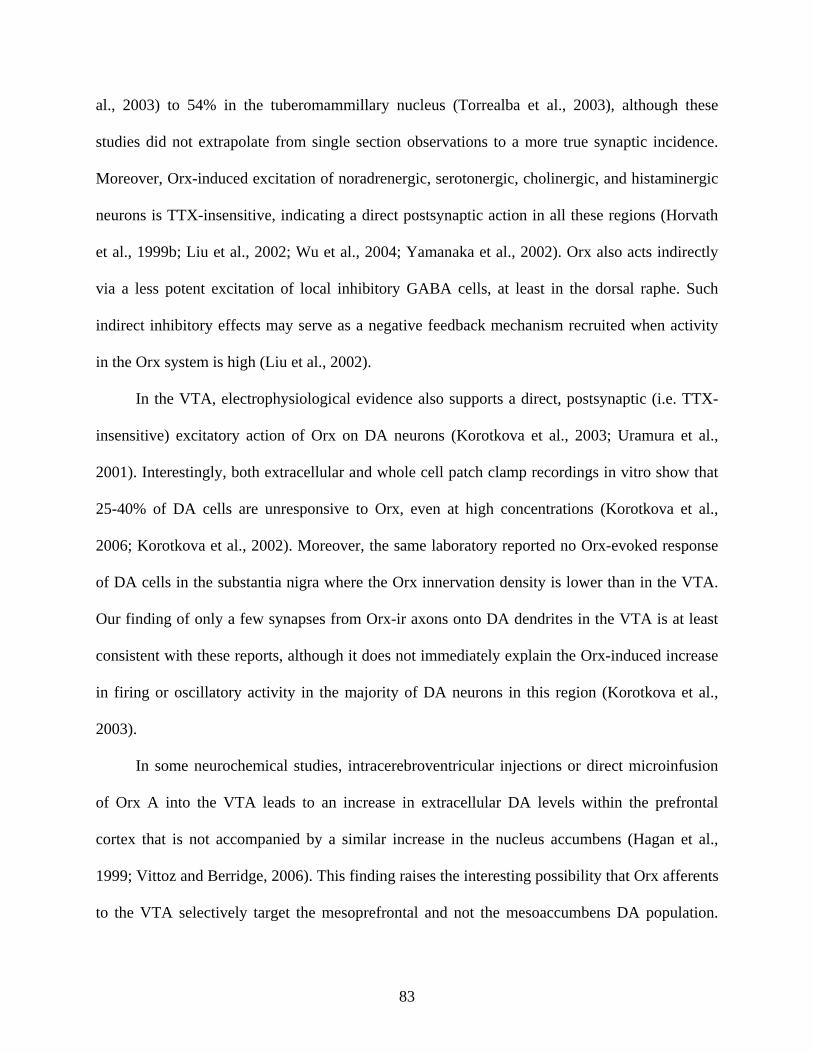
al., 2003) to 54% in the tuberomammillary nucleus (Torrealba et al., 2003), although these
studies did not extrapolate from single section observations to a more true synaptic incidence.
Moreover, Orx-induced excitation of noradrenergic, serotonergic, cholinergic, and histaminergic
neurons is TTX-insensitive, indicating a direct postsynaptic action in all these regions (Horvath
et al., 1999b; Liu et al., 2002; Wu et al., 2004; Yamanaka et al., 2002). Orx also acts indirectly
via a less potent excitation of local inhibitory GABA cells, at least in the dorsal raphe. Such
indirect inhibitory effects may serve as a negative feedback mechanism recruited when activity
in the Orx system is high (Liu et al., 2002).
In the VTA, electrophysiological evidence also supports a direct, postsynaptic (i.e. TTX-
insensitive) excitatory action of Orx on DA neurons (Korotkova et al., 2003; Uramura et al.,
2001). Interestingly, both extracellular and whole cell patch clamp recordings in vitro show that
25-40% of DA cells are unresponsive to Orx, even at high concentrations (Korotkova et al.,
2006; Korotkova et al., 2002). Moreover, the same laboratory reported no Orx-evoked response
of DA cells in the substantia nigra where the Orx innervation density is lower than in the VTA.
Our finding of only a few synapses from Orx-ir axons onto DA dendrites in the VTA is at least
consistent with these reports, although it does not immediately explain the Orx-induced increase
in firing or oscillatory activity in the majority of DA neurons in this region (Korotkova et al.,
2003).
In some neurochemical studies, intracerebroventricular injections or direct microinfusion
of Orx A into the VTA leads to an increase in extracellular DA levels within the prefrontal
cortex that is not accompanied by a similar increase in the nucleus accumbens (Hagan et al.,
1999; Vittoz and Berridge, 2006). This finding raises the interesting possibility that Orx afferents
to the VTA selectively target the mesoprefrontal and not the mesoaccumbens DA population.
83

The smaller number of VTA neurons with cortical versus striatal targets (Swanson, 1982) would
be consistent with the low number of synapses observed in the present study. Nevertheless, at
least one other group has shown an influence of intra-VTA Orx on DA release in the nucleus
accumbens (Narita et al., 2006). In any case, further experiments are needed to determine
whether these two DA populations express different degrees of Orx input or levels of Orx
receptors.
Orx also increases the firing rate of non-DA (presumably GABA) neurons in the VTA and
substantia nigra, apparently through a direct postsynaptic mechanism that is more potent than the
action on DA cells (Korotkova et al., 2002; Korotkova et al., 2003). The present observation of
only a few synapses of Orx-ir axons onto VTA GABA neurons again appears to be at odds with
these electrophysiological findings. Hence, for either DA or GABA neurons, the strength of
Orx’s electrophysiological influence exceeds what would be predicted on the basis of the
synaptic connections identified here. It therefore seems parsimonious to conclude that the actions
of Orx on VTA cells are mediated primarily via a non-synaptic influence. This suggestion is
consistent with the expression of both Orx 1 and Orx 2 receptors by these cells and their ability
to respond to extrasynaptically applied Orx peptide (Cluderay et al., 2002; Korotkova et al.,
2003; Lu et al., 2000; Marcus et al., 2001; Narita et al., 2006; Uramura et al., 2001).
3.5.4 Functional Considerations
Orx neurons are important regulators of behavioral state within and across sleep-wake stages
(Mochizuki et al., 2004; Saper et al., 2001). Consistent with this role, Orx cells provide a
relatively dense innervation to monoamine cell groups known to be involved in states of arousal
and vigilance: the basal forebrain, tuberomammillary nucleus, dorsal raphe nucleus, and locus
84
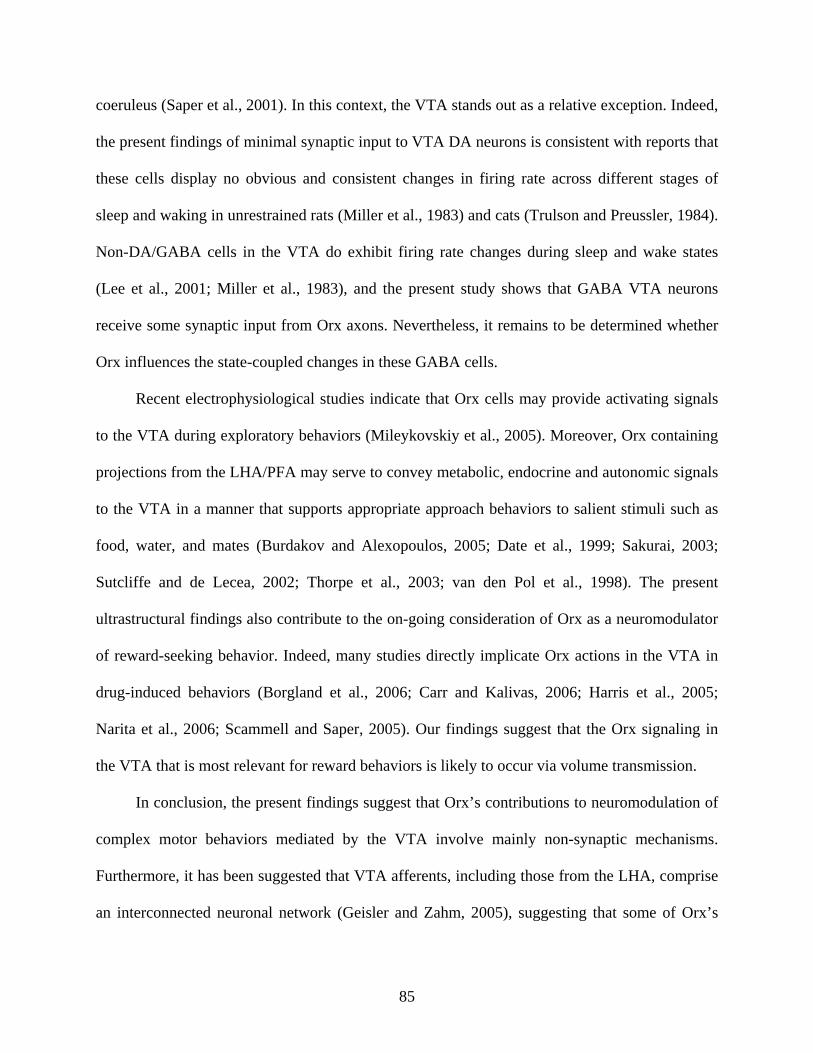
coeruleus (Saper et al., 2001). In this context, the VTA stands out as a relative exception. Indeed,
the present findings of minimal synaptic input to VTA DA neurons is consistent with reports that
these cells display no obvious and consistent changes in firing rate across different stages of
sleep and waking in unrestrained rats (Miller et al., 1983) and cats (Trulson and Preussler, 1984).
Non-DA/GABA cells in the VTA do exhibit firing rate changes during sleep and wake states
(Lee et al., 2001; Miller et al., 1983), and the present study shows that GABA VTA neurons
receive some synaptic input from Orx axons. Nevertheless, it remains to be determined whether
Orx influences the state-coupled changes in these GABA cells.
Recent electrophysiological studies indicate that Orx cells may provide activating signals
to the VTA during exploratory behaviors (Mileykovskiy et al., 2005). Moreover, Orx containing
projections from the LHA/PFA may serve to convey metabolic, endocrine and autonomic signals
to the VTA in a manner that supports appropriate approach behaviors to salient stimuli such as
food, water, and mates (Burdakov and Alexopoulos, 2005; Date et al., 1999; Sakurai, 2003;
Sutcliffe and de Lecea, 2002; Thorpe et al., 2003; van den Pol et al., 1998). The present
ultrastructural findings also contribute to the on-going consideration of Orx as a neuromodulator
of reward-seeking behavior. Indeed, many studies directly implicate Orx actions in the VTA in
drug-induced behaviors (Borgland et al., 2006; Carr and Kalivas, 2006; Harris et al., 2005;
Narita et al., 2006; Scammell and Saper, 2005). Our findings suggest that the Orx signaling in
the VTA that is most relevant for reward behaviors is likely to occur via volume transmission.
In conclusion, the present findings suggest that Orx’s contributions to neuromodulation of
complex motor behaviors mediated by the VTA involve mainly non-synaptic mechanisms.
Furthermore, it has been suggested that VTA afferents, including those from the LHA, comprise
an interconnected neuronal network (Geisler and Zahm, 2005), suggesting that some of Orx’s
85

key actions may also be mediated via polysynaptic connections to reward-relevant forebrain
areas.
86

4.0 GENERAL DISCUSSION
The following discussion will include an overview of issues regarding the functional
implications of lateral hypothalamic area (LHA)-ventral tegmental area (VTA) connectivity in
studies of goal-directed behavior, a comparison of the LHA and orexin (Orx) projections with
regard to their general organization in the VTA, a comparison of the LHA/Orx projections with
previously demonstrated afferents of the VTA, some functional implications of the LHA
projections in terms of VTA cell activity, a view of cataplexy as a failure of the Orx system to
maintain goal-directed behavior during emotional states, future directions, and concluding
remarks.
4.1 The Structure-Function Question
Over several decades, a vast and important literature has implicated an anatomical LHA-to-VTA
connectivity in reward function. While our results demonstrate that this LHA projection is
complex, and indeed synaptic, it is difficult to conclude for certain its functional importance with
regard to VTA function, and in particular, to reward processing and approach/avoidance
behavior. This issue is based on the fact that the LHA is the bed nucleus of the MFB, and the
VTA is situated along this fiber system (Nieuwenhuys et al., 1982). Electrical stimulation of the
MFB would then involve fibers of passage, making it difficult to attribute behavioral effects to
one particular group of cells. Various manipulations of the LHA, no doubt, produce changes in
approach/avoidance behaviors. Stimulation (electrical, neurochemical) and lesion (electrolytic,
excitotoxic) of the LHA activates and depresses, respectively, behaviors such as feeding and
87
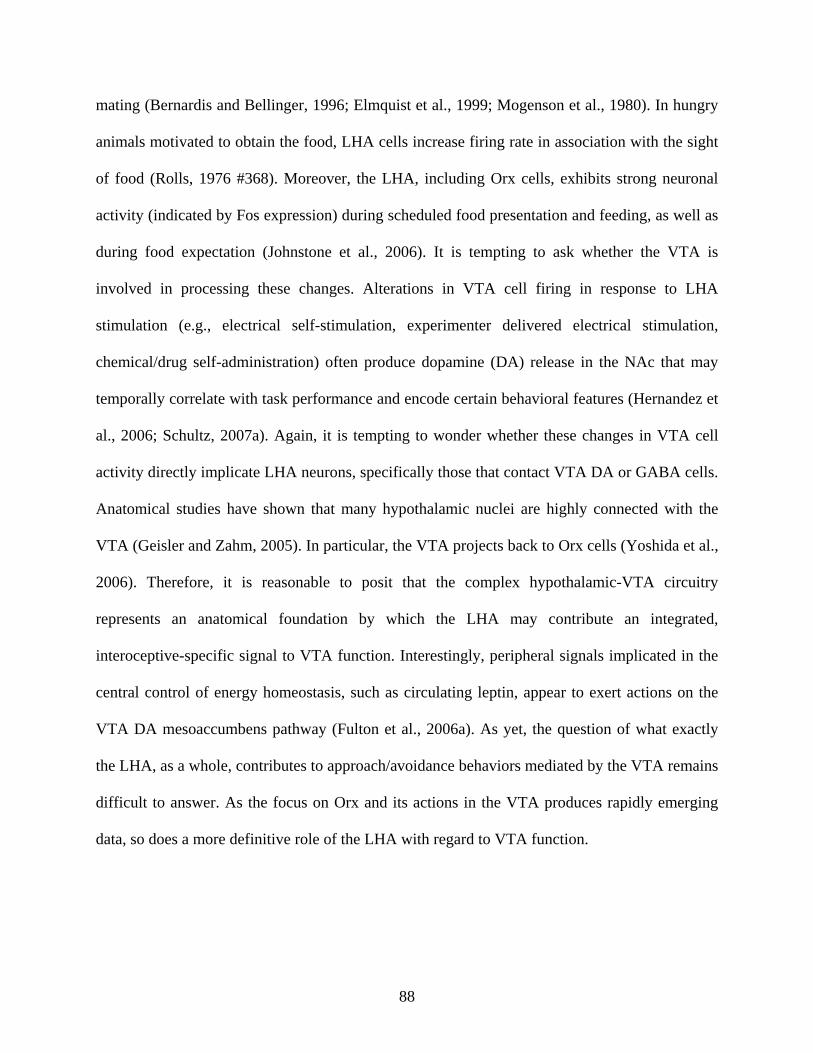
mating (Bernardis and Bellinger, 1996; Elmquist et al., 1999; Mogenson et al., 1980). In hungry
animals motivated to obtain the food, LHA cells increase firing rate in association with the sight
of food (Rolls, 1976 #368). Moreover, the LHA, including Orx cells, exhibits strong neuronal
activity (indicated by Fos expression) during scheduled food presentation and feeding, as well as
during food expectation (Johnstone et al., 2006). It is tempting to ask whether the VTA is
involved in processing these changes. Alterations in VTA cell firing in response to LHA
stimulation (e.g., electrical self-stimulation, experimenter delivered electrical stimulation,
chemical/drug self-administration) often produce dopamine (DA) release in the NAc that may
temporally correlate with task performance and encode certain behavioral features (Hernandez et
al., 2006; Schultz, 2007a). Again, it is tempting to wonder whether these changes in VTA cell
activity directly implicate LHA neurons, specifically those that contact VTA DA or GABA cells.
Anatomical studies have shown that many hypothalamic nuclei are highly connected with the
VTA (Geisler and Zahm, 2005). In particular, the VTA projects back to Orx cells (Yoshida et al.,
2006). Therefore, it is reasonable to posit that the complex hypothalamic-VTA circuitry
represents an anatomical foundation by which the LHA may contribute an integrated,
interoceptive-specific signal to VTA function. Interestingly, peripheral signals implicated in the
central control of energy homeostasis, such as circulating leptin, appear to exert actions on the
VTA DA mesoaccumbens pathway (Fulton et al., 2006a). As yet, the question of what exactly
the LHA, as a whole, contributes to approach/avoidance behaviors mediated by the VTA remains
difficult to answer. As the focus on Orx and its actions in the VTA produces rapidly emerging
data, so does a more definitive role of the LHA with regard to VTA function.
88

4.2 Comparative View of the LHA and Orx Projections in the VTA
The LHA and Orx projections share various morphological features, but demonstrate different
synaptic organization in the VTA. In common with each projection, the majority of axons pass
through the VTA, while the remaining axons that do form contacts, appose more often than
synapse, onto dendrites, the primary target. In each study, out of all contacts made onto VTA
structures, over one-third of LHA or Orx terminals form synaptic specializations. Also in
common are varicose fibers exhibiting neuropeptide signaling characteristics. This similarity is
not surprising considering the abundance of neuroactive peptides produced in the LHA.
Where the LHA and Orx projections greatly differ is the total number of labeled axons
observed per area of tissue analyzed (Ch. 2, Table 1; Ch. 3, Table 2). Roughly three times more
LHA axons are observed than Orx axons in the VTA. Interestingly, the LHA afferent synapses
onto VTA structures 50 times more than the Orx projection, based on the number of synapses per
area of tissue examined (Ch. 2, Table 1; Ch. 3, Table 2). This may represent a key functional
distinction, in that the bulk of Orx signaling in the VTA may not require synaptic junctions by
virtue of peptidergic signaling mechanisms, whereas the LHA as a whole may utilize a more
extensive fast synaptic transmission, in addition to colocalized neuropeptide release. Moreover,
when LHA neurons are strongly activated, neuropeptides may be preferentially released (Hokfelt
et al., 2000).
Another discrepancy is the trend of predominant synaptic type provided by each
projection. LHA axons tend to be inhibitory and Orx axons tend to be excitatory onto VTA
dendrites. The Orx afferent exhibits no synaptic or synaptic-type preference for DA or GABA
cells. In contrast, the excitatory component of the LHA projection appears to synapse
89
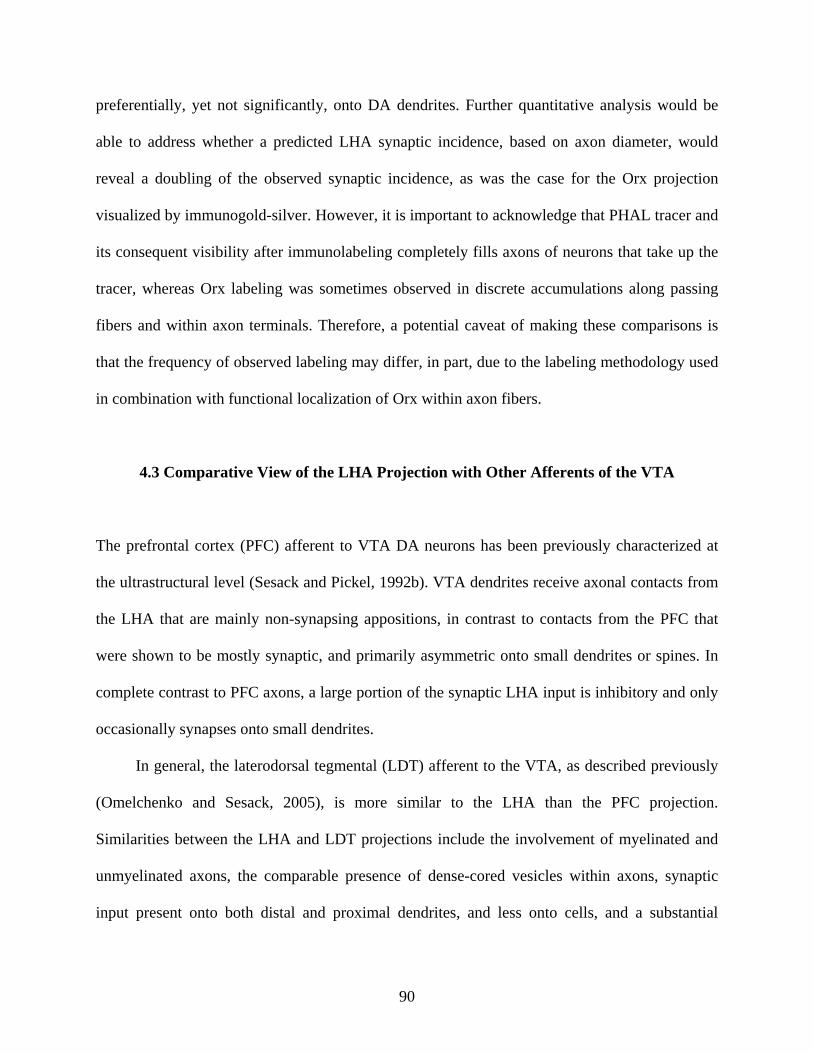
preferentially, yet not significantly, onto DA dendrites. Further quantitative analysis would be
able to address whether a predicted LHA synaptic incidence, based on axon diameter, would
reveal a doubling of the observed synaptic incidence, as was the case for the Orx projection
visualized by immunogold-silver. However, it is important to acknowledge that PHAL tracer and
its consequent visibility after immunolabeling completely fills axons of neurons that take up the
tracer, whereas Orx labeling was sometimes observed in discrete accumulations along passing
fibers and within axon terminals. Therefore, a potential caveat of making these comparisons is
that the frequency of observed labeling may differ, in part, due to the labeling methodology used
in combination with functional localization of Orx within axon fibers.
4.3 Comparative View of the LHA Projection with Other Afferents of the VTA
The prefrontal cortex (PFC) afferent to VTA DA neurons has been previously characterized at
the ultrastructural level (Sesack and Pickel, 1992b). VTA dendrites receive axonal contacts from
the LHA that are mainly non-synapsing appositions, in contrast to contacts from the PFC that
were shown to be mostly synaptic, and primarily asymmetric onto small dendrites or spines. In
complete contrast to PFC axons, a large portion of the synaptic LHA input is inhibitory and only
occasionally synapses onto small dendrites.
In general, the laterodorsal tegmental (LDT) afferent to the VTA, as described previously
(Omelchenko and Sesack, 2005), is more similar to the LHA than the PFC projection.
Similarities between the LHA and LDT projections include the involvement of myelinated and
unmyelinated axons, the comparable presence of dense-cored vesicles within axons, synaptic
input present onto both distal and proximal dendrites, and less onto cells, and a substantial
90
portion of asymmetric synapses onto TH dendrites (an alike, statistically non-significant trend).
Also fairly similar are the substantial proportions of synapsing axons out of all axon terminals.
Whether the slight differences in serial section analysis and the use of biotinylated dextran amine
tracer, as opposed to PHAL, in the LDT study may have produced differential tracer effects
across the two studies is beyond the scope of consideration here.
Overall, the predominant inhibitory component of all the synapsing axons formed by the
LHA appears to be one of the major characteristics that distinguish it from the PFC and LDT
projections. With regard to synaptic axons in the VTA, the PFC provides predominantly
excitatory input, innervating DA (GABA staining was not performed). The LDT provides an
even mixture of inhibitory and excitatory afferents that innervate both DA and GABA. Whether
PFC, LDT, and LHA afferents converge on similar target dendrites in the VTA remains a
possibility that requires further experimentation.
4.4 Functional Implications of the LHA projections in Terms of VTA Cell Activity
Some studies of DA activity focus on the importance of phasic DA activity in response to
behavior, for example Garris et al. (Garris et al., 1999). Other authors suggest that DA plays a
crucial role in the maintenance of brain stimulation reward that accounts for activity changes that
occur on a time scale of minutes (intermediate signaling) in addition to tonic (slow) and phasic
(burst) release (Hernandez et al., 2006). Schultz reasons that intermediate DA signaling as well
must be considered to account for DA activity changes associated with reproductive behavior,
food procurement and consumption, and responses to acute stress (Schultz, 2002). The LHA is
well positioned to contribute to DA signaling changes associated with hypothalamic features of
91
these behaviors. Furthermore, the Orx signaling in the VTA potentiates excitatory currents in DA
neurons with a time course on the order of minutes and is a critical substrate for synaptic
plasticity of afferents to DA neurons (Borgland et al., 2006). However, such speculation is
indirectly supported at best.
Hernandez and colleagues propose a circuitry model describing the role of DA tone in
brain stimulation reward (Hernandez et al., 2006). Our ultrastructural findings agree with some
conceptual elements of this model. The schema defines DA tone as tonic and intermediate
release that occurs over minutes and is as follows; our findings are included in brackets:
1) The directly activated neurons of brain stimulation reward are non-DA.
[Perhaps, these are LHA neurons].
2) The directly activated neurons project, either directly or indirectly, to other non-DA
neurons that process spatiotemporal integration of the rewarding stimuli.
[LHA neurons project to GABA neurons in the VTA.]
3) The processed signal is then relayed to subsequent stages of the circuitry responsible for
the performance of brain self-stimulation.
4) Efferent to the directly activated cells, DA tone modulates transmission between these
neurons and their non-DA targets.
[LHA neurons may influence DA tone via their synaptic input, both inhibitory and
excitatory, onto VTA DA neurons.]
5) Modulation of DA tone occurs by direct action of DA or by way of intermediate neurons
which transmit the tonic DA input.
92
Furthermore, afferents to the LHA may serve to inactivate LHA-derived inhibition of DA
neurons and in turn, facilitate tonic firing of DA neurons. In this regard, select neurons in the
LHA may hold VTA DA neurons in a hyperpolarized state, in a manner similarly imposed by the
ventral pallidum (Floresco et al., 2003; Lodge and Grace, 2006a), until they are released from
inactivity.
Another model proposes that rewarding brain self-stimulation is mediated, in part, by LHA
neurons that provide projections through the VTA that pass on to caudal brainstem regions where
lesions reduce the rewarding effect (Neill et al., 2002). The Orx pathway to the VTA generally
matches the traversing pathway implicated in this model. Altogether, this parallel comparison
does not confirm, but only considers, the LHA neurons as a potential contributor to the
rewarding effects of brain stimulation.
4.5 Cataplexy: A Failure of Integrated Goal-directed Behavior
Orx has been critically implicated in the sleep disorder narcolepsy that includes the symptom of
cataplexy (Thannickal et al., 2003). In canines, defective Orx receptor 2 causes narcolepsy
(Sutcliffe and de Lecea, 2002). Cataplexy is a sudden loss of muscle tone in response to
emotional stimuli and, in canines, can be reliably elicited by the emotional stimulation of food
presentation (Reid et al., 1998). A food-elicited cataplexy test often progresses as follows: during
the presentation of food, the dog responds with vigorous arousal, often in pursuit of the food
stimulus, and then suddenly falls motionless, yet consciously aware of the environment. It may
be that a profound disruption of Orx signaling to monoamine arousal systems results in an
orchestrated malfunction of complex behavioral states.
93

While the basal forebrain cholinergic systems and locus coeruleus neurons (Reid et al.,
1998; Wu et al., 1999) have been implicated to play important roles in regulating cataplexy in
narcoleptic canines, several lines of evidence implicate the VTA (Reid et al., 1998) and Orx
actions in the VTA, as discussed by other researchers (Korotkova et al., 2003; Mileykovskiy et
al., 2005). Intra-VTA administration of DA autoreceptor agonists and antagonists aggravate and
reduce cataplexy, respectively, suggesting an involvement of the mesolimbic DA system in
modulating cataplexy (Reid et al., 1996). In support of this, Orx projections to the
pedunculopontine and LDT nuclei (Peyron et al., 1998) may indirectly influence VTA cell
activity. Moreover, Orx neurons appear to make important contributions to enhancing the
synchronous activity of monoaminergic and cholinergic cells (Siegel and Boehmer, 2006).
Perhaps the disruption of a differential Orx modulation of VTA mesoprefrontal versus
mesoaccumbens pathways underlies the concurrence of sustained consciousness and motor
failure during the presentation of salient, emotionally-arousing stimuli. Maybe relevant to this is
the observation that DA efflux increases in the PFC, but not the NAc, in response to Orx infusion
in VTA regions (Vittoz and Berridge, 2006). Orx neurons are strongly activated (express c-fos
protein) at the onset of food presentation (Johnstone et al., 2006). The release of DA upon
encountering novel and/or rewarding stimuli prepares an animal for maintained behavior
(Schultz, 1998), and this initial DA response “could represent an essential component in the
process of switching attentional and behavioural selections to unexpected, behaviourally
important stimuli” (Redgrave et al., 1999). Therefore, I hypothesize that the involvement of Orx
signaling in the mesocorticolimbic circuitry maintains integrated behavior in response to
stimulus presentation. The LHA, via Orx signaling, may support a gating mechanism, such as
94
LDT-gated burst firing (Grace et al., 2007), whereby indirect afferent drive to the VTA
mesocorticolimbic circuits integrates reward processing with reward procurement.
4.6 Future Directions
The VTA regulates behavioral responses by efferent projections to areas such as the PFC and
NAc (Goldman-Rakic, 1998; White, 1996). Future investigation will continue to address the
extent to which the LHA projects to specific VTA cell populations that compose mesoprefrontal
and mesoaccumbens pathways; preliminary data exists. Ultrastructural information identifying
potential sites of Orx actions in the VTA might be valuable in understanding mechanisms of
Orx’s interactions with DA and GABA neurons in this region. Therefore, the attempt to localize
Orx receptors in the VTA is ongoing. Unfortunately, the lack of effective antibodies has
restricted our efforts. Since the lateral preoptic area of the hypothalamus sends a substantial
glutamatergic afferent to the VTA (Geisler et al., 2007), it would be valuable to examine its
ultrastructural interactions with VTA DA and GABA neurons. Finally, detailed examination of
the LHA projection to the NAc shell may reveal ultrastructural interactions relevant to the study
of appetitive behavior (Kelley, 2004).
4.7 Conclusion
The present findings demonstrate that LHA neurons, including the Orx population, provide a
monosynaptic innervation of VTA DA and GABA cells. Neuropeptide signaling appears to be a
potentially prominent mode of transmission used by LHA projections to the VTA. If LHA
95
projections convey information regarding interoceptive state of the body, then the LHA afferent
to the VTA may be important in shaping particular components of approach/avoidance
behaviors. It may be that the LHA, by its highly synaptic and peptidergic signaling to VTA
neurons, influences the perceived value of natural rewards or the salience of stimuli. In this way
the LHA may contribute to survival-relevant behavior by influencing other circuits that may
support specialized functions, as such behavioral allocation and decision-making. Further
investigation into the functional relevance of these anatomical findings, and in retrospect of
existing findings, may have important implications in the study of eating disorders and substance
abuse, in addition to the basic foundations of normal behavior.
96
REFERENCES
Agnati LF, Zoli M, Stromberg I, Fuxe K. 1995. Intercellular communication in the brain: wiring
versus volume transmission. Neuroscience 69(3):711-726. Akiyama M, Yuasa T, Hayasaka N, Horikawa K, Sakurai T, Shibata S. 2004. Reduced food
anticipatory activity in genetically orexin (hypocretin) neuron-ablated mice. Eur J Neurosci 20:3054-3062.
Anand BK, Brobeck JR. 1951. Localization of a "feeding center" in the hypothalamus of the rat.
Proc Soc Exp Biol Med 77(2):323-324. Arvanitogiannis A, Waraczynski M, Shizgal P. 1996. Effects of excitotoxic lesions of the basal
forebrain on MFB self-stimulation. Physiol Behav 59(4-5):795-806. Aston-Jones G, Zhu Y, Card JP. 2004. Numerous GABAergic afferents to locus ceruleus in the
pericerulear dendritic zone: possible interneuronal pool. J Neurosci 24:2313-2321. Balcita-Pedicino JJ, Sesack SR. 2005. Projections from the lateral hypothalamus to the ventral
tegmental area in the rat synapse onto mesoaccumbens dopamine and GABA neurons. Soc Neurosci Abstr:605.608.
Balcita-Pedicino JJ, Sesack SR. 2007. Orexin axons in the rat ventral tegmental area synapse
infrequently onto dopamine and gamma-aminobutyric acid neurons. J Comp Neurol 503(5):668-684.
Baldo BA, Daniel RA, Berridge CW, Kelley AE. 2003. Overlapping distributions of
orexin/hypocretin- and dopamine-beta-hydroxylase immunoreactive fibers in rat brain regions mediating arousal, motivation, and stress. J Comp Neurol 464:220-237.
Beaudet A, Sotelo C. 1981. Synaptic remodeling of serotonin axon terminals in rat agranular
cerebellum. Brain Res 206(2):305-329. Berk ML, Finkelstein JA. 1982. Efferent connections of the lateral hypothalamic area of the rat:
an autoradiographic investigation. Brain Res Bull 8:511-526. Bernardis LL, Bellinger LL. 1996. The lateral hypothalamic area revisited: ingestive behavior.
Neuroscience & Biobehavioral Reviews 20(2):189-287. Berthoud HR. 2004. Mind versus metabolism in the control of food intake and energy balance.
Physiol Behav 81(5):781-793. Bielajew C, Shizgal P. 1982. Behaviorally derived measures of conduction velocity in the
substrate for rewarding medial forebrain bundle stimulation. Brain Res 237(1):107-119.
97
Bielajew C, Shizgal P. 1986. Evidence implicating descending fibers in self-stimulation of the medial forebrain bundle. J Neurosci 6(4):919-929.
Bittencourt JC, Presse F, Arias C, Peto C, Vaughan J, Nahon JL, Vale W, Sawchenko PE. 1992.
The melanin-concentrating hormone system of the rat brain: an immuno- and hybridization histochemical characterization. J Comp Neurol 319(2):218-245.
Blackburn JR, Pfaus JG, Phillips AG. 1992. Dopamine functions in appetitive and defensive
behaviours. Prog Neurobiol 39(3):247-279. Borgland SL, Taha SA, Sarti F, Fields HL, Bonci A. 2006. Orexin A in the VTA Is Critical for
the Induction of Synaptic Plasticity and Behavioral Sensitization to Cocaine. Neuron 49:589-601.
Burdakov D, Alexopoulos H. 2005. Metabolic state signalling through central hypocretin/orexin
neurons. J Cell Mol Med 9(4):795-803. Cabeza de Vaca S, Carr KD. 1998. Food restriction enhances the central rewarding effect of
abused drugs. J Neurosci 18(18):7502-7510. Carlin R. 1980. Isolation and characterization of postsynaptic densities from various brain
regions: enrichment of different types of postsynaptic densities. J Cell Biol 86:831-843. Carr D, Kalivas P. 2006. Orexin: a gatekeeper of addiction. Nat Med 12(3):274-276. Carr DB, O'Donnell P, Card JP, Sesack SR. 1999. Dopamine terminals in the rat prefrontal
cortex synapse on pyramidal cells that project to the nucleus accumbens. J Neurosci 19(24):11049-11060.
Carr DB, Sesack SR. 2000a. Dopamine terminals synapse on callosal projection neurons in the
rat prefrontal cortex. J Comp Neurol 425(2):275-283. Carr DB, Sesack SR. 2000b. GABA-containing neurons in the rat ventral tegmental area project
to the prefrontal cortex. Synapse 38:114-123. Carr DB, Sesack SR. 2000c. Projections from the rat prefrontal cortex to the ventral tegmental
area: target specificity in the synaptic associations with mesoaccumbens and mesocortical neurons. J Neurosci 20:3864-3873.
Carr KD. 2002. Augmentation of drug reward by chronic food restriction: behavioral evidence
and underlying mechanisms. Physiol Behav 76(3):353-364. Chan J, Aoki C, Pickel VM. 1990. Optimization of differential immunogold-silver and
peroxidase labeling with maintenance of ultrastructure in brain sections before plastic embedding. J Neurosci Meth 33(2-3):113-127.
98
Chemelli RM, Willie JT, Sinton CM, Elmquist JK, Scammell T, Lee C, Richardson JA, Williams SC, Xiong Y, Kisanuki Y, Fitch TE, Nakazato M, Hammer RE, Saper CB, Yanagisawa M. 1999. Narcolepsy in orexin knockout mice: molecular genetics of sleep regulation. Cell 98:437-451.
Chou TC, Lee CE, Lu J, Elmquist JK, Hara J, Willie JT, Beuckmann CT, Chemelli RM, Sakurai
T, Yanagisawa M, Saper CB, Scammell TE. 2001. Orexin (hypocretin) neurons contain dynorphin. J Neurosci 21:RC168.
Cluderay JE, Harrison DC, Hervieu GJ. 2002. Protein distribution of the orexin-2 receptor in the
rat central nervous system. Regul Pept 104:131-144. Cooper DC. 2002. The significance of action potential bursting in the brain reward circuit.
Neurochemistry International 41(5):333-340. Crocker A, Espana RA, Papadopoulou M, Saper CB, Faraco J, Sakurai T, Honda M, Mignot E,
Scammell TE. 2005. Concomitant loss of dynorphin, NARP, and orexin in narcolepsy. Neurology 65(8):1184-1188.
Cutler DJ, Morris R, Sheridhar V, Wattam TA, Holmes S, Patel S, Arch JR, Wilson S,
Buckingham RE, Evans ML, Leslie RA, Williams G. 1999. Differential distribution of orexin-A and orexin-B immunoreactivity in the rat brain and spinal cord. Peptides 20:1455-1470.
Dallvechia-Adams S, Kuhar MJ, Smith Y. 2002. Cocaine- and amphetamine-regulated transcript
peptide projections in the ventral midbrain: colocalization with gamma-aminobutyric acid, melanin-concentrating hormone, dynorphin, and synaptic interactions with dopamine neurons. J Comp Neurol 448:360-372.
Date Y, Ueta Y, Yamashita H, Yamaguchi H, Matsukura S, Kangawa K, Sakurai T, Yanagisawa
M, Nakazato M. 1999. Orexins, orexigenic hypothalamic peptides, interact with autonomic, neuroendocrine and neuroregulatory systems. Proc Natl Acad Sci U S A 96:748-753.
De Groot DM. 1988. Comparison of methods for the estimation of the thickness of ultrathin
tissue sections. J Microsc 151(Pt 1):23-42. de Lecea L, Kilduff TS, Peyron C, Gao X, Foye PE, Danielson PE, Fukuhara C, Battenberg EL,
Gautvik VT, Bartlett FS, 2nd, Frankel WN, van den Pol AN, Bloom FE, Gautvik KM, Sutcliffe JG. 1998. The hypocretins: hypothalamus-specific peptides with neuroexcitatory activity. Proc Natl Acad Sci U S A 95:322-327.
DiLeone RJ, Georgescu D, Nestler EJ. 2003. Lateral hypothalamic neuropeptides in reward and
drug addiction. Life Sci 73(6):759-768.
99

Dominguez JM, Hull EM. 2005. Dopamine, the medial preoptic area, and male sexual behavior. Physiol Behav 86(3):356-368.
Edinger HM, Kramer SZ, Siegel A. 1977. Effect of hypothalamic stimulation on mesencephalic
neurons. Exp Neurol 54(1):91-103. Elmquist JK, Elias CF, Saper CB. 1999. From lesions to leptin: hypothalamic control of food
intake and body weight. Neuron 22:221-232. Fadel J, Deutch AY. 2002. Anatomical substrates of orexin-dopamine interactions: lateral
hypothalamic projections to the ventral tegmental area. Neuroscience 111:379-387. Floresco SB, West AR, Ash B, Moore H, Grace AA. 2003. Afferent modulation of dopamine
neuron firing differentially regulates tonic and phasic dopamine transmission. Nat Neurosci 6(9):968-973.
Fulton S, Pissios P, Manchon RP, Stiles L, Frank L, Pothos EN, Maratos-Flier E, Flier JS. 2006a.
Leptin regulation of the mesoaccumbens dopamine pathway. Neuron 51(6):811-822. Fulton S, Woodside B, Shizgal P. 2006b. Potentiation of brain stimulation reward by weight loss:
evidence for functional heterogeneity in brain reward circuitry. Behav Brain Res 174(1):56-63.
Galas L, Vaudry H, Braun B, van den Pol AN, De Lecea L, Sutcliffe JG, Chartrel N. 2001.
Immunohistochemical localization and biochemical characterization of hypocretin/orexin-related peptides in the central nervous system of the frog Rana ridibunda. J Comp Neurol 429:242-252.
Gao XB, van den Pol AN. 2001. Melanin concentrating hormone depresses synaptic activity of
glutamate and GABA neurons from rat lateral hypothalamus. J Physiol 533(Pt 1):237-252.
Garris PA, Kilpatrick M, Bunin MA, Michael D, Walker QD, Wightman RM. 1999. Dissociation
of dopamine release in the nucleus accumbens from intracranial self-stimulation. Nature 398(6722):67-69.
Geisler S, Derst C, Veh RW, Zahm DS. 2007. Glutamatergic afferents of the ventral tegmental
area in the rat. J Neurosci 27(21):5730-5743. Geisler S, Zahm DS. 2005. Afferents of the ventral tegmental area in the rat-anatomical
substratum for integrative functions. J Comp Neurol 490:270-294. Geisler S, Zahm DS. 2006. Neurotensin afferents of the ventral tegmental area in the rat: [1] re-
examination of their origins and [2] responses to acute psychostimulant and antipsychotic drug administration. Eur J Neurosci 24(1):116-134.
100
Gerashchenko D, Shiromani PJ. 2004. Different neuronal phenotypes in the lateral hypothalamus and their role in sleep and wakefulness. Mol Neurobiol 29(1):41-59.
Gerfen CR, Sawchenko PE. 1984. An anterograde neuroanatomical tracing method that shows
the detailed morphology of neurons, their axons and terminals: immunohistochemical localization of an axonally transported plant lectin, Phaseolus vulgaris leucoagglutinin (PHA-L). Brain Res 290(2):219-238.
Goldman-Rakic PS. 1998. The cortical dopamine system: role in memory and cognition. Adv
Pharmacol 42:707-711. Grace AA, Floresco SB, Goto Y, Lodge DJ. 2007. Regulation of firing of dopaminergic neurons
and control of goal-directed behaviors. Trends Neurosci 30(5):220-227. Grossman SP, Dacey D, Halaris AE, Collier T, Routtenberg A. 1978. Aphagia and adipsia after
preferential destruction of nerve cell bodies in hypothalamus. Science 202(4367):537-539.
Grossman SP, Grossman L. 1982. Iontophoretic injections of kainic acid into the rat lateral
hypothalamus: effects on ingestive behavior. Physiol Behav 29(3):553-559. Guan JL, Wang QP, Kageyama H, Kita T, Takenoya F, Hori T, Shioda S. 2005. Characterization
of orexin A immunoreactivity in the rat area postrema. Regul Pept 129:17-23. Guan JL, Wang QP, Shioda S. 2003. Immunoelectron microscopic examination of orexin-like
immunoreactive fibers in the dorsal horn of the rat spinal cord. Brain Res 987:86-92. Hagan JJ, Leslie RA, Patel S, Evans ML, Wattam TA, Holmes S, Benham CD, Taylor SG,
Routledge C, Hemmati P, Munton RP, Ashmeade TE, Shah AS, Hatcher JP, Hatcher PD, Jones DN, Smith MI, Piper DC, Hunter AJ, Porter RA, Upton N. 1999. Orexin A activates locus coeruleus cell firing and increases arousal in the rat. Proc Natl Acad Sci U S A 96:10911-10916.
Hara J, Beuckmann CT, Nambu T, Willie JT, Chemelli RM, Sinton CM, Sugiyama F, Yagami
K, Goto K, Yanagisawa M, Sakurai T. 2001. Genetic ablation of orexin neurons in mice results in narcolepsy, hypophagia, and obesity. Neuron 30:345-354.
Harris GC, Wimmer M, Aston-Jones G. 2005. A role for lateral hypothalamic orexin neurons in
reward seeking. Nature 437(7058):556-559. Hatton GI. 2004. Dynamic neuronal-glial interactions: an overview 20 years later. Peptides
25(3):403-411. Heien ML, Wightman RM. 2006. Phasic dopamine signaling during behavior, reward, and
disease states. CNS Neurol Disord Drug Targets 5(1):99-108.
101
Hernandez G, Hamdani S, Rajabi H, Conover K, Stewart J, Arvanitogiannis A, Shizgal P. 2006. Prolonged rewarding stimulation of the rat medial forebrain bundle: neurochemical and behavioral consequences. Behavioral Neuroscience 120(4):888-904.
Hernandez L, Hoebel BG. 1988. Feeding and hypothalamic stimulation increase dopamine
turnover in the accumbens. Physiol Behav 44(4-5):599-606. Hoebel BG. 1997. Neuroscience and appetitive behavior research: 25 years. Appetite 29(2):119-
133. Hoebel BG, Hernandez L, Schwartz DH, Mark GP, Hunter GA. 1989. Microdialysis studies of
brain norepinephrine, serotonin, and dopamine release during ingestive behavior. Theoretical and clinical implications. Ann N Y Acad Sci 575:171-191; discussion 192-173.
Hokfelt T, Broberger C, Xu ZQ, Sergeyev V, Ubink R, Diez M. 2000. Neuropeptides--an
overview. Neuropharmacology 39(8):1337-1356. Horvath TL, Diano S, van den Pol AN. 1999a. Synaptic interaction between hypocretin (orexin)
and neuropeptide Y cells in the rodent and primate hypothalamus: a novel circuit implicated in metabolic and endocrine regulations. J Neurosci 19:1072-1087.
Horvath TL, Peyron C, Diano S, Ivanov A, Aston-Jones G, Kilduff TS, van Den Pol AN. 1999b.
Hypocretin (orexin) activation and synaptic innervation of the locus coeruleus noradrenergic system. J Comp Neurol 415:145-159.
Huang H, Acuna-Goycolea C, Li Y, Cheng HM, Obrietan K, van den Pol AN. 2007.
Cannabinoids excite hypothalamic melanin-concentrating hormone but inhibit hypocretin/orexin neurons: implications for cannabinoid actions on food intake and cognitive arousal. J Neurosci 27(18):4870-4881.
Huesa G, van den Pol AN, Finger TE. 2005. Differential distribution of hypocretin (orexin) and
melanin-concentrating hormone in the goldfish brain. J Comp Neurol 488:476-491. Hur EE, Zaborszky L. 2005. Vglut2 afferents to the medial prefrontal and primary
somatosensory cortices: a combined retrograde tracing in situ hybridization. J Comp Neurol 483(3):351-373.
Ikemoto S, Wise RA. 2004. Mapping of chemical trigger zones for reward. Neuropharmacology
47 (Suppl 1):190-201. Johnstone LE, Fong TM, Leng G. 2006. Neuronal activation in the hypothalamus and brainstem
during feeding in rats. Cell Metabolism 4(4):313-321. Kalivas PW, Volkow ND. 2005. The neural basis of addiction: a pathology of motivation and
choice. American Journal of Psychiatry 162(8):1403-1413.
102
Kawano M, Kawasaki A, Sakata-Haga H, Fukui Y, Kawano H, Nogami H, Hisano S. 2006. Particular subpopulations of midbrain and hypothalamic dopamine neurons express vesicular glutamate transporter 2 in the rat brain. J Comp Neurol 498(5):581-592.
Kelley AE. 2004. Ventral striatal control of appetitive motivation: role in ingestive behavior and
reward-related learning. Neurosci Biobehav Rev 27(8):765-776. Kelley AE, Baldo BA, Pratt WE. 2005. A proposed hypothalamic-thalamic-striatal axis for the
integration of energy balance, arousal, and food reward. J Comp Neurol 493(1):72-85. Kitai ST, Shepard PD, Callaway JC, Scroggs R. 1999. Afferent modulation of dopamine neuron
firing patterns. Curr Opin Neurobiol 9(6):690-697. Kiyatkin EA. 2002. Dopamine in the nucleus accumbens: cellular actions, drug- and behavior-
associated fluctuations, and a possible role in an organism's adaptive activity. Behav Brain Res 137(1-2):27-46.
Koob GF. 1996. Hedonic valence, dopamine and motivation. Mol Psychiatry 1(3):186-189. Korotkova TM, Brown RE, Sergeeva OA, Ponomarenko AA, Haas HL. 2006. Effects of arousal-
and feeding-related neuropeptides on dopaminergic and GABAergic neurons in the ventral tegmental area of the rat. Eur J Neurosci 23(10):2677-2685.
Korotkova TM, Eriksson KS, Haas HL, Brown RE. 2002. Selective excitation of GABAergic
neurons in the substantia nigra of the rat by orexin/hypocretin in vitro. Regul Pept 104:83-89.
Korotkova TM, Sergeeva OA, Eriksson KS, Haas HL, Brown RE. 2003. Excitation of ventral
tegmental area dopaminergic and nondopaminergic neurons by orexins/hypocretins. J Neurosci 23:7-11.
Lassen MB, Brown JE, Stobbs SH, Gunderson SH, Maes L, Valenzuela CF, Ray AP, Henriksen
SJ, Steffensen SC. 2007. Brain stimulation reward is integrated by a network of electrically coupled GABA neurons. Brain Res 1156:46-58.
Laviolette SR, van der Kooy D. 2001. GABA(A) receptors in the ventral tegmental area control
bidirectional reward signalling between dopaminergic and non-dopaminergic neural motivational systems. Eur J Neurosci 13(5):1009-1015.
Lee RS, Steffensen SC, Henriksen SJ. 2001. Discharge profiles of ventral tegmental area GABA
neurons during movement, anesthesia, and the sleep-wake cycle. J Neurosci 21(5):1757-1766.
Lewis DA, Melchitzky DS, Haycock JW. 1994. Expression and distribution of two isoforms of
tyrosine hydroxylase in monkey brain. Brain Res 656:1-13.
103

Li Y, Gao XB, Sakurai T, van den Pol AN. 2002. Hypocretin/Orexin excites hypocretin neurons via a local glutamate neuron-A potential mechanism for orchestrating the hypothalamic arousal system. Neuron 36:1169-1181.
Liu RJ, van den Pol AN, Aghajanian GK. 2002. Hypocretins (orexins) regulate serotonin
neurons in the dorsal raphe nucleus by excitatory direct and inhibitory indirect actions. J Neurosci 22:9453-9464.
Lodge DJ, Grace AA. 2006a. The hippocampus modulates dopamine neuron responsivity by
regulating the intensity of phasic neuron activation. Neuropsychopharmacology 31(7):1356-1361.
Lodge DJ, Grace AA. 2006b. The laterodorsal tegmentum is essential for burst firing of ventral
tegmental area dopamine neurons. Proc Natl Acad Sci U S A 103(13):5167-5172. Lorrain DS, Matuszewich L, Friedman RD, Hull EM. 1997. Extracellular serotonin in the lateral
hypothalamic area is increased during the postejaculatory interval and impairs copulation in male rats. J Neurosci 17(23):9361-9366.
Lorrain DS, Riolo JV, Matuszewich L, Hull EM. 1999. Lateral hypothalamic serotonin inhibits
nucleus accumbens dopamine: implications for sexual satiety. J Neurosci 19(17):7648-7652.
Lu W, Marinelli M, Xu D, Worley PF, Wolf ME. 2002. Amphetamine and cocaine do not
increase Narp expression in rat ventral tegmental area, nucleus accumbens or prefrontal cortex, but Narp may contribute to individual differences in responding to a novel environment. Eur J Neurosci 15(21):2027-2036.
Lu XY, Bagnol D, Burke S, Akil H, Watson SJ. 2000. Differential distribution and regulation of
OX1 and OX2 orexin/hypocretin receptor messenger RNA in the brain upon fasting. Horm Behav 37:335-344.
Maeda H, Mogenson GJ. 1981. A comparison of the effects of electrical stimulation of the lateral
and ventromedial hypothalamus on the activity of neurons in the ventral tegmental area and substantia nigra. Brain Res Bull 7(3):283-291.
Marcus JN, Aschkenasi CJ, Lee CE, Chemelli RM, Saper CB, Yanagisawa M, Elmquist JK.
2001. Differential expression of orexin receptors 1 and 2 in the rat brain. J Comp Neurol 435:6-25.
Meister B. 2007. Neurotransmitters in key neurons of the hypothalamus that regulate feeding
behavior and body weight. Physiol Behav 92(1-2):263-271. Mileykovskiy BY, Kiyashchenko LI, Siegel JM. 2005. Behavioral correlates of activity in
identified hypocretin/orexin neurons. Neuron 46:787-798.
104

Miller JD, Farber J, Gatz P, Roffwarg H, German DC. 1983. Activity of mesencephalic dopamine and non-dopamine neurons across stages of sleep and walking in the rat. Brain Res 273:133-141.
Mintz EM, van den Pol AN, Casano AA, Albers HE. 2001. Distribution of hypocretin-(orexin)
immunoreactivity in the central nervous system of Syrian hamsters (Mesocricetus auratus). J Chem Neuroanat 21:225-238.
Mochizuki T, Crocker A, McCormack S, Yanagisawa M, Sakurai T, Scammell TE. 2004.
Behavioral state instability in orexin knock-out mice. J Neurosci 24:6291-6300. Mogenson GJ, Jones DL, Yim CY. 1980. From motivation to action: functional interface
between the limbic system and the motor system. Prog Neurobiol 14(2-3):69-97. Moore RY, Bloom FE. 1978. Central catecholamine neuron systems: anatomy and physiology of
the dopamine systems. Annu Rev Neurosci 1:129-169. Murray B, Shizgal P. 1996. Attenuation of medical forebrain bundle reward by anterior lateral
hypothalamic lesions. Behav Brain Res 75(1-2):33-47. Muschamp JW, Dominguez JM, Sato SM, Shen RY, Hull EM. 2007. A role for hypocretin
(orexin) in male sexual behavior. J Neurosci 27(11):2837-2845. Nambu T, Sakurai T, Mizukami K, Hosoya Y, Yanagisawa M, Goto K. 1999. Distribution of
orexin neurons in the adult rat brain. Brain Res 827:243-260. Narita M, Nagumo Y, Hashimoto S, Narita M, Khotib J, Miyatake M, Sakurai T, Yanagisawa M,
Nakamachi T, Shioda S, T S. 2006. Direct involvement of orexinergic systems in the activation of the mesolimbic dopamine pathway and related behaviors induced by morphine. J Neurosci 26(2):398-405.
Neill DB, Fenton H, Justice JBJ. 2002. Increase in accumbal dopaminergic transmission
correlates with response cost not reward of hypothalamic stimulation. Behav Brain Res 137(1-2):129-138.
Nieuwenhuys R, Geeraedts LM, Veening JG. 1982. The medial forebrain bundle of the rat. I.
General introduction. J Comp Neurol 206(1):49-81. Nishino S. 2007. The hypothalamic peptidergic system, hypocretin/orexin and vigilance control.
Neuropeptides 41(3):117-133. Olds J, Milner P. 1954. Positive reinforcement produced by electrical stimulation of septal area
and other regions of rat brain. J Comp Physiol Psychol 47(6):419-427. Oliet SH, Piet R, Poulain DA. 2001. Control of glutamate clearance and synaptic efficacy by
glial coverage of neurons. Science 292(5518):923-926.
105
Oliet SH, Piet R, Poulain DA, Theodosis DT. 2004. Glial modulation of synaptic transmission: Insights from the supraoptic nucleus of the hypothalamus. Glia 47(3):258-267.
Omelchenko NV, Sesack SR. 2005. Laterodorsal tegmental projections to identified cell
populations in the rat ventral tegmental area. J Comp Neurol 483:217-235. Omelchenko NV, Sesack SR. 2006. Ultrastructural evidence that non-dopamine cells in the rat
ventral tegmental area synapse locally onto dopamine and GABA neurons. Soc Neurosci Abstr:722.712.
Ono T, Nakamura K, Nishijo H, Fukuda M. 1986. Hypothalamic neuron involvement in
integration of reward, aversion, and cue signals. J Neurophysiol 56(1):63-79. Overton PG, Clark D. 1997. Burst firing in midbrain dopaminergic neurons. Brain Research,
Brain Research Reviews 25(3):312-334. Paxinos G, Watson C. 1998. The rat brain in stereotaxic coordinates. San Diego: Academic
Press. Peters A, Palay SL. 1991. The fine structure of the nervous system: neurons and their supporting
cells. New York: Oxford. Peyron C, Tighe DK, van den Pol AN, de Lecea L, Heller HC, Sutcliffe JG, Kilduff TS. 1998.
Neurons containing hypocretin (orexin) project to multiple neuronal systems. J Neurosci 18:9996-10015.
Phillipson OT. 1979. Afferent projections to the ventral tegmental area of Tsai and
interfascicular nucleus: a horseradish peroxidase study in the rat. J Comp Neurol 187:117-143.
Pickel VM, Chan J, Sesack SR. 1993. Cellular substrates for interactions between dynorphin
terminals and dopamine dendrites in rat ventral tegmental area and substantia nigra. Brain Res 602(2):275-289.
Piet R, Vargova L, Sykova E, Poulain DA, Oliet SH. 2004. Physiological contribution of the
astrocytic environment of neurons to intersynaptic crosstalk. Proc Natl Acad Sci U S A 101(7):2151-2155.
Redgrave P, Prescott TJ, Gurney K. 1999. Is the short-latency dopamine response too short to
signal reward error? Trends Neurosci 22(4):146-151. Reid MS, Nishino S, Tafti M, Siegel JM, Dement WC, Mignot E. 1998. Neuropharmacological
characterization of basal forebrain cholinergic stimulated cataplexy in narcoleptic canines. Exp Neurol 151(1):89-104.
106
Reid MS, Tafti M, Nishino S, Sampathkumaran R, Siegel JM, Mignot E. 1996. Local administration of dopaminergic drugs into the ventral tegmental area modulates cataplexy in the narcoleptic canine. Brain Res 733(1):83-100.
Rinaman L. 2007. Visceral sensory inputs to the endocrine hypothalamus. Front
Neuroendocrinol 28(1):50-60. Rosin DL, Weston MC, Sevigny CP, Stornetta RL, Guyenet PG. 2003. Hypothalamic orexin
(hypocretin) neurons express vesicular glutamate transporters VGLUT1 or VGLUT2. J Comp Neurol 465:593-603.
Routtenberg A, Lindy J. 1965. Effects of the availability of rewarding septal and hypothalamic
stimulation on bar pressing for food under conditions of deprivation. J Comp Physiol Psychol 60(2):158-161.
Sakurai T. 2003. Orexin: a link between energy homeostasis and adaptive behaviour. Current
Opinion in Clinical Nutrition and Metabolic Care 6:353-360. Sakurai T. 2007. The neural circuit of orexin (hypocretin): maintaining sleep and wakefulness.
Nature Reviews Neuroscience 8(3):171-181. Sakurai T, Amemiya A, Ishii M, Matsuzaki I, Chemelli RM, Tanaka H, Williams SC,
Richardson JA, Kozlowski GP, Wilson S, Arch JR, Buckingham RE, Haynes AC, Carr SA, Annan RS, McNulty DE, S LW, Terrett JA, Elshourbagy NA, Bergsma DJ, Yanagisawa M. 1998. Orexins and orexin receptors: a family of hypothalamic neuropeptides and G protein-coupled receptors that regulate feeding behavior. Cell 92:573-585.
Saper CB, Chou TC, Elmquist JK. 2002. The need to feed: homeostatic and hedonic control of
eating. Neuron 36:199-211. Saper CB, Chou TC, Scammell TE. 2001. The sleep switch: hypothalamic control of sleep and
wakefulness. Trends Neurosci 24:726-731. Saper CB, Swanson LW, Cowan WM. 1979. An autoradiographic study of the efferent
connections of the lateral hypothalamic area in the rat. J Comp Neurol 183:689-706. Scammell TE, Saper CB. 2005. Orexin, drugs and motivated behaviors. Nat Neurosci
8(10):1286-1288. Schultz W. 1998. Predictive reward signal of dopamine neurons. J Neurophysiol 80(1):1-27. Schultz W. 2002. Getting formal with dopamine and reward. Neuron 36(2):241-263. Schultz W. 2007a. Behavioral dopamine signals. Trends Neurosci 30(5):203-210.
107
Schultz W. 2007b. Multiple dopamine functions at different time courses. Annu Rev Neurosci 30:259-288.
Schwartz MW, Woods SC, Porte D, Seeley RJ, Baskin DG. 2000. Central nervous system
control of food intake. Nature 404(6778):661-671. Sesack SR, Miner LH, Omelchenko N. 2006. Preembedding immunoelectron microscopy :
applications for studies of the nervous system. In: Zaborszky L, Wouterlood FG, Lanciego JL, editors. Neuroanatomical tract-tracing 3 : molecules, neurons, and systems. 3rd ed. New York: Springer. p 6-71.
Sesack SR, Pickel VM. 1992a. Dual ultrastructural localization of enkephalin and tyrosine
hydroxylase immunoreactivity in the rat ventral tegmental area: multiple substrates for opiate-dopamine interactions. J Neurosci 12:1335-1350.
Sesack SR, Pickel VM. 1992b. Prefrontal cortical efferents in the rat synapse on unlabeled
neuronal targets of catecholamine terminals in the nucleus accumbens septi and on dopamine neurons in the ventral tegmental area. J Comp Neurol 320(2):145-160.
Sesack SR, Snyder CL, Lewis DA. 1995. Axon terminals immunolabeled for dopamine or
tyrosine hydroxylase synapse on GABA-immunoreactive dendrites in rat and monkey cortex. J Comp Neurol 363(2):264-280.
Shizgal P. 1989. Toward a cellular analysis of intracranial self-stimulation: contributions of
collision studies. Neuroscience & Biobehavioral Reviews 13(2-3):81-90. Shizgal P, Bielajew C, Corbett D, Skelton R, Yeomans J. 1980. Behavioral methods for inferring
anatomical linkage between rewarding brain stimulation sites. J Comp Physiol Psychol 94(2):227-237.
Shizgal P, Fulton S, Woodside B. 2001. Brain reward circuitry and the regulation of energy
balance. Int J Obes Relat Metab Disord 25(Suppl 5):S17-S21. Siegel JM. 2004. Hypocretin (orexin): role in normal behavior and neuropathology. Annu Rev
Psychol 55:125-148. Siegel JM, Boehmer LN. 2006. Narcolepsy and the hypocretin system--where motion meets
emotion. Nat Clin Pract Neurol 2(10):548-556. Stanley BG, Willett VL, Donias HW, Dee MG, Duva MA. 1996. Lateral hypothalamic NMDA
receptors and glutamate as physiological mediators of eating and weight control. Am J Physiol 270(2 Pt 2):R443-449.
Steffensen SC, Lee RS, Stobbs SH, Henriksen SJ. 2001. Responses of ventral tegmental area
GABA neurons to brain stimulation reward. Brain Res Bull 906(1-2):190-197.
108
Steffensen SC, Svingos AL, Pickel VM, Henriksen SJ. 1998. Electrophysiological characterization of GABAergic neurons in the ventral tegmental area. J Neurosci 18(19):8003-8015.
Stricker EM, Zigmond MJ. 1984. Brain catecholamines and the central control of food intake. Int
J Obes Relat Metab Disord 8(Suppl 1):39-50. Sutcliffe JG, de Lecea L. 2002. The hypocretins: setting the arousal threshold. Nature Reviews
Neuroscience 3:339-349. Swanson LW. 1982. The projections of the ventral tegmental area and adjacent regions: a
combined fluorescent retrograde tracer and immunofluorescence study in the rat. Brain Res Bull 9:321-353.
Swanson LW, Sanchez-Watts G, Watts AG. 2005. Comparison of melanin-concentrating
hormone and hypocretin/orexin mRNA expression patterns in a new parceling scheme of the lateral hypothalamic zone. Neurosci Lett 387(2):80-84.
Sykova E. 2004. Extrasynaptic volume transmission and diffusion parameters of the extracellular
space. Neuroscience 129(4):861-876. Ter Horst GJ, Luiten PG. 1987. Phaseolus vulgaris leuco-agglutinin tracing of intrahypothalamic
connections of the lateral, ventromedial, dorsomedial and paraventricular hypothalamic nuclei in the rat. Brain Res Bull 18(2):191-203.
Thannickal TC, Siegel JM, Nienhuis R, Moore RY. 2003. Pattern of hypocretin (orexin) soma
and axon loss, and gliosis, in human narcolepsy. Brain Pathology 13:340-351. Thierry AM, Tassin JP, Blanc G, Glowinski J. 1976. Selective activation of mesocortical DA
system by stress. Nature 263(5574):242-244. Thorpe AJ, Mullett MA, Wang C, Kotz CM. 2003. Peptides that regulate food intake: regional,
metabolic, and circadian specificity of lateral hypothalamic orexin A feeding stimulation. Am J Physiol Regul Integr Comp Physiol 284:R1409-1417.
Thureson-Klein AK, Klein RL. 1990. Exocytosis from neuronal large dense-cored vesicles. Int
Rev Cytol 121:67-126. Torrealba F, Yanagisawa M, Saper CB. 2003. Colocalization of orexin a and glutamate
immunoreactivity in axon terminals in the tuberomammillary nucleus in rats. Neuroscience 119:1033-1044.
Trulson ME, Preussler DW. 1984. Dopamine-containing ventral tegmental area neurons in freely
moving cats: activity during the sleep-waking cycle and effects of stress. Exp Neurol 83:367-377.
109
Umbriaco D, Watkins KC, Descarries L, Cozzari C, Hartman BK. 1994. Ultrastructural and morphometric features of the acetylcholine innervation in adult rat parietal cortex: an electron microscopic study in serial sections. J Comp Neurol 348(3):351-373.
Ungerstedt U. 1971. Stereotaxic mapping of the monoamine pathways in the rat brain. Acta
Physiol Scand Suppl 367:1-48. Uramura K, Funahashi H, Muroya S, Shioda S, Takigawa M, Yada T. 2001. Orexin-a activates
phospholipase C- and protein kinase C-mediated Ca2+ signaling in dopamine neurons of the ventral tegmental area. Neuroreport 12:1885-1889.
Van Bockstaele EJ, Pickel VM. 1995. GABA-containing neurons in the ventral tegmental area
project to the nucleus accumbens in rat brain. Brain Res 682:215-221. van den Pol AN. 1999. Hypothalamic hypocretin (orexin): robust innervation of the spinal cord.
J Neurosci 19:3171-3182. van den Pol AN. 2003. Weighing the role of hypothalamic feeding neurotransmitters. Neuron
40:1059-1061. van den Pol AN, Gao XB, Obrietan K, Kilduff TS, Belousov AB. 1998. Presynaptic and
postsynaptic actions and modulation of neuroendocrine neurons by a new hypothalamic peptide, hypocretin/orexin. J Neurosci 18:7962-7971.
Veening JG, Swanson LW, Cowan WM, Nieuwenhuys R, Geeraedts LM. 1982. The medial
forebrain bundle of the rat. II. An autoradiographic study of the topography of the major descending and ascending components. J Comp Neurol 206(1):82-108.
Veznedaroglu E, Milner TA. 1992. Elimination of artifactual labeling of hippocampal mossy
fibers seen following pre-embedding immunogold-silver technique by pretreatment with zinc chelator. Microsc Res Tech 23:100-101.
Villalobos J, Ferssiwi A. 1987. The differential descending projections from the anterior, central
and posterior regions of the lateral hypothalamic area: an autoradiographic study. Neurosci Lett 81:95-99.
Vittoz NM, Berridge CW. 2006. Hypocretin/Orexin Selectively Increases Dopamine Efflux
within the Prefrontal Cortex: Involvement of the Ventral Tegmental Area. Neuropsychopharmacology 31(2):384-395.
Wang QP, Guan JL, Matsuoka T, Hirayana Y, Shioda S. 2003. Electron microscopic
examination of the orexin immunoreactivity in the dorsal raphe nucleus. Peptides 24:925-930.
110
Waselus M, Valentino RJ, Van Bockstaele EJ. 2005. Ultrastructural evidence for a role of gamma-aminobutyric acid in mediating the effects of corticotropin-releasing factor on the rat dorsal raphe serotonin system. J Comp Neurol 482(2):155-165.
White FJ. 1996. Synaptic regulation of mesocorticolimbic dopamine neurons. Annu Rev
Neurosci 19:405-436. Williams G, Bing C, Cai XJ, Harrold JA, King PJ, Liu XH. 2001. The hypothalamus and the
control of energy homeostasis: different circuits, different purposes. Physiol Behav 74(4-5):683-701.
Willie JT, Chemelli RM, Sinton CM, Yanagisawa M. 2001. To eat or to sleep? Orexin in the
regulation of feeding and wakefulness. Annu Rev Neurosci 24:429-458. Wise RA. 2005. Forebrain substrates of reward and motivation. J Comp Neurol 493(1):115-121. Wise RA. 2006. A new peptide input to learning and addiction. Neuron 49(4):483-484. Wise RA, Bozarth MA. 1984. Brain reward circuitry: four circuit elements "wired" in apparent
series. Brain Res Bull 12(2):203-208. Woods SC, Seeley RJ, Porte DJ, Schwartz MW. 1998. Signals that regulate food intake and
energy homeostasis. Science 280(5368):1378-1383. Woulfe J, Beaudet A. 1992. Neurotensin terminals form synapses primarily with neurons lacking
detectable tyrosine hydroxylase immunoreactivity in the rat substantia nigra and ventral tegmental area. J Comp Neurol 321(1):163-176.
Wouterlood FG, Groenewegen HJ. 1985. Neuroanatomical tracing by use of Phaseolus vulgaris-
leucoagglutinin (PHA-L): electron microscopy of PHA-L-filled neuronal somata, dendrites, axons and axon terminals. Brain Res 326(1):188-191.
Wu M, Zaborszky L, Hajszan T, van den Pol AN, Alreja M. 2004. Hypocretin/orexin innervation
and excitation of identified septohippocampal cholinergic neurons. J Neurosci 24:3527-3536.
Wu MF, Gulyani SA, Yau E, Mignot E, Phan B, Siegel JM. 1999. Locus coeruleus neurons:
cessation of activity during cataplexy. Neuroscience 91(4):1389-1399. Yamaguchi T, Sheen W, Morales M. 2007. Glutamatergic neurons are present in the rat ventral
tegmental area. Eur J Neurosci 25:106-118. Yamanaka A, Tsujino N, Funahashi H, Honda K, Guan JL, Wang QP, Tominaga M, Goto K,
Shioda S, Sakurai T. 2002. Orexin activates histaminergic neurons via the orexin 2 receptor. Biochem Biophys Res Comm 290:1237–1245.
111

112
Yeomans J, Baptista M. 1997. Both nicotinic and muscarinic receptors in ventral tegmental area contribute to brain-stimulation reward. Pharmacol Biochem Behav 57(4):915-921.
Yeomans JS. 1979. The absolute refractory periods of self-stimulation neurons. Physiol Behav
22(5):911-919. Yeomans JS. 1989. Two substrates for medial forebrain bundle self-stimulation: myelinated
axons and dopamine axons. Neuroscience & Biobehavioral Reviews 13(2-3):91-98. Yeomans JS, Maidment NT, Bunney BS. 1988. Excitability properties of medial forebrain
bundle axons of A9 and A10 dopamine cells. Brain Res 450(1-2):86-93. Yoshida K, McCormack S, Espana RA, Crocker A, Scammell TE. 2006. Afferents to the orexin
neurons of the rat brain. J Comp Neurol 494(5):845-861. You ZB, Chen YQ, Wise RA. 2001. Dopamine and glutamate release in the nucleus accumbens
and ventral tegmental area of rat following lateral hypothalamic self-stimulation. Neuroscience 107(4):629-639.
Zahm DS, Grosu S, Williams EA, Qin S, Berod A. 2001. Neurons of origin of the
neurotensinergic plexus enmeshing the ventral tegmental area in rat: retrograde labeling and in situ hybridization combined. Neuroscience 104:841-851.
Zheng H, Patterson LM, Berthoud HR. 2005. Orexin-A projections to the caudal medulla and
orexin-induced c-Fos expression, food intake, and autonomic function. J Comp Neurol 485:127-142.
Ziegler DR, Cullinan WE, Herman JP. 2002. Distribution of vesicular glutamate transporter
mRNA in rat hypothalamus. J Comp Neurol 448:217-229.


