

1
Stirling’s
Local Housing Strategy2012
Stirling’s LHS Area Profiles 2011
October 2011
Stirling Council’s Local Housing StrategyLHS Area Profiles 2011
i
Stirling’s LHS Area Profiles 20111
Introduction
The main source of information on housing needs in the Stirling Council area is Stirling’s Housing Need & Demand Assessment (HNDA) 2011.2 The HNDA provides housing needs data for the Stirling Council area and for the three sub areas of Stirling Urban, Stirling Rural and National Park. While this type of detailed analysis is not possible at a small area level, it was considered important to have some data available at a more localised level in order to assist discussion about local housing needs, particularly in relation to the development of housing sites across the Council area.
The LHS Area Profiles 2011 focus on 29 areas and draw on a range of data sets.
The LHS Areas
The 29 Areas are based on amalgamations of the 110 datazones in the Stirling Council area. Consultation on the boundaries of these areas was undertaken both within the Council and with partners in Stirling’s Housing Market Partnership. Datazone boundaries do not always follow convenient natural boundaries like settlement boundaries. Consequently the linking of datazones to the 29 areas has to be seen as a ‘best fit’.
Of the 29 LHS Areas:-
12 are within the Stirling Core and include each of the Eastern Villages, Cambusbarron, Bridge of Allan, Dunblane. Stirling itself is subdivided into 6 areas
10 are within Stirling Rural; of these 7 are distinct settlements and three are groups of 2 or 3 villages or areas (datazone boundaries can sometimes divide a settlements in two)
7 are within the National Park; of these 2 are distinct settlements and 5 are groups of 2 or 3 settlements or areas.
The Data Sets
The Area Profiles draw on information from a number of data sources which are available at datazone level or at other levels. Where not available at datazone level, a ‘best fit’ has been sought in order to match the information to the 29 areas – this has not always been easy. Some of the data is relatively recent but some dates back to the 2001 Census. For all these reasons, in some instances these data deficiencies and area irregularities may lead to apparent inconsistencies in the data. The information provided here, therefore, should be used as a general indication for each community rather than a precise description.
In order to keep the project manageable, a number of potential data sets were excluded (eg housing sites, RSL housing stock and RSL waiting list data). Hopefully when the exercise is repeated, these and other datasets can be included. It is planned to provide an updated set of Area Profiles once all the appropriate 2011 Census data become available in 2013.
1 These Area Profiles were put together by Steve Mason in Housing, Paul Davison in Chief Executive’s and Claire Milne in Planning. Additional data analysis was undertaken by Andrew Walker, Gregor Wightman & Linda Langdon in Housing.2 http://www.stirling.gov.uk/__documents/temporary-uploads/housing-_and_-customer-service/stirlings-hnda-19july2011v2.pdf
Stirling Council’s Local Housing StrategyLHS Area Profiles 2011
ii
The Area Profile data provided (with sources)
A. Socio-demographics
Estimated population (2009 Mid-year estimate - MYE)
Age structure (%) (2009 MYE)
Benefit recipients (% of working age) (DWP 2010)
Tenure of all residents (%) (2001 Census) – With the growth of the private rented sector these figures will have changed considerably since 2001.
Vacant & second homes (No) (GROS 2009)
B. Council housing stock (Stirling Council Data 31.03.11)
House types (%) and house sizes (%)
Changes to council housing stock (No)
Original housing stock(No) and sales to sitting tenants (No)
Demolitions and acquisitions/new build since 1996/7 (No)
Remaining stock (No) and (%)
C. Analysis of Stirling Council’s housing waiting list (Stirling Council Data 2011)
This was a special, one-off analysis undertaken in 2011 via the new Northgate system. It is based on the new Council waiting list data but does not include RSL waiting list data.
Applicants (No)3 : This includes a breakdown between registration applicants and transfer applicants.
Age of main applicant (%)
Applicants - Current tenure (%)
Applicants - Size of house required (%)
Applicants with medical priority (No)
Pressured area status ratio 2009 (Ratio = waiting list : houses allocated).
D. All planning applications received 2001 – 2010 for Stirling Core & Stirling Rural (Stirling Council Data 2011). No similar information has been provided for the National Park
House sizes by number of bedspaces
Flat sizes by number of bedspaces
3 NB Housing applicants can apply for any number of the 56 allocation areas in the Stirling Council area; they could indeed apply for all 56. Using these total figures would provide a hugely overstated reflection of housing needs particularly in the most popular areas. The figure shown is the number of people who identify the area as their preferred choice and/or live in the area and/or have a ‘social inclusion/ community reason for moving’ to the area.
Stirling Council’s Local Housing StrategyLHS Area Profiles 2011
iii
The 29 LHS Areas
Stirling Core Page No
1 Bannockburn & Hillpark 1
2 Braehead, St Ninians, Broomridge & Torbrex 2
3 Bridge of Allan 3
4 Cambusbarron 4
5 Cornton regeneration area 5
6 Cowie 6
7 Cultenhove regeneration area 7
8 Dunblane 8
9 Fallin & Throsk 9
10 Plean 10
11 Raploch regeneration area 11
12 Town Centre 12
Stirling Rural
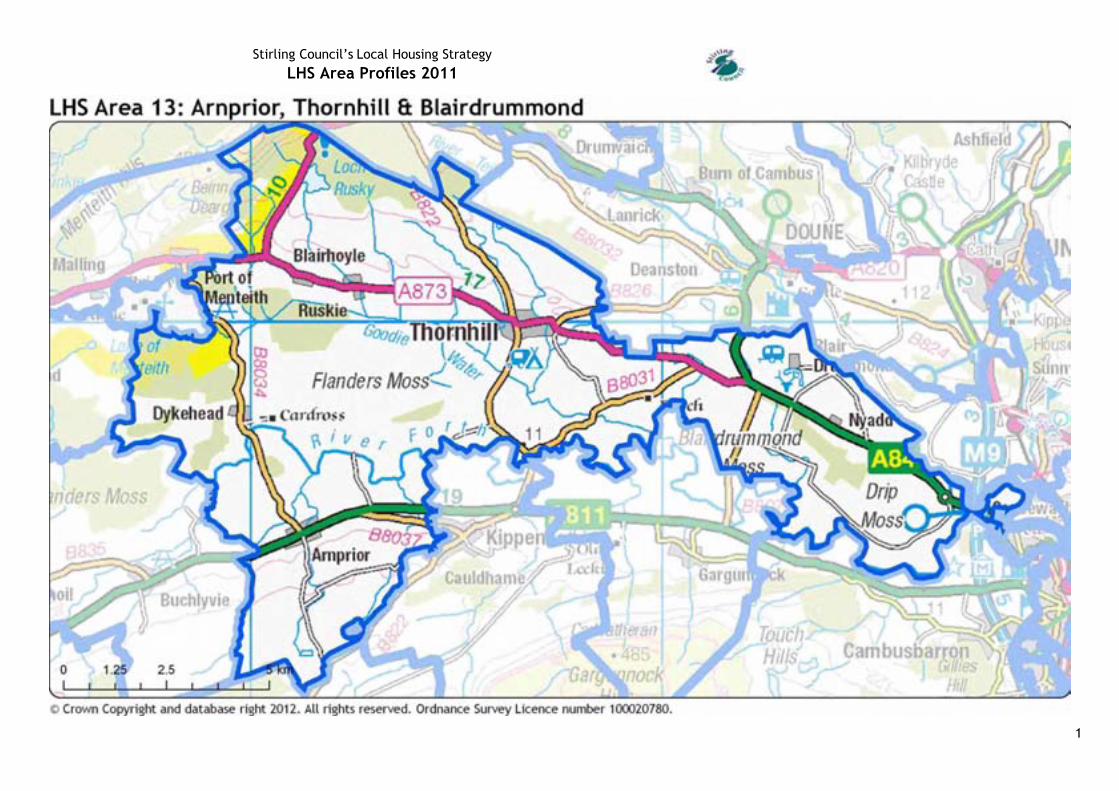
13 Arnprior, Thornhill & Blairdrummond 13
14 Balfron 14
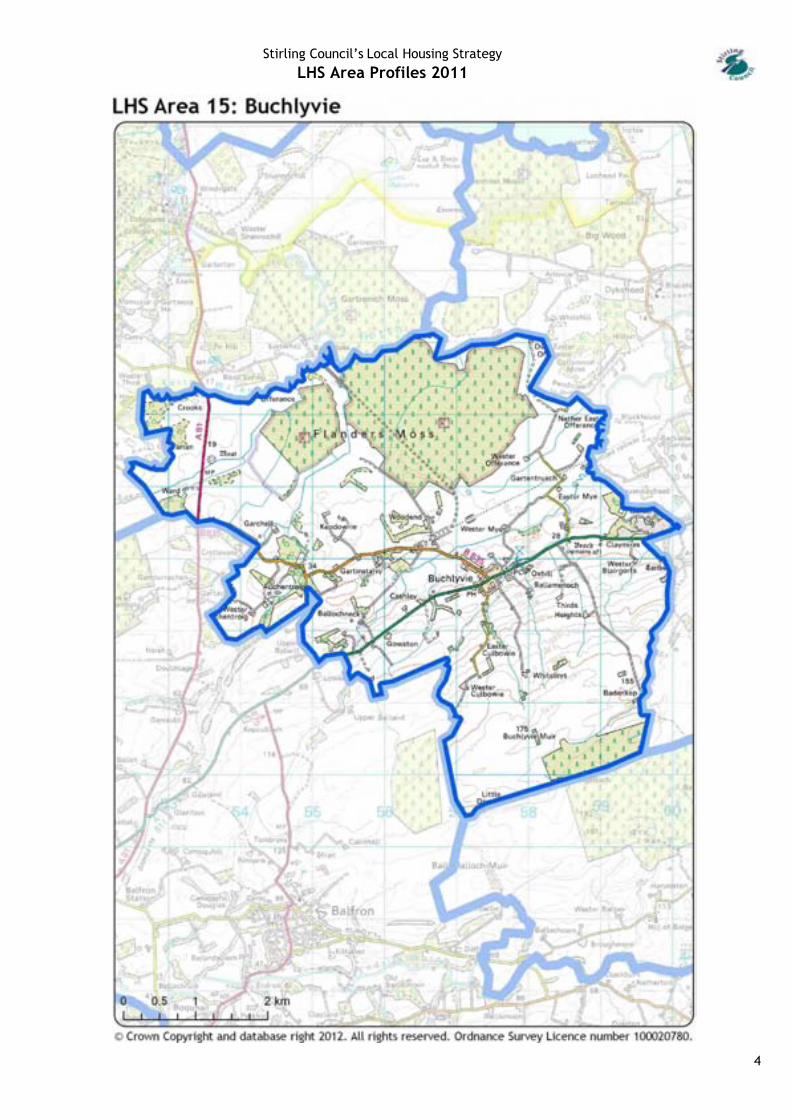
15 Buchlyvie 15
16 Doune & Deanston 16
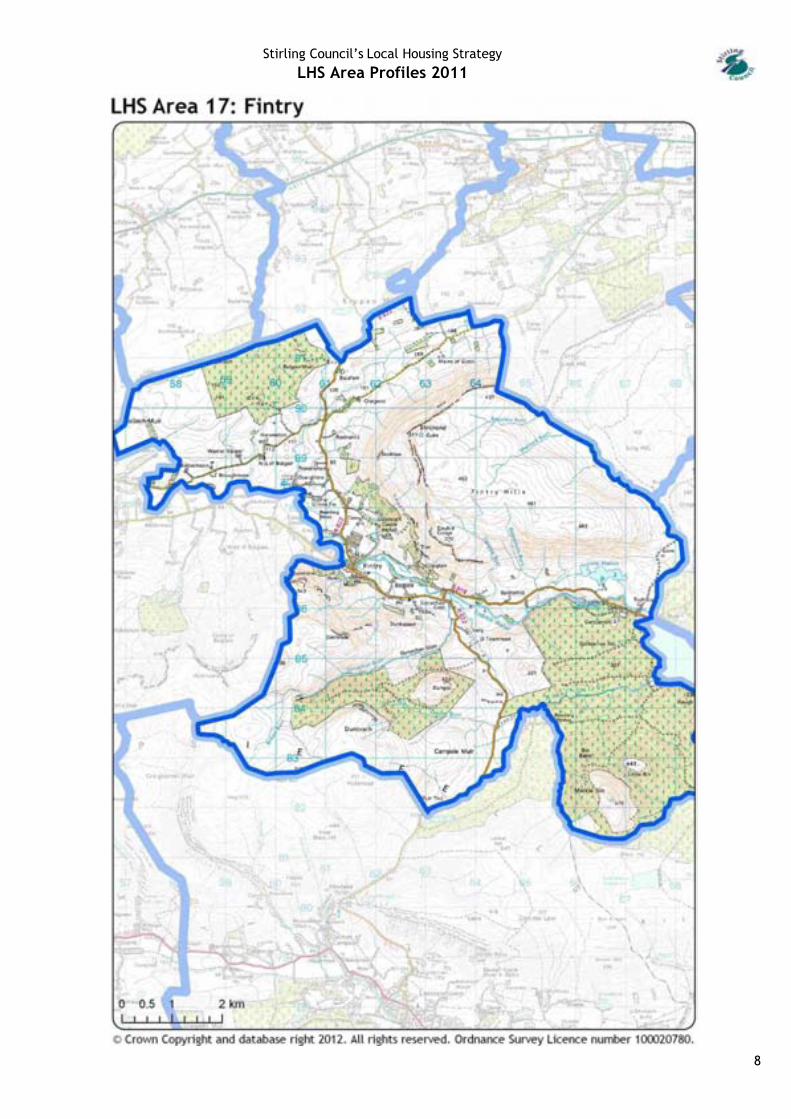
17 Fintry 17
18 Gargunnock 18
19 Killearn 19
20 Killin & Ardeonaig 20
21 Kippen 21
22 Strathblane 22
National Park
23 Aberfoyle & Port of Menteith 23
24 Callander 24
25 Crianlarich & Tyndrum 25
26 Drymen, Croftamie & Balmaha 26
27 Gartmore 27
28 Lochearnhead & Balquhidder 28
29 Strathyre & Trossachs 29

Stirling Council’s Local Housing StrategyLHS Area Profiles 2011
1
Area 1 Stirling Core Bannockburn/ Hillpark
A. Socio-demographics
Age structure 2009 MYE Benefit recipients (% of working age) DWP 2010Estimated population2009 MYE
0-15 16-64 65+ All out of work benefits
Job-seekers’ allowance
7586 20 % 65 % 15 % 14 % 5 %
Tenure of all residents (%) 2001 Census Vacant & second homes (No) GROS 2009Owner Occupier Private Rented Social Rented Vacant Second homes
64 % 3 % 33 % 44 8
B. Council housing stock (Stirling Council 2011)
House types (%) House sizes (%)Flat in Close /Maisonette
Own Door Flat
Terraced house
Detached or Semi D House
Bungalow 1 or 2 apartment
3 apartment
4+ apartment
17 % 7 % 48 % 25 % 4 % 15 % 39 % 46 %
Changes to council housing stock Original council housing stock
Sales to sitting tenants
Demolitionssince 1996/7
Acquisitions/New build since 1996/7
Remaining stock(No)
Remaining stock(%)
1351 825 0 7 533 39%
C. Analysis of Stirling Council’s housing waiting list NB excludes RSL waiting list data (Stirling Council 2011)
Applicants 4 (No) Age of main applicant (%)Total
ApplicantsSingle
ApplicantsTransfer
ApplicantsRegistrationApplicants 16-29 30-44 45-64 65+
257 107 20 % 80 % 30 % 30 % 25 % 15 %
Applicants - Current tenure (%) Applicants - Size of house required (%)Council
RSLPrivate rented
Owner Occupier
FamilyFriends
Other Bedsit 1 Bed 2 Bed 3 Bed 4 Bed
8 % 21 % 20 % 38 % 13 % 29 % 29 % 24 % 14 % 2 %
Applicants with medical priority (Number)
Pressured Area Status by allocations areas (Ratio = Waiting List : Houses Allocated)
A+ A B C Total Bannockburn Hillpark/Firs
0 17 7 18 43 20:1 5:1
D. All Approved Planning Applications 2001-2010 (Stirling Council Data 2011)
House 1 bed
House 2 bed
House 3 bed
House 4+ bed
Total Houses
Flat1 bed
Flat2 bed
Flat3 bed
Flat4+ bed
TotalFlats
0 % 22 % 14 % 64 % 92 4 % 85 % 11 % 0 % 27
4 This is the number of applicants who identify this area as their preferred choice and/or live in the area and/or have a ‘social inclusion/ community reason for moving’ to the area. Because applicants can apply for any number of the 56 allocation areas in the Stirling Council area, a larger number of applicants will have included this area amongst their multiple choices.

Stirling Council’s Local Housing StrategyLHS Area Profiles 2011
2
Stirling Council’s Local Housing StrategyLHS Area Profiles 2011
3
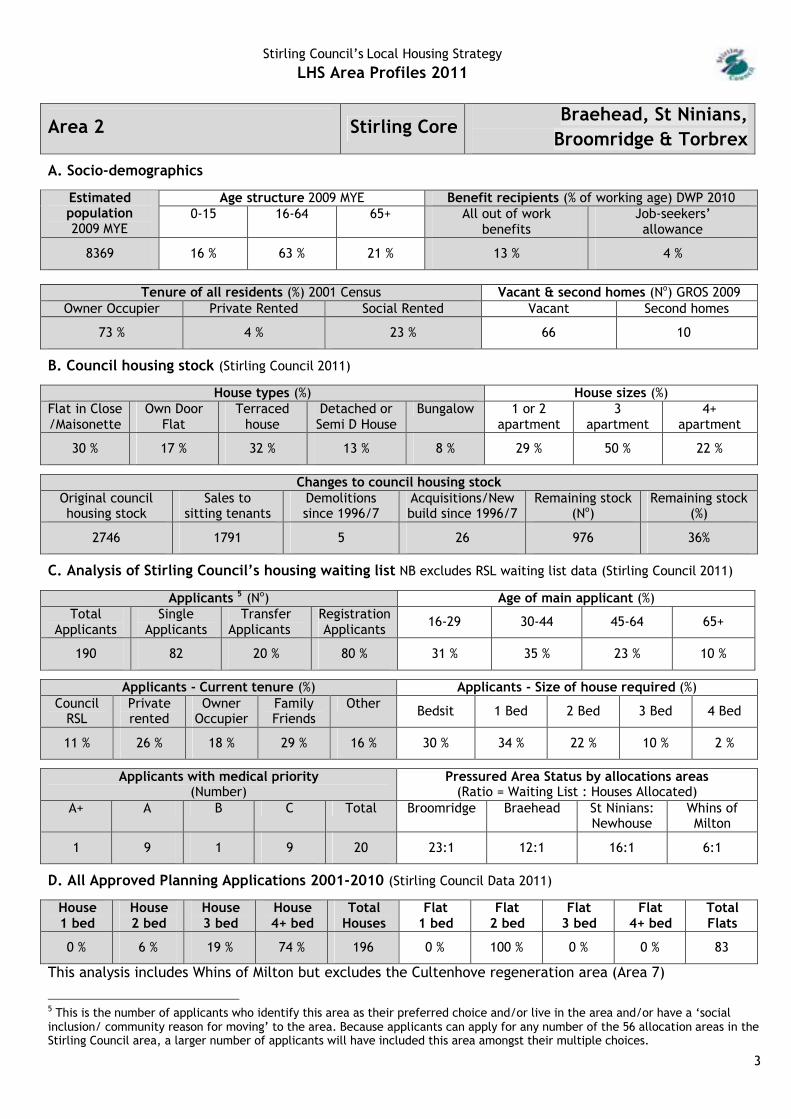
Area 2 Stirling CoreBraehead, St Ninians,
Broomridge & Torbrex
A. Socio-demographics
Age structure 2009 MYE Benefit recipients (% of working age) DWP 2010Estimated population2009 MYE
0-15 16-64 65+ All out of work benefits
Job-seekers’ allowance
8369 16 % 63 % 21 % 13 % 4 %
Tenure of all residents (%) 2001 Census Vacant & second homes (No) GROS 2009Owner Occupier Private Rented Social Rented Vacant Second homes
73 % 4 % 23 % 66 10
B. Council housing stock (Stirling Council 2011)
House types (%) House sizes (%)Flat in Close /Maisonette
Own Door Flat
Terraced house
Detached or Semi D House
Bungalow 1 or 2 apartment
3 apartment
4+ apartment
30 % 17 % 32 % 13 % 8 % 29 % 50 % 22 %
Changes to council housing stock Original council housing stock
Sales to sitting tenants
Demolitionssince 1996/7
Acquisitions/New build since 1996/7
Remaining stock(No)
Remaining stock(%)
2746 1791 5 26 976 36%
C. Analysis of Stirling Council’s housing waiting list NB excludes RSL waiting list data (Stirling Council 2011)
Applicants 5 (No) Age of main applicant (%)Total
ApplicantsSingle
ApplicantsTransfer
ApplicantsRegistrationApplicants 16-29 30-44 45-64 65+
190 82 20 % 80 % 31 % 35 % 23 % 10 %
Applicants - Current tenure (%) Applicants - Size of house required (%)Council
RSLPrivate rented
Owner Occupier
FamilyFriends
Other Bedsit 1 Bed 2 Bed 3 Bed 4 Bed
11 % 26 % 18 % 29 % 16 % 30 % 34 % 22 % 10 % 2 %
Applicants with medical priority (Number)
Pressured Area Status by allocations areas (Ratio = Waiting List : Houses Allocated)
A+ A B C Total Broomridge Braehead St Ninians: Newhouse
Whins of Milton
1 9 1 9 20 23:1 12:1 16:1 6:1
D. All Approved Planning Applications 2001-2010 (Stirling Council Data 2011)
House 1 bed
House 2 bed
House 3 bed
House 4+ bed
Total Houses
Flat1 bed
Flat2 bed
Flat3 bed
Flat4+ bed
TotalFlats
0 % 6 % 19 % 74 % 196 0 % 100 % 0 % 0 % 83
This analysis includes Whins of Milton but excludes the Cultenhove regeneration area (Area 7)
5 This is the number of applicants who identify this area as their preferred choice and/or live in the area and/or have a ‘social inclusion/ community reason for moving’ to the area. Because applicants can apply for any number of the 56 allocation areas in the Stirling Council area, a larger number of applicants will have included this area amongst their multiple choices.

Stirling Council’s Local Housing StrategyLHS Area Profiles 2011
1

Stirling Council’s Local Housing StrategyLHS Area Profiles 2011
1
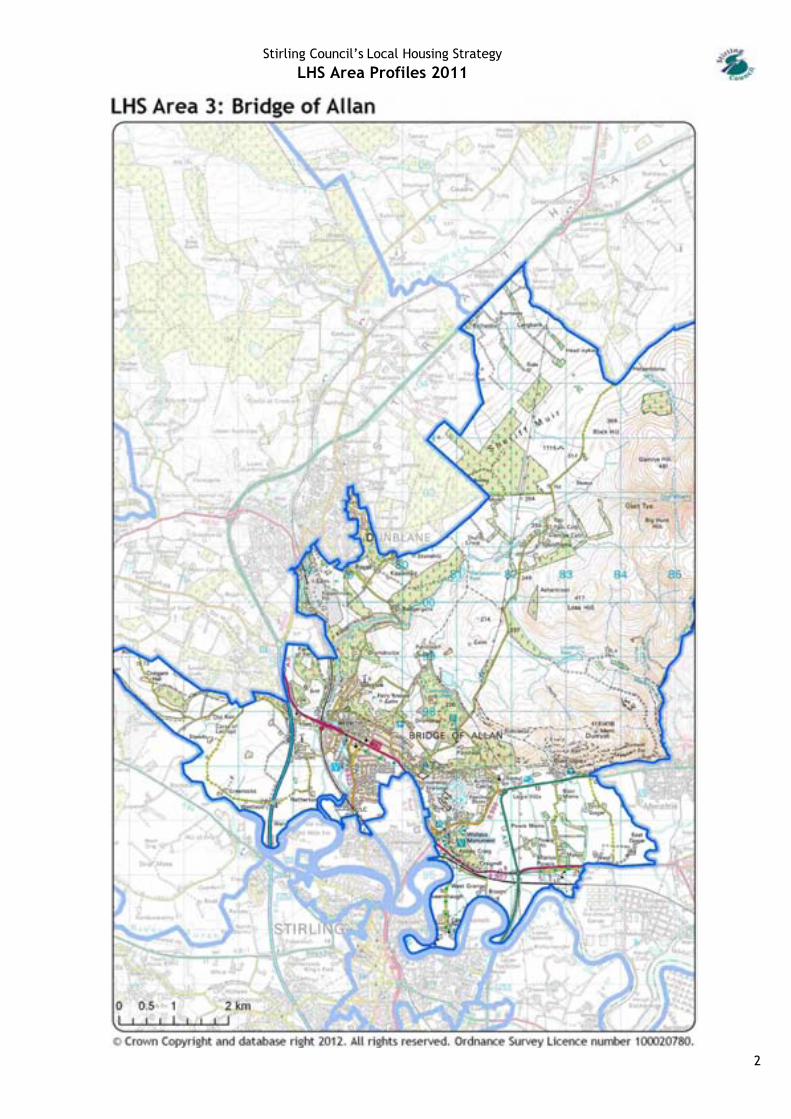
Area 3 Stirling Core Bridge of Allan
A. Socio-demographics
Age structure 2009 MYE Benefit recipients (% of working age) DWP 2010Estimated population2009 MYE
0-15 16-64 65+ All out of work benefits
Job-seekers’ allowance
9254 14 % 69 % 17 % 4 % 1 %
Tenure of all residents (%) 2001 Census (‘Other’ = 5%) Vacant & second homes (No) GROS 2009Owner Occupier Private Rented Social Rented Vacant Second homes
72 % 11 % 12 % 86 40
B. Council housing stock (Stirling Council 2011)
House types (%) House sizes (%)Flat in Close /Maisonette
Own Door Flat
Terraced house
Detached or Semi D House
Bungalow 1 or 2 apartment
3 apartment
4+ apartment
31 % 11 % 29 % 13 % 17 % 29 % 42 % 29 %
Changes to council housing stock Original council housing stock
Sales to sitting tenants
Demolitionssince 1996/7
Acquisitions/New build since 1996/7
Remaining stock(No)
Remaining stock(%)
458 320 0 2 140 31 %
C. Analysis of Stirling Council’s housing waiting list NB excludes RSL waiting list data (Stirling Council 2011)
Applicants 6 (No) Age of main applicant (%)Total
ApplicantsSingle
ApplicantsTransfer
ApplicantsRegistrationApplicants 16-29 30-44 45-64 65+
104 50 13 % 87 % 21 % 32 % 30 % 16 %
Applicants - Current tenure (%) Applicants - Size of house required (%)Council
RSLPrivate rented
Owner Occupier
FamilyFriends
Other Bedsit 1 Bed 2 Bed 3 Bed 4 Bed
10 % 39 % 15 % 26 % 9 % 20 % 30 % 28 % 15 % 6 %
Applicants with medical priority (Number)
Pressured Area Status by allocations areas (Ratio = Waiting List : Houses Allocated)
A+ A B C Total Bridge of Allan Causewayhead/Logie
0 4 4 6 14 44:1 51:1
D. All Approved Planning Applications 2001-2010 (Stirling Council Data 2011)
House 1 bed
House 2 bed
House 3 bed
House 4+ bed
Total Houses
Flat1 bed
Flat2 bed
Flat3 bed
Flat4+ bed
TotalFlats
0 % 31 % 17 % 53 % 36 8 % 76 % 16 % 0 % 92
6 This is the number of applicants who identify this area as their preferred choice and/or live in the area and/or have a ‘social inclusion/ community reason for moving’ to the area. Because applicants can apply for any number of the 56 allocation areas in the Stirling Council area, a larger number of applicants will have included this area amongst their multiple choices.
Stirling Council’s Local Housing StrategyLHS Area Profiles 2011
2
Stirling Council’s Local Housing StrategyLHS Area Profiles 2011
3
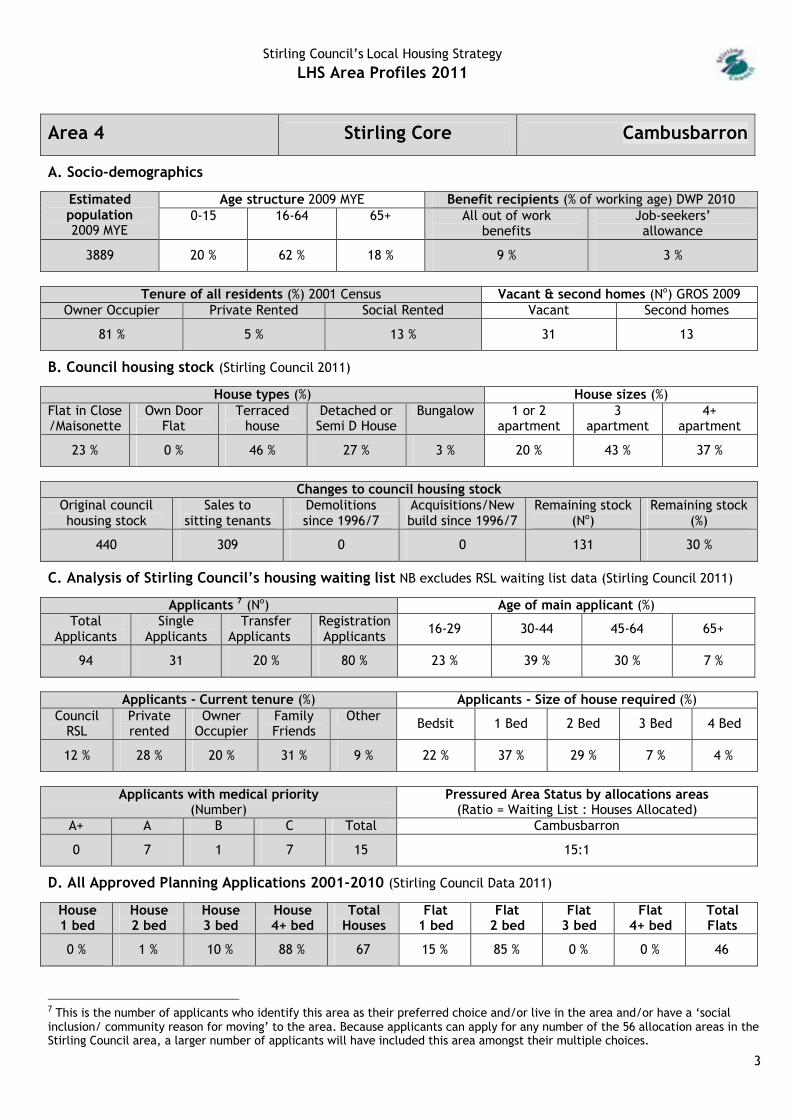
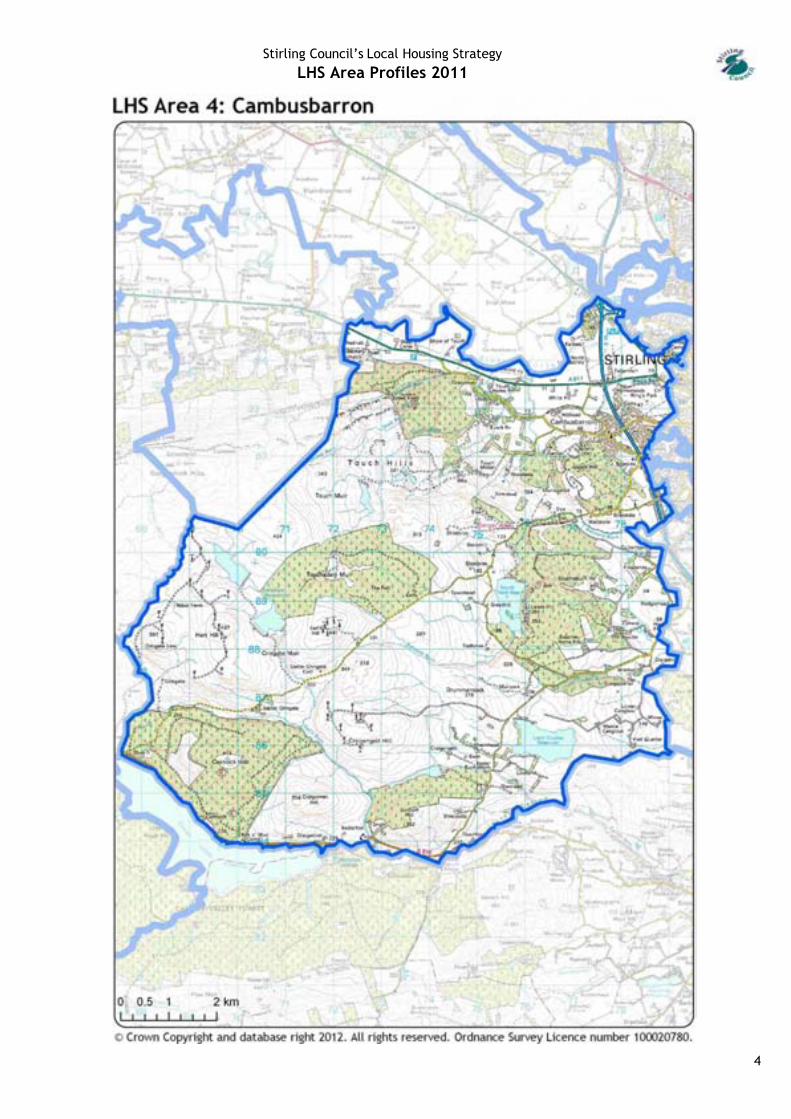
Area 4 Stirling Core Cambusbarron
A. Socio-demographics
Age structure 2009 MYE Benefit recipients (% of working age) DWP 2010Estimated population2009 MYE
0-15 16-64 65+ All out of work benefits
Job-seekers’ allowance
3889 20 % 62 % 18 % 9 % 3 %
Tenure of all residents (%) 2001 Census Vacant & second homes (No) GROS 2009Owner Occupier Private Rented Social Rented Vacant Second homes
81 % 5 % 13 % 31 13
B. Council housing stock (Stirling Council 2011)
House types (%) House sizes (%)Flat in Close /Maisonette
Own Door Flat
Terraced house
Detached or Semi D House
Bungalow 1 or 2 apartment
3 apartment
4+ apartment
23 % 0 % 46 % 27 % 3 % 20 % 43 % 37 %
Changes to council housing stock Original councilhousing stock
Sales to sitting tenants
Demolitionssince 1996/7
Acquisitions/New build since 1996/7
Remaining stock(No)
Remaining stock(%)
440 309 0 0 131 30 %
C. Analysis of Stirling Council’s housing waiting list NB excludes RSL waiting list data (Stirling Council 2011)
Applicants 7 (No) Age of main applicant (%)Total
ApplicantsSingle
ApplicantsTransfer
ApplicantsRegistrationApplicants 16-29 30-44 45-64 65+
94 31 20 % 80 % 23 % 39 % 30 % 7 %
Applicants - Current tenure (%) Applicants - Size of house required (%)Council
RSLPrivate rented
Owner Occupier
FamilyFriends
Other Bedsit 1 Bed 2 Bed 3 Bed 4 Bed
12 % 28 % 20 % 31 % 9 % 22 % 37 % 29 % 7 % 4 %
Applicants with medical priority (Number)
Pressured Area Status by allocations areas(Ratio = Waiting List : Houses Allocated)
A+ A B C Total Cambusbarron
0 7 1 7 15 15:1
D. All Approved Planning Applications 2001-2010 (Stirling Council Data 2011)
House 1 bed
House 2 bed
House 3 bed
House 4+ bed
Total Houses
Flat1 bed
Flat2 bed
Flat3 bed
Flat4+ bed
TotalFlats
0 % 1 % 10 % 88 % 67 15 % 85 % 0 % 0 % 46
7 This is the number of applicants who identify this area as their preferred choice and/or live in the area and/or have a ‘social inclusion/ community reason for moving’ to the area. Because applicants can apply for any number of the 56 allocation areas in the Stirling Council area, a larger number of applicants will have included this area amongst their multiple choices.
Stirling Council’s Local Housing StrategyLHS Area Profiles 2011
4
Stirling Council’s Local Housing StrategyLHS Area Profiles 2011
5
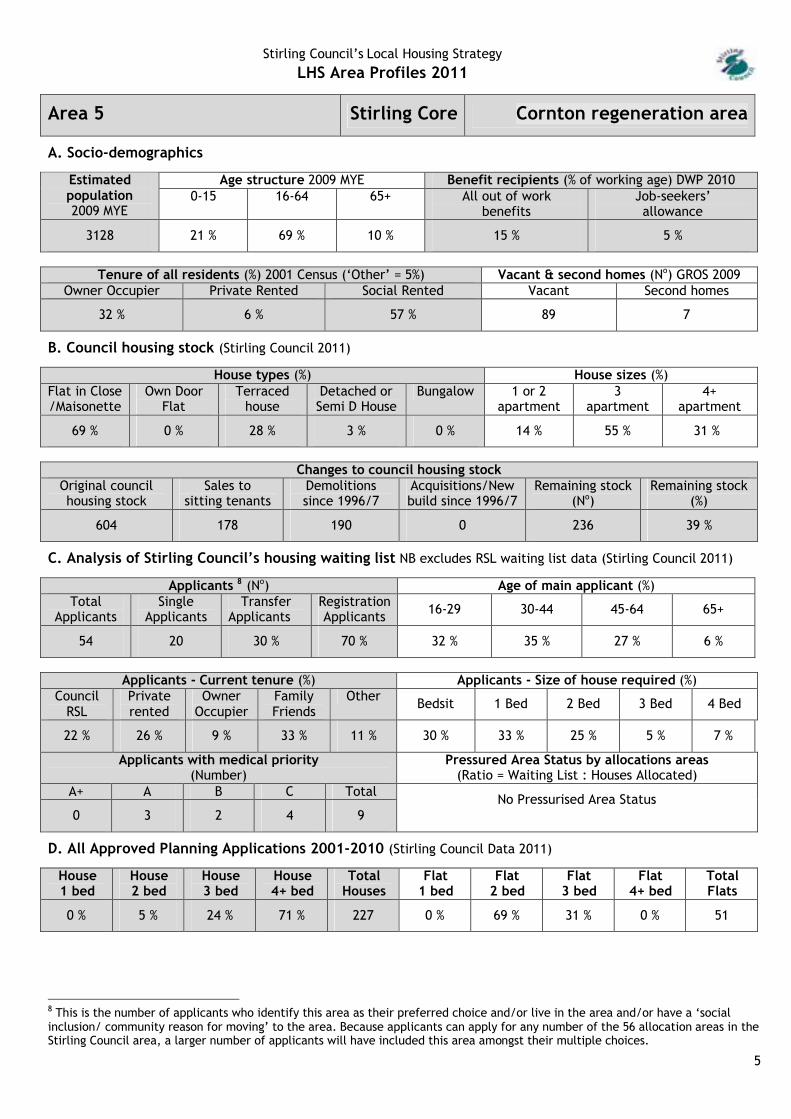
Area 5 Stirling Core Cornton regeneration area
A. Socio-demographics
Age structure 2009 MYE Benefit recipients (% of working age) DWP 2010Estimated population2009 MYE
0-15 16-64 65+ All out of work benefits
Job-seekers’ allowance
3128 21 % 69 % 10 % 15 % 5 %
Tenure of all residents (%) 2001 Census (‘Other’ = 5%) Vacant & second homes (No) GROS 2009Owner Occupier Private Rented Social Rented Vacant Second homes
32 % 6 % 57 % 89 7
B. Council housing stock (Stirling Council 2011)
House types (%) House sizes (%)Flat in Close /Maisonette
Own Door Flat
Terraced house
Detached or Semi D House
Bungalow 1 or 2 apartment
3 apartment
4+ apartment
69 % 0 % 28 % 3 % 0 % 14 % 55 % 31 %
Changes to council housing stock Original council housing stock
Sales to sitting tenants
Demolitionssince 1996/7
Acquisitions/New build since 1996/7
Remaining stock(No)
Remaining stock(%)
604 178 190 0 236 39 %
C. Analysis of Stirling Council’s housing waiting list NB excludes RSL waiting list data (Stirling Council 2011)
Applicants 8 (No) Age of main applicant (%)Total
ApplicantsSingle
ApplicantsTransfer
ApplicantsRegistrationApplicants 16-29 30-44 45-64 65+
54 20 30 % 70 % 32 % 35 % 27 % 6 %
Applicants - Current tenure (%) Applicants - Size of house required (%)Council
RSLPrivate rented
Owner Occupier
FamilyFriends
Other Bedsit 1 Bed 2 Bed 3 Bed 4 Bed
22 % 26 % 9 % 33 % 11 % 30 % 33 % 25 % 5 % 7 %
Applicants with medical priority (Number)
Pressured Area Status by allocations areas (Ratio = Waiting List : Houses Allocated)
A+ A B C Total
0 3 2 4 9No Pressurised Area Status
D. All Approved Planning Applications 2001-2010 (Stirling Council Data 2011)
House 1 bed
House 2 bed
House 3 bed
House 4+ bed
Total Houses
Flat1 bed
Flat2 bed
Flat3 bed
Flat4+ bed
TotalFlats
0 % 5 % 24 % 71 % 227 0 % 69 % 31 % 0 % 51
8 This is the number of applicants who identify this area as their preferred choice and/or live in the area and/or have a ‘social inclusion/ community reason for moving’ to the area. Because applicants can apply for any number of the 56 allocation areas in the Stirling Council area, a larger number of applicants will have included this area amongst their multiple choices.

Stirling Council’s Local Housing StrategyLHS Area Profiles 2011
6
Stirling Council’s Local Housing StrategyLHS Area Profiles 2011
7
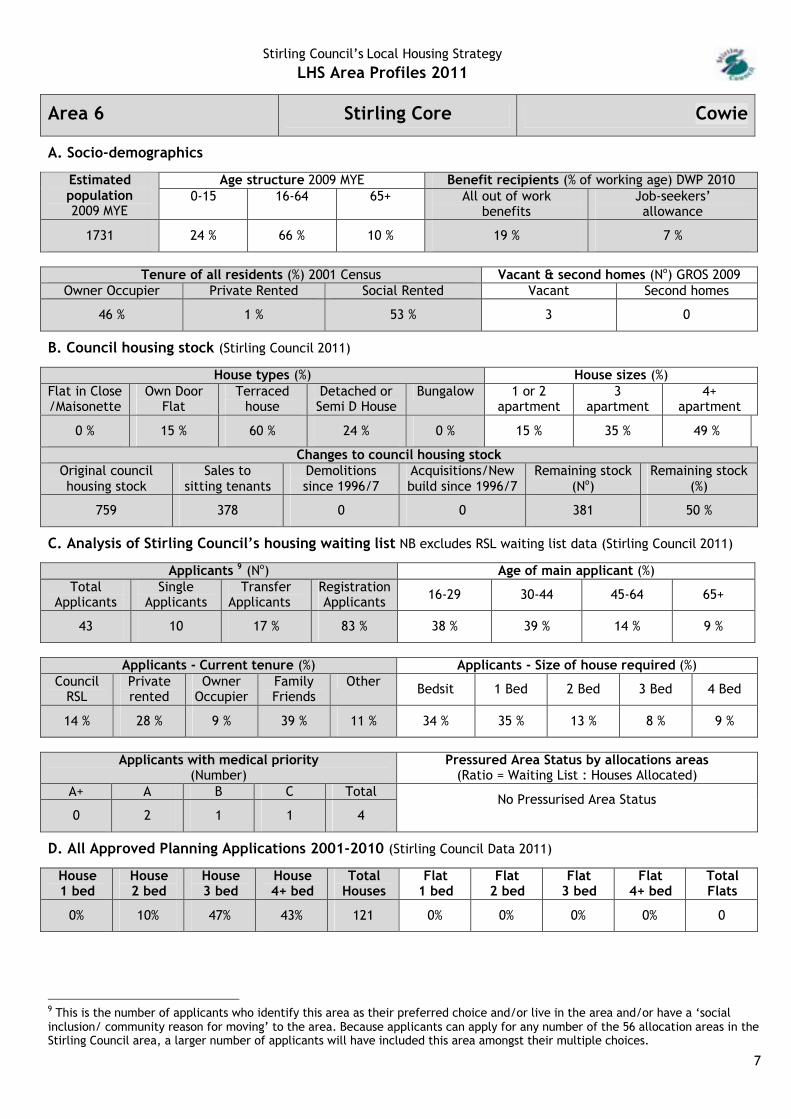
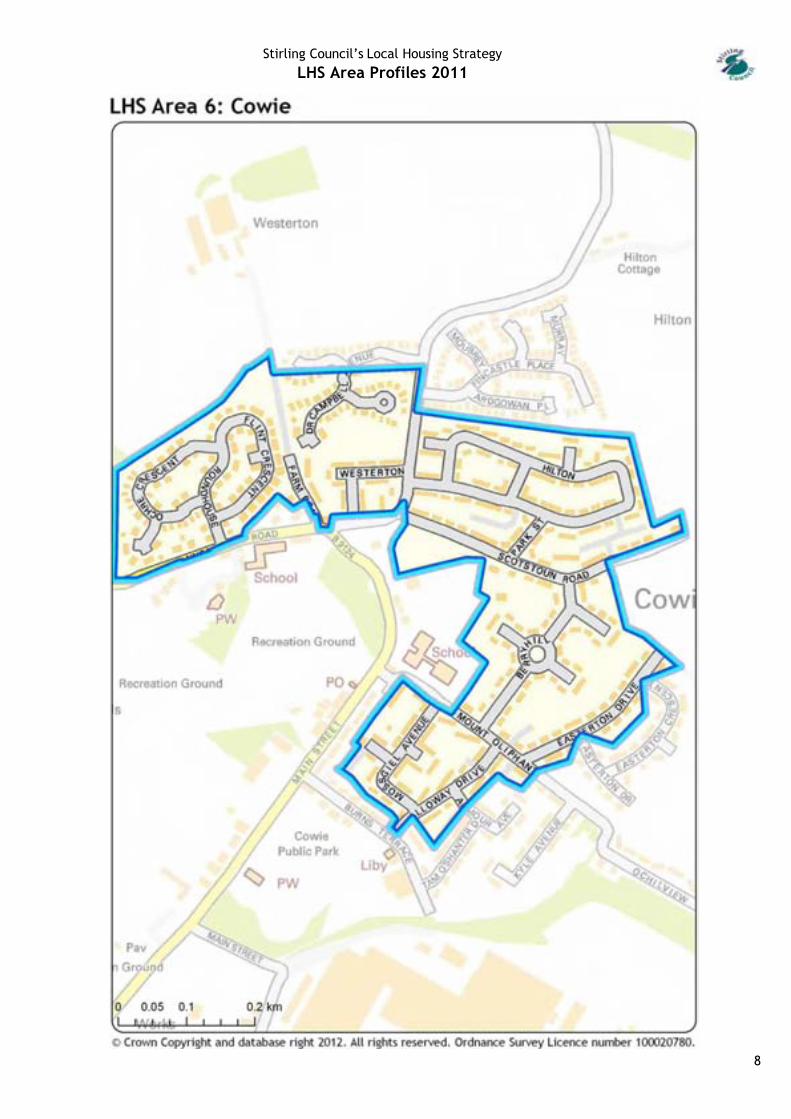
Area 6 Stirling Core Cowie
A. Socio-demographics
Age structure 2009 MYE Benefit recipients (% of working age) DWP 2010Estimated population2009 MYE
0-15 16-64 65+ All out of work benefits
Job-seekers’ allowance
1731 24 % 66 % 10 % 19 % 7 %
Tenure of all residents (%) 2001 Census Vacant & second homes (No) GROS 2009Owner Occupier Private Rented Social Rented Vacant Second homes
46 % 1 % 53 % 3 0
B. Council housing stock (Stirling Council 2011)
House types (%) House sizes (%)Flat in Close /Maisonette
Own Door Flat
Terraced house
Detached or Semi D House
Bungalow 1 or 2 apartment
3 apartment
4+ apartment
0 % 15 % 60 % 24 % 0 % 15 % 35 % 49 %
Changes to council housing stock Original council housing stock
Sales to sitting tenants
Demolitionssince 1996/7
Acquisitions/New build since 1996/7
Remaining stock(No)
Remaining stock(%)
759 378 0 0 381 50 %
C. Analysis of Stirling Council’s housing waiting list NB excludes RSL waiting list data (Stirling Council 2011)
Applicants 9 (No) Age of main applicant (%)Total
ApplicantsSingle
ApplicantsTransfer
ApplicantsRegistrationApplicants 16-29 30-44 45-64 65+
43 10 17 % 83 % 38 % 39 % 14 % 9 %
Applicants - Current tenure (%) Applicants - Size of house required (%)Council
RSLPrivate rented
Owner Occupier
FamilyFriends
Other Bedsit 1 Bed 2 Bed 3 Bed 4 Bed
14 % 28 % 9 % 39 % 11 % 34 % 35 % 13 % 8 % 9 %
Applicants with medical priority (Number)
Pressured Area Status by allocations areas (Ratio = Waiting List : Houses Allocated)
A+ A B C Total
0 2 1 1 4No Pressurised Area Status
D. All Approved Planning Applications 2001-2010 (Stirling Council Data 2011)
House 1 bed
House 2 bed
House 3 bed
House 4+ bed
Total Houses
Flat1 bed
Flat2 bed
Flat3 bed
Flat4+ bed
TotalFlats
0% 10% 47% 43% 121 0% 0% 0% 0% 0
9 This is the number of applicants who identify this area as their preferred choice and/or live in the area and/or have a ‘social inclusion/ community reason for moving’ to the area. Because applicants can apply for any number of the 56 allocation areas in the Stirling Council area, a larger number of applicants will have included this area amongst their multiple choices.
Stirling Council’s Local Housing StrategyLHS Area Profiles 2011
8

Stirling Council’s Local Housing StrategyLHS Area Profiles 2011
9
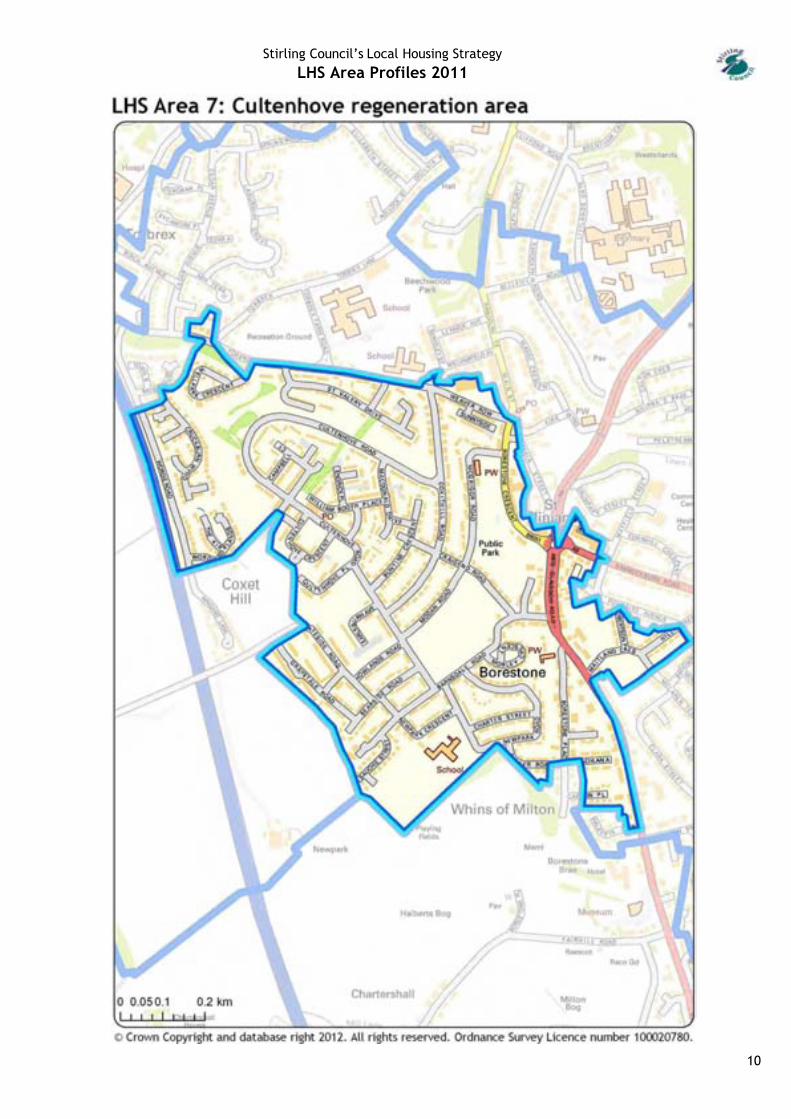
Area 7 Stirling Core Cultenhove regeneration area
A. Socio-demographics
Age structure 2009 MYE Benefit recipients (% of working age) DWP 2010Estimated population2009 MYE
0-15 16-64 65+ All out of work benefits
Job-seekers’ allowance
3307 19 % 63 % 18 % 21 % 6 %
Tenure of all residents (%) 2001 Census Vacant & second homes (No) GROS 2009Owner Occupier Private Rented Social Rented Vacant Second homes
49 % 2 % 48 % 216 7
B. Council housing stock (Stirling Council 2011)
House types (%) House sizes (%)Flat in Close /Maisonette
Own Door Flat
Terraced house
Detached or Semi D House
Bungalow 1 or 2 apartment
3 apartment
4+ apartment
50 % 10 % 20 % 16 % 4 % 21 % 39 % 40 %
Changes to council housing stock Original council housing stock
Sales to sitting tenants
Demolitionssince 1996/7
Acquisitions/New build since 1996/7
Remaining stock(No)
Remaining stock(%)
823 223 371 0 229 28%
C. Analysis of Stirling Council’s housing waiting list NB excludes RSL waiting list data (Stirling Council 2011)
Applicants 10 (No) Age of main applicant (%)Total
ApplicantsSingle
ApplicantsTransfer
ApplicantsRegistrationApplicants 16-29 30-44 45-64 65+
98 43 24 % 76 % 25 % 35 % 28 % 12 %
Applicants - Current tenure (%) Applicants - Size of house required (%)Council
RSLPrivate rented
Owner Occupier
FamilyFriends
Other Bedsit 1 Bed 2 Bed 3 Bed 4 Bed
13 % 22 % 18 % 37 % 10 % 23 % 33 % 27% 11 % 5 %
Applicants with medical priority (Number)
Pressured Area Status by allocations areas (Ratio = Waiting List : Houses Allocated)
A+ A B C Total
0 5 7 7 19No Pressurised Area Status
D. All Approved Planning Applications 2001-2010 (Stirling Council Data 2011))
House 1 bed
House 2 bed
House 3 bed
House 4+ bed
Total Houses
Flat1 bed
Flat2 bed
Flat3 bed
Flat4+ bed
TotalFlats
7 % 29 % 37 % 27 % 188 3 % 97 % 0 % 0 % 34
This is the Cultenhove are of St Ninians. In Area 2, the above figures have been excluded from the St Ninians figures.
10 This is the number of applicants who identify this area as their preferred choice and/or live in the area and/or have a ‘social inclusion/ community reason for moving’ to the area. Because applicants can apply for any number of the 56 allocation areas in the Stirling Council area, a larger number of applicants will have included this area amongst their multiple choices.
Stirling Council’s Local Housing StrategyLHS Area Profiles 2011
10

Stirling Council’s Local Housing StrategyLHS Area Profiles 2011
11
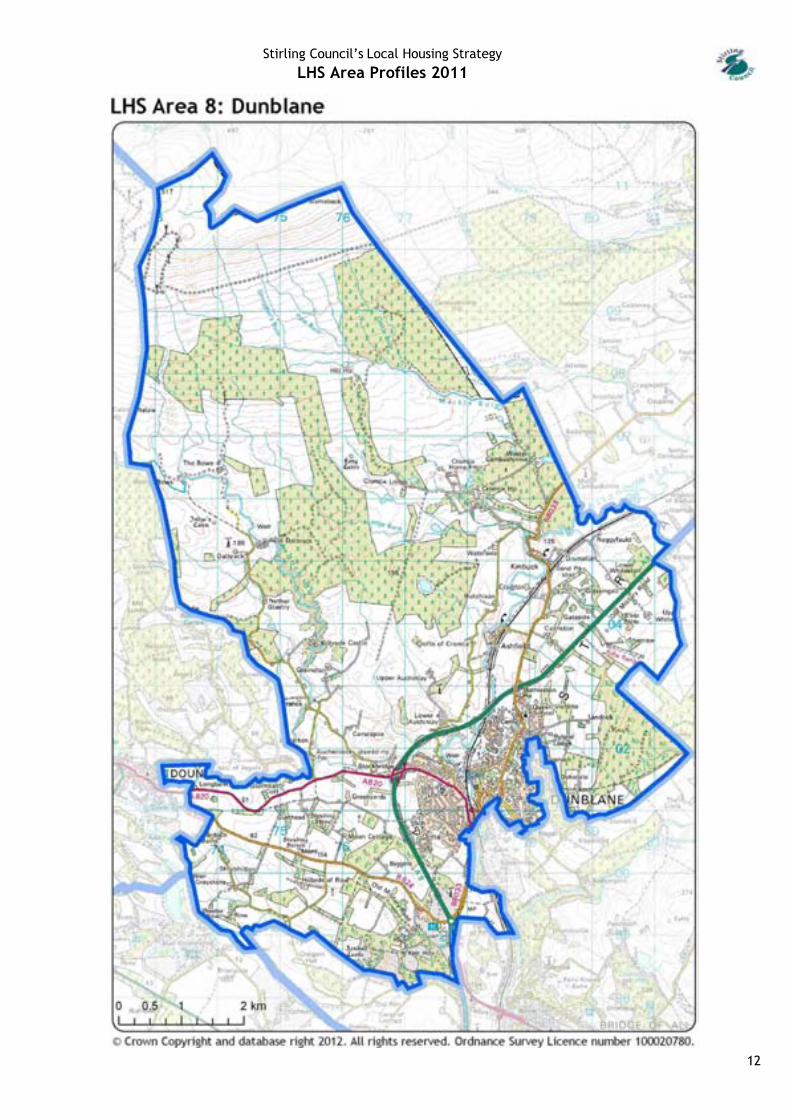
Area 8 Stirling Core Dunblane
A. Socio-demographics
Age structure 2009 MYE Benefit recipients (% of working age) DWP 2010Estimated population2009 MYE
0-15 16-64 65+ All out of work benefits
Job-seekers’ allowance
9056 22 % 62 % 16 % 5 % 2 %
Tenure of all residents (%) 2001 Census Vacant & second homes (No) GROS 2009Owner Occupier Private Rented Social Rented Vacant Second homes
81 % 7 % 11 % 74 31
B. Council housing stock (Stirling Council 2011)
House types (%) House sizes (%)Flat in Close /Maisonette
Own Door Flat
Terraced house
Detached or Semi D House
Bungalow 1 or 2 apartment
3 apartment
4+ apartment
31 % 19 % 29 % 9 % 12 % 37 % 43 % 20 %
Changes to council housing stock Original council housing stock
Sales to sitting tenants
Demolitionssince 1996/7
Acquisitions/New build since 1996/7
Remaining stock(No)
Remaining stock(%)
640 427 0 0 213 33 %
C. Analysis of Stirling Council’s housing waiting list NB excludes RSL waiting list data (Stirling Council 2011)
Applicants 11 (No) Age of main applicant (%)Total
ApplicantsSingle
ApplicantsTransfer
ApplicantsRegistrationApplicants 16-29 30-44 45-64 65+
85 38 14 % 86 % 18 % 32 % 34 % 15 %
Applicants - Current tenure (%) Applicants - Size of house required (%)Council
RSLPrivate rented
Owner Occupier
FamilyFriends
Other Bedsit 1 Bed 2 Bed 3 Bed 4 Bed
4 % 48 % 11 % 31 % 6 % 17 % 31 % 33 % 15 % 4 %
Applicants with medical priority (Number)
Pressured Area Status by allocations areas (Ratio = Waiting List : Houses Allocated)
A+ A B C Total Dunblane Town Rylands & Whitecross
Kinbuck
0 7 3 2 12 12:1 10:1 100:1
D. All Approved Planning Applications 2001-2010 (Stirling Council Data 2011)
House 1 bed
House 2 bed
House 3 bed
House 4+ bed
Total Houses
Flat1 bed
Flat2 bed
Flat3 bed
Flat4+ bed
TotalFlats
0 % 1 % 5 % 94 % 172 0 % 92 % 8 % 0 % 24
Dunblane includes:- Dunblane & Kinbuck
11 This is the number of applicants who identify this area as their preferred choice and/or live in the area and/or have a ‘social inclusion/ community reason for moving’ to the area. Because applicants can apply for any number of the 56 allocation areas in the Stirling Council area, a larger number of applicants will have included this area amongst their multiple choices.
Stirling Council’s Local Housing StrategyLHS Area Profiles 2011
12

Stirling Council’s Local Housing StrategyLHS Area Profiles 2011
13
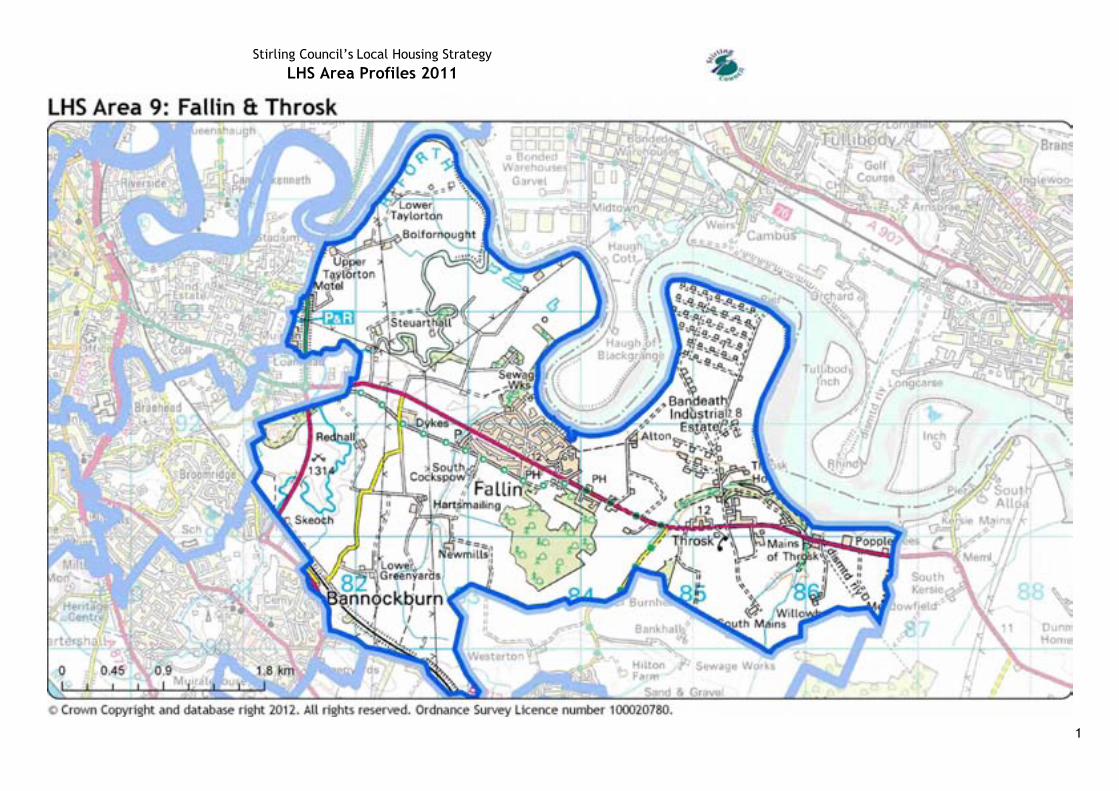
Area 9 Stirling Core Fallin & Throsk
A. Socio-demographics
Age structure 2009 MYE Benefit recipients (% of working age) DWP 2010Estimated population2009 MYE
0-15 16-64 65+ All out of work benefits
Job-seekers’ allowance
3085 20 % 67 % 13 % 19 % 6 %
Tenure of all residents (%) 2001 Census Vacant & second homes (No) GROS 2009Owner Occupier Private Rented Social Rented Vacant Second homes
46 % 2 % 52 % 17 4
B. Council housing stock (Stirling Council 2011)
House types (%) House sizes (%)Flat in Close /Maisonette
Own Door Flat
Terraced house
Detached or Semi D House
Bungalow 1 or 2 apartment
3 apartment
4+ apartment
6 % 2 % 58 % 31 % 3 % 9 % 36 % 55 %
Changes to council housing stock Original council housing stock
Sales to sitting tenants
Demolitionssince 1996/7
Acquisitions/New build since 1996/7
Remaining stock(No)
Remaining stock(%)
930 492 1 6 443 48 %
C. Analysis of Stirling Council’s housing waiting list NB excludes RSL waiting list data (Stirling Council 2011)
Applicants 12 (No) Age of main applicant (%)Total
ApplicantsSingle
ApplicantsTransfer
ApplicantsRegistrationApplicants 16-29 30-44 45-64 65+
62 24 18 % 82 % 39 % 35 % 18 % 8 %
Applicants - Current tenure (%) Applicants - Size of house required (%)Council
RSLPrivate rented
Owner Occupier
FamilyFriends
Other Bedsit 1 Bed 2 Bed 3 Bed 4 Bed
9 % 17 % 18 % 46 % 10 % 37 % 34 % 17 % 8 % 3 %
Applicants with medical priority (Number)
Pressured Area Status by allocations areas (Ratio = Waiting List : Houses Allocated)
A+ A B C Total
0 1 1 0 2No Pressurised Area Status
D. All Approved Planning Applications 2001-2010 (Stirling Council Data 2011)
House 1 bed
House 2 bed
House 3 bed
House 4+ bed
Total Houses
Flat1 bed
Flat2 bed
Flat3 bed
Flat4+ bed
TotalFlats
0 % 27 % 42 % 31 % 59 28 % 73 % 0 % 0 % 40
12 This is the number of applicants who identify this area as their preferred choice and/or live in the area and/or have a ‘social inclusion/ community reason for moving’ to the area. Because applicants can apply for any number of the 56 allocation areas in the Stirling Council area, a larger number of applicants will have included this area amongst their multiple choices.
Stirling Council’s Local Housing StrategyLHS Area Profiles 2011
1

Stirling Council’s Local Housing StrategyLHS Area Profiles 2011
1
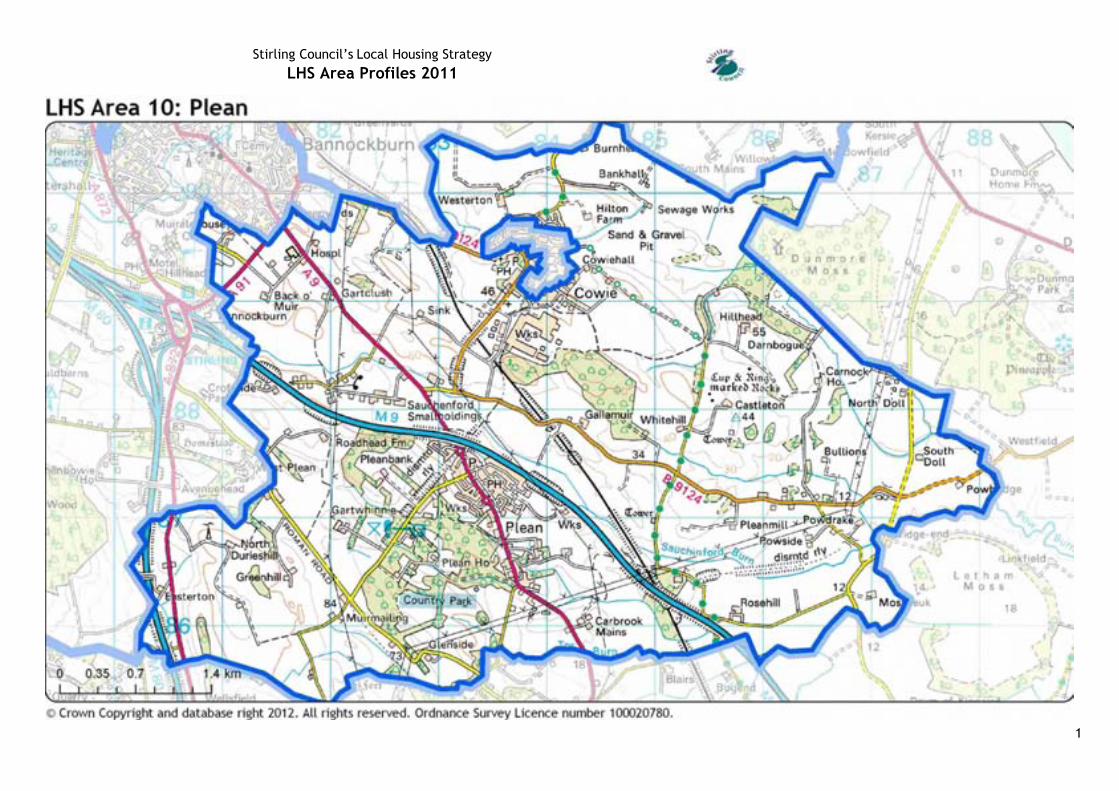
Area 10 Stirling Core Plean
A. Socio-demographics
Age structure 2009 MYE Benefit recipients (% of working age) DWP 2010Estimated population2009 MYE
0-15 16-64 65+ All out of work benefits
Job-seekers’ allowance
3164 20 % 65 % 15 % 19 % 6 %
Tenure of all residents (%) 2001 Census Vacant & second homes (No) GROS 2009Owner Occupier Private Rented Social Rented Vacant Second homes
46 % 4 % 50 % 22 8
B. Council housing stock (Stirling Council 2011)
House types (%) House sizes (%)Flat in Close /Maisonette
Own Door Flat
Terraced house
Detached or Semi D House
Bungalow 1 or 2 apartment
3 apartment
4+ apartment
11 % 6 % 48 % 32 % 3 % 12 % 34 % 54 %
Changes to council housing stock Original council housing stock
Sales to sitting tenants
Demolitionssince 1996/7
Acquisitions/New build since 1996/7
Remaining stock(No)
Remaining stock(%)
497 215 0 1 283 57 %
C. Analysis of Stirling Council’s housing waiting list NB excludes RSL waiting list data (Stirling Council 2011)
Applicants 13 (No) Age of main applicant (%)Total
ApplicantsSingle
ApplicantsTransfer
ApplicantsRegistrationApplicants 16-29 30-44 45-64 65+
73 20 17 % 83 % 34 % 37 % 22 % 7 %
Applicants - Current tenure (%) Applicants - Size of house required (%)Council
RSLPrivate rented
Owner Occupier
FamilyFriends
Other Bedsit 1 Bed 2 Bed 3 Bed 4 Bed
9 % 23 % 6 % 56 % 6 % 32 % 34 % 21 % 7 % 5 %
Applicants with medical priority (Number)
Pressured Area Status by allocations areas (Ratio = Waiting List : Houses Allocated)
A+ A B C Total
0 4 2 2 8No Pressurised Area Status
D. All Approved Planning Applications 2001-2010 (Stirling Council Data 2011)
House 1 bed
House 2 bed
House 3 bed
House 4+ bed
Total Houses
Flat1 bed
Flat2 bed
Flat3 bed
Flat4+ bed
TotalFlats
1 % 18 % 43 % 38 % 120 0 % 0 % 100 % 0 % 1
13 This is the number of applicants who identify this area as their preferred choice and/or live in the area and/or have a ‘social inclusion/ community reason for moving’ to the area. Because applicants can apply for any number of the 56 allocation areas in the Stirling Council area, a larger number of applicants will have included this area amongst their multiple choices.
Stirling Council’s Local Housing StrategyLHS Area Profiles 2011
1

Stirling Council’s Local Housing StrategyLHS Area Profiles 2011
1
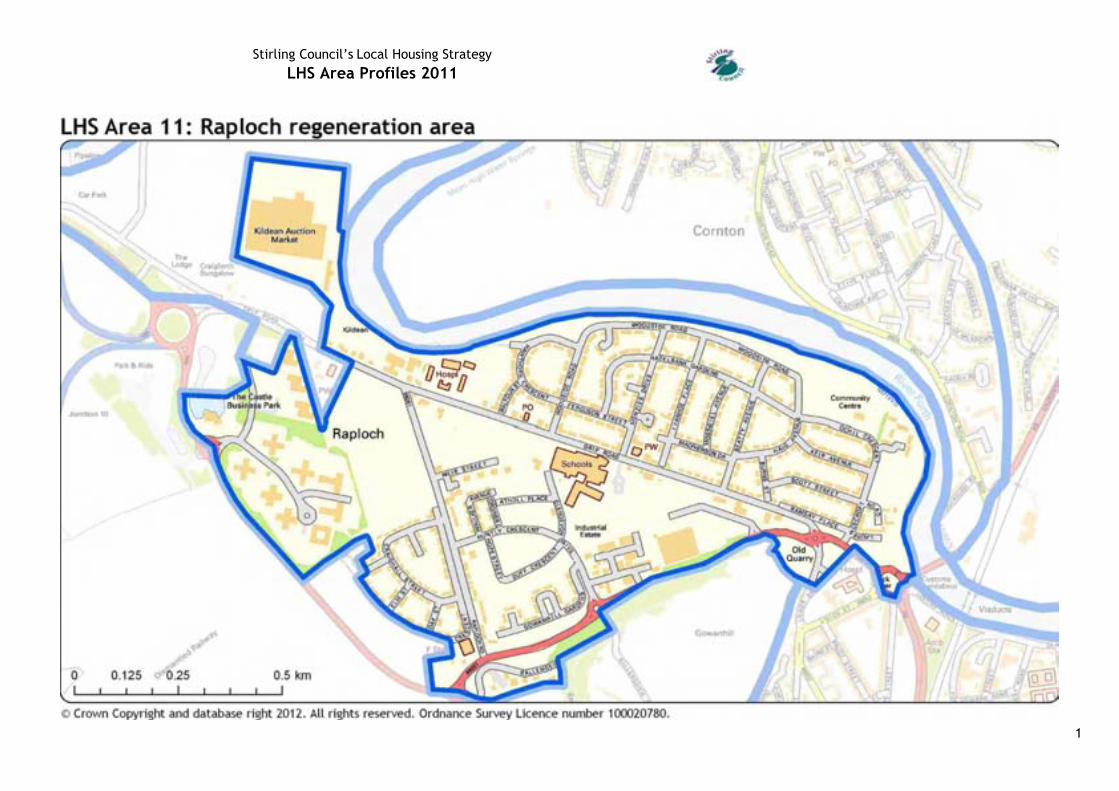
Area 11 Stirling Core Raploch regeneration area
A. Socio-demographics
Age structure 2009 MYE Benefit recipients (% of working age) DWP 2010Estimated population2009 MYE
0-15 16-64 65+ All out of work benefits
Job-seekers’ allowance
2566 21 % 61 % 19 % 39 % 14 %
Tenure of all residents (%) 2001 Census Vacant & second homes (No) GROS 2009Owner Occupier Private Rented Social Rented Vacant Second homes
18 % 1 % 80 % 62 3
B. Council housing stock (Stirling Council 2011)
House types (%) House sizes (%)Flat in Close /Maisonette
Own Door Flat
Terraced house
Detached or Semi D House
Bungalow 1 or 2 apartment
3 apartment
4+ apartment
11 % 69 % 5 % 13 % 3 % 18 % 37 % 44 %
Changes to council housing stock Original council housing stock
Sales to sitting tenants
Demolitionssince 1996/7
Acquisitions/New build since 1996/7
Remaining stock(No)
Remaining stock(%)
1582 305 449 9 837 53 %
C. Analysis of Stirling Council’s housing waiting list NB excludes RSL waiting list data (Stirling Council 2011)
Applicants 14 (No) Age of main applicant (%)Total
ApplicantsSingle
ApplicantsTransfer
ApplicantsRegistrationApplicants 16-29 30-44 45-64 65+
179 72 36 % 64 % 32 % 26 % 32 % 10 %
Applicants - Current tenure (%) Applicants - Size of house required (%)Council
RSLPrivate rented
Owner Occupier
FamilyFriends
Other Bedsit 1 Bed 2 Bed 3 Bed 4 Bed
9 % 22 % 6 % 40 % 24 % 30 % 24 % 31 % 9 % 5 %
Applicants with medical priority (Number)
Pressured Area Status by allocations areas (Ratio = Waiting List : Houses Allocated)
A+ A B C Total
0 9 5 10 24No Pressurised Area Status
D. All Approved Planning Applications 2001-2010 (Stirling Council Data 2011)
House 1 bed
House 2 bed
House 3 bed
House 4+ bed
Total Houses
Flat1 bed
Flat2 bed
Flat3 bed
Flat4+ bed
TotalFlats
2 % 31 % 49 % 18 % 164 25 % 63 % 12 % 0 % 140
14 This is the number of applicants who identify this area as their preferred choice and/or live in the area and/or have a ‘social inclusion/ community reason for moving’ to the area. Because applicants can apply for any number of the 56 allocation areas in the Stirling Council area, a larger number of applicants will have included this area amongst their multiple choices.
Stirling Council’s Local Housing StrategyLHS Area Profiles 2011
1

Stirling Council’s Local Housing StrategyLHS Area Profiles 2011
1
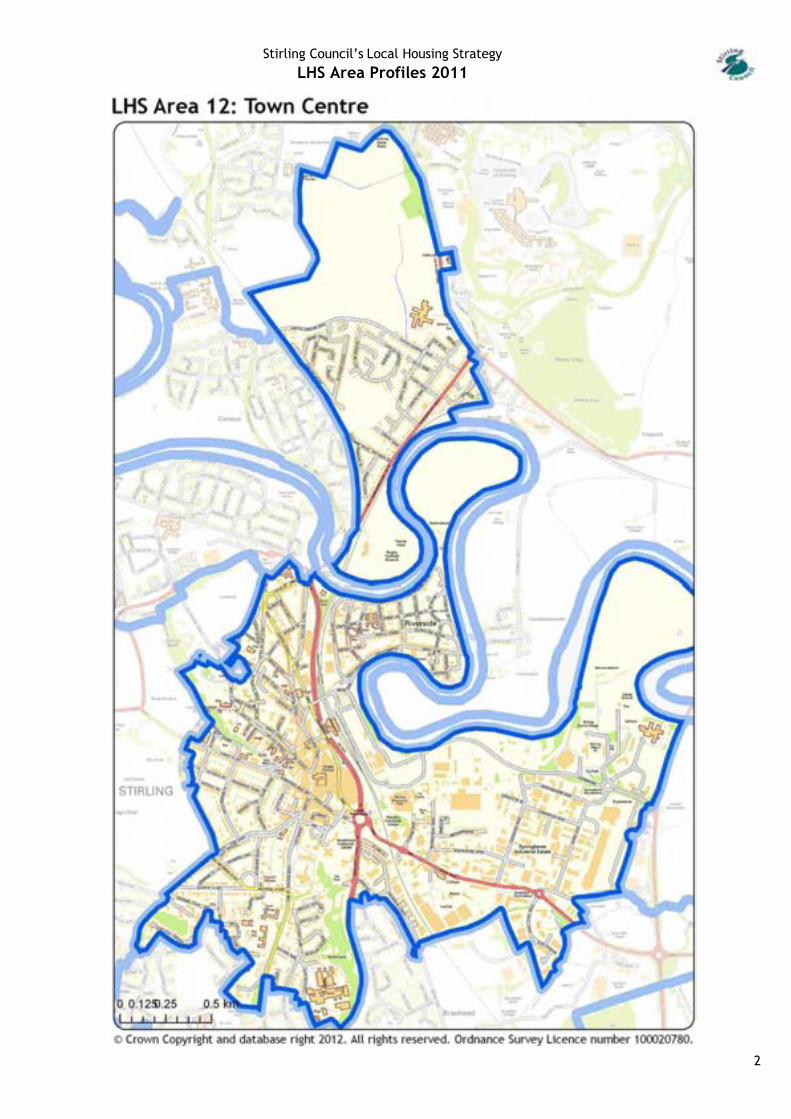
Area 12 Stirling Core Town Centre
A. Socio-demographics
Age structure 2009 MYE Benefit recipients (% of working age) DWP 2010Estimated population2009 MYE
0-15 16-64 65+ All out of work benefits
Job-seekers’ allowance
9826 14 % 71 % 15 % 11 % 4 %
Tenure of all residents (%) 2001 Census Vacant & second homes (No) GROS 2009Owner Occupier Private Rented Social Rented Vacant Second homes
68 % 18 % 13 % 183 71
B. Council housing stock (Stirling Council 2011)
House types (%) House sizes (%)Flat in Close /Maisonette
Own Door Flat
Terraced house
Detached or Semi D House
Bungalow 1 or 2 apartment
3 apartment
4+ apartment
81 % 7 % 4 % 6 % 2 % 44 % 37 % 19 %
Changes to council housing stock Original council housing stock
Sales to sitting tenants
Demolitionssince 1996/7
Acquisitions/New build since 1996/7
Remaining stock(No)
Remaining stock(%)
808 454 0 40 394 49 %
C. Analysis of Stirling Council’s housing waiting list NB excludes RSL waiting list data (Stirling Council 2011)
Applicants 15 (No) Age of main applicant (%)Total
ApplicantsSingle
ApplicantsTransfer
ApplicantsRegistrationApplicants 16-29 30-44 45-64 65+
289 137 16 % 84 % 28 % 32 % 31 % 9 %
Applicants - Current tenure (%) Applicants - Size of house required (%)Council
RSLPrivate rented
Owner Occupier
FamilyFriends
Other Bedsit 1 Bed 2 Bed 3 Bed 4 Bed
13 % 33 % 11 % 28 % 14 % 26 % 30 % 30 % 9 % 4 %
Applicants with medical priority (Number)
Pressured Area Status by allocations areas (Ratio = Waiting List : Houses Allocated)
A+ A B C Total Stirling Town Riverside Causewayhead/Logie
0 13 11 21 45 6:1 100:1 51:1
D. All Approved Planning Applications 2001-2010 (Stirling Council Data 2011)
House 1 bed
House 2 bed
House 3 bed
House 4+ bed
Total Houses
Flat1 bed
Flat2 bed
Flat3 bed
Flat4+ bed
TotalFlats
1 % 0 % 12 % 87 % 224 20 % 69 % 11 % 0 % 326
Town Centre includes:- Springkerse, Blairlogie, Causewayhead, Riverside, Top Of The Town & Town Centre
15 This is the number of applicants who identify this area as their preferred choice and/or live in the area and/or have a ‘social inclusion/ community reason for moving’ to the area. Because applicants can apply for any number of the 56 allocation areas in the Stirling Council area, a larger number of applicants will have included this area amongst their multiple choices.
Stirling Council’s Local Housing StrategyLHS Area Profiles 2011
2

Stirling Council’s Local Housing StrategyLHS Area Profiles 2011
3
Area 13 Stirling RuralArnprior, Thornhill &
Blairdrummond
A. Socio-demographics
Age structure 2009 MYE Benefit recipients (% of working age) DWP 2010Estimated population2009 MYE
0-15 16-64 65+ All out of work benefits
Job-seekers’ allowance
1846 17 % 68 % 15 % 6 % 2 %
Tenure of all residents (%) 2001 Census Vacant & second homes (No) GROS 2009Owner Occupier Private Rented Social Rented Vacant Second homes
72 % 21 % 7 % 18 8
B. Council housing stock (Stirling Council 2011)
House types (%) House sizes (%)Flat in Close /Maisonette
Own Door Flat
Terraced house
Detached or Semi D House
Bungalow 1 or 2 apartment
3 apartment
4+ apartment
0 % 9 % 4 % 30 % 57 % 35 % 30 % 35 %
Changes to council housing stock Original council housing stock
Sales to sitting tenants
Demolitionssince 1996/7
Acquisitions/New build since 1996/7
Remaining stock(No)
Remaining stock(%)
71 48 0 0 23 32 %
C. Analysis of Stirling Council’s housing waiting list NB excludes RSL waiting list data (Stirling Council 2011)
Applicants 16 (No) Age of main applicant (%)Total
ApplicantsSingle
ApplicantsTransfer
ApplicantsRegistrationApplicants 16-29 30-44 45-64 65+
14 5 18 % 82 % 18 % 33 % 47 % 2 %
Applicants - Current tenure (%) Applicants - Size of house required (%)Council
RSLPrivate rented
Owner Occupier
FamilyFriends
Other Bedsit 1 Bed 2 Bed 3 Bed 4 Bed
2 % 52 % 2 % 21 % 22 % 17 % 30 % 42 % 2 % 8 %
Applicants with medical priority (Number)
Pressured Area Status by allocations areas (Ratio = Waiting List : Houses Allocated)
A+ A B C Total Thornhill, Blairdrummond
Kippen, Arnprior Port of Menteith
0 0 0 0 0 11:1 19:1 100:1
D. All Approved Planning Applications 2001-2010 (Stirling Council Data 2011)
House 1 bed
House 2 bed
House 3 bed
House 4+ bed
Total Houses
Flat1 bed
Flat2 bed
Flat3 bed
Flat4+ bed
TotalFlats
0 % 2 % 43 % 55 % 42 0 % 0 % 0 % 100 % 1
16 This is the number of applicants who identify this area as their preferred choice and/or live in the area and/or have a ‘social inclusion/ community reason for moving’ to the area. Because applicants can apply for any number of the 56 allocation areas in the Stirling Council area, a larger number of applicants will have included this area amongst their multiple choices.
Stirling Council’s Local Housing StrategyLHS Area Profiles 2011
1
Stirling Council’s Local Housing StrategyLHS Area Profiles 2011
1
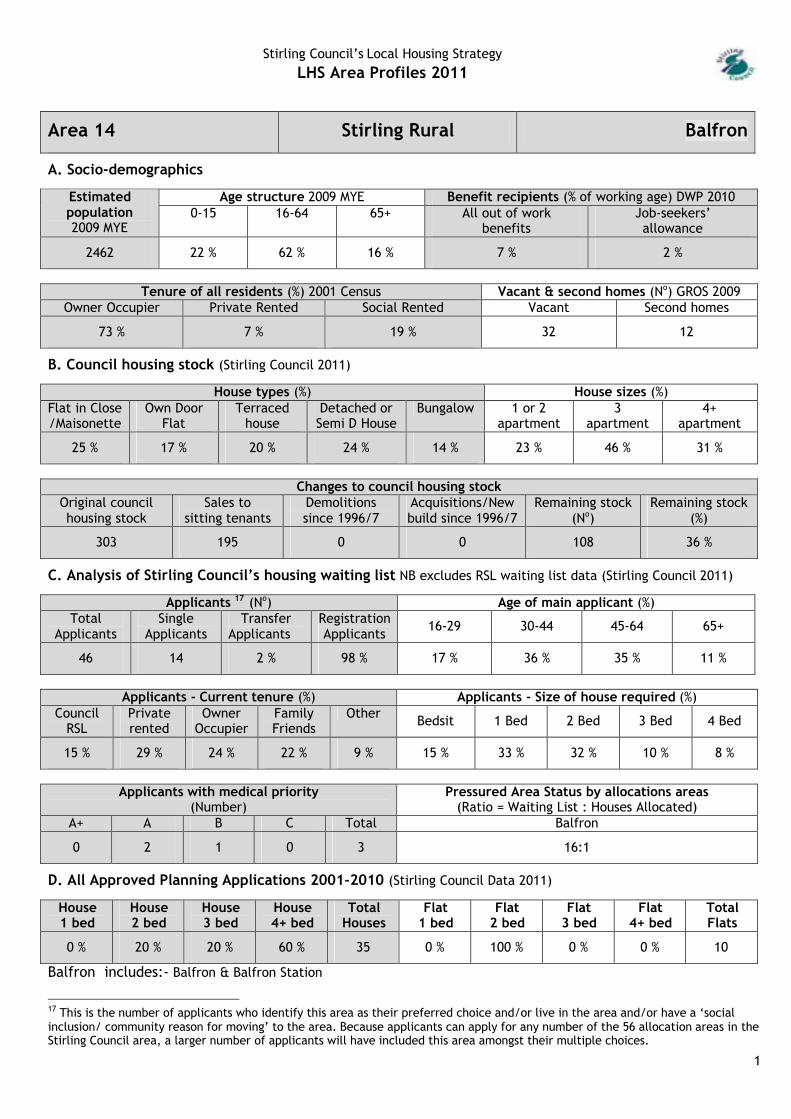
Area 14 Stirling Rural Balfron
A. Socio-demographics
Age structure 2009 MYE Benefit recipients (% of working age) DWP 2010Estimated population2009 MYE
0-15 16-64 65+ All out of work benefits
Job-seekers’ allowance
2462 22 % 62 % 16 % 7 % 2 %
Tenure of all residents (%) 2001 Census Vacant & second homes (No) GROS 2009Owner Occupier Private Rented Social Rented Vacant Second homes
73 % 7 % 19 % 32 12
B. Council housing stock (Stirling Council 2011)
House types (%) House sizes (%)Flat in Close /Maisonette
Own Door Flat
Terraced house
Detached or Semi D House
Bungalow 1 or 2 apartment
3 apartment
4+ apartment
25 % 17 % 20 % 24 % 14 % 23 % 46 % 31 %
Changes to council housing stock Original council housing stock
Sales to sitting tenants
Demolitionssince 1996/7
Acquisitions/New build since 1996/7
Remaining stock(No)
Remaining stock(%)
303 195 0 0 108 36 %
C. Analysis of Stirling Council’s housing waiting list NB excludes RSL waiting list data (Stirling Council 2011)
Applicants 17 (No) Age of main applicant (%)Total
ApplicantsSingle
ApplicantsTransfer
ApplicantsRegistrationApplicants 16-29 30-44 45-64 65+
46 14 2 % 98 % 17 % 36 % 35 % 11 %
Applicants - Current tenure (%) Applicants - Size of house required (%)Council
RSLPrivate rented
Owner Occupier
FamilyFriends
Other Bedsit 1 Bed 2 Bed 3 Bed 4 Bed
15 % 29 % 24 % 22 % 9 % 15 % 33 % 32 % 10 % 8 %
Applicants with medical priority (Number)
Pressured Area Status by allocations areas (Ratio = Waiting List : Houses Allocated)
A+ A B C Total Balfron
0 2 1 0 3 16:1
D. All Approved Planning Applications 2001-2010 (Stirling Council Data 2011)
House 1 bed
House 2 bed
House 3 bed
House 4+ bed
Total Houses
Flat1 bed
Flat2 bed
Flat3 bed
Flat4+ bed
TotalFlats
0 % 20 % 20 % 60 % 35 0 % 100 % 0 % 0 % 10
Balfron includes:- Balfron & Balfron Station
17 This is the number of applicants who identify this area as their preferred choice and/or live in the area and/or have a ‘social inclusion/ community reason for moving’ to the area. Because applicants can apply for any number of the 56 allocation areas in the Stirling Council area, a larger number of applicants will have included this area amongst their multiple choices.

Stirling Council’s Local Housing StrategyLHS Area Profiles 2011
2

Stirling Council’s Local Housing StrategyLHS Area Profiles 2011
3
Area 15 Stirling Rural Buchlyvie
A. Socio-demographics
Age structure 2009 MYE Benefit recipients (% of working age) DWP 2010Estimated population2009 MYE
0-15 16-64 65+ All out of work benefits
Job-seekers’ allowance
699 17 % 60 % 24 % 12 % 3 %
Tenure of all residents (%) 2001 Census Vacant & second homes (No) GROS 2009Owner Occupier Private Rented Social Rented Vacant Second homes
72 % 9 % 18 % 9 1
B. Council housing stock (Stirling Council 2011)
House types (%) House sizes (%)Flat in Close /Maisonette
Own Door Flat
Terraced house
Detached or Semi D House
Bungalow 1 or 2 apartment
3 apartment
4+ apartment
36 % 9 % 36 % 18 % 0 % 36 % 45 % 18 %
Changes to council housing stock Original council housing stock
Sales to sitting tenants
Demolitionssince 1996/7
Acquisitions/New build since 1996/7
Remaining stock(No)
Remaining stock(%)
79 57 0 0 22 28
C. Analysis of Stirling Council’s housing waiting list NB excludes RSL waiting list data (Stirling Council 2011)
Applicants 18 (No) Age of main applicant (%)Total
ApplicantsSingle
ApplicantsTransfer
ApplicantsRegistrationApplicants 16-29 30-44 45-64 65+
6 2 0 % 100 % 0 % 17 % 50 % 33 %
Applicants - Current tenure (%) Applicants - Size of house required (%)Council
RSLPrivate rented
Owner Occupier
FamilyFriends
Other Bedsit 1 Bed 2 Bed 3 Bed 4 Bed
16 % 49 % 1 % 33 % 0 % 0 % 17 % 50 % 33 % 0 %
Applicants with medical priority (Number)
Pressured Area Status by allocations areas (Ratio = Waiting List : Houses Allocated)
A+ A B C Total Buchlyvie
0 0 0 0 0 74:1
D. All Approved Planning Applications 2001-2010 (Stirling Council Data 2011)
House 1 bed
House 2 bed
House 3 bed
House 4+ bed
Total Houses
Flat1 bed
Flat2 bed
Flat3 bed
Flat4+ bed
TotalFlats
0 % 37 % 26 % 37 % 19 67 % 33 % 0 % 0 % 12
18 This is the number of applicants who identify this area as their preferred choice and/or live in the area and/or have a ‘social inclusion/ community reason for moving’ to the area. Because applicants can apply for any number of the 56 allocation areas in the Stirling Council area, a larger number of applicants will have included this area amongst their multiple choices.
Stirling Council’s Local Housing StrategyLHS Area Profiles 2011
4

Stirling Council’s Local Housing StrategyLHS Area Profiles 2011
5
Area 16 Stirling Rural Doune & Deanston
A. Socio-demographics
Age structure 2009 MYE Benefit recipients (% of working age) DWP 2010Estimated population2009 MYE
0-15 16-64 65+ All out of work benefits
Job-seekers’ allowance
1909 19 % 61 % 20 % 7 % 2 %
Tenure of all residents (%) 2001 Census Vacant & second homes (No) GROS 2009Owner Occupier Private Rented Social Rented Vacant Second homes
71 % 13 % 16 % 27 11
B. Council housing stock (Stirling Council 2011)
House types (%) House sizes (%)Flat in Close /Maisonette
Own Door Flat
Terraced house
Detached or Semi D House
Bungalow 1 or 2 apartment
3 apartment
4+ apartment
46 % 17 % 8 % 22 % 7 % 24 % 54 % 21 %
Changes to council housing stock Original council housing stock
Sales to sitting tenants
Demolitionssince 1996/7
Acquisitions/New build since 1996/7
Remaining stock(No)
Remaining stock(%)
263 160 0 0 103 39 %
C. Analysis of Stirling Council’s housing waiting list NB excludes RSL waiting list data (Stirling Council 2011)
Applicants 19 (No) Age of main applicant (%)Total
ApplicantsSingle
ApplicantsTransfer
ApplicantsRegistrationApplicants 16-29 30-44 45-64 65+
55 11 26 % 74 % 17 % 25 % 35 % 23 %
Applicants - Current tenure (%) Applicants - Size of house required (%)Council
RSLPrivate rented
Owner Occupier
FamilyFriends
Other Bedsit 1 Bed 2 Bed 3 Bed 4 Bed
6 % 39 % 11 % 28 % 15 % 16 % 24 % 34 % 22 % 5 %
Applicants with medical priority (Number)
Pressured Area Status by allocations areas (Ratio = Waiting List : Houses Allocated)
A+ A B C Total Doune Deanston
0 4 2 5 11 20:1 8:1
D. All Approved Planning Applications 2001-2010 (Stirling Council Data 2011)
House 1 bed
House 2 bed
House 3 bed
House 4+ bed
Total Houses
Flat1 bed
Flat2 bed
Flat3 bed
Flat4+ bed
TotalFlats
4 % 27 % 24 % 45 % 184 50 % 50 % 0 % 0 % 16
19 This is the number of applicants who identify this area as their preferred choice and/or live in the area and/or have a ‘social inclusion/ community reason for moving’ to the area. Because applicants can apply for any number of the 56 allocation areas in the Stirling Council area, a larger number of applicants will have included this area amongst their multiple choices.

Stirling Council’s Local Housing StrategyLHS Area Profiles 2011
6

Stirling Council’s Local Housing StrategyLHS Area Profiles 2011
7
Area 17 Stirling Rural Fintry
A. Socio-demographics
Age structure 2009 MYE Benefit recipients (% of working age) DWP 2010Estimated population2009 MYE
0-15 16-64 65+ All out of work benefits
Job-seekers’ allowance
694 21 % 59 % 20 % 4 % 3 %
Tenure of all residents (%) 2001 Census (‘Other’ = 3%) Vacant & second homes (No) GROS 2009Owner Occupier Private Rented Social Rented Vacant Second homes
82 % 8 % 7 % 6 1
B. Council housing stock (Stirling Council 2011)
House types (%) House sizes (%)Flat in Close /Maisonette
Own Door Flat
Terraced house
Detached or Semi D House
Bungalow 1 or 2 apartment
3 apartment
4+ apartment
29 % 0 % 0 % 57 % 14 % 29 % 29 % 43 %
Changes to council housing stock Original council housing stock
Sales to sitting tenants
Demolitionssince 1996/7
Acquisitions/New build since 1996/7
Remaining stock(No)
Remaining stock(%)
41 34 0 0 7 17 %
C. Analysis of Stirling Council’s housing waiting list NB excludes RSL waiting list data (Stirling Council 2011)
Applicants 20 (No) Age of main applicant (%)Total
ApplicantsSingle
ApplicantsTransfer
ApplicantsRegistrationApplicants 16-29 30-44 45-64 65+
7 2 0 % 100 % 13 % 14 % 49 % 24 %
Applicants - Current tenure (%) Applicants - Size of house required (%)Council
RSLPrivate rented
Owner Occupier
FamilyFriends
Other Bedsit 1 Bed 2 Bed 3 Bed 4 Bed
13 % 37 % 13 % 13 % 24 % 13 % 14 % 49 % 24 % 1 %
Applicants with medical priority (Number)
Pressured Area Status by allocations areas (Ratio = Waiting List : Houses Allocated)
A+ A B C Total Fintry
0 0 0 0 0 11:1
D. All Approved Planning Applications 2001-2010 (Stirling Council Data 2011)
House 1 bed
House 2 bed
House 3 bed
House 4+ bed
Total Houses
Flat1 bed
Flat2 bed
Flat3 bed
Flat4+ bed
TotalFlats
0 % 9 % 48 % 43 % 23 0 % 0 % 0 % 0 % 0
20 This is the number of applicants who identify this area as their preferred choice and/or live in the area and/or have a ‘social inclusion/ community reason for moving’ to the area. Because applicants can apply for any number of the 56 allocation areas in the Stirling Council area, a larger number of applicants will have included this area amongst their multiple choices.
Stirling Council’s Local Housing StrategyLHS Area Profiles 2011
8

Stirling Council’s Local Housing StrategyLHS Area Profiles 2011
9
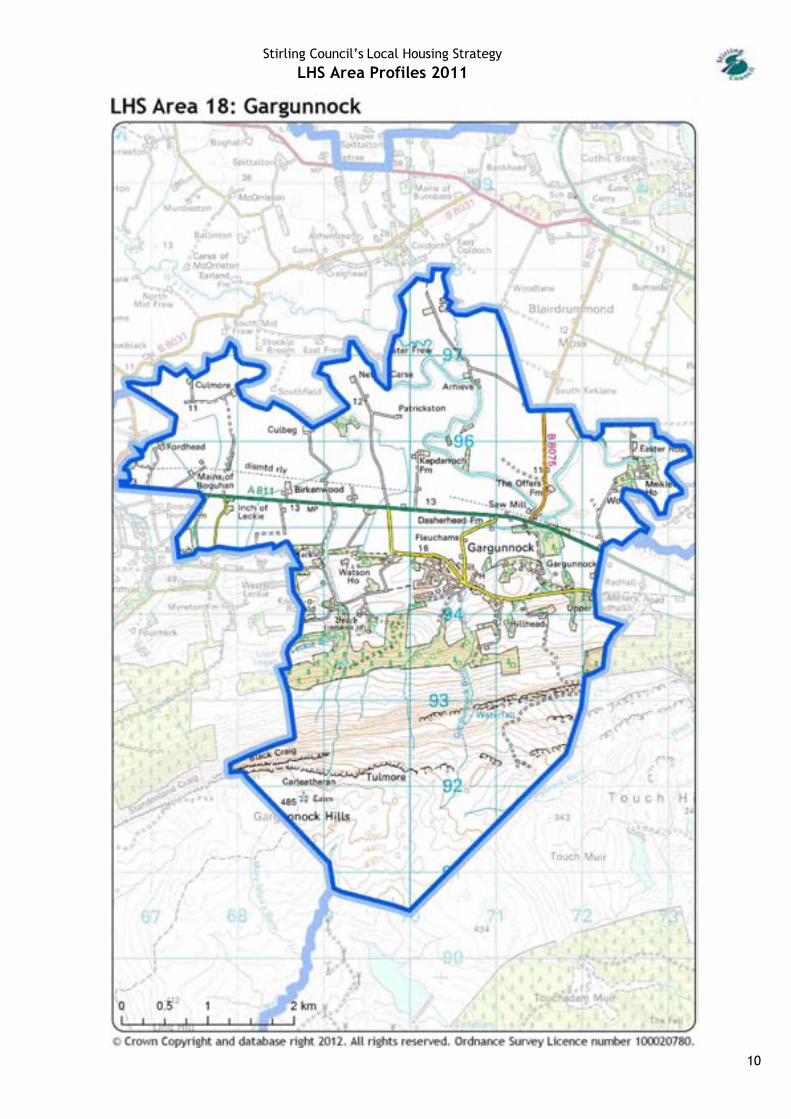
Area 18 Stirling Rural Gargunnock
A. Socio-demographics
Age structure 2009 MYE Benefit recipients (% of working age) DWP 2010Estimated population2009 MYE
0-15 16-64 65+ All out of work benefits
Job-seekers’ allowance
1022 23 % 61 % 16 % 5 % 2 %
Tenure of all residents (%) 2001 Census Vacant & second homes (No) GROS 2009Owner Occupier Private Rented Social Rented Vacant Second homes
75 % 8 % 17 % 7 3
B. Council housing stock (Stirling Council 2011)
House types (%) House sizes (%)Flat in Close /Maisonette
Own Door Flat
Terraced house
Detached or Semi D House
Bungalow 1 or 2 apartment
3 apartment
4+ apartment
0 % 0 % 16 % 52 % 32 % 32 % 26 % 42 %
Changes to council housing stock Original council housing stock
Sales to sitting tenants
Demolitionssince 1996/7
Acquisitions/New build since 1996/7
Remaining stock(No)
Remaining stock(%)
80 48 0 0 32 40 %
C. Analysis of Stirling Council’s housing waiting list NB excludes RSL waiting list data (Stirling Council 2011)
Applicants 21 (No) Age of main applicant (%)Total
ApplicantsSingle
ApplicantsTransfer
ApplicantsRegistrationApplicants 16-29 30-44 45-64 65+
14 5 27 % 73 % 8 % 40 % 38 % 14 %
Applicants - Current tenure (%) Applicants - Size of house required (%)Council
RSLPrivate rented
Owner Occupier
FamilyFriends
Other Bedsit 1 Bed 2 Bed 3 Bed 4 Bed
20 % 35 % 20 % 23 % 2 % 7 % 34 % 33 % 13 % 13 %
Applicants with medical priority (Number)
Pressured Area Status by allocations areas (Ratio = Waiting List : Houses Allocated)
A+ A B C Total Gargunnock
0 1 0 1 2 17:1
D. All Approved Planning Applications 2001-2010 (Stirling Council Data 2011)
House 1 bed
House 2 bed
House 3 bed
House 4+ bed
Total Houses
Flat1 bed
Flat2 bed
Flat3 bed
Flat4+ bed
TotalFlats
0 % 0 % 60 % 40 % 5 0 % 0 % 0 % 0 % 0
21 This is the number of applicants who identify this area as their preferred choice and/or live in the area and/or have a ‘social inclusion/ community reason for moving’ to the area. Because applicants can apply for any number of the 56 allocation areas in the Stirling Council area, a larger number of applicants will have included this area amongst their multiple choices.
Stirling Council’s Local Housing StrategyLHS Area Profiles 2011
10

Stirling Council’s Local Housing StrategyLHS Area Profiles 2011
11
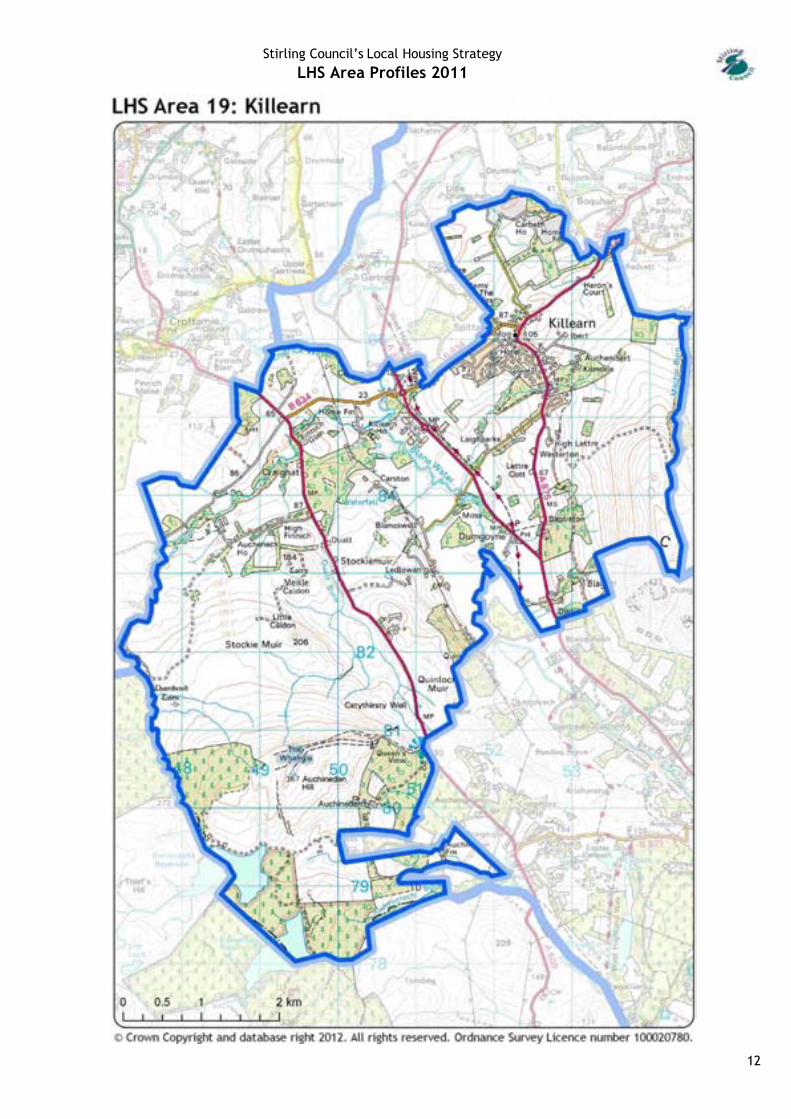
Area 19 Stirling Rural Killearn
A. Socio-demographics
Age structure 2009 MYE Benefit recipients (% of working age) DWP 2010Estimated population2009 MYE
0-15 16-64 65+ All out of work benefits
Job-seekers’ allowance
2086 21 % 59 % 20 % 5 % 1 %
Tenure of all residents (%) 2001 Census Vacant & second homes (No) GROS 2009Owner Occupier Private Rented Social Rented Vacant Second homes
86 % 7 % 7 % 18 11
B. Council housing stock (Stirling Council 2011)
House types (%) House sizes (%)Flat in Close /Maisonette
Own Door Flat
Terraced house
Detached or Semi D House
Bungalow 1 or 2 apartment
3 apartment
4+ apartment
6 % 12 % 18 % 50 % 15 % 21 % 35 % 44 %
Changes to council housing stock Original council housing stock
Sales to sitting tenants
Demolitionssince 1996/7
Acquisitions/New build since 1996/7
Remaining stock(No)
Remaining stock(%)
108 74 0 0 34 31
C. Analysis of Stirling Council’s housing waiting list (Stirling Council 2011) NB excludes RSL waiting list data
Applicants 22 (No) Age of main applicant (%)Total
ApplicantsSingle
ApplicantsTransfer
ApplicantsRegistrationApplicants 16-29 30-44 45-64 65+
18 7 11 % 89 % 18 % 21 % 29 % 32 %
Applicants - Current tenure (%) Applicants - Size of house required (%)Council
RSLPrivate rented
Owner Occupier
FamilyFriends
Other Bedsit 1 Bed 2 Bed 3 Bed 4 Bed
6 % 52 % 30 % 0 % 12 % 17 % 20 % 27 % 30 % 5 %
Applicants with medical priority (Number)
Pressured Area Status by allocations areas (Ratio = Waiting List : Houses Allocated)
A+ A B C Total Killearn
0 3 2 1 6 13:1
D. All Approved Planning Applications 2001-2010 (Stirling Council Data 2011)
House 1 bed
House 2 bed
House 3 bed
House 4+ bed
Total Houses
Flat1 bed
Flat2 bed
Flat3 bed
Flat4+ bed
TotalFlats
0 % 5 % 30 % 65 % 20 0 % 0 % 0 % 0 % 0
22 This is the number of applicants who identify this area as their preferred choice and/or live in the area and/or have a ‘social inclusion/ community reason for moving’ to the area. Because applicants can apply for any number of the 56 allocation areas in the Stirling Council area, a larger number of applicants will have included this area amongst their multiple choices.
Stirling Council’s Local Housing StrategyLHS Area Profiles 2011
12

Stirling Council’s Local Housing StrategyLHS Area Profiles 2011
13
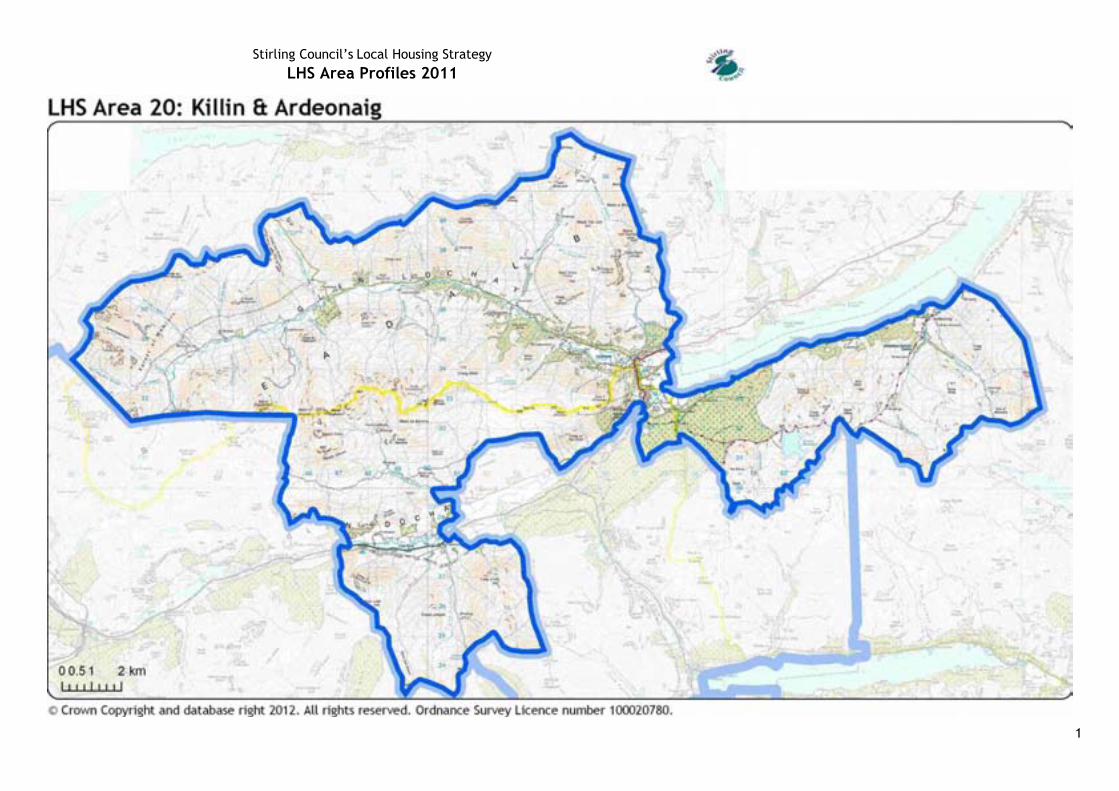
Area 20 Stirling Rural Killin & Ardeonaig
A. Socio-demographics
Age structure 2009 MYE Benefit recipients (% of working age) DWP 2010Estimated population2009 MYE
0-15 16-64 65+ All out of work benefits
Job-seekers’ allowance
583 14 % 69 % 17 % 6 % 2 %
Tenure of all residents (%) 2001 Census Vacant & second homes (No) GROS 2009Owner Occupier Private Rented Social Rented Vacant Second homes
64 % 19 % 15 % 20 28
B. Council housing stock (Stirling Council 2011)
House types (%) House sizes (%)Flat in Close /Maisonette
Own Door Flat
Terraced house
Detached or Semi D House
Bungalow 1 or 2 apartment
3 apartment
4+ apartment
0 % 0 % 38 % 31 % 31 % 31 % 54 % 15 %
Changes to council housing stock Original council housing stock
Sales to sitting tenants
Demolitionssince 1996/7
Acquisitions/New build since 1996/7
Remaining stock(No)
Remaining stock(%)
89 52 4 0 33 37
C. Analysis of Stirling Council’s housing waiting list NB excludes RSL waiting list data (Stirling Council 2011)
Applicants 23 (No) Age of main applicant (%)Total
ApplicantsSingle
ApplicantsTransfer
ApplicantsRegistrationApplicants 16-29 30-44 45-64 65+
11 4 32 % 68 % 36 % 16 % 17 % 31 %
Applicants - Current tenure (%) Applicants - Size of house required (%)Council
RSLPrivate rented
Owner Occupier
FamilyFriends
Other Bedsit 1 Bed 2 Bed 3 Bed 4 Bed
38 % 23 % 17 % 23 % 0 % 36 % 16 % 17 % 31 % 0 %
Applicants with medical priority (Number)
Pressured Area Status by allocations areas (Ratio = Waiting List : Houses Allocated)
A+ A B C Total Killin & Ardeonaig
0 1 0 0 1 7:1
D. All Approved Planning Applications 2001-2010 (Stirling Council Data 2011)
House 1 bed
House 2 bed
House 3 bed
House 4+ bed
Total Houses
Flat1 bed
Flat2 bed
Flat3 bed
Flat4+ bed
TotalFlats
0 % 0 % 0 % 0 % 0 0 % 0 % 0 % 0 % 0
23 This is the number of applicants who identify this area as their preferred choice and/or live in the area and/or have a ‘social inclusion/ community reason for moving’ to the area. Because applicants can apply for any number of the 56 allocation areas in the Stirling Council area, a larger number of applicants will have included this area amongst their multiple choices.
Stirling Council’s Local Housing StrategyLHS Area Profiles 2011
1

Stirling Council’s Local Housing StrategyLHS Area Profiles 2011
1
Area 21 Stirling Rural Kippen
A. Socio-demographics
Age structure 2009 MYE Benefit recipients (% of working age) DWP 2010Estimated population2009 MYE
0-15 16-64 65+ All out of work benefits
Job-seekers’ allowance
1202 20 % 60 % 20 % 9 % 1 %
Tenure of all residents (%) 2001 Census Vacant & second homes (No) GROS 2009Owner Occupier Private Rented Social Rented Vacant Second homes
75 % 5 % 20 % 8 4
B. Council housing stock (Stirling Council 2011)
House types (%) House sizes (%)Flat in Close /Maisonette
Own Door Flat
Terraced house
Detached or Semi D House
Bungalow 1 or 2 apartment
3 apartment
4+ apartment
15 % 4 % 19 % 44 % 19 % 28 % 26 % 46 %
Changes to council housing stock Original council housing stock
Sales to sitting tenants
Demolitionssince 1996/7
Acquisitions/New build since 1996/7
Remaining stock(No)
Remaining stock(%)
117 63 0 0 54 46 %
C. Analysis of Stirling Council’s housing waiting list NB excludes RSL waiting list data (Stirling Council 2011)
Applicants 24 (No) Age of main applicant (%)Total
ApplicantsSingle
ApplicantsTransfer
ApplicantsRegistrationApplicants 16-29 30-44 45-64 65+
34 15 0 % 100 % 19 % 40 % 33 % 8 %
Applicants - Current tenure (%) Applicants - Size of house required (%)Council
RSLPrivate rented
Owner Occupier
FamilyFriends
Other Bedsit 1 Bed 2 Bed 3 Bed 4 Bed
13 % 32 % 13 % 32 % 8 % 17 % 37 % 29 % 7 % 10 %
Applicants with medical priority (Number)
Pressured Area Status by allocations areas (Ratio = Waiting List : Houses Allocated)
A+ A B C Total Kippen, Arnprior
0 1 1 3 5 19:1
D. All Approved Planning Applications 2001-2010 (Stirling Council Data 2011)
House 1 bed
House 2 bed
House 3 bed
House 4+ bed
Total Houses
Flat1 bed
Flat2 bed
Flat3 bed
Flat4+ bed
TotalFlats
8 % 26 % 30 % 36 % 53 67 % 0 % 33 % 0 % 12
24 This is the number of applicants who identify this area as their preferred choice and/or live in the area and/or have a ‘social inclusion/ community reason for moving’ to the area. Because applicants can apply for any number of the 56 allocation areas in the Stirling Council area, a larger number of applicants will have included this area amongst their multiple choices.

Stirling Council’s Local Housing StrategyLHS Area Profiles 2011
2
Stirling Council’s Local Housing StrategyLHS Area Profiles 2011
3
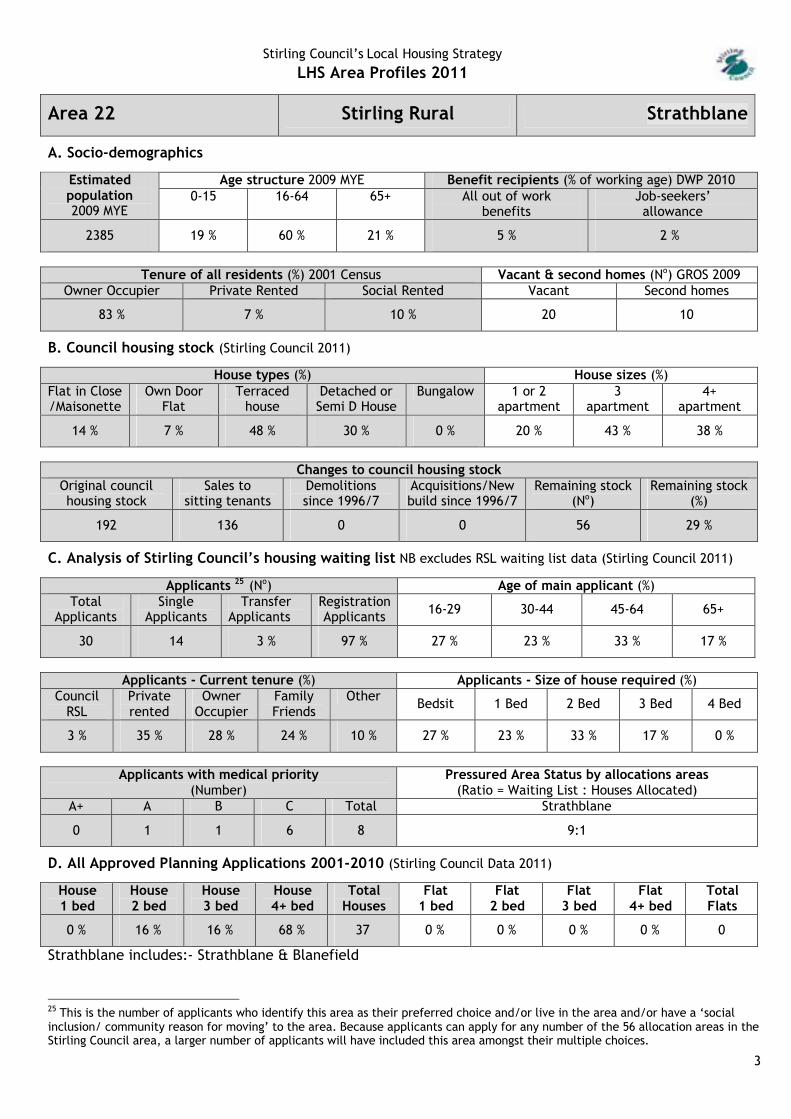
Area 22 Stirling Rural Strathblane
A. Socio-demographics
Age structure 2009 MYE Benefit recipients (% of working age) DWP 2010Estimated population2009 MYE
0-15 16-64 65+ All out of work benefits
Job-seekers’ allowance
2385 19 % 60 % 21 % 5 % 2 %
Tenure of all residents (%) 2001 Census Vacant & second homes (No) GROS 2009Owner Occupier Private Rented Social Rented Vacant Second homes
83 % 7 % 10 % 20 10
B. Council housing stock (Stirling Council 2011)
House types (%) House sizes (%)Flat in Close /Maisonette
Own Door Flat
Terraced house
Detached or Semi D House
Bungalow 1 or 2 apartment
3 apartment
4+ apartment
14 % 7 % 48 % 30 % 0 % 20 % 43 % 38 %
Changes to council housing stock Original council housing stock
Sales to sitting tenants
Demolitionssince 1996/7
Acquisitions/New build since 1996/7
Remaining stock(No)
Remaining stock(%)
192 136 0 0 56 29 %
C. Analysis of Stirling Council’s housing waiting list NB excludes RSL waiting list data (Stirling Council 2011)
Applicants 25 (No) Age of main applicant (%)Total
ApplicantsSingle
ApplicantsTransfer
ApplicantsRegistrationApplicants 16-29 30-44 45-64 65+
30 14 3 % 97 % 27 % 23 % 33 % 17 %
Applicants - Current tenure (%) Applicants - Size of house required (%)Council
RSLPrivate rented
Owner Occupier
FamilyFriends
Other Bedsit 1 Bed 2 Bed 3 Bed 4 Bed
3 % 35 % 28 % 24 % 10 % 27 % 23 % 33 % 17 % 0 %
Applicants with medical priority (Number)
Pressured Area Status by allocations areas (Ratio = Waiting List : Houses Allocated)
A+ A B C Total Strathblane
0 1 1 6 8 9:1
D. All Approved Planning Applications 2001-2010 (Stirling Council Data 2011)
House 1 bed
House 2 bed
House 3 bed
House 4+ bed
Total Houses
Flat1 bed
Flat2 bed
Flat3 bed
Flat4+ bed
TotalFlats
0 % 16 % 16 % 68 % 37 0 % 0 % 0 % 0 % 0
Strathblane includes:- Strathblane & Blanefield
25 This is the number of applicants who identify this area as their preferred choice and/or live in the area and/or have a ‘social inclusion/ community reason for moving’ to the area. Because applicants can apply for any number of the 56 allocation areas in the Stirling Council area, a larger number of applicants will have included this area amongst their multiple choices.

Stirling Council’s Local Housing StrategyLHS Area Profiles 2011
4
Stirling Council’s Local Housing StrategyLHS Area Profiles 2011
5
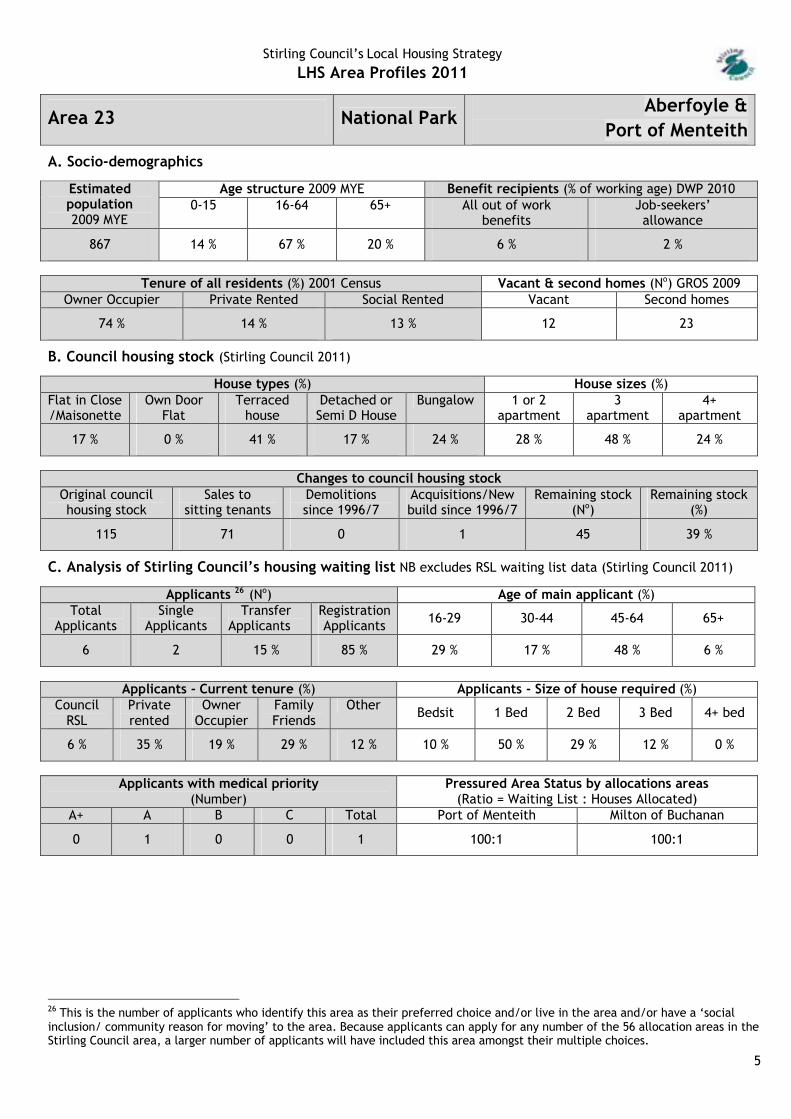
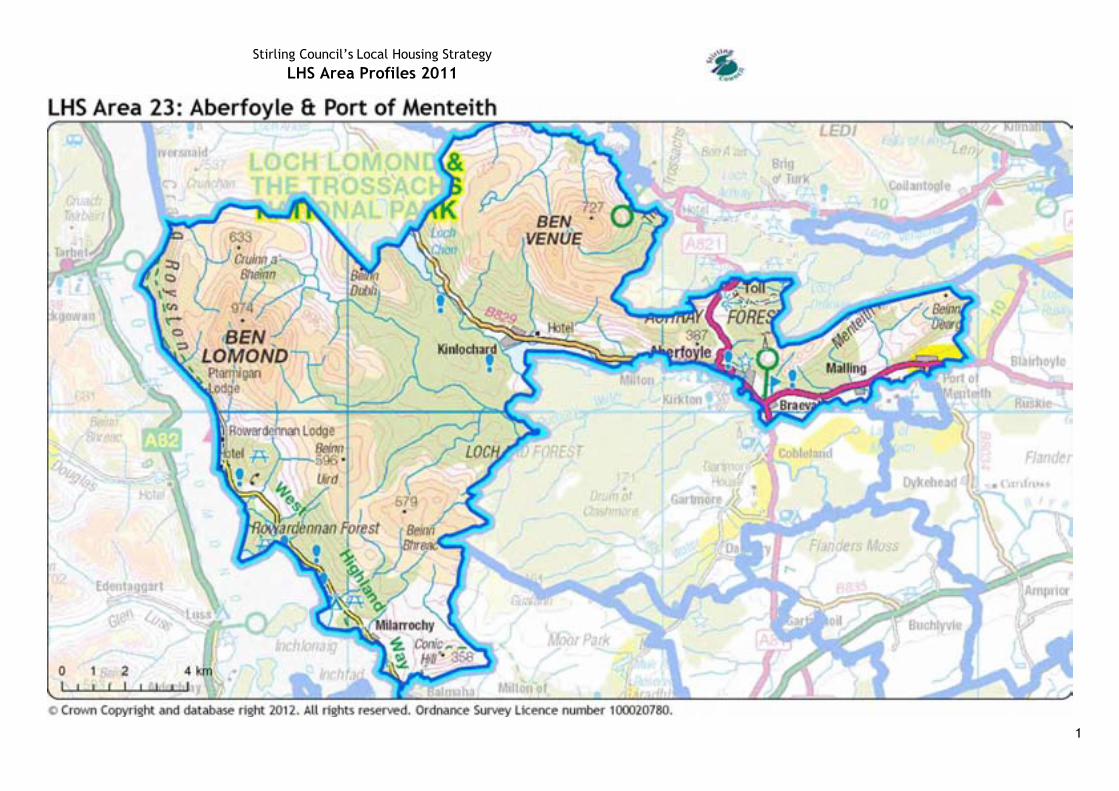
Area 23 National ParkAberfoyle &
Port of Menteith
A. Socio-demographics
Age structure 2009 MYE Benefit recipients (% of working age) DWP 2010Estimated population2009 MYE
0-15 16-64 65+ All out of work benefits
Job-seekers’ allowance
867 14 % 67 % 20 % 6 % 2 %
Tenure of all residents (%) 2001 Census Vacant & second homes (No) GROS 2009Owner Occupier Private Rented Social Rented Vacant Second homes
74 % 14 % 13 % 12 23
B. Council housing stock (Stirling Council 2011)
House types (%) House sizes (%)Flat in Close /Maisonette
Own Door Flat
Terraced house
Detached or Semi D House
Bungalow 1 or 2 apartment
3 apartment
4+ apartment
17 % 0 % 41 % 17 % 24 % 28 % 48 % 24 %
Changes to council housing stock Original council housing stock
Sales to sitting tenants
Demolitionssince 1996/7
Acquisitions/New build since 1996/7
Remaining stock(No)
Remaining stock(%)
115 71 0 1 45 39 %
C. Analysis of Stirling Council’s housing waiting list NB excludes RSL waiting list data (Stirling Council 2011)
Applicants 26 (No) Age of main applicant (%)Total
ApplicantsSingle
ApplicantsTransfer
ApplicantsRegistrationApplicants 16-29 30-44 45-64 65+
6 2 15 % 85 % 29 % 17 % 48 % 6 %
Applicants - Current tenure (%) Applicants - Size of house required (%)Council
RSLPrivate rented
Owner Occupier
FamilyFriends
Other Bedsit 1 Bed 2 Bed 3 Bed 4+ bed
6 % 35 % 19 % 29 % 12 % 10 % 50 % 29 % 12 % 0 %
Applicants with medical priority (Number)
Pressured Area Status by allocations areas (Ratio = Waiting List : Houses Allocated)
A+ A B C Total Port of Menteith Milton of Buchanan
0 1 0 0 1 100:1 100:1
26 This is the number of applicants who identify this area as their preferred choice and/or live in the area and/or have a ‘social inclusion/ community reason for moving’ to the area. Because applicants can apply for any number of the 56 allocation areas in the Stirling Council area, a larger number of applicants will have included this area amongst their multiple choices.
Stirling Council’s Local Housing StrategyLHS Area Profiles 2011
1

Stirling Council’s Local Housing StrategyLHS Area Profiles 2011
1
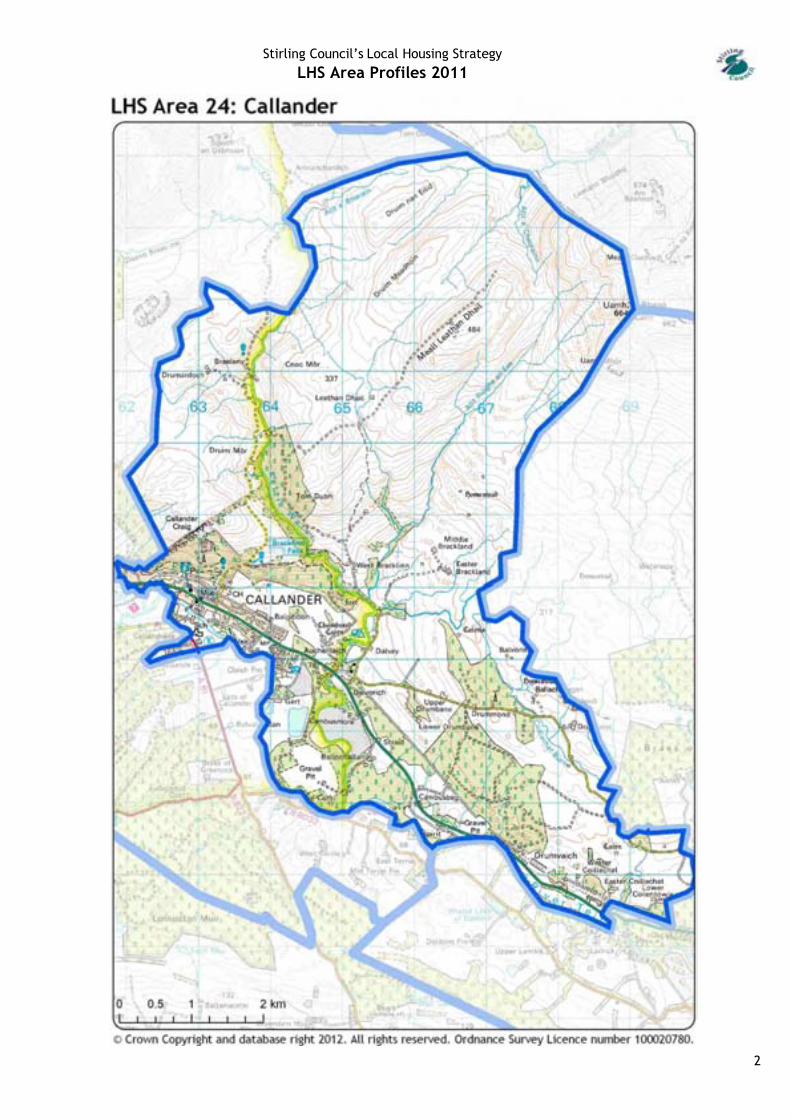
Area 24 National Park Callander
A. Socio-demographics
Age structure 2009 MYE Benefit recipients (% of working age) DWP 2010Estimated population2009 MYE
0-15 16-64 65+ All out of work benefits
Job-seekers’ allowance
3259 16 % 61 % 24 % 9 % 3 %
Tenure of all residents (%) 2001 Census Vacant & second homes (No) GROS 2009Owner Occupier Private Rented Social Rented Vacant Second homes
70 % 9 % 22 % 26 29
B. Council housing stock (Stirling Council 2011)
House types (%) House sizes (%)Flat in Close /Maisonette
Own Door Flat
Terraced house
Detached or Semi D House
Bungalow 1 or 2 apartment
3 apartment
4+ apartment
4 % 5 % 21 % 30 % 41 % 36 % 45 % 19 %
Changes to council housing stock Original council housing stock
Sales to sitting tenants
Demolitionssince 1996/7
Acquisitions/New build since 1996/7
Remaining stock(No)
Remaining stock(%)
319 164 0 0 155 49 %
C. Analysis of Stirling Council’s housing waiting list NB excludes RSL waiting list data (Stirling Council 2011)
Applicants 27 (No) Age of main applicant (%)Total
ApplicantsSingle
ApplicantsTransfer
ApplicantsRegistrationApplicants 16-29 30-44 45-64 65+
78 36 8 % 92 % 24 % 31 % 26 % 18 %
Applicants - Current tenure (%) Applicants - Size of house required (%)Council
RSLPrivate rented
Owner Occupier
FamilyFriends
Other Bedsit 1 Bed 2 Bed 3 Bed 4 Bed
18 % 38 % 16 % 23 % 6 % 24 % 31 % 26 % 18 % 1 %
Applicants with medical priority (Number)
Pressured Area Status by allocations areas (Ratio = Waiting List : Houses Allocated)
A+ A B C Total Callander
0 4 3 2 9 6:1
27 This is the number of applicants who identify this area as their preferred choice and/or live in the area and/or have a ‘social inclusion/ community reason for moving’ to the area. Because applicants can apply for any number of the 56 allocation areas in the Stirling Council area, a larger number of applicants will have included this area amongst their multiple choices.
Stirling Council’s Local Housing StrategyLHS Area Profiles 2011
2

Stirling Council’s Local Housing StrategyLHS Area Profiles 2011
3
Area 25 National Park Crianlarich & Tyndrum
A. Socio-demographics
Age structure 2009 MYE Benefit recipients (% of working age) DWP 2010Estimated population2009 MYE
0-15 16-64 65+ All out of work benefits
Job-seekers’ allowance
631 16 % 70 % 14 % 8 % 5 %
Tenure of all residents (%) 2001 Census Vacant & second homes (No) GROS 2009Owner Occupier Private Rented Social Rented Vacant Second homes
54 % 21 % 24 % 9 33
B. Council housing stock (Stirling Council 2011)
House types (%) House sizes (%)Flat in Close /Maisonette
Own Door Flat
Terraced house
Detached or Semi D House
Bungalow 1 or 2 apartment
3 apartment
4+ apartment
0 % 0 % 37 % 26 % 37 % 26 % 63 % 11 %
Changes to council housing stock Original council housing stock
Sales to sitting tenants
Demolitionssince 1996/7
Acquisitions/New build since 1996/7
Remaining stock(No)
Remaining stock(%)
33 14 0 0 19 58 %
C. Analysis of Stirling Council’s housing waiting list NB excludes RSL waiting list data (Stirling Council 2011)
Applicants 28 (No) Age of main applicant (%)Total
ApplicantsSingle
ApplicantsTransfer
ApplicantsRegistrationApplicants 16-29 30-44 45-64 65+
9 4 11 % 89 % 11 % 45 % 43 % 0 %
Applicants - Current tenure (%) Applicants - Size of house required (%)Council
RSLPrivate rented
Owner Occupier
FamilyFriends
Other Bedsit 1 Bed 2 Bed 3 Bed 4 Bed
32 % 32 % 24 % 13 % 0 % 11 % 45 % 43 % 0 % 0 %
Applicants with medical priority (Number)
Pressured Area Status by allocations areas (Ratio = Waiting List : Houses Allocated)
A+ A B C Total Crianlarich & Tyndrum Balquhidder, Strathyre & Lochearnhead
0 0 0 1 1 5:1 5:1
28 This is the number of applicants who identify this area as their preferred choice and/or live in the area and/or have a ‘social inclusion/ community reason for moving’ to the area. Because applicants can apply for any number of the 56 allocation areas in the Stirling Council area, a larger number of applicants will have included this area amongst their multiple choices.

Stirling Council’s Local Housing StrategyLHS Area Profiles 2011
4

Stirling Council’s Local Housing StrategyLHS Area Profiles 2011
5
Area 26 National ParkDrymen, Croftamie
& Balmaha
A. Socio-demographics
Age structure 2009 MYE Benefit recipients (% of working age) DWP 2010Estimated population2009 MYE
0-15 16-64 65+ All out of work benefits
Job-seekers’ allowance
1682 19 % 59 % 22 % 6 % 2 %
Tenure of all residents (%) 2001 Census Vacant & second homes (No) GROS 2009Owner Occupier Private Rented Social Rented Vacant Second homes
74 % 13 % 13 % 28 9
B. Council housing stock (Stirling Council 2011)
House types (%) House sizes (%)Flat in Close /Maisonette
Own Door Flat
Terraced house
Detached or Semi D House
Bungalow 1 or 2 apartment
3 apartment
4+ apartment
7 % 5 % 20 % 49 % 18 % 27 % 33 % 40 %
Changes to council housing stock Original council housing stock
Sales to sitting tenants
Demolitionssince 1996/7
Acquisitions/New build since 1996/7
Remaining stock(No)
Remaining stock(%)
157 104 0 2 55 35 %
C. Analysis of Stirling Council’s housing waiting list NB excludes RSL waiting list data (Stirling Council 2011)
Applicants 29 (No) Age of main applicant (%)Total
ApplicantsSingle
ApplicantsTransfer
ApplicantsRegistrationApplicants 16-29 30-44 45-64 65+
17 4 6 % 94 % 11 % 26 % 45 % 18 %
Applicants - Current tenure (%) Applicants - Size of house required (%)Council
RSLPrivate rented
Owner Occupier
FamilyFriends
Other Bedsit 1 Bed 2 Bed 3 Bed 4 Bed
20 % 41 % 25 % 14 % 1 % 11 % 25 % 45 % 18 % 1 %
Applicants with medical priority (Number)
Pressured Area Status by allocations areas (Ratio = Waiting List : Houses Allocated)
A+ A B C Total Drymen Croftamie Milton of Buchanan
0 1 0 1 2 21:1 100:1 100:1
Drymen, Croftamie & Balmaha includes:- Croftamie, Drymen, Balmaha Milton Of Buchanan & Buchanan Smithy
29 This is the number of applicants who identify this area as their preferred choice and/or live in the area and/or have a ‘social inclusion/ community reason for moving’ to the area. Because applicants can apply for any number of the 56 allocation areas in the Stirling Council area, a larger number of applicants will have included this area amongst their multiple choices.

Stirling Council’s Local Housing StrategyLHS Area Profiles 2011
6

Stirling Council’s Local Housing StrategyLHS Area Profiles 2011
7
Area 27 National Park Gartmore
A. Socio-demographics
Age structure 2009 MYE Benefit recipients (% of working age) DWP 2010Estimated population2009 MYE
0-15 16-64 65+ All out of work benefits
Job-seekers’ allowance
1002 21 % 62 % 17 % 6 % 2 %
Tenure of all residents (%) 2001 Census Vacant & second homes (No) GROS 2009Owner Occupier Private Rented Social Rented Vacant Second homes
76 % 8 % 15 % 13 10
B. Council housing stock (Stirling Council 2011)
House types (%) House sizes (%)Flat in Close /Maisonette
Own Door Flat
Terraced house
Detached or Semi D House
Bungalow 1 or 2 apartment
3 apartment
4+ apartment
8 % 42 % 4 % 42 % 4 % 42 % 29 % 29 %
Changes to council housing stock Original council housing stock
Sales to sitting tenants
Demolitionssince 1996/7
Acquisitions/New build since 1996/7
Remaining stock(No)
Remaining stock(%)
18 10 0 0 8 44 %
C. Analysis of Stirling Council’s housing waiting list NB excludes RSL waiting list data (Stirling Council 2011)
Applicants 30 (No) Age of main applicant (%)Total
ApplicantsSingle
ApplicantsTransfer
ApplicantsRegistrationApplicants 16-29 30-44 45-64 65+
15 6 7 % 93 % 28 % 13 % 35 % 24 %
Applicants - Current tenure (%) Applicants - Size of house required (%)Council
RSLPrivate rented
Owner Occupier
FamilyFriends
Other Bedsit 1 Bed 2 Bed 3 Bed 4 Bed
5 % 28 % 22 % 37 % 9 % 28 % 13 % 35 % 24 % 0 %
Applicants with medical priority (Number)
Pressured Area Status by allocations areas (Ratio = Waiting List : Houses Allocated)
A+ A B C Total Gartmore & Aberfoyle
0 1 0 1 2 13:1
30 This is the number of applicants who identify this area as their preferred choice and/or live in the area and/or have a ‘social inclusion/ community reason for moving’ to the area. Because applicants can apply for any number of the 56 allocation areas in the Stirling Council area, a larger number of applicants will have included this area amongst their multiple choices.

Stirling Council’s Local Housing StrategyLHS Area Profiles 2011
1

Stirling Council’s Local Housing StrategyLHS Area Profiles 2011
1
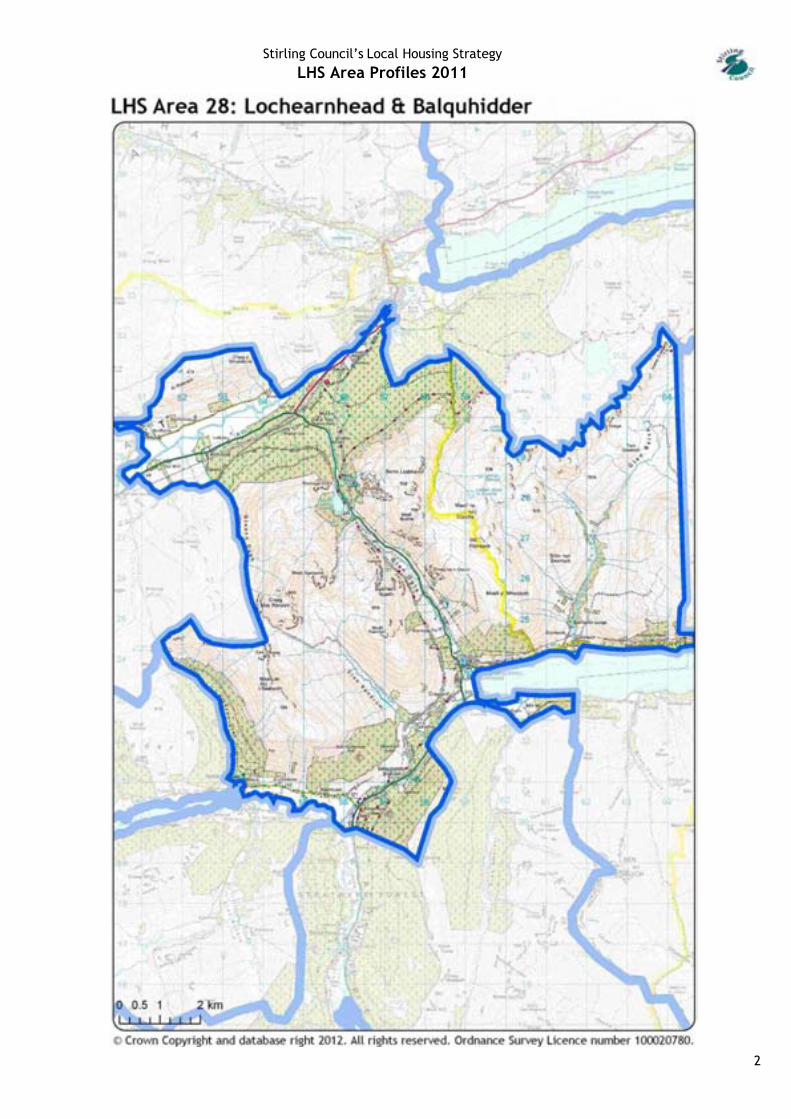
Area 28 National ParkLochearnhead &
Balquhidder
A. Socio-demographics
Age structure 2009 MYE Benefit recipients (% of working age) DWP 2010Estimated population2009 MYE
0-15 16-64 65+ All out of work benefits
Job-seekers’ allowance
820 14 % 64 % 22 % 10 % 3 %
Tenure of all residents (%) 2001 Census Vacant & second homes (No) GROS 2009Owner Occupier Private Rented Social Rented Vacant Second homes
73 % 9 % 18 % 15 55
B. Council housing stock (Stirling Council 2011)
House types (%) House sizes (%)Flat in Close /Maisonette
Own Door Flat
Terraced house
Detached or Semi D House
Bungalow 1 or 2 apartment
3 apartment
4+ apartment
3 % 3 % 39 % 29 % 26 % 10 % 77 % 13 %
Changes to council housing stock Original council housing stock
Sales to sitting tenants
Demolitionssince 1996/7
Acquisitions/New build since 1996/7
Remaining stock(No)
Remaining stock(%)
24 13 0 0 11 46 %
C. Analysis of Stirling Council’s housing waiting list NB excludes RSL waiting list data (Stirling Council 2011)
Applicants 31 (No) Age of main applicant (%)Total
ApplicantsSingle
ApplicantsTransfer
ApplicantsRegistrationApplicants 16-29 30-44 45-64 65+
12 2 21 % 79 % 41 % 11 % 27 % 21 %
Applicants - Current tenure (%) Applicants - Size of house required (%)Council
RSLPrivate rented
Owner Occupier
FamilyFriends
Other Bedsit 1 Bed 2 Bed 3 Bed 4 Bed
28 % 29 % 9 % 24 % 11 % 41 % 11 % 27 % 21 % 0 %
Applicants with medical priority (Number)
Pressured Area Status by allocations areas (Ratio = Waiting List : Houses Allocated)
A+ A B C Total Balquhidder & Lochearnhead
0 0 0 1 1 5:1
31 This is the number of applicants who identify this area as their preferred choice and/or live in the area and/or have a ‘social inclusion/ community reason for moving’ to the area. Because applicants can apply for any number of the 56 allocation areas in the Stirling Council area, a larger number of applicants will have included this area amongst their multiple choices.
Stirling Council’s Local Housing StrategyLHS Area Profiles 2011
2

Stirling Council’s Local Housing StrategyLHS Area Profiles 2011
3
Area 29 National Park Strathyre & Trossachs
A. Socio-demographics
Age structure 2009 MYE Benefit recipients (% of working age) DWP 2010Estimated population2009 MYE
0-15 16-64 65+ All out of work benefits
Job-seekers’ allowance
630 15 % 63 % 22 % 5 % 1 %
Tenure of all residents (%) 2001 Census Vacant & second homes (No) GROS 2009Owner Occupier Private Rented Social Rented Vacant Second homes
77 % 15 % 8 % 16 31
B. Council housing stock (Stirling Council 2011)
House types (%) House sizes (%)Flat in Close /Maisonette
Own Door Flat
Terraced house
Detached or Semi D House
Bungalow 1 or 2 apartment
3 apartment
4+ apartment
There are no council houses in this area
Changes to council housing stock Original council housing stock
Sales to sitting tenants
Demolitionssince 1996/7
Acquisitions/New build since 1996/7
Remaining stock(No)
Remaining stock(%)
There are no council houses in this area
C. Analysis of Stirling Council’s housing waiting list NB excludes RSL waiting list data (Stirling Council 2011)
NB Although there are no council houses in the area, 9 applicants have indicated that they would like to live there. This is a guide for all those seeking to provide affordable housing in the area.
Applicants 32 (No) Age of main applicant (%)Total
ApplicantsSingle
ApplicantsTransfer
ApplicantsRegistrationApplicants 16-29 30-44 45-64 65+
9 4 8 % 92 % 24 % 30 % 27 % 18 %
Applicants - Current tenure (%) Applicants - Size of house required (%)Council
RSLPrivate rented
Owner Occupier
FamilyFriends
Other Bedsit 1 Bed 2 Bed 3 Bed 4 Bed
18 % 38 % 16 % 22 % 6 % 24 % 30 % 27 % 18 % 1 %
Applicants with medical priority (Number)
Pressured Area Status by allocations areas (Ratio = Waiting List : Houses Allocated)
A+ A B C Total
0 1 0 0 1There are no council houses in this area
32 This is the number of applicants who identify this area as their preferred choice and/or live in the area and/or have a ‘social inclusion/ community reason for moving’ to the area. Because applicants can apply for any number of the 56 allocation areas in the Stirling Council area, a larger number of applicants will have included this area amongst their multiple choices.

Stirling Council’s Local Housing StrategyLHS Area Profiles 2011
4


