

Designing and implementing a Liability Driven Investment strategy is no small task but given the dire state of many pension funds around the globe it is an important and topical subject. This paper focuses on the design of an LDI strategy for the purposes of hedging inflation and interest rate risk present in the liabilities of a defined benefit pension fund. We show that the asset allocation matters crucially in determining the optimal hedge ratios, and that adding hedges may even adversely affect the risk profile in case the asset allocation is omitted from the design of the hedges.
Liability Driven Investing: Hedging Inflation And Interest Rate Risk
Issue
5November 2012
Multi-Asset Solutions Research Papers

2
LIABILITY DRIVEN INVESTING: HEDGING INFLATION AND INTEREST RATE RISK
MULTI-ASSET SOLUTIONS RESEARCH PAPERS – ISSUE 5
Liability Driven Investing
The concept of Liability Driven Investing (LDI) is not new. In fact, every pension plan and
insurance company is a liability driven investor. In many cases the phrase LDI is used
interchangeably with Asset-Liability Management (ALM). However, ALM should be defined
much more broadly. It addresses the inter-related management of the assets and liabilities
on the balance sheet, accounting for future uncertainties, multiple stakeholders and multiple
objectives. Providers of insurance and pension plans are vulnerable to shocks on both the asset
and the liability side of the balance sheet and require an integrated asset and liability approach
to manage that. LDI, like ALM, is a framework for considering the assets of a pension plan or
insurance company in the context of liabilities. In contrast however, LDI is a subset of ALM and
focuses on the risk to the surplus (or deficit) from market factors that impact the valuation of the
liabilities.
Specifically, an LDI strategy usually entails a derivative overlay attempting to “hedge” the
movements in liabilities due to inflation and interest rates. This is not to say that it replaces the
Strategic Asset Allocation (SAA) decision. In fact, in this paper we show that the asset allocation
is actually critical to determine the appropriate LDI strategy. Ideally, the SAA should not be a
given but should be determined in one consistent fully integrated analysis, which would actually
bring us back into the world of ALM 1.
Apart from the SAA numerous factors play a role in the design of an LDI strategy in practice; the
structure and valuation methodology of the liabilities, the risk perception of the stakeholders,
the funded status, counterparty risk and liquidity risk, to name a few 2.
While all these factors are important topics that deserve attention we will in this paper focus
on the impact of the existing SAA on the LDI strategy. In particular we will quantify the impact
of the asset allocation of a pension plan on the appropriate hedge ratio 3 when considering the
exposure of the liabilities to changes in inflation and interest rates. While the general concept
applies globally we will use the Australian market as an example in this paper.
Structure of Australia’s Superannuation Market
Much has been written in recent times about the dire state of defined benefit pension funds
and subsequent funding levels globally4. Low yields, falling asset values and, in some markets,
increasing inflation have combined to lead to a deterioration in the solvency of many plans. Note
that in most cases these reports are referencing the accounting position of the plan and the
impact on the plans’ sponsors’ balance sheet. Numbers reported in the mainstream Australian
press suggest that the pension deficit of Australia’s 20 largest companies is in the vicinity
of AUD7bn 5. Australia has not only a defined benefit pension system, but also a significant
defined contribution framework. In addition to this, there are so-called hybrid funds, which
have both defined benefit and defined contribution members. Estimates of the assets held in
the superannuation industry suggest that 62% of assets are held in defined contribution funds,
5.5% are held in defined benefit funds and 33.5% are held in hybrid funds 6. Many pure defined
The appropriate design of an LDI strategy requires an understanding of the existing asset structure.

3
LIABILITY DRIVEN INVESTING: HEDGING INFLATION AND INTEREST RATE RISK
MULTI-ASSET SOLUTIONS RESEARCH PAPERS – ISSUE 5
benefit pension plans are closed to new members, so going forward it is to be expected that
defined contribution systems, potentially with some hybrid features as add-ons, will prevail.
Liabilities and Discounting Methods
Liabilities, like asset prices, evolve through time and are not known with certainty. Liabilities for
pension funds are based on a number of assumptions and expectations.
In the case of defined benefit funds, the notion of liability represents the sum of the present
values of accrued annuity rights for all participants. As such it needs to incorporate the full
structure of the pension fund, including the expected demographics, accrual of rights over
time, actuarial factors and assumptions and other scheme-specific details. In addition, to model
development of the liabilities over time one needs to make assumptions on career paths and
turn-over of participants as well.
Furthermore, economic assumptions also play a role. Assumptions surrounding the term
structure of interest rates are incorporated into the construction of the expected cash flows that
make up the liabilities now. Inflation expectations, both wage and CPI also play a critical role in
determining expected future cash-flows for many pension plans. For an active participant, whose
employer indexes salary to wage inflation, expectations regarding wage inflation determine
annuity rights going forward. An active participant that retires usually is entitled to have his
pension payments indexed to headline CPI in Australia from that moment on 7. Depending on
the actuarial valuation methodology at hand, making assumptions around future realisations of
CPI and wage inflation are usually unavoidable in determining liabilities.
In determining the liabilities as present values one requires a determination of the appropriate
discount rate. In order to assess the funded status of a pension fund one usually looks at the
funding level, assets over liabilities, or the surplus, assets minus liabilities. It is not uncommon for
three different discounting methods to be used:
1. Funding or Solvency position
In this method the discount rate for the liabilities is set to be equal to the expected long term
return of the portfolio of assets backing the liabilities. This long term expected return follows
from long term return assumptions for each asset class and the strategic asset allocation
weights. A significant change to the SAA has implications for the discount rate and hence can
impact the solvency position of the pension plan. The Superannuation Industry (Supervision)
Regulations (1994) is the governing legislation here.
Liabilities are complex, valuation methods vary and impact assessment of funded status as well.
1 See the MAS Research Paper Issue 2, “Integrated Approach to ALM, Risk Budgeting and Alpha”
2 Mathematically, the market for liabilities is known as incomplete, see (Baxter and Rennie 1996) and references therein. They conclude there do not exist any available asset classes to fully hedge the liabilities. This is despite the advent of so-called longevity swaps.
3 Measured as the fraction of liabilities that is being “neutralised” through an overlay strategy
4 See, for example, Milliman, 2012; Towers Watson, 2011; The PEW Center of the States, 2012.
5 See article Sydney Morning Herald, 24 April 2012, Defined benefit super schemes $7b in the red, : http://www.smh.com.au/business/defined-benefit-super-schemes-7b-in-the-red-20120423-1xhck.html
6 See IbisWorld Industry Report, 2009.
7 Note that many funds have a built in floor in the cashflow in the event of decreasing or negative inflation. That is, pension payments do not decrease but rather they stay constant and then there is a period of clawback.

4
LIABILITY DRIVEN INVESTING: HEDGING INFLATION AND INTEREST RATE RISK
MULTI-ASSET SOLUTIONS RESEARCH PAPERS – ISSUE 5
2. Accounting position
The accounting treatment of the liabilities usually relies on a sovereign government bond
yield, as is the case in Australia. In some other jurisdictions high quality corporate bond yields
are used. For example, AASB119 sets out the accounting standards for employee benefits 8.
There is discussion in the industry about moving to a semi-government bond for the purposes
of calculating the accounting position, questioning the prudency of corporate bond valuation
assumptions 9.
3. Economic position
For the purposes of valuing the liabilities economically, most market participants use the
interest rate swap curve. This recognises that annuity-type pension obligations are not all paid
in one year but rather are spread over a number of years.
Designing an LDI Overlay Strategy
Prior to implementing any LDI strategy it is critical to understand the ultimate goal of the
stakeholders. This goal can be to protect the current funding position from movements in
market risk factors or to reduce the volatility on the balance sheet of the sponsor. Mostly it is a
combination of the above.
Ill-defined goals may lead to contradictory objectives. Therefore a full understanding of the
purposes of an LDI strategy needs to be established, including making trade-offs where
necessary. The optimal LDI strategy that minimises the volatility of the current funding position
may well have undesirable characteristics when looked at through the prism of the sponsor’s
balance sheet.
In order to arrive at this point we need to model the liabilities and their evolution in sufficient
detail in order to create the basis for the LDI design. Any flexibility that may exist in altering the
underlying asset allocation also needs to be taken into account as this provides an additional
important degree of freedom in meeting the LDI design’s objectives and can have critically
important consequences in the final constellation of hedges to be used.
This paper focuses on designing and deriving the appropriate optimised hedge ratios when
considering inflation and interest rates risks inherent in the underlying liabilities. In our case study
we will focus on the objective of protecting the downside to the funding level of the pension
plan. This particular objective requires a stochastic simulation approach.
Before we go into our case study we will start with a much simpler case that is very informative
with regard to the factors that play a role and conceptually very elegant. Let us take as the
objective to find the hedge ratio that minimises the volatility of the surplus. The determination
of an optimal hedge ratio can in this case be conceptualised geometrically. Figure 1 is a
geometric vector representation of the assets A, liabilities L and hedge H, whose volatilities σA,σL and σH respectively are represented by the length of each vector and the correlation
8 AASB 119 requires employee benefit provisions to be discounted to their present value using a discount rate determined by reference to market yields at the end of the reporting period on high quality corporate bonds. In countries where there is no deep market in such bonds, the market yields at the end of the reporting period on government bonds shall be used, www.aasb.gov.au.
9 See Qantas Appendix 4D and Consolidated Interim Financial Report, Half Year ended 31 December 2011.
Key to designing an LDI strategy is a clear understanding of what stakeholders are trying to achieve.

5
LIABILITY DRIVEN INVESTING: HEDGING INFLATION AND INTEREST RATE RISK
MULTI-ASSET SOLUTIONS RESEARCH PAPERS – ISSUE 5
between the assets and liabilities is represented by the angle between these two. Minimising
the surplus volatility is then equivalent to finding a portfolio H such that the vector A+H - L has
minimum length.
Figure 1: Stylised representation of matching
Define the hedge portfolio H as a fraction of L, H=πL, where π is the hedge ratio that we seek
to optimise. Assuming the assets A and liabilities L have correlation ρ(L,A) it follows from simple
geometry 10 that the optimal hedge ratio can then be written as
From this, it is easy to see the following relationships between the hedge ratio and the
correlation ρ(L,A) between the assets and liabilities:
– For ρ(L,A)>0, the hedge ratio is less than 100%.
– For ρ(L,A)=0, the hedge ratio is equal to 100%.
– For ρ(L,A)<0, the hedge ratio is greater than 100%.
Note that this result does not automatically generalise to the funding level case. Minimising
worst case funding levels is much more complex and simulations are required as an analytical
approach no longer suffices.
The Hedge Ratio for Funding Levels – Case Study
We start with a defined benefit pension plan with a 100% initial funding level. Our aim
conceptually is to find a hedge ratio that minimises the likelihood that the funding level falls
below this initial level. In other words our aim is to find a hedge ratio such that our market value
of the assets is at least equivalent to the economic value of the liabilities. In this section, we
10 This can also be easily derived algebraically by minimising the variance of A+H-L, making use of the standard formulas for the variance and differentiating with respect to π.
The Participant Grid captures any participant in two dimensions and serves as the basis for the design, adding additional dimensions for each point in the grid.
100%- ρ(L,A). σAσL
Weight (%)
0
10
20
30
40
50
60
70
80
90
100
Expected Return (%)
4.0 4.5 5.0 5.5 5.9 6.4 6.9 7.4 7.9 8.4
Australian Bonds Australian Equities World Equities Emerging Markets Equities
80.0
82.0
84.0
86.0
88.0
90.0
92.0
94.0
96.0
98.0
100.0
100.0 101.0 102.0 103.0 104.0 105.0 106.0 107.0 108.0
Risk
Cri
teri
on: 5
% W
orst
Cas
e Fu
ndin
g L
evel
Risk
Cri
teri
on: 5
% W
orst
Cas
e Fu
ndin
g L
evel
Risk
Cri
teri
on: 5
% W
orst
Cas
e Fu
ndin
g L
evel
Risk
Cri
teri
on: 5
% W
orst
Cas
e Fu
ndin
g L
evel
Risk
Cri
teri
on: 5
% W
orst
Cas
e Fu
ndin
g L
evel
Risk
Cri
teri
on: 5
% W
orst
Cas
e Fu
ndin
g L
evel
Risk
Cri
teri
on: 5
% W
orst
Cas
e Fu
ndin
g L
evel
Objective: Expected Funding Level
AR
MR
93.0
93.5
94.0
94.5
95.0
95.5
96.0
101.5 101.7 101.9 102.1 102.3 102.5 102.7 102.9
101.5 101.7 101.9 102.1 102.3 102.5 102.7 102.9
Objective: Expected Funding Level
Interest Rate Hedge Range (0, 25, 50, 75, 100)
Objective: Expected Funding Level
101.5 101.7 101.9 102.1 102.3 102.5 102.7 102.9
Objective: Expected Funding Level
Objective: Expected Funding Level
Inflation Rate Hedge Range (0, 25, 50, 75, 100)
MR
93.0
94.0
95.0
96.0
97.0
98.0
99.0
MR
93.0
94.0
95.0
96.0
97.0
98.0
99.0
IR Hedge Range (0, 25, 50, 75, 100) Inflation Hedge Range (0, 25, 50, 75, 100) IR-Inflation Combi Range
Objective: Expected Funding Level
IR Hedge Range (0, 25, 50, 75, 100) Inflation Hedge Range (0, 25, 50, 75, 100) IR-Inflation Combi Range
MR
89.5
90.0
90.5
91.0
91.5
92.0
92.5
93.0
104.5 104.6 104.7 104.8 104.9 105 105.1 105.2 105.3 105.4 105.5
104.5 104.6 104.7 104.8 104.9 105 105.1 105.2 105.3 105.4 105.5
104.6 104.6 104.8 104.9 104.9 105 105.1 105.2 105.3 105.4 105.5
IR Hedge Range (0, 25, 50, 75, 100)
Objective: Expected Funding Level
Inflation Hedge Range (0, 25, 50, 75, 100)
89.5
90.0
90.5
91.0
91.5
92.0
92.5
93.0
AR
AR
89.5
90.0
90.5
91.0
91.5
92.0
92.5
93.0
AR
Optimal Hedge
Liabilities
Assetsφ:cos(φ) =
Optimal Hedge
Liabilities
Assets
ρ(L,A)
MR: Minimum Risk Portfolio AR: Acceptable Risk Portfolio Objective: Expected Funding Level (scale 1:0.01) Risk Criterion: 5% Worst Case Funding Level (scale 1:0.01)
MR: Minimum Risk Portfolio AR: Acceptable Risk Portfolio Objective: Expected Funding Level (scale 1:0.01) Risk Criterion: 5% Worst Case Funding Level (scale 1:0.01)
MR: Minimum Risk Portfolio Objective: Expected Funding Level (scale 1:0.01) Risk Criterion: 5% Worst Case Funding Level (scale 1:0.01)
MR: Minimum Risk Portfolio Objective: Expected Funding Level (scale 1:0.01) Risk Criterion: 5% Worst Case Funding Level (scale 1:0.01)
AR: Acceptable Risk Portfolio Objective: Expected Funding Level (scale 1:0.01) Risk Criterion: 5% Worst Case Funding Level (scale 1:0.01)
AR: Acceptable Risk Portfolio Objective: Expected Funding Level (scale 1:0.01) Risk Criterion: 5% Worst Case Funding Level (scale 1:0.01)
AR: Acceptable Risk Portfolio Objective: Expected Funding Level (scale 1:0.01) Risk Criterion: 5% Worst Case Funding Level (scale 1:0.01)
6
LIABILITY DRIVEN INVESTING: HEDGING INFLATION AND INTEREST RATE RISK
MULTI-ASSET SOLUTIONS RESEARCH PAPERS – ISSUE 5
show simulated results for the funding level whilst varying the hedge ratio. We assume that the
plan’s liabilities are entirely linked to price inflation through indexation.
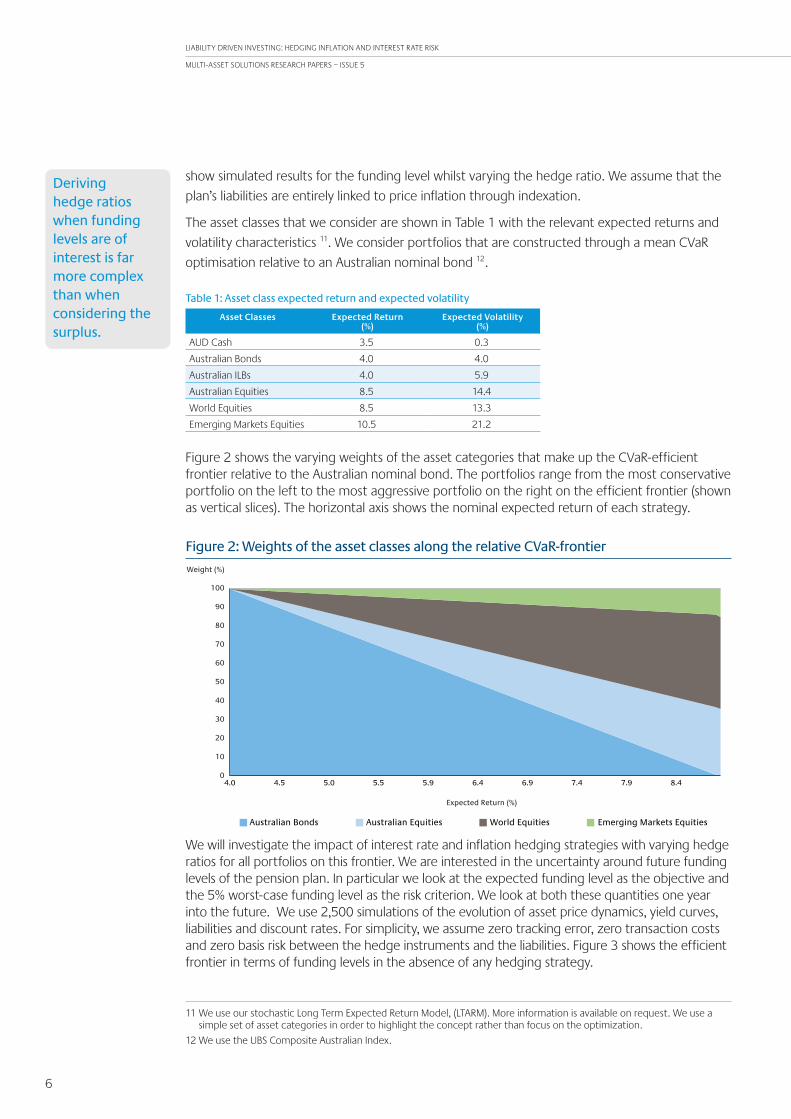
The asset classes that we consider are shown in Table 1 with the relevant expected returns and
volatility characteristics 11. We consider portfolios that are constructed through a mean CVaR
optimisation relative to an Australian nominal bond 12.
Table 1: Asset class expected return and expected volatility
Asset Classes Expected Return(%)
Expected Volatility(%)
AUD Cash 3.5 0.3
Australian Bonds 4.0 4.0
Australian ILBs 4.0 5.9
Australian Equities 8.5 14.4
World Equities 8.5 13.3
Emerging Markets Equities 10.5 21.2
Figure 2 shows the varying weights of the asset categories that make up the CVaR-efficient frontier relative to the Australian nominal bond. The portfolios range from the most conservative portfolio on the left to the most aggressive portfolio on the right on the efficient frontier (shown as vertical slices). The horizontal axis shows the nominal expected return of each strategy.
Figure 2: Weights of the asset classes along the relative CVaR-frontier
We will investigate the impact of interest rate and inflation hedging strategies with varying hedge ratios for all portfolios on this frontier. We are interested in the uncertainty around future funding levels of the pension plan. In particular we look at the expected funding level as the objective and the 5% worst-case funding level as the risk criterion. We look at both these quantities one year into the future. We use 2,500 simulations of the evolution of asset price dynamics, yield curves, liabilities and discount rates. For simplicity, we assume zero tracking error, zero transaction costs and zero basis risk between the hedge instruments and the liabilities. Figure 3 shows the efficient frontier in terms of funding levels in the absence of any hedging strategy.
Deriving hedge ratios when funding levels are of interest is far more complex than when considering the surplus.
Weight (%)
0
10
20
30
40
50
60
70
80
90
100
Expected Return (%)
4.0 4.5 5.0 5.5 5.9 6.4 6.9 7.4 7.9 8.4
Australian Bonds Australian Equities World Equities Emerging Markets Equities
80.0
82.0
84.0
86.0
88.0
90.0
92.0
94.0
96.0
98.0
100.0
100.0 101.0 102.0 103.0 104.0 105.0 106.0 107.0 108.0
Risk
Cri
teri
on: 5
% W
orst
Cas
e Fu
ndin
g L
evel
Risk
Cri
teri
on: 5
% W
orst
Cas
e Fu
ndin
g L
evel
Risk
Cri
teri
on: 5
% W
orst
Cas
e Fu
ndin
g L
evel
Risk
Cri
teri
on: 5
% W
orst
Cas
e Fu
ndin
g L
evel
Risk
Cri
teri
on: 5
% W
orst
Cas
e Fu
ndin
g L
evel
Risk
Cri
teri
on: 5
% W
orst
Cas
e Fu
ndin
g L
evel
Risk
Cri
teri
on: 5
% W
orst
Cas
e Fu
ndin
g L
evel
Objective: Expected Funding Level
AR
MR
93.0
93.5
94.0
94.5
95.0
95.5
96.0
101.5 101.7 101.9 102.1 102.3 102.5 102.7 102.9
101.5 101.7 101.9 102.1 102.3 102.5 102.7 102.9
Objective: Expected Funding Level
Interest Rate Hedge Range (0, 25, 50, 75, 100)
Objective: Expected Funding Level
101.5 101.7 101.9 102.1 102.3 102.5 102.7 102.9
Objective: Expected Funding Level
Objective: Expected Funding Level
Inflation Rate Hedge Range (0, 25, 50, 75, 100)
MR
93.0
94.0
95.0
96.0
97.0
98.0
99.0
MR
93.0
94.0
95.0
96.0
97.0
98.0
99.0
IR Hedge Range (0, 25, 50, 75, 100) Inflation Hedge Range (0, 25, 50, 75, 100) IR-Inflation Combi Range
Objective: Expected Funding Level
IR Hedge Range (0, 25, 50, 75, 100) Inflation Hedge Range (0, 25, 50, 75, 100) IR-Inflation Combi Range
MR
89.5
90.0
90.5
91.0
91.5
92.0
92.5
93.0
104.5 104.6 104.7 104.8 104.9 105 105.1 105.2 105.3 105.4 105.5
104.5 104.6 104.7 104.8 104.9 105 105.1 105.2 105.3 105.4 105.5
104.6 104.6 104.8 104.9 104.9 105 105.1 105.2 105.3 105.4 105.5
IR Hedge Range (0, 25, 50, 75, 100)
Objective: Expected Funding Level
Inflation Hedge Range (0, 25, 50, 75, 100)
89.5
90.0
90.5
91.0
91.5
92.0
92.5
93.0
AR
AR
89.5
90.0
90.5
91.0
91.5
92.0
92.5
93.0
AR
Optimal Hedge
Liabilities
Assetsφ:cos(φ) =
Optimal Hedge
Liabilities
Assets
ρ(L,A)
MR: Minimum Risk Portfolio AR: Acceptable Risk Portfolio Objective: Expected Funding Level (scale 1:0.01) Risk Criterion: 5% Worst Case Funding Level (scale 1:0.01)
MR: Minimum Risk Portfolio AR: Acceptable Risk Portfolio Objective: Expected Funding Level (scale 1:0.01) Risk Criterion: 5% Worst Case Funding Level (scale 1:0.01)
MR: Minimum Risk Portfolio Objective: Expected Funding Level (scale 1:0.01) Risk Criterion: 5% Worst Case Funding Level (scale 1:0.01)
MR: Minimum Risk Portfolio Objective: Expected Funding Level (scale 1:0.01) Risk Criterion: 5% Worst Case Funding Level (scale 1:0.01)
AR: Acceptable Risk Portfolio Objective: Expected Funding Level (scale 1:0.01) Risk Criterion: 5% Worst Case Funding Level (scale 1:0.01)
AR: Acceptable Risk Portfolio Objective: Expected Funding Level (scale 1:0.01) Risk Criterion: 5% Worst Case Funding Level (scale 1:0.01)
AR: Acceptable Risk Portfolio Objective: Expected Funding Level (scale 1:0.01) Risk Criterion: 5% Worst Case Funding Level (scale 1:0.01)
11 We use our stochastic Long Term Expected Return Model, (LTARM). More information is available on request. We use a simple set of asset categories in order to highlight the concept rather than focus on the optimization.
12 We use the UBS Composite Australian Index.
7
LIABILITY DRIVEN INVESTING: HEDGING INFLATION AND INTEREST RATE RISK
MULTI-ASSET SOLUTIONS RESEARCH PAPERS – ISSUE 5
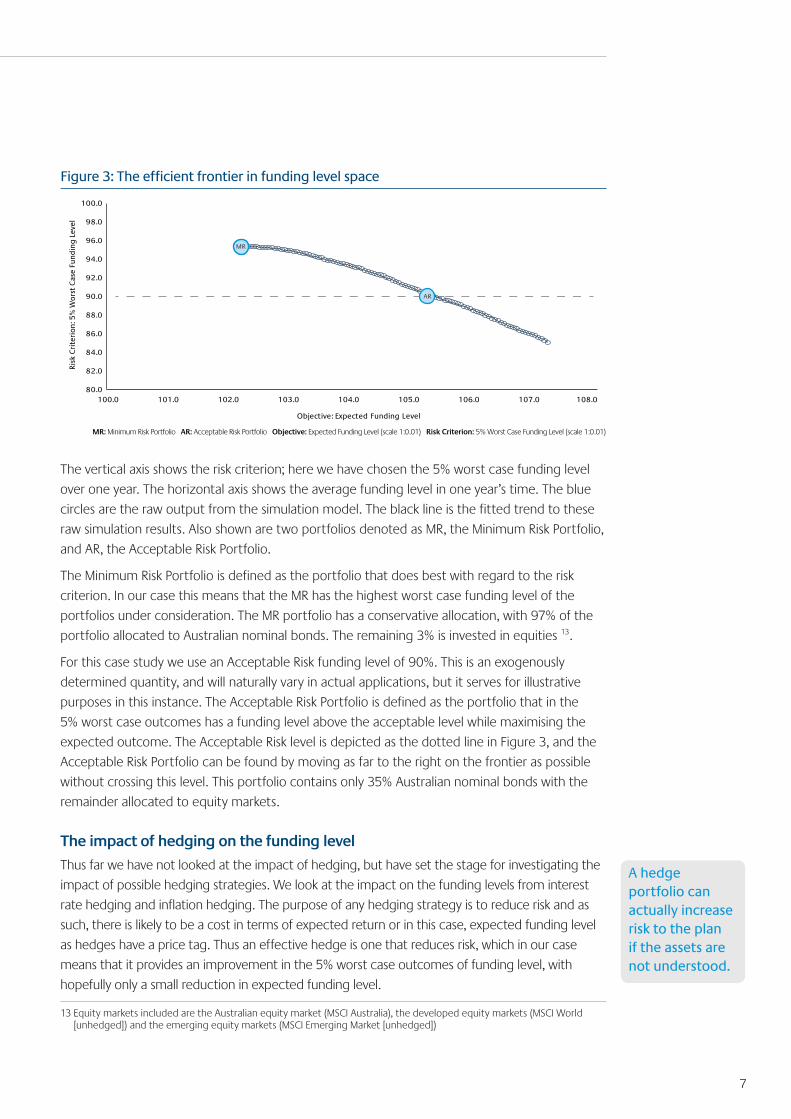
Figure 3: The efficient frontier in funding level space
The vertical axis shows the risk criterion; here we have chosen the 5% worst case funding level
over one year. The horizontal axis shows the average funding level in one year’s time. The blue
circles are the raw output from the simulation model. The black line is the fitted trend to these
raw simulation results. Also shown are two portfolios denoted as MR, the Minimum Risk Portfolio,
and AR, the Acceptable Risk Portfolio.
The Minimum Risk Portfolio is defined as the portfolio that does best with regard to the risk
criterion. In our case this means that the MR has the highest worst case funding level of the
portfolios under consideration. The MR portfolio has a conservative allocation, with 97% of the
portfolio allocated to Australian nominal bonds. The remaining 3% is invested in equities 13.
For this case study we use an Acceptable Risk funding level of 90%. This is an exogenously
determined quantity, and will naturally vary in actual applications, but it serves for illustrative
purposes in this instance. The Acceptable Risk Portfolio is defined as the portfolio that in the
5% worst case outcomes has a funding level above the acceptable level while maximising the
expected outcome. The Acceptable Risk level is depicted as the dotted line in Figure 3, and the
Acceptable Risk Portfolio can be found by moving as far to the right on the frontier as possible
without crossing this level. This portfolio contains only 35% Australian nominal bonds with the
remainder allocated to equity markets.
The impact of hedging on the funding level
Thus far we have not looked at the impact of hedging, but have set the stage for investigating the
impact of possible hedging strategies. We look at the impact on the funding levels from interest
rate hedging and inflation hedging. The purpose of any hedging strategy is to reduce risk and as
such, there is likely to be a cost in terms of expected return or in this case, expected funding level
as hedges have a price tag. Thus an effective hedge is one that reduces risk, which in our case
means that it provides an improvement in the 5% worst case outcomes of funding level, with
hopefully only a small reduction in expected funding level.
13 Equity markets included are the Australian equity market (MSCI Australia), the developed equity markets (MSCI World [unhedged]) and the emerging equity markets (MSCI Emerging Market [unhedged])
A hedge portfolio can actually increase risk to the plan if the assets are not understood.
Weight (%)
0
10
20
30
40
50
60
70
80
90
100
Expected Return (%)
4.0 4.5 5.0 5.5 5.9 6.4 6.9 7.4 7.9 8.4
Australian Bonds Australian Equities World Equities Emerging Markets Equities
80.0
82.0
84.0
86.0
88.0
90.0
92.0
94.0
96.0
98.0
100.0
100.0 101.0 102.0 103.0 104.0 105.0 106.0 107.0 108.0
Risk
Cri
teri
on: 5
% W
orst
Cas
e Fu
ndin
g L
evel
Risk
Cri
teri
on: 5
% W
orst
Cas
e Fu
ndin
g L
evel
Risk
Cri
teri
on: 5
% W
orst
Cas
e Fu
ndin
g L
evel
Risk
Cri
teri
on: 5
% W
orst
Cas
e Fu
ndin
g L
evel
Risk
Cri
teri
on: 5
% W
orst
Cas
e Fu
ndin
g L
evel
Risk
Cri
teri
on: 5
% W
orst
Cas
e Fu
ndin
g L
evel
Risk
Cri
teri
on: 5
% W
orst
Cas
e Fu
ndin
g L
evel
Objective: Expected Funding Level
AR
MR
93.0
93.5
94.0
94.5
95.0
95.5
96.0
101.5 101.7 101.9 102.1 102.3 102.5 102.7 102.9
101.5 101.7 101.9 102.1 102.3 102.5 102.7 102.9
Objective: Expected Funding Level
Interest Rate Hedge Range (0, 25, 50, 75, 100)
Objective: Expected Funding Level
101.5 101.7 101.9 102.1 102.3 102.5 102.7 102.9
Objective: Expected Funding Level
Objective: Expected Funding Level
Inflation Rate Hedge Range (0, 25, 50, 75, 100)
MR
93.0
94.0
95.0
96.0
97.0
98.0
99.0
MR
93.0
94.0
95.0
96.0
97.0
98.0
99.0
IR Hedge Range (0, 25, 50, 75, 100) Inflation Hedge Range (0, 25, 50, 75, 100) IR-Inflation Combi Range
Objective: Expected Funding Level
IR Hedge Range (0, 25, 50, 75, 100) Inflation Hedge Range (0, 25, 50, 75, 100) IR-Inflation Combi Range
MR
89.5
90.0
90.5
91.0
91.5
92.0
92.5
93.0
104.5 104.6 104.7 104.8 104.9 105 105.1 105.2 105.3 105.4 105.5
104.5 104.6 104.7 104.8 104.9 105 105.1 105.2 105.3 105.4 105.5
104.6 104.6 104.8 104.9 104.9 105 105.1 105.2 105.3 105.4 105.5
IR Hedge Range (0, 25, 50, 75, 100)
Objective: Expected Funding Level
Inflation Hedge Range (0, 25, 50, 75, 100)
89.5
90.0
90.5
91.0
91.5
92.0
92.5
93.0
AR
AR
89.5
90.0
90.5
91.0
91.5
92.0
92.5
93.0
AR
Optimal Hedge
Liabilities
Assetsφ:cos(φ) =
Optimal Hedge
Liabilities
Assets
ρ(L,A)
MR: Minimum Risk Portfolio AR: Acceptable Risk Portfolio Objective: Expected Funding Level (scale 1:0.01) Risk Criterion: 5% Worst Case Funding Level (scale 1:0.01)
MR: Minimum Risk Portfolio AR: Acceptable Risk Portfolio Objective: Expected Funding Level (scale 1:0.01) Risk Criterion: 5% Worst Case Funding Level (scale 1:0.01)
MR: Minimum Risk Portfolio Objective: Expected Funding Level (scale 1:0.01) Risk Criterion: 5% Worst Case Funding Level (scale 1:0.01)
MR: Minimum Risk Portfolio Objective: Expected Funding Level (scale 1:0.01) Risk Criterion: 5% Worst Case Funding Level (scale 1:0.01)
AR: Acceptable Risk Portfolio Objective: Expected Funding Level (scale 1:0.01) Risk Criterion: 5% Worst Case Funding Level (scale 1:0.01)
AR: Acceptable Risk Portfolio Objective: Expected Funding Level (scale 1:0.01) Risk Criterion: 5% Worst Case Funding Level (scale 1:0.01)
AR: Acceptable Risk Portfolio Objective: Expected Funding Level (scale 1:0.01) Risk Criterion: 5% Worst Case Funding Level (scale 1:0.01)

8
LIABILITY DRIVEN INVESTING: HEDGING INFLATION AND INTEREST RATE RISK
MULTI-ASSET SOLUTIONS RESEARCH PAPERS – ISSUE 5
First we apply only an interest rate hedge to the MR portfolio, the results of which are shown in
Figure 4 (a). Each blue dot represents the new 5% worst case funding level when an interest rate
hedge at the shown hedge ratios is introduced. Starting at the MR and moving along the IR Hedge
Range the hedge ratio increases by 25% increments until the hedge ratio is 100% at the end point.
Figure 4 (a) demonstrates that for the MR portfolio there is a fairly limited risk reduction through
the introduction of an interest rate hedge ratio of 50% or less. In fact for hedge ratios of 50% and
above, the hedge even increases risk. All hedges are at the expense of the expected funding level.
Figure 4 (a): Minimum Risk Portfolio funding level metrics when introducing various interest rate hedge ratios
Figure 4 (b): Minimum Risk Portfolio funding level metrics when introducing various inflation hedge ratios
Weight (%)
0
10
20
30
40
50
60
70
80
90
100
Expected Return (%)
4.0 4.5 5.0 5.5 5.9 6.4 6.9 7.4 7.9 8.4
Australian Bonds Australian Equities World Equities Emerging Markets Equities
80.0
82.0
84.0
86.0
88.0
90.0
92.0
94.0
96.0
98.0
100.0
100.0 101.0 102.0 103.0 104.0 105.0 106.0 107.0 108.0
Risk
Cri
teri
on: 5
% W
orst
Cas
e Fu
ndin
g L
evel
Risk
Cri
teri
on: 5
% W
orst
Cas
e Fu
ndin
g L
evel
Risk
Cri
teri
on: 5
% W
orst
Cas
e Fu
ndin
g L
evel
Risk
Cri
teri
on: 5
% W
orst
Cas
e Fu
ndin
g L
evel
Risk
Cri
teri
on: 5
% W
orst
Cas
e Fu
ndin
g L
evel
Risk
Cri
teri
on: 5
% W
orst
Cas
e Fu
ndin
g L
evel
Risk
Cri
teri
on: 5
% W
orst
Cas
e Fu
ndin
g L
evel
Objective: Expected Funding Level
AR
MR
93.0
93.5
94.0
94.5
95.0
95.5
96.0
101.5 101.7 101.9 102.1 102.3 102.5 102.7 102.9
101.5 101.7 101.9 102.1 102.3 102.5 102.7 102.9
Objective: Expected Funding Level
Interest Rate Hedge Range (0, 25, 50, 75, 100)
Objective: Expected Funding Level
101.5 101.7 101.9 102.1 102.3 102.5 102.7 102.9
Objective: Expected Funding Level
Objective: Expected Funding Level
Inflation Rate Hedge Range (0, 25, 50, 75, 100)
MR
93.0
94.0
95.0
96.0
97.0
98.0
99.0
MR
93.0
94.0
95.0
96.0
97.0
98.0
99.0
IR Hedge Range (0, 25, 50, 75, 100) Inflation Hedge Range (0, 25, 50, 75, 100) IR-Inflation Combi Range
Objective: Expected Funding Level
IR Hedge Range (0, 25, 50, 75, 100) Inflation Hedge Range (0, 25, 50, 75, 100) IR-Inflation Combi Range
MR
89.5
90.0
90.5
91.0
91.5
92.0
92.5
93.0
104.5 104.6 104.7 104.8 104.9 105 105.1 105.2 105.3 105.4 105.5
104.5 104.6 104.7 104.8 104.9 105 105.1 105.2 105.3 105.4 105.5
104.6 104.6 104.8 104.9 104.9 105 105.1 105.2 105.3 105.4 105.5
IR Hedge Range (0, 25, 50, 75, 100)
Objective: Expected Funding Level
Inflation Hedge Range (0, 25, 50, 75, 100)
89.5
90.0
90.5
91.0
91.5
92.0
92.5
93.0
AR
AR
89.5
90.0
90.5
91.0
91.5
92.0
92.5
93.0
AR
Optimal Hedge
Liabilities
Assetsφ:cos(φ) =
Optimal Hedge
Liabilities
Assets
ρ(L,A)
MR: Minimum Risk Portfolio AR: Acceptable Risk Portfolio Objective: Expected Funding Level (scale 1:0.01) Risk Criterion: 5% Worst Case Funding Level (scale 1:0.01)
MR: Minimum Risk Portfolio AR: Acceptable Risk Portfolio Objective: Expected Funding Level (scale 1:0.01) Risk Criterion: 5% Worst Case Funding Level (scale 1:0.01)
MR: Minimum Risk Portfolio Objective: Expected Funding Level (scale 1:0.01) Risk Criterion: 5% Worst Case Funding Level (scale 1:0.01)
MR: Minimum Risk Portfolio Objective: Expected Funding Level (scale 1:0.01) Risk Criterion: 5% Worst Case Funding Level (scale 1:0.01)
AR: Acceptable Risk Portfolio Objective: Expected Funding Level (scale 1:0.01) Risk Criterion: 5% Worst Case Funding Level (scale 1:0.01)
AR: Acceptable Risk Portfolio Objective: Expected Funding Level (scale 1:0.01) Risk Criterion: 5% Worst Case Funding Level (scale 1:0.01)
AR: Acceptable Risk Portfolio Objective: Expected Funding Level (scale 1:0.01) Risk Criterion: 5% Worst Case Funding Level (scale 1:0.01)

9
LIABILITY DRIVEN INVESTING: HEDGING INFLATION AND INTEREST RATE RISK
MULTI-ASSET SOLUTIONS RESEARCH PAPERS – ISSUE 5
Figure 4 (b) shows the impact of adding inflation hedging to the portfolio. Similar to Figure 4 (a), each green dot represents the new funding level metrics in the presence of the hedge, with the hedge ratio ranging from 25% to 100% moving along the Inflation Hedge range. In contrast to the results in Figure 4 (a), the hedge does reduce risk with only limited impact to the expected funding level. The improvement in risk profile tails off only after the hedge ratio moves from 75% to 100%. On the basis of Figures 4 (a) and 4 (b) it would then seem that an inflation hedge of up to 75% makes sense, whereas the case for an interest rate hedge is non-existent.
However, often when market participants talk of LDI hedging strategies, both interest rate and inflation hedges are part of the strategy to reduce risk. Figure 4 (c) shows the impact of the combination of inflation and interest rate hedge ratios, with the individual outcomes from Figures 4 (a) and 4 (b) plotted as well.
Figure 4 (c): Minimum Risk Portfolio funding level metrics when introducing combining interest rate and inflation hedge ratios
The purple dots represent the outcomes for the combined interest rate and inflation hedges. The first cross represents the funding level metrics with the interest rate and inflation hedge ratios both equal 25%. Moving along the IR-Inflation Combination range the second cross represents funding level metrics when both hedge ratios are equal to 50% and so on, until both hedge ratios have increased to 100%. It is clear that the inflation hedge in isolation provides the most effective hedging strategy in terms of improving worst case funding levels.
This is an interesting result in that it shows that the MR, which is very heavy in nominal bonds, already contains sufficient interest rate hedging characteristics so as to make additional interest rate hedges superfluous. This means that only the inflation hedge is necessary, which achieves a substantial risk reduction at limited cost.
We now repeat the analysis for the Acceptable Risk Portfolio. Recall that the Acceptable Risk portfolio has a much lower allocation to Australian nominal bonds than the MR. Analogously to Figures 4 (a,b and c), Figures 5 (a), 5 (b) and 5 (c) show the impact on the funding level metrics of the AR portfolio.
Weight (%)
0
10
20
30
40
50
60
70
80
90
100
Expected Return (%)
4.0 4.5 5.0 5.5 5.9 6.4 6.9 7.4 7.9 8.4
Australian Bonds Australian Equities World Equities Emerging Markets Equities
80.0
82.0
84.0
86.0
88.0
90.0
92.0
94.0
96.0
98.0
100.0
100.0 101.0 102.0 103.0 104.0 105.0 106.0 107.0 108.0
Risk
Cri
teri
on: 5
% W
orst
Cas
e Fu
ndin
g L
evel
Risk
Cri
teri
on: 5
% W
orst
Cas
e Fu
ndin
g L
evel
Risk
Cri
teri
on: 5
% W
orst
Cas
e Fu
ndin
g L
evel
Risk
Cri
teri
on: 5
% W
orst
Cas
e Fu
ndin
g L
evel
Risk
Cri
teri
on: 5
% W
orst
Cas
e Fu
ndin
g L
evel
Risk
Cri
teri
on: 5
% W
orst
Cas
e Fu
ndin
g L
evel
Risk
Cri
teri
on: 5
% W
orst
Cas
e Fu
ndin
g L
evel
Objective: Expected Funding Level
AR
MR
93.0
93.5
94.0
94.5
95.0
95.5
96.0
101.5 101.7 101.9 102.1 102.3 102.5 102.7 102.9
101.5 101.7 101.9 102.1 102.3 102.5 102.7 102.9
Objective: Expected Funding Level
Interest Rate Hedge Range (0, 25, 50, 75, 100)
Objective: Expected Funding Level
101.5 101.7 101.9 102.1 102.3 102.5 102.7 102.9
Objective: Expected Funding Level
Objective: Expected Funding Level
Inflation Rate Hedge Range (0, 25, 50, 75, 100)
MR
93.0
94.0
95.0
96.0
97.0
98.0
99.0
MR
93.0
94.0
95.0
96.0
97.0
98.0
99.0
IR Hedge Range (0, 25, 50, 75, 100) Inflation Hedge Range (0, 25, 50, 75, 100) IR-Inflation Combi Range
Objective: Expected Funding Level
IR Hedge Range (0, 25, 50, 75, 100) Inflation Hedge Range (0, 25, 50, 75, 100) IR-Inflation Combi Range
MR
89.5
90.0
90.5
91.0
91.5
92.0
92.5
93.0
104.5 104.6 104.7 104.8 104.9 105 105.1 105.2 105.3 105.4 105.5
104.5 104.6 104.7 104.8 104.9 105 105.1 105.2 105.3 105.4 105.5
104.6 104.6 104.8 104.9 104.9 105 105.1 105.2 105.3 105.4 105.5
IR Hedge Range (0, 25, 50, 75, 100)
Objective: Expected Funding Level
Inflation Hedge Range (0, 25, 50, 75, 100)
89.5
90.0
90.5
91.0
91.5
92.0
92.5
93.0
AR
AR
89.5
90.0
90.5
91.0
91.5
92.0
92.5
93.0
AR
Optimal Hedge
Liabilities
Assetsφ:cos(φ) =
Optimal Hedge
Liabilities
Assets
ρ(L,A)
MR: Minimum Risk Portfolio AR: Acceptable Risk Portfolio Objective: Expected Funding Level (scale 1:0.01) Risk Criterion: 5% Worst Case Funding Level (scale 1:0.01)
MR: Minimum Risk Portfolio AR: Acceptable Risk Portfolio Objective: Expected Funding Level (scale 1:0.01) Risk Criterion: 5% Worst Case Funding Level (scale 1:0.01)
MR: Minimum Risk Portfolio Objective: Expected Funding Level (scale 1:0.01) Risk Criterion: 5% Worst Case Funding Level (scale 1:0.01)
MR: Minimum Risk Portfolio Objective: Expected Funding Level (scale 1:0.01) Risk Criterion: 5% Worst Case Funding Level (scale 1:0.01)
AR: Acceptable Risk Portfolio Objective: Expected Funding Level (scale 1:0.01) Risk Criterion: 5% Worst Case Funding Level (scale 1:0.01)
AR: Acceptable Risk Portfolio Objective: Expected Funding Level (scale 1:0.01) Risk Criterion: 5% Worst Case Funding Level (scale 1:0.01)
AR: Acceptable Risk Portfolio Objective: Expected Funding Level (scale 1:0.01) Risk Criterion: 5% Worst Case Funding Level (scale 1:0.01)

10
LIABILITY DRIVEN INVESTING: HEDGING INFLATION AND INTEREST RATE RISK
MULTI-ASSET SOLUTIONS RESEARCH PAPERS – ISSUE 5
Figure 5 (a): Acceptable Risk Portfolio funding level metrics when introducing various interest rate hedge ratios
Figure 5 (b): Acceptable Risk Portfolio funding level metrics when introducing various inflation hedge ratios
Figure 5 (a) shows the impact of the interest rate hedge at different ratios on the funding level.
In comparison to the impact on the MR portfolio as shown in Figure 4 (a), the interest rate hedge
ratio reduces risk relative to the unhedged position in all cases. Similar to Figure 4 (a), each blue
dot represents a different hedge ratio. One can see that there is an inflection point that shows
that the interest rate hedge ceases to reduce risk once the hedge ratio exceeds approximately
75%. Although the improvement was minimal for the MR, there was nonetheless some small
positive effect to be gleaned from an interest rate hedge of 25%, although the cost in terms of
expected funding level would make such a hedge unfeasible. So we see that with a much lower
nominal bond weight the effect of the interest rate hedge becomes larger and more relevant.
Weight (%)
0
10
20
30
40
50
60
70
80
90
100
Expected Return (%)
4.0 4.5 5.0 5.5 5.9 6.4 6.9 7.4 7.9 8.4
Australian Bonds Australian Equities World Equities Emerging Markets Equities
80.0
82.0
84.0
86.0
88.0
90.0
92.0
94.0
96.0
98.0
100.0
100.0 101.0 102.0 103.0 104.0 105.0 106.0 107.0 108.0
Risk
Cri
teri
on: 5
% W
orst
Cas
e Fu
ndin
g L
evel
Risk
Cri
teri
on: 5
% W
orst
Cas
e Fu
ndin
g L
evel
Risk
Cri
teri
on: 5
% W
orst
Cas
e Fu
ndin
g L
evel
Risk
Cri
teri
on: 5
% W
orst
Cas
e Fu
ndin
g L
evel
Risk
Cri
teri
on: 5
% W
orst
Cas
e Fu
ndin
g L
evel
Risk
Cri
teri
on: 5
% W
orst
Cas
e Fu
ndin
g L
evel
Risk
Cri
teri
on: 5
% W
orst
Cas
e Fu
ndin
g L
evel
Objective: Expected Funding Level
AR
MR
93.0
93.5
94.0
94.5
95.0
95.5
96.0
101.5 101.7 101.9 102.1 102.3 102.5 102.7 102.9
101.5 101.7 101.9 102.1 102.3 102.5 102.7 102.9
Objective: Expected Funding Level
Interest Rate Hedge Range (0, 25, 50, 75, 100)
Objective: Expected Funding Level
101.5 101.7 101.9 102.1 102.3 102.5 102.7 102.9
Objective: Expected Funding Level
Objective: Expected Funding Level
Inflation Rate Hedge Range (0, 25, 50, 75, 100)
MR
93.0
94.0
95.0
96.0
97.0
98.0
99.0
MR
93.0
94.0
95.0
96.0
97.0
98.0
99.0
IR Hedge Range (0, 25, 50, 75, 100) Inflation Hedge Range (0, 25, 50, 75, 100) IR-Inflation Combi Range
Objective: Expected Funding Level
IR Hedge Range (0, 25, 50, 75, 100) Inflation Hedge Range (0, 25, 50, 75, 100) IR-Inflation Combi Range
MR
89.5
90.0
90.5
91.0
91.5
92.0
92.5
93.0
104.5 104.6 104.7 104.8 104.9 105 105.1 105.2 105.3 105.4 105.5
104.5 104.6 104.7 104.8 104.9 105 105.1 105.2 105.3 105.4 105.5
104.6 104.6 104.8 104.9 104.9 105 105.1 105.2 105.3 105.4 105.5
IR Hedge Range (0, 25, 50, 75, 100)
Objective: Expected Funding Level
Inflation Hedge Range (0, 25, 50, 75, 100)
89.5
90.0
90.5
91.0
91.5
92.0
92.5
93.0
AR
AR
89.5
90.0
90.5
91.0
91.5
92.0
92.5
93.0
AR
Optimal Hedge
Liabilities
Assetsφ:cos(φ) =
Optimal Hedge
Liabilities
Assets
ρ(L,A)
MR: Minimum Risk Portfolio AR: Acceptable Risk Portfolio Objective: Expected Funding Level (scale 1:0.01) Risk Criterion: 5% Worst Case Funding Level (scale 1:0.01)
MR: Minimum Risk Portfolio AR: Acceptable Risk Portfolio Objective: Expected Funding Level (scale 1:0.01) Risk Criterion: 5% Worst Case Funding Level (scale 1:0.01)
MR: Minimum Risk Portfolio Objective: Expected Funding Level (scale 1:0.01) Risk Criterion: 5% Worst Case Funding Level (scale 1:0.01)
MR: Minimum Risk Portfolio Objective: Expected Funding Level (scale 1:0.01) Risk Criterion: 5% Worst Case Funding Level (scale 1:0.01)
AR: Acceptable Risk Portfolio Objective: Expected Funding Level (scale 1:0.01) Risk Criterion: 5% Worst Case Funding Level (scale 1:0.01)
AR: Acceptable Risk Portfolio Objective: Expected Funding Level (scale 1:0.01) Risk Criterion: 5% Worst Case Funding Level (scale 1:0.01)
AR: Acceptable Risk Portfolio Objective: Expected Funding Level (scale 1:0.01) Risk Criterion: 5% Worst Case Funding Level (scale 1:0.01)

11
LIABILITY DRIVEN INVESTING: HEDGING INFLATION AND INTEREST RATE RISK
MULTI-ASSET SOLUTIONS RESEARCH PAPERS – ISSUE 5
The most effective hedge ratio increases if the bond weight in the portfolio decreases, which is
a result that one might intuitively expect.
Figure 5 (b) shows the impact on the funding level metrics of the AR portfolio when the inflation
hedge ratio is increased in 25% increments and is represented by the green dots. The impact
of the inflation hedge continues to improve the worst case funding level outcome up until
the 100% hedge point, which contrasts with the outcome for the MR as shown in Figure 4 (b).
With the significantly lower nominal bond weights in the AR portfolio as compared to the MR
it is interesting to note that the overall effectiveness of the hedge also decreases when the
allocation to bonds decreases.
Figure 5 (c) shows the impact on the funding level metrics of the AR portfolio of the combinations
of interest rate and inflation hedge ratios. The combination of the hedges provides for a dramatic
improvement as compared to using the inflation and interest rate hedges individually. This is in
marked contrast to the situation for the MR portfolio as shown in Figure 4 (c), where only the
inflation hedge made sense.
Figure 5 (c): Acceptable Risk Portfolio funding level metrics when combining interest rate and inflation hedge ratios
Weight (%)
0
10
20
30
40
50
60
70
80
90
100
Expected Return (%)
4.0 4.5 5.0 5.5 5.9 6.4 6.9 7.4 7.9 8.4
Australian Bonds Australian Equities World Equities Emerging Markets Equities
80.0
82.0
84.0
86.0
88.0
90.0
92.0
94.0
96.0
98.0
100.0
100.0 101.0 102.0 103.0 104.0 105.0 106.0 107.0 108.0
Risk
Cri
teri
on: 5
% W
orst
Cas
e Fu
ndin
g L
evel
Risk
Cri
teri
on: 5
% W
orst
Cas
e Fu
ndin
g L
evel
Risk
Cri
teri
on: 5
% W
orst
Cas
e Fu
ndin
g L
evel
Risk
Cri
teri
on: 5
% W
orst
Cas
e Fu
ndin
g L
evel
Risk
Cri
teri
on: 5
% W
orst
Cas
e Fu
ndin
g L
evel
Risk
Cri
teri
on: 5
% W
orst
Cas
e Fu
ndin
g L
evel
Risk
Cri
teri
on: 5
% W
orst
Cas
e Fu
ndin
g L
evel
Objective: Expected Funding Level
AR
MR
93.0
93.5
94.0
94.5
95.0
95.5
96.0
101.5 101.7 101.9 102.1 102.3 102.5 102.7 102.9
101.5 101.7 101.9 102.1 102.3 102.5 102.7 102.9
Objective: Expected Funding Level
Interest Rate Hedge Range (0, 25, 50, 75, 100)
Objective: Expected Funding Level
101.5 101.7 101.9 102.1 102.3 102.5 102.7 102.9
Objective: Expected Funding Level
Objective: Expected Funding Level
Inflation Rate Hedge Range (0, 25, 50, 75, 100)
MR
93.0
94.0
95.0
96.0
97.0
98.0
99.0
MR
93.0
94.0
95.0
96.0
97.0
98.0
99.0
IR Hedge Range (0, 25, 50, 75, 100) Inflation Hedge Range (0, 25, 50, 75, 100) IR-Inflation Combi Range
Objective: Expected Funding Level
IR Hedge Range (0, 25, 50, 75, 100) Inflation Hedge Range (0, 25, 50, 75, 100) IR-Inflation Combi Range
MR
89.5
90.0
90.5
91.0
91.5
92.0
92.5
93.0
104.5 104.6 104.7 104.8 104.9 105 105.1 105.2 105.3 105.4 105.5
104.5 104.6 104.7 104.8 104.9 105 105.1 105.2 105.3 105.4 105.5
104.6 104.6 104.8 104.9 104.9 105 105.1 105.2 105.3 105.4 105.5
IR Hedge Range (0, 25, 50, 75, 100)
Objective: Expected Funding Level
Inflation Hedge Range (0, 25, 50, 75, 100)
89.5
90.0
90.5
91.0
91.5
92.0
92.5
93.0
AR
AR
89.5
90.0
90.5
91.0
91.5
92.0
92.5
93.0
AR
Optimal Hedge
Liabilities
Assetsφ:cos(φ) =
Optimal Hedge
Liabilities
Assets
ρ(L,A)
MR: Minimum Risk Portfolio AR: Acceptable Risk Portfolio Objective: Expected Funding Level (scale 1:0.01) Risk Criterion: 5% Worst Case Funding Level (scale 1:0.01)
MR: Minimum Risk Portfolio AR: Acceptable Risk Portfolio Objective: Expected Funding Level (scale 1:0.01) Risk Criterion: 5% Worst Case Funding Level (scale 1:0.01)
MR: Minimum Risk Portfolio Objective: Expected Funding Level (scale 1:0.01) Risk Criterion: 5% Worst Case Funding Level (scale 1:0.01)
MR: Minimum Risk Portfolio Objective: Expected Funding Level (scale 1:0.01) Risk Criterion: 5% Worst Case Funding Level (scale 1:0.01)
AR: Acceptable Risk Portfolio Objective: Expected Funding Level (scale 1:0.01) Risk Criterion: 5% Worst Case Funding Level (scale 1:0.01)
AR: Acceptable Risk Portfolio Objective: Expected Funding Level (scale 1:0.01) Risk Criterion: 5% Worst Case Funding Level (scale 1:0.01)
AR: Acceptable Risk Portfolio Objective: Expected Funding Level (scale 1:0.01) Risk Criterion: 5% Worst Case Funding Level (scale 1:0.01)

LIABILITY DRIVEN INVESTING: HEDGING INFLATION AND INTEREST RATE RISK
MULTI-ASSET SOLUTIONS RESEARCH PAPERS – ISSUE 5
Summary
We looked at designing an optimal hedging strategy for a defined benefit pension fund with
indexed benefits whose aim was to maintain a certain minimum funding level in the worst case
outcomes, while maximising the expected funding level. The results show that the optimal
combination of interest rate and inflation hedges depends critically on the asset allocation of
the underlying asset portfolio. For a portfolio very heavily weighted in nominal bonds there was
no significant risk mitigation from an interest rate hedge, with the optimal hedging strategy
consisting solely of an inflation hedge. By contrast a portfolio with a substantial equity weight
would benefit best from a combination of interest rate and inflation hedges.

13
LIABILITY DRIVEN INVESTING: HEDGING INFLATION AND INTEREST RATE RISK
MULTI-ASSET SOLUTIONS RESEARCH PAPERS – ISSUE 5
References
Baars, Jan, Petr Kocourek, and Epco van der Lende. “Integrated Approach to ALM, Risk Budgeting
and Alpha.” Colonial First State Multi-Asset Research Papers, no. 2 (June 2012).
Baxter, M, and A, Rennie. Financial Calculus: An Introduction to Derivative Pricing, Cambridge
University Press, 1996
IbisWorld Industry Report, Superannuation Funds in Australia, August 2009
Milliman, Decline in discount rates drives pension plans to record deficits in 2011, 2012
Towers Watson , Global Investment Matters, March 2011
The PEW Center of the States, The Widening Gap Update, June 2012
Sharpe, W.F., and L.G. Tint. “Liabilities: A New Approach”, Journal of Portfolio Management, Winter 1990
Waring, M.B. “Liability-Relative Investing: Be Dual Duration Matched and on the Surplus Efficient
Frontier.” The Journal of Portfolio Management 30, no. 4 (2004): 8-20

14
LIABILITY DRIVEN INVESTING: HEDGING INFLATION AND INTEREST RATE RISK
MULTI-ASSET SOLUTIONS RESEARCH PAPERS – ISSUE 5
Important Information General Disclaimer
This document is directed at persons of a professional, sophisticated, institutional or wholesale nature and not the retail market.
This document has been prepared for general information purposes only and is intended to provide a summary of the subject matter covered. It does not purport to be comprehensive or to give advice. The views expressed are the views of the writer at the time of issue and may change over time. This is not an offer document, and does not constitute an offer, invitation, investment recommendation or inducement to distribute or purchase securities, shares, units or other interests or to enter into an investment agreement. No person should rely on the content and/or act on the basis of any matter contained in this document.
This document is confidential and must not be copied, reproduced, circulated or transmitted, in whole or in part, and in any form or by any means without our prior written consent. The information contained within this document has been obtained from sources that we believe to be reliable and accurate at the time of issue but no representation or warranty, express or implied, is made as to the fairness, accuracy or completeness of the information. We do not accept any liability for any loss arising whether directly or indirectly from any use of this document.
References to “we” or “us” are references to Colonial First State Global Asset Management (CFSGAM) which is the consolidated asset management division of the Commonwealth Bank of Australia ABN 48 123 123 124. CFSGAM includes a number of entities in different jurisdictions, operating in Australia as CFSGAM and as First State Investments (FSI) elsewhere.
Past performance is not a reliable indicator of future performance.
Reference to specific securities (if any) is included for the purpose of illustration only and should not be construed as a recommendation to buy or sell. Reference to the names of any company is merely to explain the investment strategy and should not be construed as investment advice or a recommendation to invest in any of those companies.
Hong Kong and Singapore
In Hong Kong, this document is issued by First State Investments (Hong Kong) Limited and has not been reviewed by the Securities & Futures Commission in Hong Kong. In Singapore, this document is issued by First State Investments (Singapore) whose company registration number is 196900420D. First State Investments and First State Stewart Asia are business names of First State Investments (Hong Kong) Limited. First State Investments (registration number 53236800B) and First State Stewart Asia (registration number 53314080C) are business divisions of First State Investments (Singapore). Version: 3 (21 March 2016)
Australia
In Australia, this document is issued by Colonial First State Asset Management (Australia) Limited AFSL 289017 ABN 89 114 194311.
United Kingdom and European Economic Area (“EEA”)
In the United Kingdom, this document is issued by First State Investments (UK) Limited which is authorised and regulated in the UK by the Financial Conduct Authority (registration number 143359). Registered office: Finsbury Circus House, 15 Finsbury Circus, London, EC2M 7EB, number 2294743.
Outside the UK within the EEA, this document is issued by First State Investments International Limited which is authorised and regulated in the UK by the Financial Conduct Authority (registration number 122512). Registered office 23 St. Andrew Square, Edinburgh, Midlothian EH2 1BB number SC079063.
Middle East
In certain jurisdictions the distribution of this material may be restricted. The recipient is required to inform themselves about any such restrictions and observe them. By having requested this document and by not deleting this email and attachment, you warrant and represent that you qualify under any applicable financial promotion rules that may be applicable to you to receive and consider this document, failing which you should return and delete this e-mail and all attachments pertaining thereto.
In the Middle East, this material is communicated by First State Investments International Limited which is regulated in Dubai by the DFSA as a Representative Office.
Kuwait
If in doubt, you are recommended to consult a party licensed by the Capital Markets Authority (“CMA”) pursuant to Law No. 7/2010 and the Executive Regulations to give you the appropriate advice. Neither this document nor any of the information contained herein is intended to and shall not lead to the conclusion of any contract whatsoever within Kuwait.
UAE - Dubai International Financial Centre (DIFC)
Within the DIFC this material is directed solely at Professional Clients as defined by the DFSA’s COB Rulebook.
UAE (ex-DIFC)
By having requested this document and / or by not deleting this email and attachment, you warrant and represent that you qualify under the exemptions contained in Article 2 of the Emirates Securities and Commodities Authority Board Resolution No 37 of 2012, as amended by decision No 13 of 2012 (the “Mutual Fund Regulations”). By receiving this material you acknowledge and confirm that you fall within one or more of the exemptions contained in Article 2 of the Mutual Fund Regulations.
Copyright © (2016) Colonial First State Group Limited
All rights reserved.
EX3032_1016_MR
EMEAWholesale [email protected] [email protected]
Contact Us
AustraliaInstitutional [email protected]
Hong Kong Institutional [email protected]
Singapore Institutional [email protected]


