

Liechtenstein in Figures2020
OFFICE OF STATISTICSPRINCIPALITY OF LIECHTENSTEIN
Published and distributed by
Office of StatisticsÄulestrasse 519490 VaduzLiechtensteinT +423 236 68 76F +423 236 69 [email protected]
Layout
Karin Knöller
Picture credits
Thomas Erhart, © Office of Statistics
Printed by
BVD Druck + Verlag AG, Schaan
Copyright
© Office of Statistics, January 2020Reproduction is authorised, provided publisher is mentioned.
Key
A dash (-) in place of a figure indicates absolute zero.A dot (.) in place of a figure indicates that the figure is not available or has been omitted for other reasons.

3
Liec
hten
stei
n in
Fig
ures
202
0
Table of Contents
Geographical Situation 4
Environment 6
History and Constitution 8
Population and Housing 10
National Economy 16
Employment and Education 22
Agriculture 30
Goods-producing industry 32
Services-providing industry 34
Transport and Communication 38
Energy 40
Public Finance 42
Statistical Publications 46

4
In geographical terms, Liechtenstein is situated between Switzerland and Austria in the centre of the Alpine arc. With a total area of 160 km2, it is the fourth smallest country in Europe. Its western neighbour Switzerland is around 260 times larger than Liechtenstein. In the west and south, the national frontier runs alongside the Swiss cantons of St. Gal-len and Graubünden for 41 km. In the north and east, Liech-tenstein shares a 37 km long frontier with the Austrian fed-eral state of Vorarlberg.
Area
Total area 160 km2 100%Wooded area 67 km2 42%Agricultural area 52 km2 33%Non-productive area 24 km2 15%Settlement area 18 km2 11%
Geographical limits
North: 47° 16’ 14’’ northSouth: 47° 02’ 58’’ northWest: 9° 28’ 18’’ eastEast: 9° 38’ 08’’ east
Geographical Situation
Switzerland
Germany
AustriaVaduz
ZurichSt. Gallen
Chur
Bregenz
Constance
Liechtenstein
5
Liec
hten
stei
n in
Fig
ures
202
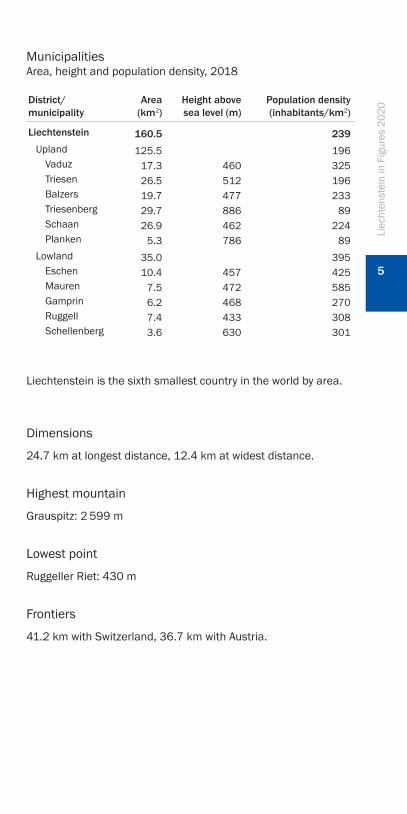
0Liechtenstein is the sixth smallest country in the world by area.
Dimensions
24.7 km at longest distance, 12.4 km at widest distance.
Highest mountain
Grauspitz: 2 599 m
Lowest point
Ruggeller Riet: 430 m
Frontiers
41.2 km with Switzerland, 36.7 km with Austria.
Municipalities Area, height and population density, 2018
District/ municipality
Area (km2)
Height above sea level (m)
Population density (inhabitants/km2)
Liechtenstein
UplandVaduzTriesenBalzersTriesenbergSchaanPlanken
LowlandEschenMaurenGamprinRuggellSchellenberg
160.5 239
125.5 19617.3 460 32526.5 512 19619.7 477 23329.7 886 8926.9 462 224
5.3 786 8935.0 39510.4 457 425
7.5 472 5856.2 468 2707.4 433 3083.6 630 301

6Environment
In Liechtenstein, the altitudinal vegetation zones range from the foothill to the alpine zones (430 m to 2 599 m above sea level). As a result, a wide variety of ecological systems can be found, which is reflected in a very diverse flora und fauna. Due to population growth and the associated land use, these ecological systems, as well as the animal and plant species living within them, are put under pressure.
Threatened native speciesby species groups
Biodiversity
(2018 data)
(2006 data)
(2006 data)
(2012 data)
(2011 data)
(2012 data)
0% 20% 40% 60% 80% 100%
Not evaluated
Least Concern
Near threatened
Vulnerable
Endangered
Critically endangered
Regionally extinct
Breeding birds (147)
Reptiles (6)
Amphibians (10)
Fishes (28)
Crustaceans (3)
Vascular plants (1 447)
7
Liec
hten
stei
n in
Fig
ures
202
0
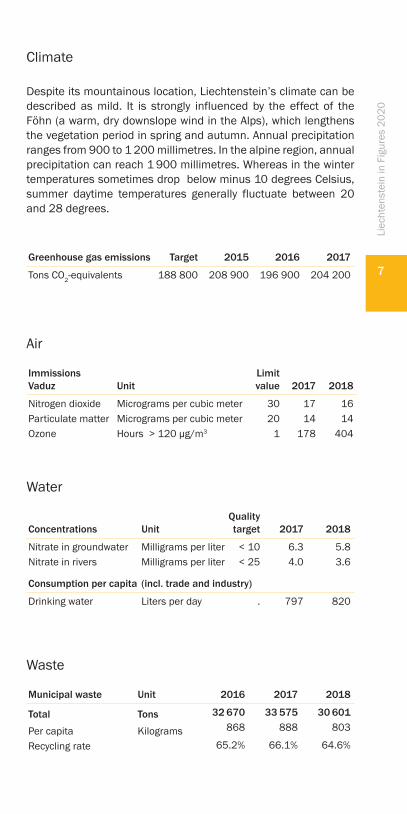
Greenhouse gas emissions Target 2015 2016 2017
Tons CO2-equivalents 188 800 208 900 196 900 204 200
Air
Immissions Vaduz Unit
Limit value
Nitrogen dioxide Micrograms per cubic meter 30Particulate matter Micrograms per cubic meter 20Ozone Hours > 120 μg/m3 1
2017
1714
178
Water
Concentrations UnitQuality target
Nitrate in groundwater Milligrams per liter < 10Nitrate in rivers Milligrams per liter < 25
Consumption per capita (incl. trade and industry)
Drinking water Liters per day .
2017 2018
6.3 5.84.0 3.6
797 820
Waste
Municipal waste Unit
Total Tons
Per capita KilogramsRecycling rate
2016 2017 2018
32 670 33 575 30 601868 888 803
65.2% 66.1% 64.6%
Climate
Despite its mountainous location, Liechtenstein’s climate can be described as mild. It is strongly influenced by the effect of the Föhn (a warm, dry downslope wind in the Alps), which lengthens the vegetation period in spring and autumn. Annual precipitation ranges from 900 to 1 200 millimetres. In the alpine region, annual precipitation can reach 1 900 millimetres. Whereas in the winter temperatures sometimes drop below minus 10 degrees Celsius, summer daytime temperatures generally fluctuate between 20 and 28 degrees.
2018
1614
404
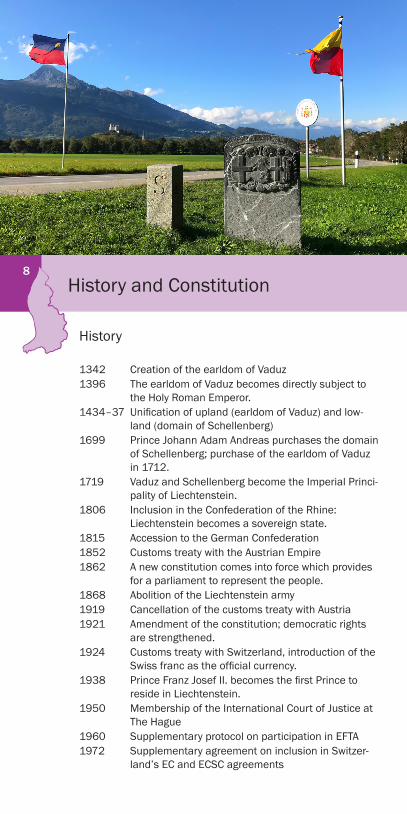
8History and Constitution
History
1342 Creation of the earldom of Vaduz1396 The earldom of Vaduz becomes directly subject to
the Holy Roman Emperor.1434–37 Unification of upland (earldom of Vaduz) and low-
land (domain of Schellenberg)1699 Prince Johann Adam Andreas purchases the domain
of Schellenberg; purchase of the earldom of Vaduz in 1712.
1719 Vaduz and Schellenberg become the Imperial Princi-pality of Liechtenstein.
1806 Inclusion in the Confederation of the Rhine: Liechtenstein becomes a sovereign state.
1815 Accession to the German Confederation1852 Customs treaty with the Austrian Empire1862 A new constitution comes into force which provides
for a parliament to represent the people.1868 Abolition of the Liechtenstein army1919 Cancellation of the customs treaty with Austria1921 Amendment of the constitution; democratic rights
are strengthened.1924 Customs treaty with Switzerland, introduction of the
Swiss franc as the official currency.1938 Prince Franz Josef II. becomes the first Prince to
reside in Liechtenstein.1950 Membership of the International Court of Justice at
The Hague1960 Supplementary protocol on participation in EFTA1972 Supplementary agreement on inclusion in Switzer-
land’s EC and ECSC agreements

9
Liec
hten
stei
n in
Fig
ures
202
0
1978 Member of the Council of Europe1980 Currency treaty with Switzerland1990 Liechtenstein becomes the 160th member of the UN.1991 Member of EFTA1995 Liechtenstein joins the EEA and the WTO.1997 Foundation of Archdiocese of Vaduz2003 Amendment of the constitution2019 The Principality of Liechtenstein celebrates its 300th
anniversary.
Constitution
Constitution The Principality is a constitutional, hereditary mo-narchy on a democratic and parliamentary basis; the power of the state is embodied in the reigning Prince and the people and is exercised by both par-ties under the conditions set forth in the provisions of the constitution (Article 2 of the constitution).
Head of State HSH Prince Hans-Adam II. von und zu Liechtenstein succeeded Prince Franz Josef II. on 13 November 1989. On 15 August 2004, Prince Hans-Adam II. has entrusted Hereditary Prince Alois to exercise his sovereign powers as his representative.
Government Five-member Government nominated by Parlia-ment and appointed by the Prince for four years. The government is the highest executive body in Liechtenstein and is organised as a Collegial Government, which is constituted by the Prime Minister and four Ministers. This Collegial Govern-ment is responsible to the highest legislative body, the Parliament, as well as to the Prince as Head of State.
Parliament 25 Members of Parliament, called Landtag, elec-ted by the people for four years in universal, direct and secret elections. The district upland has 15 Members of Parliament, the district lowland has 10 Members of Parliament. The Parliament is con-vened and closed by the Prince. The elections for the mandate period 2017-2021 were held on 5 Fe-bruary 2017.
Courts Civil and criminal cases are heard initially by the Landgericht, at appeal by the Obergericht and at supreme court level by the Oberster Gerichtshof. Public law cases are dealt with by the Administra-tive Court and the Staatsgerichtshof. The courts are all located in Vaduz.

10Population and Housing
With a population of around 38 400 inhabitants, Liechten-stein is one of the smallest countries in Europe and the world. The population is spread over eleven municipalities. Schaan forms Liechtenstein’s largest municipality with around 6 000 inhabitants. Around 5 600 people live in the capital, Vaduz.
A third of the population are foreign nationals, mainly from Switzerland, Austria and Germany.
Resident population by municipalities, 2018
District/ municipality
Resident population
as at 31.12.District/ municipality
Resident population
as at 31.12.
Liechtenstein
Upland Lowland
Vaduz EschenTriesen MaurenBalzers GamprinTriesenberg Ruggell
Schaan Schellenberg
Planken
38 378
24 5425 6245 2024 5942 6366 014
472
13 8364 416
4 3891 6712 276
1 084

11
Liec
hten
stei
n in
Fig
ures
202
0
Resident population
Year
Inhabitants
Share of foreign
population
LiechtensteinersOther
nationalities
1901 7 531 6 419 1 112 14.8%1911 8 693 7 343 1 350 15.5%1921 8 841 7 845 996 11.3%1930 9 948 8 257 1 691 17.0%1941 11 094 9 309 1 785 16.1%1950 13 757 11 006 2 751 20.0%1960 16 628 12 485 4 143 24.9%1970 21 350 14 304 7 046 33.0%1980 25 215 15 913 9 302 36.9%1990 29 032 18 123 10 909 37.6%2000 32 863 21 543 11 320 34.4%2010 36 149 24 145 12 004 33.2%2017 38 114 25 173 12 941 34.0%2018 38 378 25 321 13 057 34.0%
0
5 000
10 000
15 000
20 000
25 000
30 000
35 000
40 000
2018
2017
2010
2000
1990
1980
1970
1960
1950
1941
1930
1921
1911
1901
Resident population
Liechtensteiners
Other nationalities

12
Liec
hten
stei
n in
Fig
ures
202
0
Resident foreign population by nationality
Year TotalSwitzer-
land Austria Germany Italy Others
1980 9 302 4 055 1 945 1 029 894 1 3791990 10 909 4 459 2 069 1 026 1 071 2 2842000 11 320 3 805 2 006 1 131 1 028 3 3502010 12 004 3 586 2 057 1 319 1 148 3 8942017 12 941 3 645 2 223 1 635 1 184 4 2542018 13 057 3 669 2 256 1 657 1 189 4 286
Resident population by age
Year
Age
Total 0–14 15–64 65+
1980 25 215 5 788 17 160 2 2671990 29 032 5 522 20 619 2 8912000 32 863 6 088 23 335 3 4402010 36 149 5 775 25 352 5 0222017 38 114 5 601 25 848 6 6652018 38 378 5 655 25 862 6 861
400 300 200 100 0 100 200 300 4000
10
20
30
40
50
60
70
80
90
100
Age distribution of resident population (31.12.2018)
Liechtensteiners
Other nationalities

13
Liec
hten
stei
n in
Fig
ures
202
0
Resident population by marital status
Year
Single
Married, registered partnership
Divorced, partnershipdissolved, widowed
Women Men Women Men Women Men
1980 5 920 6 215 5 499 5 900 1 277 4041990 6 476 7 034 6 468 6 884 1 623 5472000 7 070 7 490 7 423 7 555 2 332 9932010 7 356 8 179 8 074 8 272 2 833 1 4352017 7 482 8 418 8 587 8 825 3 155 1 6472018 7 483 8 460 8 684 8 917 3 186 1 648
Marriages, 2018
Number of persons who got married
Liechtenstein man/ Liechtenstein womanLiechtenstein man/ Woman of other nationalityMan of other nationality/ Liechtenstein womanMan of other nationality/ Woman of other nationality
455 100.0%
106 23.3%150 33.0%104 22.9%
95 20.9%
4.5%
8.1%
45.9%
41.5%
Marital status (31.12.2018)
widowed, partner deceased
divorced, partnership dissolved
single
married, registered partnership
Deaths by cause, 2018
Cause of death Deaths Women Men
Total
InfectionsCancerDementiaCirculatory systemRespiratory organsDigestive organsInfirmity of old ageAccidents and violent deathsOthers/ Unknown
274 131 143
6 1 5 49 19 30
3 3 - 109 54 55
29 11 18 10 5 5 23 19 4 13 4 9 32 15 17

14
Liec
hten
stei
n in
Fig
ures
202
0
0
50
100
150
200
250
300
2018201720102000199019801970
Liechtensteiners
Other nationalities
Total
Deaths
0
50
100
150
200
250
300
350
400
450
2018201720102000199019801970
Live births
Liechtensteiners
Other nationalities
Total
0
50
100
150
200
250
300
2018201720102000199019801970
Surplus of births
Liechtensteiners
Other nationalities
Total

15
Liec
hten
stei
n in
Fig
ures
202
0
Households by type
Population census
2010 2015 Change
Total
Private householdsOne-person householdsCouples without childrenCouples with childrenLone parent householdOthers
Collective households (retirement homes etc.)
15 474 16 522 6.8%
15 463 16 506 6.7%5 284 5 799 9.7%3 810 4 185 9.8%4 825 4 867 0.9%1 253 1 272 1.5%
291 383 31.6%
11 16 45.5%
Occupied buildings and dwellings
Housing census
2010 2015 Change
Total buildingsSingle-family housesApartment blocksMixed-use residential buildings Others
Total occupied dwellingsOwner-occupiedRentedOthers
10 337 10 861 5.1%6 159 6 283 2.0%2 141 2 258 5.5%1 706 1 991 16.7%
331 329 -0.6%15 474 16 522 6.8%
7 884 8 292 5.2%7 321 7 948 8.6%
269 282 4.8%

16
Liechtenstein has a very diverse national economy with a large number of small and medium-sized enterprises. The strong industrial sector and financial services providers particularly contribute to the high value added. At the same time, the contribution of the public sector to the national economy is comparatively small.
On 26 May 1924, Liechtenstein adopted the Swiss franc (CHF) as the legal currency of Liechtenstein. All coins, bank-notes and other means of payment used in Switzerland were recognised as official legal tender in Liechtenstein.
National Economy
17
Liec
hten
stei
n in
Fig
ures
202
0
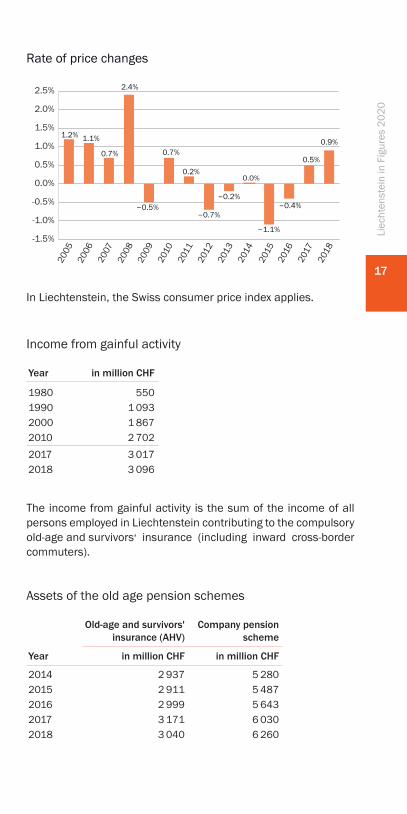
The income from gainful activity is the sum of the income of all persons employed in Liechtenstein contributing to the compulsoryold-age and survivors‘ insurance (including inward cross-bordercommuters).
Assets of the old age pension schemes
Year
Old-age and survivors' insurance (AHV)
Company pension scheme
in million CHF in million CHF
2014 2 937 5 280 2015 2 911 5 487 2016 2 999 5 6432017 3 171 6 0302018 3 040 6 260
In Liechtenstein, the Swiss consumer price index applies.
0.7%
0.2%
–0.2%
0.5%
0.9%1.2% 1.1%
0.7%
2.4%
–0.5%–0.7%
-1.5%
-1.0%
-0.5%
0.0%
0.5%
1.0%
1.5%
2.0%
2.5%
2018
2017
2016
2015
2014
2013
2012
2011
2010
2009
2008
2007
2006
2005
0.0%
–1.1%
–0.4%
Rate of price changes
Income from gainful activity
Year in million CHF
1980 5501990 1 0932000 1 8672010 2 7022017 3 0172018 3 096

18
Liec
hten
stei
n in
Fig
ures
202
0
A distinctive feature of Liechtenstein’s national economy is the large number of inward cross-border commuters. In 2018, 56% of Liechtenstein’s work force consisted of this group. Since GDP is generated by the entire work force, country comparisons of GDP per capita may lead to misleading conclusions in the case of Liechtenstein. Hence, GDP per person employed may be consid-ered a more appropriate figure to compare Liechtenstein across countries.
GDP and GNI at current prices
Year
Gross domestic product (GDP)
GDP per employed person
Gross national income (GNI)
GNI per inhabitant
in billion CHF in CHF in billion CHF in CHF
2013 5.9 193 010 4.7 128 0802014 6.1 196 630 4.9 132 1802015 6.0 193 150 5.0 132 5102016 6.1 194 990 5.9 156 3902017 6.5 199 700 6.7 176 760
GDP at current prices in comparison, 2017
CountryNational currency
in billion in billion CHF
LiechtensteinSwitzerlandAustriaGermany
Euro converted at yearly average rate (1 EUR = 1.111569 CHF).
CHF 6.5 6.5CHF 669.5 669.5EUR 370.3 411.6EUR 3 245.0 3 607.0

19
Liec
hten
stei
n in
Fig
ures
202
0Number of enterprises by sector and size
2017 2018 Change
Total
Economic sectorSector 1 Agriculture Sector 2 GoodsSector 3 Services
Size class1–9 employees10–49 employees50–249 employees250+ employees
4 710 4 878 3.6%
95 99 4.2%604 623 3.1%
4 011 4 156 3.6%
4 154 4 305 3.6%443 461 4.1%
96 95 -1.0%17 17 0.0%
46.6%
0.1%
53.3%
Gross value added by economic sector, 2017
Agriculture (Sector 1)
Services (Sector 3)
Goods (Sector 2)
In 2017, financial services accounted for 22.1% of total value ad-ded and other services for 31.2%. In Liechtenstein, the economic branches financial & insurance activities, legal & accounting ac-tivities (incl. trust) and activities of head offices are regarded as financial service providers.
20
Liec
hten
stei
n in
Fig
ures
202
0
Social protection in Liechtenstein
Industrial Code Act (1910)•Sickness and maternity insurance compulsory for commercial employees•Obligatory accident insurance for companies with more than ten employees or companies with special risksNon-occupational accident insurance (1932)Old-age and survivors’ insurance (1952)Family allowance (1957)Bad weather compensation in the construction industry (1957)Subsidy for the building of houses (1958)Disability insurance (1959)Occupational illnesses protection (1961)Supplementary allowances for old-age, survivors’ and disability insurance (1965)Social assistance for individual cases (1966)Unemployment insurance (1970)Blind persons allowance (1971)Compulsory health insurance (1971)Widowers pension (1981)Maternity benefits (1982)Insolvency compensation (1985)Company pension scheme (1989)Single parent allowance (1999)Rent allowance (housing benefit) (2001)Reduction of premiums for health insurance (2004)
Bilateral social security agreements were signed with Switzerland, Austria, Germany and Italy.
Through the EEA Agreement, various European legal acts in the field of social security also apply in Liechtenstein.

21
Liec
hten
stei
n in
Fig
ures
202
0
Sustainable development
In the areas of education and culture, employment, economy as well as energy and climate the development is positive or at the very least slightly positive.
The areas of living conditions, health, social cohesion, internation-al cooperation and natural resources show no significant chang-es. Therefore the overall evaluation in these areas is neutral.
However, the development of the area of mobility is not moving towards sustainability.
-
-
-
-
-
-
-
-
-
-
+
+
+
+
+
+
+
+
+
+
Indicators of sustainable development, 2019
Living Conditions
Health
Social Cohesion
International Cooperation
Education and Culture
Employment
Economy
Mobility
Energy and Climate
Natural Resources
Positive (sustainable trend)
Negative (non-sustainable trend)
NeutralEvaluation 2019
22
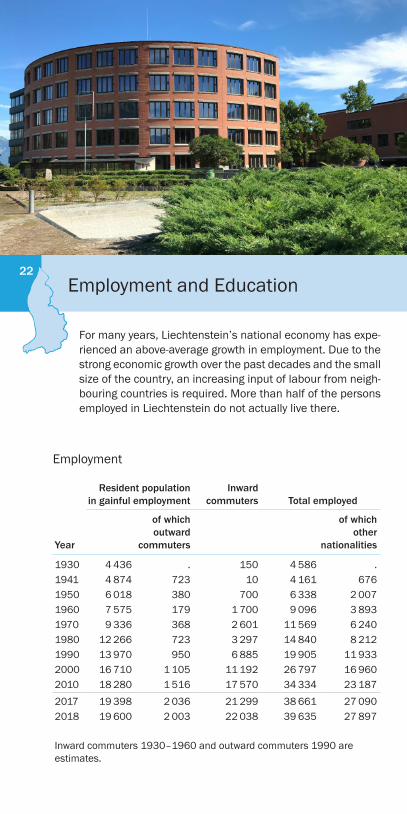
For many years, Liechtenstein’s national economy has expe-rienced an above-average growth in employment. Due to the strong economic growth over the past decades and the small size of the country, an increasing input of labour from neigh-bouring countries is required. More than half of the persons employed in Liechtenstein do not actually live there.
Employment and Education
Employment
Resident population in gainful employment
Inward commuters Total employed
Year
of which outward
commuters
of which other
nationalities
Inward commuters 1930–1960 and outward commuters 1990 are estimates.
1930 4 436 . 150 4 586 .1941 4 874 723 10 4 161 6761950 6 018 380 700 6 338 2 0071960 7 575 179 1 700 9 096 3 8931970 9 336 368 2 601 11 569 6 2401980 12 266 723 3 297 14 840 8 2121990 13 970 950 6 885 19 905 11 9332000 16 710 1 105 11 192 26 797 16 9602010 18 280 1 516 17 570 34 334 23 1872017 19 398 2 036 21 299 38 661 27 0902018 19 600 2 003 22 038 39 635 27 897

23
Liec
hten
stei
n in
Fig
ures
202
0
Persons employed by economic sector, 2018compared with neighbouring countries
Liechtenstein Switzerland Austria Germany
Sector 1 AgricultureSector 2 GoodsSector 3 Services
0.6% 3.0% 3.7% 1.4%37.4% 20.8% 25.4% 24.3%61.9% 76.2% 70.9% 74.4%
0
5 000
10 000
15 000
20 000
25 000
30 000
35 000
40 000Sektor 1 Landwirtschaft
Sektor 2 Industrie
Sektor 3 Dienstleistungen
2018201720102000199019801970
Employment by economic sector
Sector 1Agriculture
Sector 2Goods
Sector 3Services
0.6%
37.4%
61.9%
Employment by economic sector (31.12.2018)
Sector 1Agriculture
Sector 2Goods
Sector 3Services

24
Liec
hten
stei
n in
Fig
ures
202
0
56.5%
39.5%
2.9%1.1% Others
Inward commuters by residence
Switzerland
Austria
Germany
29.6%
70.4%
Employees by nationality
Liechtensteiners
Other nationalities
19 184
19 600
2 003
17 597
628
22 038
17 597
11 110
39 635
38 784
38 378406
Total employment as at 31 December 2018 – Summary
not in gainful employment
in gainful employment
Outward commuters
employed in Liechtenstein
Inward commuters
Residents in Liechtenstein
thereofLiechtensteiners
thereofLiechtensteiners
Residents Employed in Liechtenstein
non-permanentpermanent

25
Liec
hten
stei
n in
Fig
ures
202
0
Employment by economic branch, 2018
Resident population in gainful employment Employed in Liechtenstein
of which outward
commuters
Inward commu-
ters TotalShare
in %
Total
Sector 1 Agriculture
Sector 2 GoodsMining & quarryingManufacturing
Energy & water supply; sewerage & waste remediationConstruction
Sector 3 Services
Wholesale & retail trade; repair of motor vehicles & motorcyclesTransportation & storage
Accommodation & food service activitiesInformation & communicationFinancial & insurance activitiesReal estate activitiesLegal & accounting activities
Activities of head offices; management consultancy activities
Architectural & engineering activities; technical testing & analysis
Scientific research & development; other technical activities
Administrative & support service activities
Public administration; compulsory social securityEducation
Human health & social work activitiesArts, entertainment, recreationOther service activitiesHouseholds as employers
Activities of extraterritorial organisations
19 600 2 003 22 038 39 635 100.0
223 8 36 251 0.6
5 604 671 9 902 14 835 37.425 - 21 46 0.1
3 787 538 8 568 11 817 29.8
220 28 122 314 0.81 572 105 1 191 2 658 6.7
13 773 1 324 12 100 24 549 61.9
1 707 328 1 567 2 946 7.4521 81 582 1 022 2.6
629 67 474 1 036 2.6464 59 494 899 2.3
1 614 86 2 298 3 826 9.7113 13 58 158 0.4
1 519 24 1 324 2 819 7.1
365 34 389 720 1.8
495 58 406 843 2.1
230 19 172 383 1.0
914 49 1 580 2 445 6.2
1 509 47 347 1 809 4.6847 111 489 1 225 3.1
1 827 264 1 014 2 577 6.5318 18 307 607 1.5537 47 252 742 1.9137 2 310 445 1.1
27 17 37 47 0.1
In 2018, financial services accounted for 18.6% of employees and 43.3% for other services. In Liechtenstein, the economic sec-tors financial & insurance activities, legal & accounting activities (trust) and activities of head offices are regarded as financial ser-vice providers.

26
Liec
hten
stei
n in
Fig
ures
202
0
Gross monthly wage by sex and age, 2016 (median)
Gross monthly wage in CHF
Both sexes Men Women
Total
20–29 years30–39 years40–49 years50–59 years60+ years
6 603 7 050 5 976
5 114 5 187 5 0006 758 6 964 6 3847 359 8 017 6 4837 268 8 136 6 2287 200 8 097 6 041
0 2 000 4 000 6 000 8 000
6 603
6 667
6 556
3 787
Gross monthly wage by economic sector, 2016 (median)in CHF
Agriculture
Total economy
Goods
Services

27
Liec
hten
stei
n in
Fig
ures
202
0
Labour market – Unemployment
Unemployed persons are those who are registered at the Office of Economic Affairs, who live in Liechtenstein and who are able to take up employment within two weeks. Due to statistical recor-ding difficulties, persons who enter a longer-term further educa-tion programme or who are on maternity leave are also counted as unemployed.
0.0%
0.5%
1.0%
1.5%
2.0%
2.5%
3.0%
3.5%
4.0%
Dec 17 Dec 16Dec 15Dec 14 Dec 13Dec 12Dec 11 Dec 18
Unemployment rate
Unemployment
as at 31.12. Jobseekers Unemployed Unemployment rate
2009 776 545 3.0%2010 628 401 2.2%2011 654 463 2.5%2012 635 443 2.3%2013 663 481 2.5%2014 635 463 2.4%2015 683 475 2.4%2016 622 406 2.1%2017 527 343 1.8%2018 502 325 1.7%

28
Liec
hten
stei
n in
Fig
ures
202
0
Education
The educational institutions in Liechtenstein offer a wide range of opportunities on primary and lower secondary level. On upper se-condary and tertiary level, the domestic institutions only partially cover the educational needs of the population. Therefore, a lot of students go abroad for tertiary education. In the academic year 2017/18 1 012 students from Liechtenstein were registered at advanced vocational colleges and other higher education institu-tions abroad. 76% of these students joined educational program-mes in Switzerland, 20% in Austria and 4% in Germany.
Pupils
From kindergarten to secondary education
Total
KindergartenPrimary schoolSpecial schoolOberschule (Secondary school)Realschule (Secondary school)
Grammar school
Voluntary tenth school year
Resident population
1990/91 2000/01 2010/11 2017/18
4 153 4 885 4 898 4 729
739 862 725 7381 892 2 111 2 014 1 965
65 71 84 86
403 423 389 379
567 700 885 727
487 679 741 773
. 39 60 61
29 032 32 863 36 149 38 114
0
1 000
2 000
3 000
4 000
Period: 2010-20182017/182010/112000/011990/91
Pupils in compulsory school (9 years)Primary and lower secondary education
Live births

29
Liec
hten
stei
n in
Fig
ures
202
0
Apprentices in enterprises
Total
Percentage of womenResidence abroadPercentage with vocatio-nal secondary school
Jobs in Liechtenstein
1990/91 2000/01 2010/11 2017/18
936 1 011 1 203 1 042
. 35.8% 36.8% 38.3%37.3% 43.2% 32.7% 27.6%
. 10.6% 9.2% 8.0%
19 905 27 177 35 700 40 601
Students at universities in Liechtenstein
Field of study
Total
EconomicsTechnical sciencesLawMedicine and pharmacy
Humanities and social sciences
Percentage of women
Not included are students in further education programmes.
2015/16 2016/17 2017/18
685 730 780
393 425 439176 206 215
48 41 6363 51 52
5 7 11
37.0% 38.9% 37.6%
Students from Liechtenstein at universities
Place of study 2015/16 2016/17 2017/18
Total 1 064 1 058 1 094
Liechtenstein 61 60 82Switzerland 776 766 771Austria 189 195 198Germany 38 37 43
Percentage of women 45.2% 45.6% 47.3%
30
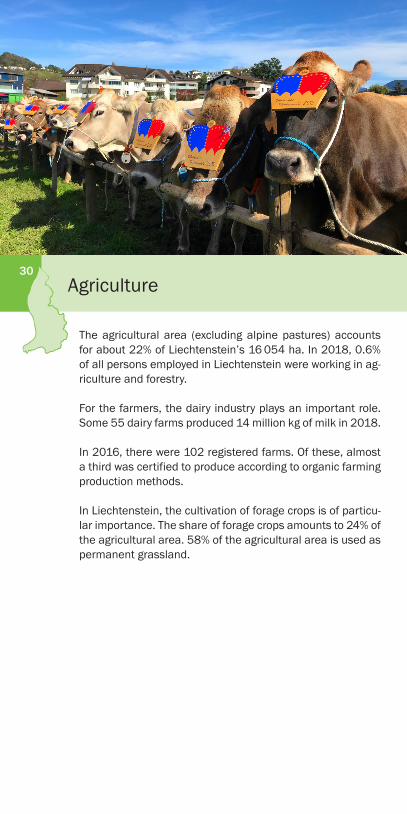
The agricultural area (excluding alpine pastures) accounts for about 22% of Liechtenstein’s 16 054 ha. In 2018, 0.6% of all persons employed in Liechtenstein were working in ag-riculture and forestry.
For the farmers, the dairy industry plays an important role. Some 55 dairy farms produced 14 million kg of milk in 2018.
In 2016, there were 102 registered farms. Of these, almost a third was certified to produce according to organic farming production methods.
In Liechtenstein, the cultivation of forage crops is of particu-lar importance. The share of forage crops amounts to 24% of the agricultural area. 58% of the agricultural area is used as permanent grassland.
Agriculture

31
Liec
hten
stei
n in
Fig
ures
202
0
Livestock and milk production
Cattleof which cows
EquidaePigsSheepGoatsPoultryBee colonies
Milk production (in 1 000 kg)
Livestock of all livestock owners (including agricultural units receiving agricultural subsidies in form of direct payments).Milk delivery to dairy (excluding milk from alpine pastures).
1990 2000 2010 2018
6 328 5 054 5 993 5 8942 827 2 562 2 807 2 721
239 379 489 4743 251 2 013 1 690 1 7722 781 3 319 3 656 3 989
171 239 416 431. . 12 626 12 779
1 058 953 1 173 985
13 158
12 968 13 493 13 794
0
100
200
300
400
500
600 > 20 ha
10–20 ha
5–10 ha
< 5 ha
20162010200520001995199019851980
Farms by size
Farms by size
Year
Total Size in ha
< 5 5–10 10–20 > 20
Since 2010: Only farms receiving agricultural subsidies in form of direct payments.
1980 494 286 80 70 581990 417 248 43 45 812000 199 73 23 29 742010 118 7 13 20 782016 102 4 8 13 77

32
Liechtenstein’s economy continues to be strongly shaped by its goods production. In 2018, the goods-producing sector provided 36% of all jobs. This represents a remarkably high proportion, compared to other European countries.
Jobs in the goods-producing industry are provided by a to-tal of 623 enterprises. These enterprises are mainly small companies with less than 50 persons employed. They are engaged in a large number of specialised market niches and contribute to the broad diversification of Liechtenstein’s economy. The most important branches include mechanical engineering, manufacturing of electrical machinery, vehicle components, dental technology, the production of food, as well as construction work.
Due to Liechtenstein’s limited domestic market, especially larger enterprises are heavily export-oriented. A vast majority of their goods production is sold abroad.
The most important export destinations for Liechtenstein’s goods-producing industry are Switzerland, Germany and the USA.
Goods-producing industry

33
Liec
hten
stei
n in
Fig
ures
202
0
0
1 000
2 000
3 000
4 000
5 000
201520102005200019951990
Direct goods exports and imports (without Switzerland)in million CHF
Direct exports
Direct imports
Direct goods exports (without Switzerland)
Year in million CHF Change
2009 3 081 -27.4%2010 3 325 7.9%2011 3 329 0.1%2012 3 388 1.8%2013 3 389 0.0%2014 3 453 1.9%2015 3 217 -6.9%2016 3 355 4.3%2017 3 372 0.5%2018 3 657 8.4%
Direct goods imports (without Switzerland)
Year in million CHF Change
Data of the Swiss Federal Customs Administration. Goods exchange with and via Switzerland is not recorded because of the commen customs union.
2009 1 924 -21.8%2010 1 882 -2.2%2011 1 965 4.4%2012 1 860 -5.4%2013 1 909 2.6%2014 2 040 6.9%2015 1 916 -6.1%2016 1 980 3.4%2017 2 001 1.0%2018 2 015 0.6%

34Services-providing industry
Around three-fifths of all persons employed work in the ser-vices sector. In this sector, the most important branches of the economy include financial and insurance services, legal and tax consultancy as well as trade. The wide range of ser-vices comprises more than 300 kinds of economic activity.
0500
1 000
1 500
2 000
2 500
3 000
3 500
4 000
4 500
2018
2017
2016
2015
2014
2013
2012
2011
2010
2009
2008
2007
2006
2005
2004
Enterprises in the service sector
35
Liec
hten
stei
n in
Fig
ures
202
0
0
20
40
60
80
2018
2017
2016
2015
2014
2013
2012
2011
2010
2009
2008
2007
2006
2005
2004
2003
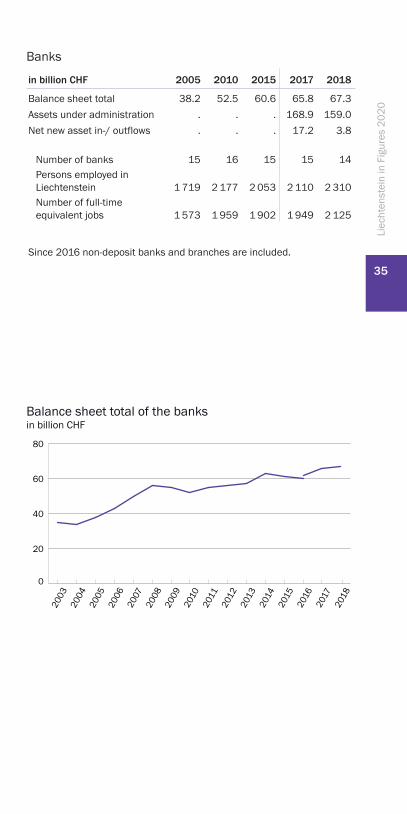
Balance sheet total of the banks in billion CHF
Banks
in billion CHF 2005 2010 2015 2017 2018
Balance sheet total 38.2 52.5 60.6 65.8 67.3Assets under administration . . . 168.9 159.0Net new asset in-/ outflows . . . 17.2 3.8
Number of banks 15 16 15 15 14Persons employed in Liechtenstein 1 719 2 177 2 053 2 110 2 310Number of full-time equivalent jobs 1 573 1 959 1 902 1 949 2 125
Since 2016 non-deposit banks and branches are included.
36
Liec
hten
stei
n in
Fig
ures
202
0
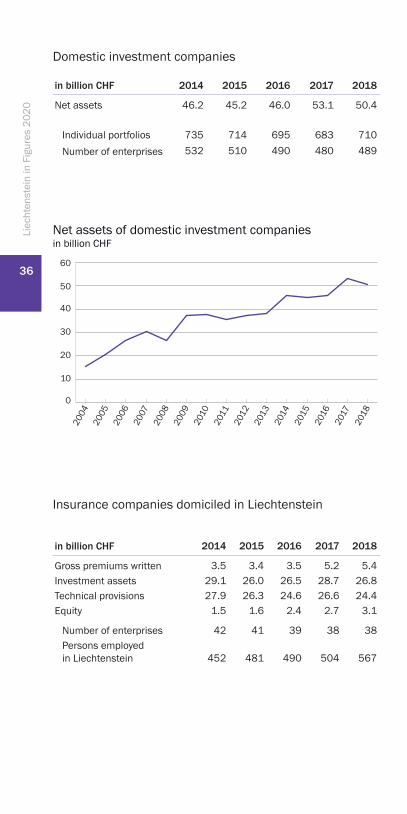
Domestic investment companies
in billion CHF
Net assets
Individual portfoliosNumber of enterprises
2014 2015 2016 2017 2018
46.2 45.2 46.0 53.1 50.4
735 714 695 683 710532 510 490 480 489
Insurance companies domiciled in Liechtenstein
in billion CHF
Gross premiums writtenInvestment assetsTechnical provisionsEquity
Number of enterprisesPersons employed in Liechtenstein
2014 2015 2016 2017 2018
3.5 3.4 3.5 5.2 5.429.1 26.0 26.5 28.7 26.827.9 26.3 24.6 26.6 24.4
1.5 1.6 2.4 2.7 3.1
42 41 39 38 38
452 481 490 504 567
0
10
20
30
40
50
60
2018
2017
2016
2015
2014
2013
2012
2011
2010
2009
2008
2007
2006
2005
2004
Net assets of domestic investment companiesin billion CHF

37
Liec
hten
stei
n in
Fig
ures
202
0
Trustees, auditors, lawyers
2016 2017 2018
Trustees 175 184 191Trust companies 290 285 276Financial auditors 79 83 83Auditing firms 46 46 46Lawyers 229 239 256Law societies 38 40 43Patent lawyers 7 7 6Patent law firms 3 3 3
Hotels and guest houses
YearHotels and
guest housesBeds
available Guest arrivals Overnight stays
1970 70 1 415 72 421 145 2471980 64 1 760 85 033 182 4431990 60 1 387 77 735 149 8612000 49 1 184 62 894 133 4852010 40 1 098 51 815 115 0512017 35 1 338 70 058 127 2322018 34 1 302 73 195 136 066
Tourism
The majority of people visiting Liechtenstein are day tourists. In group tourism, the Principality is very popular as a place to visit and as a shopping stop on round trips (primarily for watches, jewelry and souvenirs). The average length of stay of overnight guests in 2018 was 1.9 nights.
The figures include licences for restricted activities, licences benefiting from free movement of services and established EU lawyers.

38
Liechtenstein’s road network consists of 420 km of asphal-ted and 425 km of unpaved roads. The well developed public transport relies mostly on buses, which connect the eleven municipalities with each other and with the railway networks in Switzerland and Austria. The railway line links Feldkirch in Austria to Buchs in Switzerland and has three stops in Liechtenstein.
The level of motorisation is very high. There are around 790 passenger cars for every 1 000 inhabitants. This represents a peak value in Europe. In the neighbouring countries of Switzerland and Austria around 540 respectively 560 pas-senger cars per 1 000 inhabitants are in use.
Transport and Communication
Motor vehicles
Year (as at 30.6.)
Motor vehicles Cars
Numberper 1 000
inhabitants Numberper 1 000
inhabitants
1980 15 269 592 12 569 4871990 21 233 746 16 891 5942000 28 447 877 21 784 6722010 35 291 983 26 890 7492018 40 228 1 056 29 949 7862019 40 649 1 059 30 248 788
39
Liec
hten
stei
n in
Fig
ures
202
0
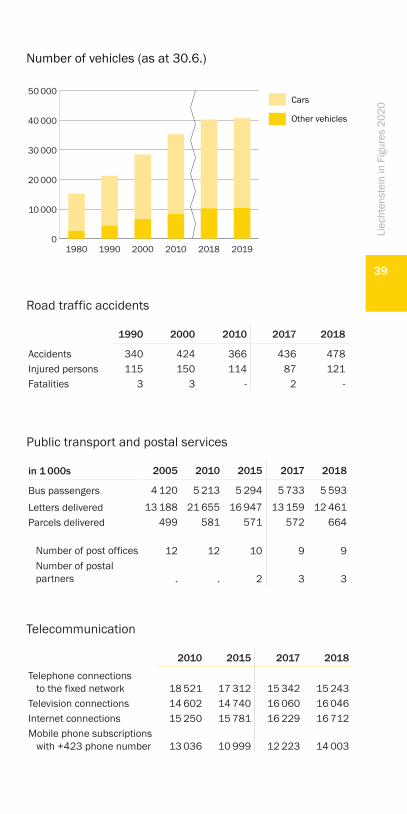
Public transport and postal services
in 1 000s
Bus passengersLetters deliveredParcels delivered
Number of post officesNumber of postal partners
2005 2010 2015 2017 2018
4 120 5 213 5 294 5 733 5 59313 188 21 655 16 947 13 159 12 461
499 581 571 572 664
12 12 10 9 9
. . 2 3 3
0
10 000
20 000
30 000
40 000
50 000
201920182010200019901980
Number of vehicles (as at 30.6.)
Other vehicles
Cars
Road traffic accidents
AccidentsInjured personsFatalities
1990 2000 2010 2017 2018
340 424 366 436 478115 150 114 87 121
3 3 - 2 -
Telecommunication
2010 2015 2017 2018
Telephone connections to the fixed network 18 521 17 312 15 342 15 243Television connections 14 602 14 740 16 060 16 046Internet connections 15 250 15 781 16 229 16 712Mobile phone subscriptions with +423 phone number 13 036 10 999 12 223 14 003

40
Electricity, natural gas, heating oil, diesel oil and petrol are amongst the major energy sources in Liechtenstein, which is strongly dependent upon energy imports. The proportion of own energy supply to total energy consumption is 13%. Energy production in Liechtenstein is limited to the energy sources electricity, firewood and biogas.
Energy
34.0%
20.5%9.1%
8.5%9.6%
5.2%0.1%
0.9%12.2%
Energy consumption/ imports, 2018
Natural gas, biogas
Electricity
Fuel oil
PetrolLong-distance heating(waste incineration)
FirewoodLiquid gas
Solar panelsDiesel oil
41
Liec
hten
stei
n in
Fig
ures
202
0
0
100
200
300
400
500
20152010200520001995
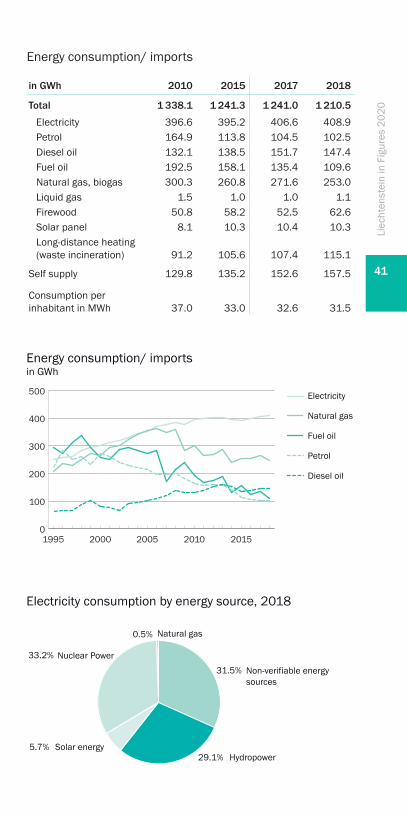
Energy consumption/ importsin GWh
Electricity
Natural gas
Fuel oil
Petrol
Diesel oil
Energy consumption/ imports
in GWh 2010 2015 2017 2018
Total 1 338.1 1 241.3 1 241.0 1 210.5
Electricity 396.6 395.2 406.6 408.9Petrol 164.9 113.8 104.5 102.5Diesel oil 132.1 138.5 151.7 147.4Fuel oil 192.5 158.1 135.4 109.6Natural gas, biogas 300.3 260.8 271.6 253.0Liquid gas 1.5 1.0 1.0 1.1Firewood 50.8 58.2 52.5 62.6Solar panel 8.1 10.3 10.4 10.3Long-distance heating (waste incineration) 91.2 105.6 107.4 115.1
Self supply 129.8 135.2 152.6 157.5
Consumption per inhabitant in MWh 37.0 33.0 32.6 31.5
29.1%
31.5%
5.7%
33.2%
0.5%
Electricity consumption by energy source, 2018
HydropowerSolar energy
Non-verifiable energysources
Nuclear Power
Natural gas

42
Liechtenstein’s public authority budgets comprise the na-tional budget and the budgets of the eleven municipalities. In 2018, total tax receipts amounted to around CHF 924 mil-lion. Other sources of revenue include property investment incomes and fees. On the expenditure side, major expenses are for social welfare and education.
Public Finance
Fiscal income
in million CHF
Total
TaxesSocial contributions
2000 2010 2017 2018
959 1 158 1 246 1 315
739 833 874 924220 324 372 391
CHF 270
CHF 163CHF 205
CHF 45
CHF 241
Tax revenues by type of tax, 2018
million
Value added taxmillion
million
million
million
Property and income tax
Other taxes, duties
Stamp duties
Earnings tax
State and municipalities

43
Liec
hten
stei
n in
Fig
ures
202
0 CHF 134
CHF 102
CHF 175
CHF 158
CHF 163
CHF 63
Allgemeine Verwaltung
Current expenditures by purpose, 2018
million Others
million Public safety
million
million
million General administration
million Social welfareFinance, taxation
Education
CHF -2
CHF 783
CHF 35 CHF 30 CHF 0.3
Current revenues by type, 2018
million Withdrawals from special fundsmillion Repayments from municipalitiesmillion Service charges
million Revenues from assets
million Taxes and duties
National budget
Overview of the accounts
in million CHF
Operating revenueOperating expenditure
Operating result
Net financial resultExtraordinary result
Result of the profit and loss account
Depreciation on fixed capitalGross investmentInvestment income
Financing surplus/ deficit (-)
2017 2018
800 854-789 -793
11 61
160 -8 - -
170 53
36 39-32 -3517 16
190 73
44
Liec
hten
stei
n in
Fig
ures
202
0
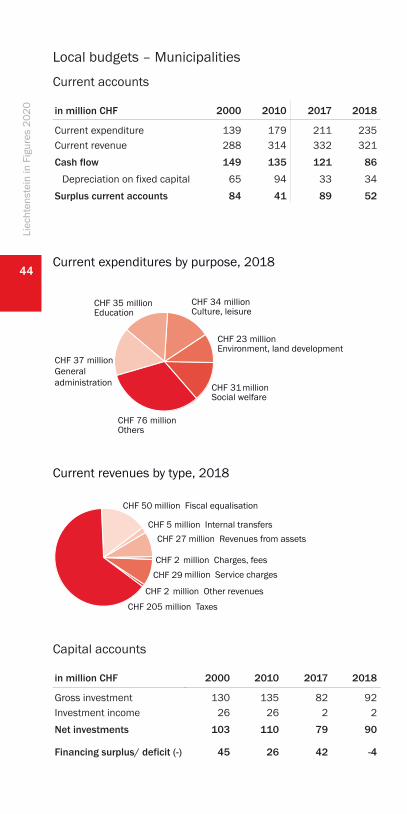
Local budgets – Municipalities
Current accounts
in million CHF
Current expenditureCurrent revenueCash flow
Depreciation on fixed capitalSurplus current accounts
2000 2010 2017 2018
139 179 211 235288 314 332 321149 135 121 86
65 94 33 3484 41 89 52
Capital accounts
in million CHF
Gross investmentInvestment incomeNet investments
Financing surplus/ deficit (-)
2000 2010 2017 2018
130 135 82 9226 26 2 2
103 110 79 90
45 26 42 -4
CHF 23
CHF 31
CHF 76
CHF 37
CHF 34CHF 35
Current expenditures by purpose, 2018
million
million
million
Generaladministration
million million
Environment, land development
Education Culture, leisure
Social welfare
Others
million
CHF 205
CHF 2
CHF 50
CHF 27CHF 5
CHF 29
CHF 2
Current revenues by type, 2018
million Internal transfersmillion Revenues from assets
million Fiscal equalisation
million Taxes
million Charges, feesmillion Service charges
million Other revenues

45
Liec
hten
stei
n in
Fig
ures
202
0
General governmentThe government finance statistics provide an overview of the finan-cial situation of the general government (central government, lo-cal government, social security funds). The general government’s net lending amounted to CHF 188.7 million in 2017. This corres-ponds to 3.1% of the gross domestic product.
Government revenue and expenditure by subsector, 2017
in million CHF
General govern-
ment
Central govern-
ment
Local govern-
ment
Social security
funds
Revenue 1 711.7 896.9 333.9 480.9
Taxes 874.4 673.4 201.1 - Social contributions 371.6 - - 371.6 Sales 119.8 64.3 45.0 10.5 Other current revenue 345.1 159.3 87.1 98.8 Capital revenue 0.7 0.0 0.7 -Expenditure 1 523.0 824.3 281.3 417.5
Intermediate consumption 216.8 118.6 83.1 15.1 Compensation of employees 323.2 256.7 56.8 9.6 Interest 0.3 0.0 0.3 0.0 Subsidies 55.2 55.2 - - Social benefits 490.3 81.8 16.8 391.6 Other current expenditure 324.4 282.1 42.3 - Capital transfers payable 26.6 16.3 10.3 - Capital investments 86.3 13.5 71.6 1.2Net lending (+) / netborrowing (-) 188.7 72.6 52.7 63.4
Transfer revenue within the government sector 217.8 70.7 9.0 - Transfer expenditure within the government sector 217.8 70.7 9.0 -Consolidated revenue 1 494.0 826.2 324.9 480.9
Consolidated expenditure 1 305.3 753.6 272.2 417.5
Central government = State, public corporations stateLocal government = Municipalities, public corporations municipalities, ci-tizens’ cooperatives Social security funds = Old-age, survivors’ and disability insurance, unem-ployment fundData are consolidated between and within the sector of general government.
46
Liec
hten
stei
n in
Fig
ures
202
0
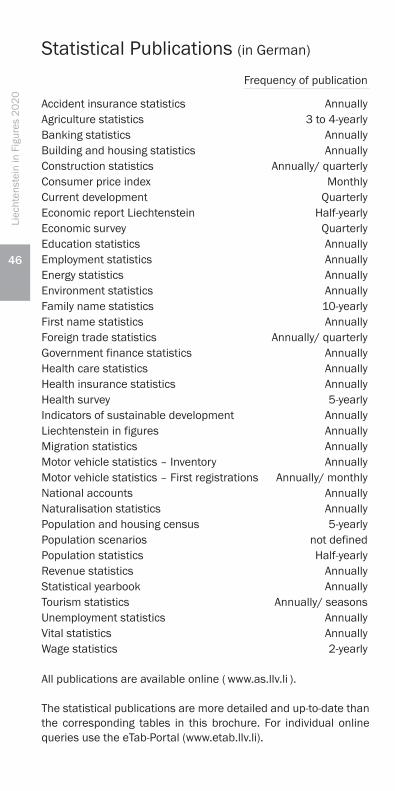
Statistical Publications (in German)
Frequency of publication
Accident insurance statistics AnnuallyAgriculture statistics 3 to 4-yearlyBanking statistics AnnuallyBuilding and housing statistics AnnuallyConstruction statistics Annually/ quarterlyConsumer price index MonthlyCurrent development QuarterlyEconomic report Liechtenstein Half-yearlyEconomic survey QuarterlyEducation statistics AnnuallyEmployment statistics AnnuallyEnergy statistics AnnuallyEnvironment statistics AnnuallyFamily name statistics 10-yearlyFirst name statistics AnnuallyForeign trade statistics Annually/ quarterlyGovernment finance statistics AnnuallyHealth care statistics AnnuallyHealth insurance statistics AnnuallyHealth survey 5-yearlyIndicators of sustainable development AnnuallyLiechtenstein in figures AnnuallyMigration statistics AnnuallyMotor vehicle statistics – Inventory AnnuallyMotor vehicle statistics – First registrations Annually/ monthlyNational accounts AnnuallyNaturalisation statistics AnnuallyPopulation and housing census 5-yearlyPopulation scenarios not definedPopulation statistics Half-yearlyRevenue statistics AnnuallyStatistical yearbook AnnuallyTourism statistics Annually/ seasonsUnemployment statistics AnnuallyVital statistics AnnuallyWage statistics 2-yearly
All publications are available online ( www.as.llv.li ).
The statistical publications are more detailed and up-to-date than the corresponding tables in this brochure. For individual online queries use the eTab-Portal (www.etab.llv.li).

47
Liec
hten
stei
n in
Fig
ures
202
0

Äulestrasse 519490 VaduzLiechtensteinT +423 236 68 76F +423 236 69 [email protected]
www.as.llv.li
Office of Statistics


