
LIFE CYCLE ANALYSIS OF THE DECONSTRUCTION OF MILITARY
BARRACKS: A CASE STUDY AT FT. MCCLELLAN, ANNISTON, ALABAMA
By
ELIZABETH O’BRIEN
A THESIS PRESENTED TO THE GRADUATE SCHOOL OF THE UNIVERSITY OF FLORIDA IN PARTIAL FULFILLMENT
OF THE REQUIREMENTS FOR THE DEGREE OF MASTER OF ENGINEERING
UNIVERSITY OF FLORIDA
2006

Copyright 2006
by
ELIZABETH O’BRIEN
iii
ACKNOWLEDGMENTS
I would like to first acknowledge and thank the Department of Defense for the
grant funding that made this project possible. I am also grateful to Brad Guy and Timothy
Williams for their leadership and guidance of the deconstruction team and for their work
in collecting and organizing the data used in the life cycle assessment. I would also like
to thank Costello Dismantling Company for its help in the deconstruction and demolition
of the military barracks at Ft. McClellan.
I acknowledge and thank Dr. Angela S. Lindner, my supervisory committee
chairperson, for her time, hard work, leadership, and guidance during this project. I thank
my committee members Drs. Timothy Townsend and Charles Kibert for their direction,
time, and support. I am also very grateful to my research group for feedback and support
throughout this project. I acknowledge and thank my family, roommates and friends for
all of their support and guidance.

iv
TABLE OF CONTENTS page
ACKNOWLEDGMENTS ................................................................................................. iii
LIST OF TABLES............................................................................................................ vii
LIST OF FIGURES ......................................................................................................... viii
ABSTRACT....................................................................................................................... ix
CHAPTER
1 INTRODUCTION ........................................................................................................1
A Case for Deconstruction............................................................................................2 Advantages ............................................................................................................2 Disadvantages........................................................................................................4 Is Reuse of Non-Virgin Wood Possible?...............................................................5
A Case for Virgin Wood...............................................................................................8 Research Scope...........................................................................................................12
2 REVIEW OF LITERATURE.....................................................................................14
Amount of Construction Each Year ...........................................................................14 Amount of Deconstruction/Demolition Each Year ....................................................15
Increased Availability of Materials .....................................................................15 How are Virgin Trees Turned Into Usable Wood? .............................................16
Virgin Wood Processes...............................................................................................16 Harvesting............................................................................................................16 Sawmill................................................................................................................17
The Deconstruction Process .......................................................................................18 Raw Material Extraction......................................................................................18 Material Refining.................................................................................................21 Use/Reuse ............................................................................................................22 Disposal ...............................................................................................................23 Disadvantages of Unlined Landfills ....................................................................25
Costs of Deconstruction Verses Demolition...............................................................28

v
3 LIFE CYCLE ANALYSIS.........................................................................................33
Abstract.......................................................................................................................33 Introduction.................................................................................................................34 Methods ......................................................................................................................37
Description of Fort McClellan Barracks .............................................................37 The Deconstruction Process and Four Scenarios Studied ...................................37
Life Cycle Analysis ....................................................................................................39 Functional Unit ....................................................................................................39 Scope and Goal Definition ..................................................................................39 Figure 3-2 ............................................................................................................39 Figures 3-3 and 3-4..............................................................................................40 Data Inventory .....................................................................................................41 Impact Assessment ..............................................................................................42
Assumptions and Limitations .....................................................................................42 Sensitivity Analysis ....................................................................................................44 Results and Discussion ...............................................................................................45
Data Inventory .....................................................................................................45 Time Requirements for Removal of Barrack Components .................................45 Labor and Machine Time and Mileage Requirements and Material Yields........47 Fuel and Electricity Requirements ......................................................................49
Emissions....................................................................................................................51 Impact Analysis ..........................................................................................................53 Case 1: No Salvaging..................................................................................................53 Case 2: Salvaging and No Long-Distance Transportation to a Storage Facility
(Local Reuse) ..........................................................................................................55 Case 3: Salvaging and Transport to Austin, TX, for Reuse........................................56 Sensitivity Analysis ....................................................................................................57
Time for Deconstruction or Demolition Activities .............................................57 Commuting Distance ...........................................................................................58 Recycling.............................................................................................................58 Transportation Requirements ..............................................................................58 Time Required for Paint and Nail Removal ........................................................59
Conclusions.................................................................................................................59
4 SUMMARY, CONCLUSIONS AND RECOMENDATIONS..................................76
Summary.....................................................................................................................76 Conclusions.................................................................................................................76 Recommendations.......................................................................................................79
APPENDIX
A DATA COLLECTION AND DAILY NARRRRATIVE...........................................81
Introduction to the Form.............................................................................................81 Key to Form................................................................................................................83

vi
Team....................................................................................................................83 Completed by.......................................................................................................83 Date......................................................................................................................83 Time.....................................................................................................................83 Name....................................................................................................................83 Building ...............................................................................................................84 Room ...................................................................................................................84 Location...............................................................................................................84 Activity ................................................................................................................85
HDec (hand deconstruction) ............................................................................85 HDem (hand demolition) .................................................................................85 MDec (mechanically assisted deconstruction).................................................87 MDem (mechanically assisted demolition) .....................................................87 N (non-productive)...........................................................................................87 P (processing)...................................................................................................88 S (supervising) .................................................................................................88
Assembly .............................................................................................................88 Equipment............................................................................................................88
B INVENTORY OF EMISSIONS.................................................................................90
LIST OF REFERENCES...................................................................................................95
BIOGRAPHICAL SKETCH .............................................................................................99

vii
LIST OF TABLES
Table page 2-1. C&D Waste Material Categories and Sources ..........................................................19
2-2. Amount of Chemical Constituents in Wood Products (Construction and Demolition Waste Landfills 1995)...........................................................................26
3-1 Time Requirements for Removing Components of Barracks Using the Four Scenarios Varying in Degree of Manual Deconstructiona, b.....................................61
3-2 Labor and Machine Requirements and Material Yields of the Four Scenarios Studied......................................................................................................................62
3-3 Fuel and Electricity Requirements for Associated Processesa,b .................................63
3-4 Emissions from the Scenario Involving 100% Manual Methodsa.............................64
3-5 Emissions from the Scenario Involving 44% Manual Methodsa................................65
3-6 Emissions from the Scenario Involving 26% Manual Methodsa...............................66
3-7 Emissions from the Scenario Involving 100% Mechanical Methodsa, b.....................67
B-1: Raw Material Emissions ...........................................................................................90
B-2: Emissions to Air........................................................................................................91
B-3: Emissions to Water ...................................................................................................93
B-4: Emissions to Land.....................................................................................................94

viii
LIST OF FIGURES
Figure page 3-1 World War II Army Barracks at Fort McClellan ......................................................68
3-2 Stages Involved in the Deconstruction Process.........................................................69
3-3 Total Impacts Calculated Using the EDIP Method Not Including Reuse of Salvaged Materials. ..................................................................................................70
3-4 Total Impacts Calculated Using the CML Method Not Including Reuse of Salvaged Materials. ..................................................................................................71
3-5 Total Impacts Calculated Using the EDIP Method Including Reuse of Salvaged Materials But No Transportation to a Warehouse....................................................72
3-6 Total Impacts Calculated Using the CML Method Reuse of Salvaged Materials But No Transportation to a Warehouse....................................................................73
3-7 Total Impacts Calculated Using the EDIP Method Including Reuse of Salvaged Materials and Transport to the Habitat for Humanity Warehouse in Austin, Texas. .......................................................................................................................74
3-8 Total Impacts Calculated Using the CML Method Including Reuse of Salvaged Materials and Transport to the Habitat for Humanity Warehouse in Austin, Texas. .......................................................................................................................75

ix
Abstract of Thesis Presented to the Graduate School
of the University of Florida in Partial Fulfillment of the Requirements for the Degree of Master of Engineering
LIFE CYCLE ANALYSIS OF THE DECONSTRUCTION OF MILITARY BARRACKS: A CASE STUDY AT FT. MCCLELLAN, ANNISTON, ALABAMA
By
Elizabeth O’Brien
May 2006
Chair: Angela Lindner Major Department: Environmental Engineering Sciences
Nearly 2.5 million ft2 of barracks must be removed from military facilities
throughout the U.S. Environmental Protection Agency Region 4. While manual
deconstruction offers promise for environmental, economic, and social benefits, the
combination of mechanical and manual methods for minimal impact to the environment
and public health is unknown. Here, life cycle analysis was used to determine an
optimum level of manual deconstruction of barracks at Ft. McClellan in Anniston,
Alabama. Four scenarios were compared with varying degrees of time required for
manual deconstruction, 100% Manual, 44% Manual, 26% Manual, and 100%
Mechanical, on the barracks. Data were collected directly from the site and applied using
SimaPro modeling software (Pré Associates, The Netherlands), considering three post-
deconstruction options. Materials salvaged using either 100% or 44% Manual
deconstruction and reused within a 20-mile radius of the deconstruction site yielded the
most favorable environmental and health impacts; however, given the significant impacts

x
involved in the life cycle of diesel fuel required for transportation, the need for
developing reuse strategies for deconstructed materials at the regional level is
emphasized.

1
CHAPTER 1 INTRODUCTION
Each year, the building industry in the United States is reported to generate nearly
136 million tons of construction and demolition (C&D) waste, amounting to 35-40
percent of the total amount of municipal solid waste (MSW) produced annually (Dolan et
al. 1999). Approximately 60 percent of this C&D waste originates from the demolition
of buildings, and 80-90 percent of this waste is estimated to be either reusable or
recyclable (McPhee 2002). While the reuse and recycling of C&D-related waste offers
potential environmental advantages, the building and deconstruction industry has not
fully embraced these practices (Lippiatt 1998).
Reuse and recycling of currently landfilled construction and demolition materials
offer potential benefits in terms of decreased landfill use and raw material extraction. A
reduced amount of raw material extraction is a benefit to the environment because the
extraction of raw materials may lead to resource depletion and biological diversity losses.
The extraction of raw materials normally occurs at sites far from manufacturing plants
and the transport of raw materials and manufacturing of building products consume
energy. The generation of this energy produces emissions linked to global warming, acid
rain and smog. Also the waste generated from the manufacture and transport of the raw
materials decreases the space available for disposal in landfills. All of these activities
from raw material extraction to landfilling are potential sources of air and water
pollution. The goal of this project is to discover the best way to lower building-related
contributions to environmental problems (Lippiatt 1998).

2
A Case for Deconstruction
Most buildings are removed using demolition processes. Demolition is an
equipment-intensive operation. Most of the crew is involved in operation of machinery
and have very little physical contact with the actual building materials. Larger materials
(usually metals, sometimes concrete and masonry) can be separated during demolition
using machinery (Falk and Lantz 1996). Deconstruction, on the other hand, “is the
systematic disassembly of buildings in order to reuse and recycle as many of the
component parts as possible, before or instead of standard mechanized demolition”
(Mcphee 2002). Deconstruction uses hand labor and physical contact with the building
by the workers and involves a methodical disassembly of building parts with similar care
taken in this process as devoted to its reverse process of construction. Because of this
physical contact with the building, deconstruction takes about twice as long as demolition
(Falk and Lantz 1996).
As an alternative to demolition, deconstruction has advantages and disadvantages:
Advantages
• Recycling building materials conserves resources by diverting used materials from
the landfill and avoiding use of virgin resources. For every recovered square foot
of wood used in new construction, a corresponding square foot of virgin wood is
not consumed. Therefore, salvaging reduces the use of natural resources. The
diversion of bulky and difficult-to-handle C&D waste from the municipal solid
waste (MSW) stream will increase the operating life of local landfills and will
result in fewer associated environmental impacts such as groundwater
contamination (Dolan et al. 1999).

3
• Deconstruction and the resulting reuse of building materials results in avoidance of
some of the costs of landfilling, primarily transportation and tipping fees.
• Recovering materials may generate a credit or otherwise subsidize the overall
building disposal costs. A generated credit would allow the owner of the
deconstructed building to receive money or materials from the user of the recovered
materials.
• Landfill failures can result in remediation costs being assigned to former landfill
contributors. By reducing landfill use, there could be a reduced future liability
(Falk and Lantz 1996).
• Due to the increasing cost of materials manufactured with virgin materials, recycled
materials are becoming much cheaper in comparison.
• Salvaging reduces the total cost of materials since only the cost of removal,
refurbishing, and transport is incurred by the salvage (NAHB 2003).
• The availability of high-quality virgin materials for the manufacture of building
materials is decreasing. In many cases, the sources of raw materials are great
distances from installations or building projects, and high transportation costs make
contractors look for a local replacement.
• Many state and regional waste authorities restrict the disposal of bulk waste, such
as furniture, appliances, and building equipment, to special solid waste handlers or
landfills. This, in turn, has driven up the disposal tipping fees. In most cases, any
level of salvage reduces the cost of disposal.
• Timber that is recovered properly from older buildings is gaining acceptance in
meeting the demand for large old-growth timber (Falk, R. and Lantz, S. 1996).
4
• Salvage recovers the highest percentage of the “embodied” resources in the
materials or subsystems. The energy and raw materials consumed in the original
manufacture of the materials or systems are not lost to landfill disposal (NAHB
2003).
Disadvantages
• Building disposal may be more management-intensive for the building owner if
multiple contracts are needed for the various types of abatement and disposal.
• Deconstruction takes twice as long as demolition.
• Demolition is more machine-intensive, while deconstruction is more labor-
intensive. Because of the increased number of workers on the deconstruction site,
there is an increase in the emphasis on site safety and coordination.
• The markets for nonvirgin building materials are very unstable. The acceptance of
salvaged material is still in transition from local markets to national and
international markets. Therefore, the value of the recovered materials is still
difficult to predict (Falk and Lantz 1996).
• Salvaged materials are harder to sell. As yet, they do not have a standard grading
system. So it is hard to tell for what application each board can be used.
• Before the deconstruction process, a determination of whether the materials and/or
assemblies can be removed in a cost-effective and safe manner must be made. This
is vital information in assessing the economic feasibility of the project.
• Even when markets for the material exist, deconstruction may not be financially
justifiable if there is not enough material.
5
• If there is too much material and not enough storage space the salvage operation
may not be able to occur. If the material has to be stored for an indefinite period of
time, some types of materials, such as wallboard, will lose their economic value. If
they are not stored properly, degradation of their material properties may occur
(Dolan et al. 1999).
• There are negative environmental impacts, such as dust generation, noise and
vibrations (Thormark 2002).
• Deconstruction discards different waste than construction or renovation and
demolition. Deconstruction is more likely to contribute contaminated materials to
landfills because all reusable materials are separated, leaving for disposal materials
contaminated by potentially toxic substances, such as lead paints, stains, and
adhesives (Dolan et al. 1999).
Is Reuse of Non-Virgin Wood Possible?
The U.S. Department of Defense (DOD) has 2,357,094 square feet of excess
buildings that are in need of removal from military bases throughout U.S. EPA Region 4,
encompassing the states of Alabama, Florida, Georgia, Kentucky, Mississippi, North
Carolina, South Carolina and Tennessee (Falk et al. 1999). The U.S. military is disposing
of these barracks because the federal procurement law and military regulations listed
under the U.S. Code of Federal Regulations, CFR 32 162.2, will not allow federal tax
dollars to be spent on the maintenance of facilities that are in surplus to its needs (Falk et
al. 1999). In response to these regulations, the U.S. Army is considering deconstruction
of its barracks and salvaging of materials in order to accomplish its minimization goals
and subsidize the overall disposal costs of the buildings, thus lowering funding
6
requirements (Falk et al. 1999). However, there is a question as to whether 100% manual
deconstruction of military barracks will yield optimum economic and environmental
savings, particularly for those barracks built before World War II.
The possibility of recovering timber and lumber from buildings is dependent on
both physical and economic factors, which include:
• wood condition, dimensions, and species
• type and number of fasteners per piece
• exposure or protection from the elements
• labor cost
• allowable building disposal period
• site configuration and building height
• allowable on site recovered materials storage time
The demand for nonvirgin timber and lumber can increase due to the following:
• Harvesting restrictions on high-quality, large-diameter, old-growth timber restrict
its availability at any price.
• Prices of forest products are steadily increasing.
• Exposed timber frame construction demands high-quality large timber.
• Older species-specific wood may be desired for use in new log home construction
and interior remodeling of older buildings.
• North American species may be considered “exotic” creating a demand in those
markets.
• The more nonvirgin timber and lumber is used the more familiar buyers, designers,
and builders will become with it.
7
The demand for nonvirgin timber and lumber is restricted by the following factors:
• There are no grading standards or design rules specifically for nonvirgin wood
materials; application of virgin material standards and rules on nonvirgin wood
may have the effect of downgrading nonvirgin materials.
• Lumber used at a site must be graded. Without a grade, a “timber grader” must be
present, or the materials will be rejected.
• Lack of consistent supplies and markets for nonvirgin timber and lumber.
• Owners and disposal contractors are not aware of the value of nonvirgin timber and
lumber so they make no attempt to recover them (Falk and Lantz 1996).
Variability of the Quality of Lumber
Service-related defects, such as drying checks, splits, bolt and nail holes, notches
from other framing members or utilities and exposure to weather and decay, can affect
the quality of recycled lumber. Depending on the building type and use, boards also may
have been exposed to chemicals and extreme temperatures. Most importantly, structural
members have often experienced an unknown load history (Green et al. 1999).
When timber is first cut it is full of water. Before the days of drying kilns in mills,
wood was allowed to dry naturally. This process takes several years for large timbers.
As the wood dries out, the timbers shrink. The location of the cut on the tree determines
the kinds of splits or checks that occur in the wood. A split is a separation of the wood as
a result of the tearing of the wood cells (Falk et al. 2000). “A separation of the wood that
occurs across or through the growth rings is a check. A separation that extends from one
surface of a piece to the opposite or adjoining surface is a through check” (Falk et al.
2000 73). If the timber was cut from the center (the “heart” of the tree), cracks (checks)

8
will form in a radial pattern outward from the center. If the timber was cut from the
outside part of the tree (“free of heart center”), there will be less checking. “Free of heart
center” timbers check less, but they cost more because they have to be cut from a much
bigger tree (Falk et al. 2000).
Heart checks have little effect on the strength of the recycled timber columns, but
they lower the modulus of rupture (Stress Grading of Recycled Lumber and Timber
1999). Checks also have little effect on column compressive strength. Although the
checks have little effect on the quality, the damage incurred during deconstruction lowers
the quality of dimensional lumber from the reconstructed buildings on average one grade
(Falk and Green 1999).
The direct reuse of wood materials as a construction product faces many obstacles.
The duration of loads, moisture cycling and fabrication changes during the service life of
the wood are difficult to determine but quantifying the remaining strength of the wood is
necessary. Currently, there is no way to grade wood except on an individual piece-by-
piece basis. This is a major obstacle to the reuse of timber. Typically, manufacturers
will reuse heavy timbers only for post and frame buildings because they are dry and
stable (Green et al. 1999). Another obstacle to the direct reuse of wood materials occurs
as a result of use or the dismantlement process. Defects often exhibited by recycled
lumber can include mechanical damage (broken ends and edges of members, splits due to
disassembly), damage from fasteners and hardware (bolt holes, clusters of nail holes),
and notches from other framing members or utilities (Green et al. 1999).
A Case for Virgin Wood
Since 1953, 16 million acres of southern yellow pine timberland have been lost in
the South. Suppression of wildfires, reduced prescribed burning, southern pine beetles,

9
urban development, high-grading, and a lack of artificial regeneration on privately owned
timberlands are all factors that have contributed to the decline of timberland. Tree-
planting programs on agricultural lands have slowed the decline of timberland. In
addition, according to the Southern Forest Resource Assessment, an increase in southern
yellow pine timberland could occur if 23 million acres of former cropland and
pastureland were planted to pines during the next four decades. This effort would
probably require subsidies (South and Buckner 2003).
Each American uses the equivalent of a 100-foot tree every year. The American
population has increased from 76 million in 1900 to more than 250 million people in
1990. Therefore, over 14-billion 100-foot trees were grown and used from 1900 to 1990.
And, due to good forest practices, two-thirds of the original forestland is left.
Many people believe that, to obtain environmental benefits from the forests, it is
best to leave the trees untouched. More often, the opposite is true. Forests with young
trees that are growing and healthy generally have more environmental benefits than older
forests whose trees are stagnant or dying. Tree farming using modern forestry knowledge
produces young healthy forests (Trees 1992).
Trees, unlike steel and aluminum, are a renewable resource. In 2002, forest
landowners planted nearly 1.7 billion seedlings. Besides planting new trees, forest
landowners managed the natural regeneration of millions of other trees giving America
nearly two and a half million acres of new, growing forests. For decades, America has
been growing more wood than is harvested or lost to insects and disease. And since the
beginning of the 1980s, the total amount of forestland in America has increased by 27
million acres (Trees 1992).

10
Trees produce 1.07 pounds of oxygen and use 1.47 pounds of carbon dioxide for
every pound of wood they grow. An acre of trees can grow approximately 4,000 pounds
of wood a year, using 5,880 pounds of carbon dioxide and giving off 4,280 pounds of
oxygen in the process (South and Buckner 2003).
Forests benefit our population in two ways. The first is by producing wood.
People use an average of 15,824 board feet of lumber and up to 10,893 square feet of
panels in each house that is built. Over 600 pounds of paper per a person are produced a
year for books, diapers, packaging, and all the other paper products. Trees are also a
benefit due to the oxygen they produce. One person needs 365 pounds of oxygen per
year, and that oxygen is manufactured through plants and trees (South and Buckner
2003). America is slowly becoming a paperless society as electronic copies become the
more cost and time-efficient way to do business. Before the industrialization of our
nation, tree harvesting was minimal. However, now that our nation is industrialized, the
harvesting of trees is one of the best ways to counteract the production of air pollution.
As trees age, they consume less carbon dioxide, so growing new trees allows more
carbon dioxide to be taken up and oxygen to be released making our air more breathable.
The harvesting of trees is important because it gives new trees room to grow and keeps
carbon dioxide stored in old wood.
As forests age and become more overcrowded, little growth occurs; however, trees
begin to use oxygen instead of releasing oxygen; and more wood may decay than grow.
For every pound of wood that decays (or combusts), 1.07 pounds of oxygen are used, and
1.47 pounds of carbon dioxide are released (South and Buckner 2003). As a result of this

11
reversal of CO2 removal/oxygen release, care must be taken to avoid wood decay or
combustion and to ensure that new trees are in abundance.
Besides creating more breathable air, trees cool the air by providing water
evaporation. Trees act like huge pumps cycling the water up from the soil and back into
the air (South and Buckner 2003). A 100-foot tree with 200,000 leaves, for example, can
remove 11,000 gallons of water from the soil and release it into the air in one growing
season. This cooling effect of water evaporation by latent heat transfer is said to be
equivalent to air conditioning for 12,168 square foot rooms. In fact, one solution to
combat global warming is forest regeneration and maintenance (South and Buckner
2003).
When a forest grows naturally, it goes through cycles. A wild forest may start out
with as many as 15,000 small seedlings per acre. Over a typical 60- to 100-year cycle, at
least 14,700 of the original trees 98 percent will die as the trees compete for space.
Modern forestry finds ways to use this natural mortality and improve and maintain forests
at the same time (South and Buckner 2003).
Modern forestry uses many different types of harvesting, depending on many
factors, including the terrain and the conditions that are needed to plant a forest (South
and Buckner 2003). More than half of the timber harvested each year in the United
States is used in some form of solid wood product: lumber, panels of veneer, or chips for
both structural and nonstructural applications, and miscellaneous products, such as posts,
poles, and pilings. Although a significant amount is used in manufacturing and shipping,
construction activity accounts for the majority of solid wood products consumption (more
than 60 percent of lumber and more than 80 percent of structural panels). As a result,

12
consumption and prices of lumber are highly sensitive to fluctuations in new housing and
other construction activity (Adams 2002). Therefore, use of virgin wood maintains the
production of trees, however, salvaging wood prevents the already harvested trees from
decaying in landfills.
Research Scope
The focus of this paper is the life cycle comparison of four identical barracks
located at Fort McClellan in Anniston, Alabama, deconstructed with varying degrees of
hand and mechanical methods, ranging from 100% mechanical demolition to 100%
manual deconstruction. Using data carefully collected during the deconstruction and
demolition processes, the specific emissions and resulting environmental impacts of the
four scenarios are compared using LCA methods and are reported herein.
Since steel and masonry building materials were being redirected to other parts of
the war effort, many of the army facilities that were built during the World War II era
were built of timber. Many of these facilities were classified as surplus to the nation’s
defense requirements at the end of the Cold War era in the early 1990’s. The current
situation in the military is contrary to the past trend of adding buildings to the industrial
inventory while continuing to use existing buildings. In the past, any disposal of
buildings was incidental to other ongoing operations and, as such, was often handled on
an individual basis. This disposal was based on administrative decisions and disposal
practices. The typical disposal practice for such facilities has been demolition, with the
debris placed in a landfill (Falk, R. and Lantz, S. 1996). Several army bases have been
closed since 1990, and many of the World War II barracks are no longer used (Falk, R.
and Lantz, S. 1996). Since federal tax dollars cannot be spent to maintain surplus
facilities, many of these army facilities must be demolished. In 1995, over 250,000,000
13
board feet (BF) of lumber were estimated to be available for reuse from the World War II
wood buildings then slated for demolition (Falk 2002).
At Ft. McClellan in Anniston, Alabama, deconstruction and demolition was
performed on three barracks on site with varying degrees of mechanical and manual
labor. This project involves a life cycle assessment (LCA) to determine if the reuse of
wood salvaged from the deconstruction of the barracks is a viable alternative to using
virgin wood. The Environmental Protection Agency states an LCA “examines the
environmental releases and impacts of a specific product by tracking its development
from a raw material, through its production and to eventual disposal.” An LCA was
performed on all four scenarios to compare the inputs and outputs of each scenario in the
form of environmental impacts, energy consumed and labor required. This project was
completed to help the DOD determine the square footage of barracks that need removal
and to compare and contrast environmental impacts of deconstruction and demolition.
This project will have a direct impact on the ability to plan the most environmentally
effective deconstruction of the barracks contained in EPA Region 4. This plan is
intended to aid the U.S. Army to meet its waste minimization goals, to provide materials
at lower cost for new construction on bases on or close to deconstruction sites, and to
increase the number of civilian jobs. The hypothesis of the project is that 100% manual
deconstruction will have the lowest environmental impacts of any of the four scenarios
because it is assumed the machinery will be used for the least amount of time and fewer
materials will be landfilled. Therefore the least amount of emissions should be produced
in the 100% manual deconstruction scenario.

14
CHAPTER 2 REVIEW OF LITERATURE
Amount of Construction Each Year
Over the last three decades lumber consumption has increased by nearly one-third,
and structural panel use has more than doubled. The Resources Planning Act (RPA)
Timber Assessment projects that the consumption of solid wood products will continue to
grow in the future through the expansion of both construction and nonconstruction uses
due to America’s growing population and increasing wealth (Adams 2002).
It is projected that, every year for the next 50 years, 1.43 million new households
will be constructed, thus creating approximately 71 million additional separate living
units. Approximately, 1.93 million houses will also be improved each year for the next
50 years. The primary driver of the new construction and improvements is an aging,
healthy, retired population acquiring second homes (Adams 2002).
Reflecting the trend of an aging population and the declining number of people per
household, the average size of new housing units is projected to stabilize over the next 40
years and then rise in the final decade of the projection. By 2050, the average size of a
single-family unit will increase from the current average of 2,160 square feet to 2,600
square feet. Multiple-family housing will expand from 1,000 to 1,200 square feet, and
mobile homes will grow from 1,350 to 1,950 square feet (Adams 2002). In 2004, single-
family houses had already increased to an average size of 2,225 square feet (CORRIM
2004). Since 1991, the consumption of lumber has been growing steadily. A historical
high of 68.2 billion board feet (bbf) consumed was reached in 1999 (Adams 2002).

15
Amount of Deconstruction/Demolition Each Year
The average age of housing in the United States is over 30 years, necessitating their
improvement or demolition. According to the Census Bureau, approximately 245,000
dwelling units and 45,000 non-residential units are demolished every year, creating
approximately 74 million tons of debris a year. Using deconstruction to remove
buildings can convert demolition waste into construction materials. For example, by
deconstructing one-fourth of the buildings instead of demolishing them, approximately
20 million tons of debris could be diverted from landfills each year (NAHB 2003).
Increased Availability of Materials
The past century has seen a major population boom in the United States. During
this time many new residential homes, commercial and industrial buildings, bridges, and
other structures were built from sawn lumber and timber. As these buildings become
ready to be torn down, much of this lumber may be available for reuse. Over three
trillion board feet of lumber and timber have been processed in the U.S. since 1900.
Much of this wood is still residing in existing structures. When these structures reach the
end of their service lives, become obsolete, or change use, contemporary practices
emphasize quick, cheap disposal in landfills (Green et al. 1999). Recently, public interest
has been expressed in finding environmentally acceptable and efficient material reuse
options that focus on deconstruction and reuse of materials in new construction and
remodeling activities (Green et al. 1999).
Along with growing public interest in increasing the amount of recycling/reuse of
C&D waste, federal agencies, such as the United States Environmental Protection
Agency (USEPA) and General Services Agency (GSA), have developed policies to
promote an increase in the use of recycled content products. Building materials have not
16
been emphasized in these procurement guidelines until recently. Increased recycling of
C&D waste promises to “close the loop” of material procurement and reuse by increasing
the amount of materials available (Dolan et al. 1999).
How are Virgin Trees Turned Into Usable Wood?
• The life cycle of timber products includes the following stages:
• Growing timber
• Harvesting timber/cutting it down
• Processing/making it into a useable product
• Installation into a building
• Maintaining, preserving, painting
• Replacement
• Disposal via landfill, incinerator/burning or recycling
• Transport at each stage
Virgin Wood Processes
Harvesting
Timber used for the construction of new houses and the renovation of old houses
all comes from one source-trees. The harvesting of trees occurs in three stages: the
felling and bunching of trees, the movement of the trees from the forest to the site where
they are loaded on the truck and the loading of the trees onto the truck (Long 2003).
A feller buncher is used in the first stage (felling and bunching of trees). The feller
buncher cuts down a group of trees using a saw blade that is located on the bottom of the
feller buncher between two clamps. There are also two more sets of clamps located
above the saw blade. All three sets of clamps are brought together at the same time. As
17
the saw blade cuts the tree, the two upper sets of clamps grab hold of the tree. Normally
feller bunchers cut trees that are between 8” and 18” in diameter. It cuts several trees at
a time, lays the trees down, and moves on to cut down the next tree (Long 2003). Photos
of feller bunchers can be accessed at
http://www.deere.com/en_US/cfd/forestry/deere_forestry/feller_bunchers/tracked/703G_
general.html, http://catused.cat.com/equipment/view-equipment-
detail.html?equipmentPK=Eq1.545735F, and http://www.franklin-
treefarmer.com/fellerbunchers/Fellerbunchers.html.
A rubber-tired skidder delimbs the downed trees by directing them through steel
grates and then moves them from the forest to the loading area (Long 2003). Photos of
rubber-tired skidders can be accessed at http://www.vannattabros.com/skidder1.html.
Log loaders are used to sort the wood by size and to pick the trees up from the ground
and load them on eighteen-wheeler trucks, which carry the logs to the mill (Long 2003).
Photos of log loaders can be observed at http://www.vannattabros.com/drott.html and
http://www.madillequipment.com/loaders.html.
Sawmill
Logs are converted into lumber in a sawmill after they are unloaded from the
eighteen- wheeler truck. The first step is to cut the logs to specified log lengths, and then
the logs are sawn by a chipping saw or a bandsaw, edgers, a trimmer and a resaw. The
focus of these processes is to maximize the lumber extraction. The timber is cut into two-
inch thick boards of varying widths and lengths, and sorted by size before it is kiln-dried.
The lumber is then planed using a plane saw and graded by graders. The kilns, which are
controlled by computers, dry rough, green lumber with a moisture content of about 50%
to a desired moisture content of about 10% in approximately 24 hours. Lumber is planed

18
to the desired size and finished in the planermill. Then the lumber is shipped to
consumers (Long 2003).
The Deconstruction Process
Raw Material Extraction
Deconstruction is used to extract materials that will be reused in new construction
and remodeling activities. The main raw material that comes from deconstruction is
reusable wood. Other raw materials that can be salvaged include showers, urinals,
mercury ballasts, and doors.
Before deconstruction begins, the building is surveyed to determine what can and
cannot be salvaged. Visible defects, subtle signs of wear and tear, and the ease with
which materials can be removed are observed. Deconstruction is both labor-intensive
and time-consuming, comparable to building a new structure only in reverse order
(Yeung and David 1998). Deconstruction starts with removing the shingles from the roof
and pulling out nails to take out the sheathing. The roof boards are then pried loose,
handed down, further denailed, sized and stacked. Next, workers take nails from the
rafters, knock the boards apart, and hand them down to be denailed and sorted. Then the
ceiling joists are knocked off and lowered down (Block 1998). This process continues
throughout the whole building.
Deconstruction can be contrasted with the sorting and salvaging of demolition
debris. The biggest problem with sorting and salvaging of demolition debris is that,
during demolition, the debris is mixed. Even during the deconstruction process, when the
structure is carefully dismantled by manual labor, the mixing of different types of
materials is still possible. For example, removing the exterior wall in a load-bearing
masonry system will result in a combination of masonry materials including concrete
19
blocks or bricks, reinforcing steel, metal ties and grout (Dolan et al. 1999). These
dissimilar materials must be separated if they are to be recycled or reused.
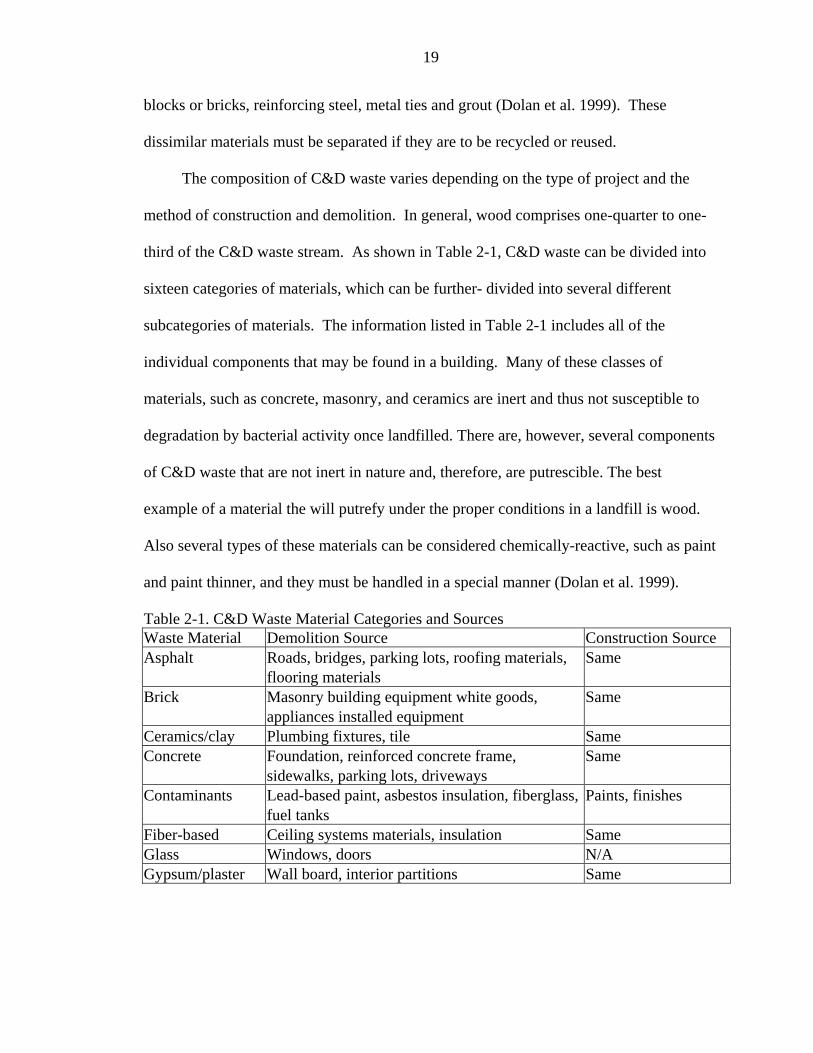
The composition of C&D waste varies depending on the type of project and the
method of construction and demolition. In general, wood comprises one-quarter to one-
third of the C&D waste stream. As shown in Table 2-1, C&D waste can be divided into
sixteen categories of materials, which can be further- divided into several different
subcategories of materials. The information listed in Table 2-1 includes all of the
individual components that may be found in a building. Many of these classes of
materials, such as concrete, masonry, and ceramics are inert and thus not susceptible to
degradation by bacterial activity once landfilled. There are, however, several components
of C&D waste that are not inert in nature and, therefore, are putrescible. The best
example of a material the will putrefy under the proper conditions in a landfill is wood.
Also several types of these materials can be considered chemically-reactive, such as paint
and paint thinner, and they must be handled in a special manner (Dolan et al. 1999).
Table 2-1. C&D Waste Material Categories and Sources Waste Material Demolition Source Construction Source Asphalt Roads, bridges, parking lots, roofing materials, Same flooring materials Brick Masonry building equipment white goods, Same appliances installed equipment Ceramics/clay Plumbing fixtures, tile Same Concrete Foundation, reinforced concrete frame, Same sidewalks, parking lots, driveways Contaminants Lead-based paint, asbestos insulation, fiberglass, Paints, finishes fuel tanks Fiber-based Ceiling systems materials, insulation Same Glass Windows, doors N/A Gypsum/plaster Wall board, interior partitions Same
20
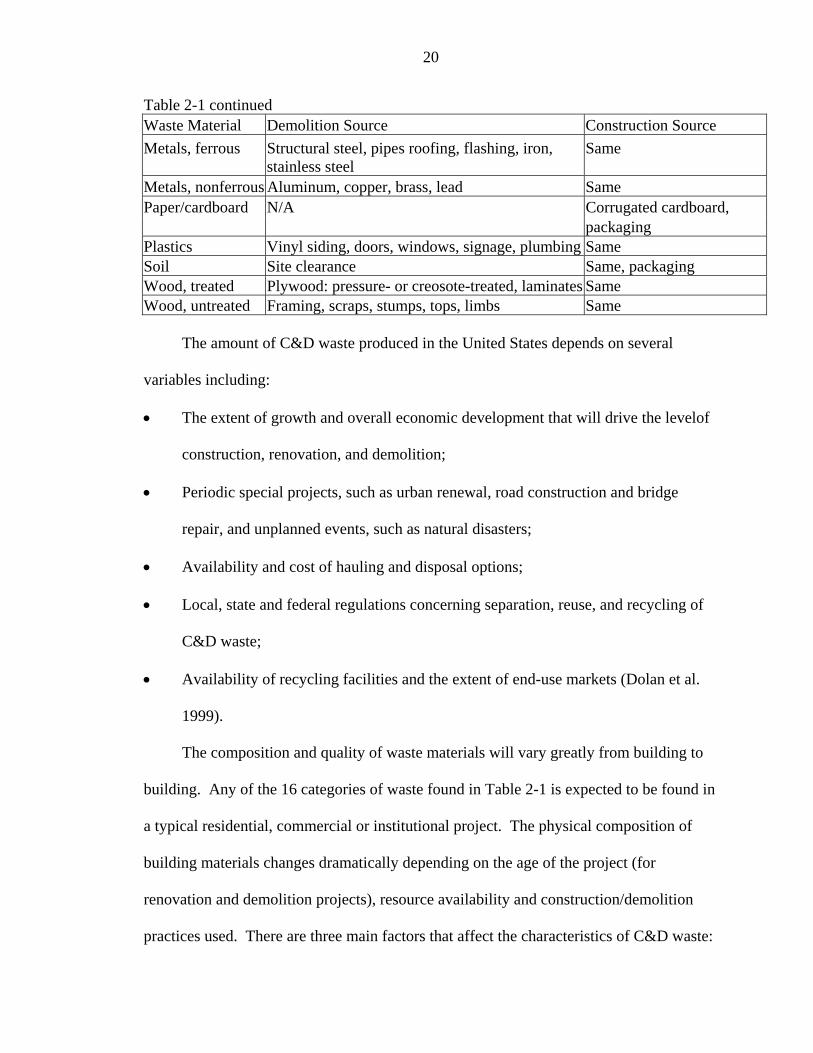
Table 2-1 continued Waste Material Demolition Source Construction Source Metals, ferrous
Structural steel, pipes roofing, flashing, iron, stainless steel
Same
Metals, nonferrous Aluminum, copper, brass, lead Same Paper/cardboard N/A Corrugated cardboard, packaging Plastics Vinyl siding, doors, windows, signage, plumbing Same Soil Site clearance Same, packaging Wood, treated Plywood: pressure- or creosote-treated, laminates Same Wood, untreated Framing, scraps, stumps, tops, limbs Same
The amount of C&D waste produced in the United States depends on several
variables including:
• The extent of growth and overall economic development that will drive the levelof
construction, renovation, and demolition;
• Periodic special projects, such as urban renewal, road construction and bridge
repair, and unplanned events, such as natural disasters;
• Availability and cost of hauling and disposal options;
• Local, state and federal regulations concerning separation, reuse, and recycling of
C&D waste;
• Availability of recycling facilities and the extent of end-use markets (Dolan et al.
1999).
The composition and quality of waste materials will vary greatly from building to
building. Any of the 16 categories of waste found in Table 2-1 is expected to be found in
a typical residential, commercial or institutional project. The physical composition of
building materials changes dramatically depending on the age of the project (for
renovation and demolition projects), resource availability and construction/demolition
practices used. There are three main factors that affect the characteristics of C&D waste:
21
the structure type (e.g., residential, commercial or industrial building, road, bridge),
structure size (e.g., low-rise, high-rise), and activity being performed (e.g., construction,
renovation, repair, demolition). Some additional factors that influence the type and
quantity of C&D waste produced are the size of the project (e.g., custom built residence
versus tract housing), the location of the project (e.g, waterfront versus inland, rural
versus urban), materials used in the construction (e.g., brick versus wood), the demolition
practices (e.g., manual verses mechanical), schedule (e.g., rushed versus paced), and the
way the contractor keeps track of and takes care of materials (Dolan et al. 1999).
Salvaging materials has several advantages for both the construction industry and
solid waste management. It recovers the most resources and the initial energy and raw
materials used for the virgin manufacture are not lost to landfill disposal. Also, salvaging
materials reduces the overall cost of the materials since only the cost of removal,
refurbishing and transport are included in the final price of the material. Salvaging
materials also reduces the cost of disposal (Dolan et al. 1999).
Material Refining
Once the wood is removed from the building, it must be cleaned before it can be
reused. The first step taken to make the wood reusable is denailing. Denailing is
accomplished using a denailing gun, which operates reverse of a nail gun. Removal of
nails without damaging the wood using a denailing gun requires approximately 30% of
the time necessary to remove the boards from the building (Guy 2005). At a typical
deconstruction site, a denailing gun is powered by a generator and runs approximately 8
hours a day (Guy 2005).
Painted wood is not stripped unless it is covered in lead-based paint (LBP). Wood
covered with paint containing no lead can be stripped by the consumer if needed. If the

22
end of the wood is rotten, it is still resold and the consumer can remove the end. If
however, nails are clustered at the rotten end, it is cut off before sale to a customer (Guy
2005).
The processing of lumber after a deconstruction process takes approximately 0.008
labor hours per linear foot of lumber. Processing the lumber involves 3 steps: moving the
lumber from an original pile to the denailing station, denailing the boards using a
compressor and a denailing gun, and restacking the boards (Guy 2005).
Use/Reuse
The wood salvaged from deconstruction is ideally reused in new construction and
renovation projects; however, several barriers exist to making this practice a reality. The
largest barrier is the difficulty project managers and solid waste authorities have in
identifying markets for the debris. Another barrier is the accurate characterization of
C&D waste due to the high variability of the content and quantity of C&D waste. “This
variability is due to the nature of the waste, the dispersion of C&D activities, inconsistent
waste management regulations, range of disposal options, and the variance in cost of
disposal options (Dolan et al. 1999 58).” Damage is incurred on C&D waste as a result
of 1) the original construction process (nail hoes, bolt hoes, saw cuts, notches), 2)
building use (drying defects, decay and termite damage), and/or 3) the deconstruction
process (edge damage, end damage, end splitting, and gouges). The main reason for the
inconsistencies in reusable wood is damage during the deconstruction process (Falk and
Green 1999).
Joists, particularly those located on the first floor, decay more frequently than other
timbers because of their proximity to the ground. Water leakage causes the joists in
bathroom areas to decay most often (Falk et al. 1999). Larger timbers (such as support

23
columns) command a high price and are regularly recycled, whereas dimensional lumber
is not often reused (Falk and Green 1999).
There are several potential advantages of reusing recycled lumber. First, a
significant quantity of recycled lumber is derived from old-growth timber and may have a
tighter grain structure. Second, recycled lumber is relatively dry, with less tendency to
warp on the job site (Falk et al. 1999). Third, salvage yards sell recycled lumber at about
50% of retail lumber prices (Falk 2002).
Disposal
The Florida Administrative Code (FAC) allows the use of C&D debris facilities in
addition to Class I, II and III landfills. Rule 62-701.200 (25) defines C&D debris as:
• Discarded materials generally considered to be not soluble in water and non-
hazardous in nature, including but not limited to steel, glass, brick, concrete,
asphalt material, pipe, gypsum wallboard, and lumber, from the construction or
destruction of a structure as part of a construction or demolition project or from the
renovation of a structure, including such debris from construction of structures at a
site remote from the construction or demolition project site. The term includes
rocks, soils, tree remains, trees, and other vegetative matter (that normally result
from land clearing or land development operations for a construction project), clean
cardboard, paper, plastic, wood, and metal scraps from a construction project;
• Effective January 1, 1997, except as provided in Section 403.707(13)(j), F.S.,
unpainted, nontreated wood scraps from facilities manufacturing materials used for
construction of structures or their components and unpainted, non-treated wood
pallets provided the wood scraps and pallets are separated from other solid waste

24
where generated and the generator of such wood scraps or pallets implements
reasonable practices of the generating industry to minimize the commingling of
wood scraps or pallets with other solid waste; and
• De minimis amounts of other non-hazardous wastes that are generated at
construction or demolition projects, provided such amounts are consistent with best
management practices of the construction and demolition industries;
• Mixing of construction and demolition debris with other types of solid waste will
cause it to be classified as other than construction and demolition debris (FAC 62-
701.200).
Landfills are typed as Class I, II and III. Class I landfills receive an average of 20
tons or more of solid waste per day. Class II landfills receive an average of less than 20
tons of solid waste per day. Class I and II landfills receive general, non-hazardous
household, commercial, industrial and agricultural wastes, following Rules 62-701.300
and 62-701.520, F.A.C. C&D waste is disposed of in a Class III landfill. In rule 62-
701.200 of the Florida Administrative Code (FAC) Class III landfills are defined as those
that receive only yard trash, construction and demolition debris, waste tires, asbestos,
carpet, cardboard, paper, glass, plastic, furniture other than appliances, and any other
materials approved by the Florida Department of Environmental Protection (FDEP). Any
materials approved by the FDEP for disposal are not expected to produce leachate that
endangers public health or the environment. Putrescible household waste is not accepted
in Class III landfills.
Since Class III landfills do not receive MSW for disposal, they are not required to
be lined automatically. Special requirements for Class III landfills are contained in Rule
25
62-701.340(3)(d), F.A.C., which states that Class III landfills can be exempt from some
or all requirements for landfill liners, leachate controls and water quality monitoring it
that no signifigant threat to the environment will result from the exemption. The
language in this rule results in the need for a liner in a Class III landfill to be determined
on a case-by-case basis by each department district office. The determination of each
case will be made by the Department in a way that will protect both human health and the
environment (ICF 1995).
The average cost of disposal of C&D waste in Florida is $32.06/ton, ranging
anywhere from $5.00/ton in Okaloosa County to $92.00/ton in Monroe County (ICF
1995). This average cost of disposal is seemingly high, most likely because disposal
costs at private facilities, which are significantly lower, were not included.
Disadvantages of Unlined Landfills
Leachate is formed when water washes over garbage in landfills, soaks through the
landfilled material, and exits the other side carrying contaminants. The fate of hazardous
constituents in C&D materials, such as acrylic acid, styrene, vinyl toluene, nitrile and
copper (Table 2-2) may include leaching into nearby groundwater aquifers or
volatilization into the surrounding air. As a result, potential impacts of C&D waste
disposal in unlined landfills may include drinking water contamination and fire hazards.

26
Table 2-2. Amount of Chemical Constituents in Wood Products (Construction and Demolition Waste Landfills 1995)
Wood Product Chemical Constituent Amount of Note
Chemical(s) in Wood
Product pallets and skids, pentachlorophenol < 10 ppm a (hardwood/softwood) lindane dimethylphthalate copper-8-quinolinolate copper naphthenate pallets, plywood phenolic resins 2-4% a pallets, glued epoxy 2-4% painted wood, lead-based paint lead 1400-20,000 ppm b (before 1950) painted wood, acrylic-based paint
acrylic acid, styrene, vinyl toluene, < 0.01%
nitriiles painted wood, "metallic" pigments
aluminum powder, copper acetate, < 0.01%
phenyl mercuric acetate, zinc chromate, titanium dioxide, copper ferrocyanide plywood, interior grade urea formaldehyde (UF) resins 2-4% c plywood, exterior grade phenol formaldehyde (PF) resins 2-4% c oriented strandboard phenol formaldehyde resins, or 2-4% PF/isocynate resins waterboard urea formaldehyde resins, or 5-15% UF d "Aspenite phenolic resins 2.5% PF, 2% wax

27
Table 2-2. continued
overlay panels phenol formaldehyde resins 4-8%, sometimes
up to 10% plywood/PVC laminate urea fomaldehyde 2.5% UF polyvinyl chloride 10% PVC particleboard urea formaldehyde resins 5-15% UF d
particleboard with PVC laminate UF resins with polyvinyl chloride 4.5%UF
10% PVC hardboard phenolic resins 1.50% fencing and decks: pressure CCA or ACA 1-3% e treated southern pine CCA or ACA 1-3% e fencing and decks: surface treated pentachlorophenol 1.2-1.5% f utility poles, laminated beams, freshwater pilings, bridge timbers, decking, fencing
railroad ties, utility poles creosote containing 85% PAHs 14-20% g
freshwater pilings, docks creosote - coal tar 15-20% marine pilings, docks creosote/chlorpyrifos 15-20%
a. Hardwood pallets are used primarily in the eastern U.S.; softwood and plywood pallets are used primarily in the western U.S. b. Lead level is highly dependent on the age of the paint; before 1950 lead comprised as much as 50% of the paint film. Legislation in 1976 reduced the standard to 0.06% by weight. c. Plywood may be surface-coated with fire retardants, preservatives and insecticides, or pressure-treated with CCA. d. May be sealed with polyurethane or other sealant to prevent off gassing of formaldehyde. e. Dominant wood preservative; actual levels will be lower due to evaporation or leaching after treatment. f. Restricted use due to industry change and concern over dioxin linkage; not permitted for residential uses. g. Losses after treatment estimated to be 20-50% over 10-25 years; not recommended for residential use.

28
Costs of Deconstruction Verses Demolition
When well-trained crews are employed for the deconstruction of buildings,
deconstruction is very competitive with demolition because deconstruction companies are
relatively inexpensive to start and multiple streams of revenue occurring during each
deconstruction job. These revenue streams are the job contract, reduced tipping fees, a
percentage of the resale of materials, and tax deductions for the donation of materials to
nonprofit organizations. The most successful deconstruction companies either own or
partner with a retail yard that sells salvaged materials (high-value architectural pieces,
dimensional lumber, windows, doors, hardware, and more) at affordable, but profitable
prices (Mcphee 2002). A well-trained deconstruction team can contend with the price of
mechanical demolition. For example in Hartford, Connecticut, deconstruction teams
deconstructed a building at a cost of $2/square foot this was a 33 percent savings over
mechanical demolition. Also deconstruction projects can reduce tipping costs by as
much as 50 to 85 percent (Mcphee 2002).
Due to the decreased amount of available landfill space and the increasing costs of
managing landfill tipping fees, recycling C&D waste not only recovers valuable
resources, it saves money. Because of these changes in cost, C&D waste recovery and
reuse of waste is becoming economically feasible (Dolan et al. 1999).
The cost of buying these recycled materials on the market depends on the cost of
storage, collection, transportation, and other costs for the processor. The most important
driving force of cost is the demand for these materials. This depends on short-term
demand for and availability of virgin material. The scarcer a resource is, the higher the

29
resale cost and thus the more feasible deconstruction will be considered. There are at
least six key factors that drive the supply, demand, and pricing of recycled materials:
1. Export markets. The Far East, where fiber is in short supply, represents a
particularly strong export market for recycled materials.
2. Virgin capacities and recycled capacities. When the price and availability of virgin
commodities change, the price and availability of recycled commodities follow.
3. Geography. A West Coast generator with access to markets in the Pacific Rim has
different marketing opportunities than a generator in the Midwest.
4. Transportation costs. The distance to market plays a role in the pricing of all
commodities, whether recycled or virgin.
5. End product demand. Recycled materials serve three key sectors of the economy:
automobiles, housing and retail. When the auto industry booms, so do the steel and
plastic industries. When housing booms, business increases for suppliers of steel,
paper, plastic and other virgin and recycled materials. Likewise, when retail sales
climb, so do paper and plastic packaging material sales.
6. Natural disasters around the world. When a community begins to rebuild after a
natural disaster, demand for recycled materials in all areas of the world spike
(Dolan et al. 1999).
To reduce the uncertainty associated with recycling/reusing the materials gathered
from large-scale or long-term projects, an explicit commitment among the general
contractor or project manager, hauler and market should be established (Dolan et al.
1999). This will ensure a market for the materials and guarantee that the deconstruction
is worth the extra time and effort.
30
The most critical component for reuse of C&D waste is the identification of a
market for the waste material. Once a market is found to exist, the material becomes a
commodity not a waste. For reuse of materials to be economically successful, there must
be a stable, profitable market. The Solid Waste Association of North America (SWANA)
suggests that, to have a market for the C&D waste, there are five requirements that must
be met and agreed upon by both the buyer and the seller: (1) specifications, (2) quantity,
(3) delivery conditions, (4) price, and (5) commitment (Dolan et al. 1999).
For most Army facilities, an extensive C&D waste reuse operation will require a
large investment of both time and money. Denison and Ruston (1990) listed factors that
should be considered by solid waste and project managers before beginning any type of a
reuse operation to ensure that the reuse project is both financially and technically
feasible:
1. quantity of waste generated
2. composition of the waste
3. materials targeted for recycling and the methods of recovery
4. expected value
5. necessary additional processing required to prepare the recovered materials for the
market
6. costs of recycling, handling, collecting, and processing
7. financial and logistical risks and uncertainties
8. availability of markets for recovered materials, current market prices, price
instability, and the potential effect of market development programs (Dolan et al.
1999).

31
Army Technical Manual Rule 5-634 states that the added costs (increased time,
effort, and equipment) plus the sales revenue of a recycling program will determine its
economic feasibility (TM 5-634, p 4-79). If the added costs exceed the avoided costs
plus revenue, the operation should not be performed (Dolan et al. 1999).
Many contractors are doubtful of the time and cost effectiveness of deconstruction,
thus hampering its general acceptance. When savings in disposal costs and the resale
value of building materials are considered, deconstruction becomes more attractive. An
even more appealing aspect of salvage and deconstruction is the environmental benefits,
including reduction of waste materials which may be incinerated or landfilled. This may
improve air and water quality and will reduce landfill use. Also sometimes lumber
recovered from deconstruction projects is vintage or priceless. Building materials yards
may have old growth timbers, architectural trimmings and antique doorknob (Yeung and
David 1998). Salvageable materials include plywood, lumber, hardwood flooring, bricks,
windows, concrete, plumbing fixtures, doors and knobs, hinges, paneling, insulation,
stairs and railings, asphalt roof tiles, moldings and baseboards and countertops. The
recycling of building materials gives its greatest benefit to the consumer, who purchases
the material at incredibly low prices (Yeung and David 1998).
The following equation can be used to determine the net deconstruction cost:
(Deconstruction + Disposal + Processing) – (Contract Price + Salvage Value) = Net
Deconstruction Costs. The net cost for demolition use is calculated by the equation
(Demolition + Disposal) – (Contract Price) = Net Demolition Costs. When the salvaged
materials are not resold or redistributed on-site or reused by the deconstruction contractor
in new construction, transportation and storage costs may be additional costs for

32
deconstruction. For deconstruction to be cost effective and competitive with traditional
demolition and disposal the sum of the savings from disposal, revenues from resale of
materials must be greater than the incremental increase in labor costs. To increase the
percentage of time spent in deconstruction activity and decrease overall time costs, a
building’s materials should be deemed worth salvaging and with efficient resale
mechanisms and markets. Removing and reselling materials as quickly as possible can
overcome the disincentive for deconstruction created by the time costs of development
and building loans. Deconstruction is also more cost effective when the site is large
allowing the unwanted structure to be isolated from the other construction activity and be
deconstructed without delaying the site development. On the other hand when the new
construction will take place on the footprint of the existing structure, the time for removal
of the existing structure by deconstruction is a significant economic impediment (Guy
2001).

33
CHAPTER 3 LIFE CYCLE ANALYSIS
Abstract
Nearly 2.5 million ft2 of barracks must be removed from military facilities
throughout the U.S. Environmental Protection Agency Region 4. While manual
deconstruction offers promise for environmental, economic, and social benefits, the
combination of mechanical and manual methods for minimal impact to the environment
and public health is unknown. Here, life cycle analysis was used to determine an
optimum level of manual deconstruction of barracks at Ft. McClellan in Anniston,
Alabama. Four scenarios were compared with varying degree of time required for
manual deconstruction, 100% Manual, 44% Manual, 26% Manual, and 100%
Mechanical, on the barracks. Data were collected directly from the site and applied using
SimaPro modeling software (Pré Associates, The Netherlands), considering three post-
deconstruction options. Materials salvaged using either 100% or 44% Manual
deconstruction and reused within a 20-mile radius of the deconstruction site yielded the
most favorable environmental and health impacts; however, given the significant impacts
involved in the life cycle of diesel fuel required for transportation, the need for
developing reuse strategies for deconstructed materials at the regional level is
emphasized.
.

34
Introduction
Each year, the building industry in the United States is reported to generate nearly
136 million tons of construction and demolition (C&D) waste, amounting to 35-40
percent of the total amount of municipal solid waste (MSW) produced annually (Dolan et
al. 1999). Approximately 60 percent of this C&D waste originates from the demolition
of buildings, and 80-90 percent is estimated to be either reusable or recyclable (McPhee
2002). While reuse and recycle of C&D-related waste offers potential environmental
advantages, the building and deconstruction industry has not fully embraced these
practices (Lippiatt 1998).
There are two different methods for the removal of buildings—deconstruction and
demolition—and the method used greatly influences the amount of salvaged (reusable)
material gained. Demolition, the most often used means of building removal, is
equipment-intensive, requiring machinery throughout the process for leveling the
building and separating the larger materials. Because most of the labor involves
machinery operation, the crew has very little physical contact with the actual building
materials (Falk and Lantz 1996). Deconstruction, on the other hand, involves the
methodical disassembly of buildings in order to reuse or recycle as many of the
component parts of the building as possible, before or instead of demolition (McPhee
2002). Deconstruction can involve hand labor only and always involves actual physical
contact with the building by the workers, thus resulting in time requirements that are
approximately twice that of demolition (Falk and Lantz 1996).
The additional time burden and perception of associated increased costs
accompanying deconstruction have hampered its practice. Another potential drawback of
deconstruction is the need to tend to a greater level of detail at every stage of the removal

35
process. For example, increased planning is required in order to assess the type and
amount of materials that can potentially be salvaged. The actual deconstruction phase
must involve greater oversight of the labor, while recovered materials must be stored and
protected on site before removal to their final destination. Also, most of the salvaged
lumber can only be used for non-structural applications, such as in decks and non-
supporting walls, unless the materials are re-graded (Falk et al. 1999). In order to
minimize the time and cost burdens of deconstruction while still ensuring gain of
salvaged materials, this practice can be combined with demolition. However, the degree
at which this combination of building removal practices becomes economically and
environmentally beneficial is not known.
This work presents results of a case study performed on military barracks at Ft.
McClellan in Anniston, Alabama, for the purpose of determining the benefits of
combining deconstruction and demolition. Military buildings in need of removal
throughout the U.S. offer tremendous potential for materials recovery and reuse. The
U.S. Department of Defense (DOD) has 2,357,094 square feet of excess buildings that
are in need of removal from military bases throughout U.S. EPA Region 4 alone,
encompassing the states of Alabama, Florida, Georgia, Kentucky, Mississippi, North
Carolina, South Carolina and Tennessee (Falk et al. 1999). The U.S. military is disposing
of these barracks because the federal procurement law and military regulations listed
under the U.S. Code of Federal Regulations (CFR 32 162.2) will not allow federal tax
dollars to be spent on the maintenance of facilities that are in surplus of its needs (Falk et
al. 1999, CFR 2004). In response to these regulations, the U.S. Army is considering
deconstruction of its barracks and salvaging of materials in order to accomplish its
36
minimization goals and subsidize the overall disposal costs of the buildings, thus
lowering funding requirements (Falk et al. 1999). However, there is a question as to
whether 100% manual deconstruction of military barracks will yield optimum economic
and environmental savings, particularly for those barracks built before World War II.
This project, funded by the U.S. DOD, sought to determine the optimum levels of
manual deconstruction and mechanical demolition of pre-World War II barracks using a
life cycle approach. Life cycle analysis (LCA) is a method that enables quantification of
the environmental and public health impacts of an activity or product throughout its
entire life. This “cradle-to-grave” approach is based on the knowledge that each stage in
a product’s life has potential to contribute to its environmental impacts. Considering a
building’s life cycle, these stages include raw material extraction and processing, material
manufacture (e.g., wood harvesting and milling), transportation, installation (e.g.,
construction), operation and maintenance, and, ultimately, recycling and waste
management (e.g., salvaging of materials for recycling or reuse) (Lippiatt 1998).
The focus of this paper is the life cycle comparison of four identical World War II-
era barracks. Data were carefully collected from a previous study on three Ft. McClellan
barracks, deconstructed using different methods of manual effort that were accompanied
by different time requirements for manual involvement. The specific emissions and
resulting environmental impacts and cost savings or burdens of the three scenarios are
compared to traditional mechanical demolition using LCA methods and are reported
herein.
37
Methods
Description of Fort McClellan Barracks
U.S. Army facility, Ft. McClellan, in Anniston, Alabama, was established in 1917,
with a primary mission of training for combat, a service it fulfilled during World War I,
World War II, and the Vietnam War. This facility was also the home of the Women’s
Army Corps School, the U.S. Army Chemical Center and School, the Military Police
School, and the Training Brigade. The base was decommissioned in 1995; and, upon its
official closing on May 20, 1999, it occupied 45,679 acres of land with 100 barracks of
approximately 415 m2 each in need of removal (Fort McClellan 2005). Figure 3-1 shows
a typical row of barracks at Ft. McClellan. They are identical, two-story, wood-frame,
World War II-era barracks similar in typology and construction to thousands of older
barracks found on military installations throughout the United States.
The barracks in the U.S. EPA Region 4 were typically built with Southern yellow
pine, a strong wood readily available in the Southeast and considered salvageable. Other
components with potential resale value in the barracks include showers, urinals, toilets,
windows, doors, electrical wiring, lighting, emergency exit signs, a brick fireplace, and
the metals associated with the air conditioning ducts and the large structural support
columns. The metals were removed by hand before the demolition of the building, and it
was found that the structural support columns were salvageable under careful demolition
practices.
The Deconstruction Process and Four Scenarios Studied
The deconstruction and demolition of the barracks were conducted from April-June
of 2003. Personnel involved in this project participated in either a deconstruction team or
an LCA team. The deconstruction team was responsible for hiring a dismantling
38
contractor, coordinating the dismantling of each barrack in a systematic approach, and
collecting data during the deconstruction process. With the aid of Costello Dismantling
Co., Inc. (Boston, MA, USA), contracted in the early stages of the project, the
deconstruction team carefully documented in 15-minute intervals at the deconstruction
site the following information: type and amount of material salvaged or disposed, method
of material removal (manual or mechanical), time required to salvage and/or demolish,
time required for machine operation, total labor time and transportation requirements, as
previously described in detail (Guy and Williams, 2004). The LCA team transferred the
data collected from the site and applied these data to the modeling efforts.
As stated previously, the primary goal of this project was to assess the optimum
combination of manual and mechanical methods of barracks removal, as measured by
minimum environmental/public health life cycle impacts. To this end, four scenarios
were designed and compared. The first scenario involved removal of one barrack using
entirely manual deconstruction (labeled as “100% Manual”). The second and third
scenarios involved manual deconstruction only 44% and 26% of the total time required
for removal, respectively, with the remainder of the time involving traditional mechanical
methods. These two scenarios are labeled henceforth as “44% Manual” and “26%
Manual,” respectively. The fourth scenario involved removing a barrack using only
mechanical methods of demolition, as traditionally used, and this scenario is denoted as
“100% Mechanical.” The percentages of time used for mechanical demolition and
manual deconstruction were determined by dividing the total time required for building
removal into the total time required for machine operation and/or labor.
39
Life Cycle Analysis
All data collected from the deconstruction phase were carefully databased for use in
the life cycle analysis (LCA) modeling that followed ISO 14000 guidelines (Guinee et.
al., 2002). The ultimate objective of the LCA effort was to guide the Department of
Defense (DOD) in the best management practices for removing the WWII-era barracks
that remain in EPA Region 4. The scenario yielding lowest environmental impacts would
be considered the most preferable option in this study. The development of the LCA
model and its relevant stages are discussed in more detail below.
Functional Unit
The four scenarios were compared using a functional unit of “per square foot of
barracks.” This functional unit allowed comparison of inputs and outputs and the
ultimate impacts from each scenario. All results presented herein are based on this
functional unit.
Scope and Goal Definition
The relevant stages included in this LCA are the deconstruction/demolition process,
representing “raw material extraction”; disposal of materials by landfilling; transportation
between the stages; and recycling and reuse of salvaged materials by replacing virgin
materials.
Figure 3-2
Figure 3-2 shows these stages divided into individual steps, starting with
preparation for deconstruction by transportation of equipment and labor to the site and
removing asbestos (Steps 1a and 1) and hazardous waste (Step 2). Each rectangle (Steps
1, 2, 5, 13-16) represents an activity that is involved in preparation for demolition of the
barracks, preparation of salvaged materials for reuse, and the processes in the outer

40
avoided virgin wood production loop. Each oval (Steps 3, 4, 6-12) represents a part of
the barrack disposed of in the landfill or salvaged for reuse. Time requirements for each
relevant step under each scenario were collected at the site for subsequent LCA
development. The only steps shown in Figure 3-2 relevant to the 100% Mechanical
scenario are transportation of labor and equipment to the site, asbestos and hazardous
waste removal and transportation to disposal sites (Steps 1, 1a, 1b, 2 and 2a), whereas all
subsequent steps apply only to the other three scenarios.
Figures 3-3 and 3-4
In this LCA, three options were considered for salvaged material. The first option
was performed from the perspective of savings in landfill volume requirements and
reduction of leachate production that occurred when materials were salvaged. No reuse
of salvaged materials was considered in this first option and represents a case where no
reuse options are available. The second option was also performed from the perspective
of savings in landfill volume requirements and reduction of leachate that was produced
when materials were salvaged. However, this option also included the reuse of the
materials by transporting them to a local storage facility within 20 miles of the
deconstruction site for their reuse or recycle, thus assessing impacts of a regional market
for these materials. The third option considered reuse and recycle of the salvaged
materials beyond the deconstruction and landfill sites by incorporating transportation to
the Habitat for Humanity (HfH) warehouse in Austin, TX, thus assessing impacts of a
national market for these materials. For both the second and third options, if use of the
salvaged material avoided the production and preparation of the virgin wood that it
replaced, then the avoided virgin wood production loop (Steps 13a-16) and the recycling
of MEP materials (Step 5a) were involved.

41
Data Inventory
Both primary (derived directly from the deconstructed and demolished barracks)
and secondary (derived from literature and regulatory agency publications and databases)
data were collected and databased in LCA software, SimaPro 5.1 (PRé Consultants,
Ameersfort, The Netherlands). SimaPro contains inventory data that has already been
gathered for common products and processes in databases created by ETH-ESU (Uster,
Switzerland), Buwal 250 (Bern, Switzerland), and Franklin Associates (Prairie Village,
Kansas, USA), among others (Goedkoop and Oele 2001). As previously described, the
primary data collected included the amounts of hazardous, salvaged, recycled and
landfilled materials, the amount of time each piece of equipment was used, the number of
workers, and the worker labor time. In addition, the weights of salvaged and landfilled
materials were found by weighing the hauling trucks before and after filling. The
secondary data included types of equipment and materials used (site-specific for project),
fuel type and requirements of each piece of equipment (JLG 2004, Bobcat 2004,
Caterpillar 2004, Grove 2004, Homelite 2004, Stihl 2004, DeWalt 2004), amount and
composition of leachate from all deconstruction materials (Jamback 2004), equipment
usage for production of virgin wood in the forest and at the sawmill (Long 2003),
emissions for production of bricks used in the barracks construction (EPA 1997),
recycling and producing steel (EPA 1986), diesel and gasoline fuel combustion emissions
(EPA 1995), data for the production of diesel fuel and gasoline (EPA 1995) and for the
U.S. electricity mix (SimaPro 5.1). The LCA compared the inputs and outputs of each
alternative scenario in terms of emissions, the value of the material, and requirements of
dollars, energy, and labor.

42
Impact Assessment
While a number of weightings schema used in LCA impact assessment have been
developed and are available to LCA practitioners, the need for an increased
understanding of how these metrics are developed, their uncertainty and variability, and
potential limitations and benefits of their application has been recently identified
(Thomas et al. 2003). In this study, two methods, Centrum Voor Milieukunde Leiden
(CML) and Environmental Design of Industrial Products (EDIP), were chosen for
calculation of the relative impacts of Global Warming, Ozone Depletion, Acidification,
Eutrophication, Human Toxicity, and Ecotoxicity (Guinée and Heijungs 1993; Goedkoop
et al. 1998; Goedkoop and Spriensma 1999; CML 2001; Goedkoop and Oele 2001).
Each method, included in the SimaPro software, uses a different approach for calculating
impacts but consider similar contributing factors for each impact. Comparing the results
of these two approaches will enable determination of the reliability of the observed
trends. A detailed description of these methods can be obtained in Sivaraman and
Lindner (2004).
Assumptions and Limitations
The following is a list of assumptions made throughout this assessment to enable
comparison of the four scenarios:
1. Each barrack contains the same quantity of hazardous material, asbestos, and wood
coated with lead-based paint that must be disposed; therefore, these emissions were
not accounted for in the LCA.
2. Transportation: Note that all assumptions of distances traveled were considered for
their effect on the results in the sensitivity analysis.

43
3. The workers made a 20-mile roundtrip to and from work each day in a 1995 model
midsize car. Each worker drove his/her own car; however, carpooling was
considered for its effect on the results in the sensitivity analysis. A 20-mile
distance served as a worst-case scenario because this represents approximately
twice the distance most workers travel to work (Khattak et. al. 2005, Demographia
2005).
4. Equipment was transported to the site on a flat bed truck from within a 20-mile
radius. Because this distance varies for every site, this mileage was tested in the
sensitivity analysis (transport distance).
5. A 30-mile distance for transport of equipment to and from the site of harvesting
was assumed (Long 2003), and harvested wood was assumed to be transported 60
miles to the sawmill (Long 2003). A transport distance of finished lumber of 100
miles was assumed to exist from the sawmill to the construction site for virgin
wood (Long 2003).
6. Salvaged wood was transported 80 miles from the deconstruction site to the new
construction site. While a 500-mile radius is considered to be a cutoff point for
environmental savings for delivery of materials to a construction site, this lower
value was assumed to ensure that the expense of transporting and buying the
salvaged material does not exceed that of the virgin materials (Smith 2003).
7. Except for small equipment (chainsaws, chopsaws, and weedeaters), each piece of
equipment used at the barracks site required a separate flat bed truck for hauling.
8. The capacity of each truck was at least capable of handling 5,500 lbs of wood,
equal to a cord of wood.

44
9. Other than the use stage, the life cycle stages of the machinery used throughout the
deconstruction or demolition process were not considered.
10. Sources of emissions included from the creation of virgin timber were harvesting,
transporting the wood, milling the wood, and transporting the lumber to the
construction site.
11. The data collected at the barracks in Ft. McClellan are applicable to all other
barracks within U.S. EPA Region 4.
12. Methods for asbestos abatement and lead assessment are the same whether for
demolition or deconstruction. The wood deposited into the landfill was untreated
chemically, but most of it was painted with lead-based paint. Wood coated with
lead-based paint produces lead-contaminated leachate; however; the effects of this
wood were not accounted for in the leachate because there was the same amount in
each barrack. Because the landfill is unlined, the leachate from all other materials
contained within the barracks was accounted for using data reported in Jamback
and Townsend (2004), the only available resource for this type of data.
13. The source of electricity was assumed to be the average U.S. mixture of 56% coal,
21% nuclear, 10% hydropower, 10% natural gas, and 3% crude oil. The safety
concerns of spent nuclear fuel were not considered.
Sensitivity Analysis
Assumptions and variables that were tested for their sensitivity to model impacts
included the time spent to both deconstruct and demolish the barracks, the distances the
workers traveled, the distances the materials and machinery were transported, the
recycling of the steel, and the time requirements for preparation of the materials for reuse.

45
Results and Discussion
Data Inventory
Time Requirements for Removal of Barrack Components
As shown in Table 3-1, each of the barrack components was partitioned into broad
categories of windows and doors, interior partitions, hazardous waste (composed
primarily of mercury thermostat switches, lead-acid batteries in exit lights and emergency
light fixtures, fluorescent tubes and ballasts), mechanical, electrical and plumbing (MEP)
materials (including sinks, toilets, showers, light fixtures, wiring and conduit, ducts, and
air handlers), interior finishes and framing, roof, walls and floors, and foundation. The
time required to remove each building component following the relevant set of steps
conducted in each scenario is also provided in Table 3-1. Asterisks in Table 3-1 denote
all components that were removed involving some degree of mechanical methods.
Removal of hazardous materials (fluorescent lights and exit signs) and the
foundation of each of the barracks, mechanically performed in all scenarios, required the
same amount of time (5.0 and 3.3 hrs, respectively). Removal of windows and doors,
interior partitions, and MEP materials required the same amount of time for the three
scenarios that involved hand deconstruction (100% Manual, 44% Manual, and 26%
Manual) but a significantly lower time for the 100% Mechanical scenario. The windows
and door frames coated with lead-based paint and the MEP materials were manually
removed from the barracks involving hand deconstruction. The wood containing lead-
based paint was not considered hazardous waste because of the low concentrations of the
paint, and, therefore, it was disposed of in a C&D landfill. The windows and door frames
from the 100% mechanically demolished barrack were disposed of thus yielding no time
requirement, whereas the time for removing MEP materials under this scenario was lower

46
than the other three because only the light fixtures, electrical wiring and conduits were
removed before the demolition of the building. The 3.1 hours required to remove interior
partitions from the 100% mechanically demolished barrack involved recovery of the
large support columns only.
The same amount of time was needed for the salvaging of the interior finishes and
framing for the 100% Manual and the 44% Manual scenarios but a decreased amount of
time was needed in the 26% Manual scenario. This decreased time is explained by the
fact that the columns and wall studs were cut using chainsaws to speed the process of
deconstruction and so that the second story floor could be dropped onto the first story
floor for deconstruction.
As shown in Table 3-1, less time was required for removal of the roof, walls and
floors of the barracks with increasing use of mechanical methods. This is true with the
exception of the removal of the second story floor. The removal of the second story floor
took longer in the 26% manual scenario than in the 44% manual scenario although it still
took less time than the 100% manual scenario. In the 44% Manual scenario, the second-
story floor was cut into ten-by-ten foot pieces and dismantled on the ground, whereas the
second-story floor in the barrack subjected to 26% Manual methods was dropped onto the
first-story floor and dismantled. The two different methods of removal for the second
story floor in the 26% and 44% manual scenarios were experimental to determine the
fastest way to deconstruct the second story floor. It was found that it is faster to remove
the second story floor in ten-by-ten foot pieces because it is easier to remove the wood
when it is in smaller pieces. The time for the removal of the first- story wall also varied
greatly between the 44% Manual and 26% Manual scenarios. The former, involving

47
manual removal of sheathing and siding, required approximately 62 hours, and the latter,
involving cutting at the floor base and direct disposal in a dumpster for ultimate
landfilling, required approximately 9 hours. For more information on the methods used
to deconstruct and demolish the barracks and the time differences for the removal of the
different components of the building please refer to Guy and Williams (2004).
Labor and Machine Time and Mileage Requirements and Material Yields
Table 3-2 presents the total labor and machine time and transportation requirements
for the material yields from each of the four scenarios. As expected, the scenario
involving all manual deconstruction demanded the greatest number of work days and
mileage requirements of the work crew, 17.7 days and 2160 miles, respectively,
compared to the range of 12.7 to 1.5 days and 1440 to 120 miles for the other scenarios,
decreasing with less manual deconstruction. Interestingly, the time requirement for
machine operation and mileage requirements for delivery of machinery were maximum
in the 44% Manual scenario (277.8 hrs, 140 miles, respectively) because an additional
piece of equipment, a crane, was used in this scenario to lift the roof off the building so
that the salvageable pieces of the roof could be saved while the rest of the building was
demolished. It is important to note that machines were necessary in the 100% Manual
scenario for collection, movement and cleaning of materials.
The 100% mechanical demolition scenario required the least amount of transport
mileage of equipment and machine hours because only two pieces of equipment were
involved, the Bobcat T200 Turbo (Bobcat, West Fargo, ND) and Caterpillar 320C
excavator (Caterpillar, Inc. Pleasanton, CA), to simply topple the building with no
manual removal processes. Also, unlike the three scenarios with manual involvement
where materials were separated and moved to various locations on site, the 100%

48
Mechanical scenario resulted in materials transferred directly to an on-site dumpster for
subsequent disposal.
The amount of recycled material was the same for each barrack that used hand
deconstruction (Table 3-2). In 100% mechanical demolition, the building was knocked
down and put in the C&D landfill without removing the recyclable steel. As anticipated,
the yield of salvageable material decreased with diminishing levels of manual labor. The
weight of salvaged material ranged from 2,552 lbs from the barrack that was entirely
mechanically deconstructed to 59,089 lbs from the entirely manually deconstructed
barrack. The barrack that was mechanically deconstructed yielded salvaged material in
the form of large wood columns, the foundation of the building and plumbing and
electrical fixtures. This is a total of 2,552 lbs of salvaged wood, which is 1.8% of the
total weight of the building. Additional components salvaged with manual methods
included non-damaged wood, showers, urinals, toilets, air conditioning ducts, and some
of the bricks from the chimney (if clean of mortar).
The amount of hazardous material (141 lbs) was the same for each barrack, as each
barrack contained the same components, including primarily mercury thermostat
switches, lead-acid batteries in exit lights and emergency light fixtures, fluorescent tubes
and ballasts. As salvaged material yields increased, the amount of material sent to the
landfill decreased. Therefore, as also anticipated, the amount of landfilled material
decreased with increasing manual labor rates. The amount of material landfilled ranged
from 140,055 lbs for 100% mechanical demolition to 82,486 lbs for 100% manual
deconstruction.

49
Fuel and Electricity Requirements
The hourly fuel and electricity requirements for transportation of the labor force
and machinery and for the operation of each of the machines are provided in Table 3-3,
along with the relevant stages of their involvement, previously introduced in Figure 3-2.
Seven different pieces of machinery that were used during the deconstruction and
demolition of the military barracks are also listed in Table 3-3. Each of these pieces of
equipment was used for a different purpose and for varying amounts of time depending
on the scenario. The JLG Lift 600S (JLG Industries, Inc., McConnellsburg, PA) was
used to raise the workers above the roof in order to cut and remove panelized sections in
the 100% Manual and 26% Manual scenarios. The Bobcat T200 Turbo was used to move
the loose salvaged material and floor panels to the designated places for pick up and
disposal in all 4 scenarios. The Caterpillar 320C (excavator) was used to knock down the
100% mechanically demolished building and to push over the building in the 26%
Manual scenario. In all the other scenarios, the Caterpillar excavator was used to pick up
the floor panels from the second floor and flip over the first floor panels. The Crane
Grove TMS 760E (Grove, Pensacola, FL) was used for the removal of the roof in the
44% Manual scenario. The Homelite Chainsaw (Homelite, Port Chester, NY) and Stihl
Chopsaw (Stihl Inc., Jacksonville, FL) were used to cut the roof into panelized sections
either on the ground or in the air with the help of the JLG Lift 600S. The chopsaw was
also used to cut the first and second floor panels in the Manual scenarios. The chainsaw
was used to cut the roof rafter for roof panelizations, the second floor joists and beams
for panelization, and the columns and wall studs in the 26% Manual scenario so that the
second floor could be dropped onto the first floor and dismantled there. The DeWalt
50
DG7000E (generator) (DeWalt Industrial Tool Company, Baltimore, MD) was used to
remove nails and paint from the salvaged wood with attached tools in all four scenarios.
The 100% Manual scenario required operation of the lift, bobcat, excavator and
chopsaw for 4, 4, 0.5 and 3 total hours, respectively (data not shown). The same
equipment was used in the 26% Manual scenario, requiring increased times for use of the
lift, bobcat, excavator and chopsaw of 5, 1, 6 and 7 hours, respectively. In the 44%
Manual scenario, the lift, bobcat, and excavator were also used in addition to the
chainsaw and crane (for a total of 6, 9.5, 1, 3, and 4.5 hours, respectively). Only the
bobcat and excavator were required in the 100% Mechanical scenario, both used for 2
hours total. As shown in Table 3-3, the chopsaw, chainsaw, and generator required
gasoline (0.20, 0.12, and 0.63 gallons/hr, respectively) (Stihl 2004, Homelite 2004,
DeWalt 2004), whereas the other equipment required diesel fuel in larger volumes
(ranging from 2.50 to 8.10 gallons/hr) (Bobcat 2004, Caterpillar 2004, Grove 2004, JLG
2004).
The fuel and electricity requirements for harvesting and processing virgin wood are
also provided in Table 3-3. The primary equipment pieces involved in harvesting of
wood are feller bunchers, rubber-tired skidders, and log loaders. The 29 gallons of diesel
fuel used during the transportation of this equipment to and from the forest was
overwhelmingly greater than in-use fuel consumption. In fact, the consumption during
transportation of the equipment to the forest for harvesting was greater than any of the
other diesel fuel consumption requirements incurred during transportation, including
transport of the downed trees to the sawmill, of the lumber to the construction site, of the
recycled steel to the recycling facility, and of the waste materials to the landfill.

51
Electricity requirements for sawmill operation (6.2E-03 kWh per pound of wood) and
recycling of steel (2.1 kWh per pound of recycled steel) were also accounted for, as
shown in Table 3-3. It is important to note that, for every pound of salvaged wood, one
pound of virgin wood is avoided. Thus, the values provided in Table 3-3 represent
“savings” in relation to using all virgin materials in reconstruction applications, and their
resulting emissions will be considered as “emissions savings” rather than contributions.
Emissions
Tables 3-4, 3-5, 3-6 and 3-7 show the primary environmental emissions that result
from each of the four scenarios per square foot of barrack. The emissions shown in these
tables represent the second option where material salvaged is reused or recycled within
20 miles of the deconstruction site. Emissions from the other two options—no salvaging
or reuse and transportation of all reusable materials to Austin, TX—are considered in the
discussion of impact analysis results below. While the SimaPro modeling software
included hundreds of emissions from the included life cycle stages, only those in highest
quantity and/or risk to the public and environment were considered. These emissions
have been broken down into four categories—criteria pollutants, greenhouse gases,
metals, and miscellaneous chemicals—which have been further separated by life cycle
stage, during salvaging of material (Stage 13 in Figure 3-2), disposal (Stages 1b, 2a and
the waste from stages 3-12), use of equipment during deconstruction (Stages 3, 4 and 6-
12), and transport of equipment and labor to and from the site (Stage 1a). The emissions
with negative values in Tables 3-4, 3-5, 3-6 and 3-7 represent savings as a result of
replacing virgin materials with salvaged materials.
The most highly emitted species from all four scenarios were carbon monoxide
(CO), carbon dioxide (CO2), volatile organic compounds (VOCs), nitrogen oxides (NOx),
52
and methane (CH4). The remaining chemical emissions, dioxin, arsenic, lead, and
mercury, are listed in the tables because of their known toxicity. Total CO2 and CH4
emissions increased and VOC and CO emissions decreased with decreasing degree of
manual involvement. Despite small increases in emissions of CO from the disposal
stages from the 100% Manual to the 100% Mechanical scenario, the decrease in CO and
VOC emissions from equipment (resulting from decreasing use of the generator used to
clean salvaged materials) and transportation (resulting from the decreasing transportation
mileage from the commute to/from the site by the labor) overwhelmingly influence the
total CO and VOC values. As expected, the C&D landfill contributed the largest
emissions of CO2 and CH4 regardless of the scenario, and the increases in materials
disposed of in the landfill resulted in an increase in these emissions with decreasing
degree of manual involvement. Also, emissions of arsenic, lead, and mercury in leachate
from the landfill increased as manual involvement in the deconstruction decreased
because the amount of materials that are landfilled increased. These metals in particular
leach from the wood and the joists (Tables 3-4 - 3-7).
Total emissions of NOx are highest in the 100% Mechanical scenario (87.7 g/ft2
barrack, Table 3-7) and lowest in the 44% Manual scenario (46.9 g/ft2 barrack, Table 3-
5), with total emissions from the 100% Manual and 26% Manual scenarios (74.6 and 49.5
g/ft2) falling in between these values. The lower emissions of NOx as the amount of
manual involvement in the manual deconstruction scenarios decreased can be explained
by the decreased usage of cars for transportation of workers. The number of days the
workers drove to the site decreased as fewer manual methods were used which, in turn,
decreased the NOx production from the combustion of the gasoline. The 100%

53
Mechanical scenario yielded the highest NOx emissions because the steel was not
recycled. The recycling of steel produced negative emissions of NOx (emissions savings)
for the manual deconstruction scenarios, thus allowing 100% manual deconstruction to
yield lower NOx emissions than 100% mechanical demolition.
Impact Analysis
An impact assessment was performed on each of the four scenarios to determine
their effects on Global Warming, Ozone Depletion, Acidification, Eutrophication, Human
Toxicity, and Ecotoxicity. As stated earlier two published impact assessment methods,
CML and EDIP, were used for this LCA to compare and contrast the results of three
hypothetical cases—1) where no reuse was considered, 2) where reuse but no
transportation to a salvage warehouse was considered, and 3) where both salvage and
transportation to the Habitat for Humanity warehouse in Austin, TX were considered.
Case 1: No Salvaging
Figures 3-3 and 3-4 show impacts (calculated using EDIP and CML 2000,
respectively) resulting from the scenarios where no reuse was considered. In this option,
all salvaged materials are disposed of in a landfill. All scenarios that involve manual
deconstruction show comparable or larger contributions to all impact categories
calculated by the EDIP method (Fig. 3-3) compared to the mechanical demolition
scenario. All of the environmental impacts were lowest for the 100% Mechanical
scenario because of the significantly lower emissions resulting from lower total mileage
for transportation of the employee’s to/from the site and the lowest total hours of
equipment use. Specifically, ecotoxicity and human toxicity impacts are higher in the
scenarios involving manual methods because of the increased need of diesel fuel and
gasoline for machine and automobile operation, respectively. These impacts are most

54
affected by the emissions of mercury and lead during the production of the fuels, not
emissions resulting from their use in the associated equipment. The global warming
potential is higher for higher percentages of manual deconstruction because of the
increased transportation of workers and corresponding production- and use-related
emissions of CO and CO2. The increase in machine and transportation requirements in
all of the manual scenarios also yielded increased SOx and NOx emissions that increased
acidification and eutrophication impacts. Most of the SOx emissions were released in the
production of the diesel fuel and gasoline required by the machines and automobiles,
whereas the NOx was released primarily during the use of these fuels. The ozone
depletion potential was elevated because of the increased production requirements of
diesel fuel, needed in larger quantities in the manual scenarios. The production of diesel
fuel involves CFC emissions, thus yielding increased ozone depletion impacts.
The CML 2000 impact analysis method results revealed less significant influence
of 100% Mechanical methods on impacts (Fig. 3-6) and, in most cases, comparable
impacts among all of the scenarios. The reason for this difference from the EDIP results
is because the impact assessment categories are normalized by CML 2000, whereas EDIP
does not normalize the impact assessment results. Normalization attempts to achieve the
expression of impacts on a global or regional basis, and the CML 2000 approach
normalized the impacts to the most problematic species that is known for each impact
category. Global warming is expressed as kg of CO2, ozone depletion, as kg of CFC-11,
human toxicity and ecotoxicity, as kg of 1,4-DB, acidification, as kg of SO2, and
eutrophication, as kg of PO4-3. The impacts for EDIP are expressed based on the
environmental emissions that occur and their effects on the local area. Regardless of the

55
differences in results from the CML 2000 and EDIP impact assessment methods, both
show that, if the salvaged materials are not reused, then manual methods of
deconstruction yield potential for increased or comparable impacts compared to
traditional demolition methods.
Case 2: Salvaging and No Long-Distance Transportation to a Storage Facility (Local Reuse)
Figures 3-5 and 3-6 show the impacts calculated using the EDIP and CML 2000
impact analysis methods for each of the four scenarios where material is salvaged and
delivered to local reuse and recycling facilities. The EDIP impact results (Fig. 3-5)
showed that, unlike when no salvaging is considered, the 100% Mechanical scenario
yielded significantly higher impacts compared to the scenarios involving manual
methods. Differences observed in impacts from the manual scenarios were not large.
However, of the manual methods, the 100% Manual scenario yielded the least impacts to
global warming and ozone depletion. Acidification and toxicity impacts were lowest in
the 44% Manual scenario, with the latter resulting in a negative value because of
emissions savings. Eutrophication impacts were lowest in the 44% and 26% Manual
scenarios, whereas ecotoxicity impacts were the lowest in the 100% and 44% Manual
scenarios, both yielding negative impact values. These small differences in impacts
involving manual methods were directly related to the amount of wood salvaged and to
the amounts of diesel fuel, gasoline and electricity used in the processes. Manual
deconstruction avoided the production of virgin wood, thus avoiding electricity emissions
from this stage and yielding decreases in the ecotoxicity, ozone depletion and global
warming impacts. The 100% Manual scenario, involving increased use of machinery and
56
cars, yielded higher human toxicity, acidification and eutrophication impacts than its
other manual counterparts.
Like the EDIP method results, the CML 2000 method revealed that impacts from
the 100% Mechanical scenario were the highest when salvaging but no long-distance
transport of the salvaged materials was involved. The CML 2000 approach also showed
that the 100% Manual scenario yielded the lowest impacts in all categories except
acidification, which was lowest (and negative) in the 44% Manual scenario (Fig. 3-6). In
comparing only the impacts from the manual scenarios, the 26% Manual scenario was
largest in all cases and yielded no negative impacts using the CML 2000 method.
Case 3: Salvaging and Transport to Austin, TX, for Reuse
The impacts determined by the EDIP and CML methods for each of the four
scenarios that included transportation of the salvaged materials to the Habitat for
Humanity warehouse in Austin, TX, (approximately 885 miles) are shown in Figures 3-7
and 3-8, respectively. The 100% Mechanical scenario yielded the lowest impacts in all
instances because of its significantly lower transportation requirements. The
transportation of the salvaged material to Austin, Texas increased the environmental
impacts for each of the scenarios in which materials were salvaged. Likewise, impacts
increased with increasing manual involvement because of the greater emissions related to
fuel production and use during transportation accompanying the larger weight of
salvaged materials. The results of both the EDIP (Fig. 3-6) and CML 2000 (Fig. 3-7)
impact assessment methods showed that the negative impacts of transport distance of the
salvaged materials far outweigh the savings in emissions that occur by reusing the
materials.

57
Sensitivity Analysis
The previous results show the influence of both material salvaging for reuse and
transportation to a storage warehouse on the environmental and health impacts of each
scenario compared. Other variables tested for their influence on impacts were time for
deconstruction or demolition activities, driving distance (carpooling), degree of recycling,
transport distance of equipment, and time for material preparation.
Time for Deconstruction or Demolition Activities
The importance of the pace of dismantling and demolishing the barrack by each of
the four scenarios on the environmental and health impacts was determined by increasing
and decreasing the baseline rates achieved. Baseline rates of dismantling achieved by the
deconstruction team were 105.5, 182.4, 231.7, and 388.4 lbs/hr for 100%, 44%, 26%
manual deconstruction and 100% mechanical demolition, respectively. The demolition
rates achieved were 1028.5, 608.2, 729.3, and 600.1 lb/hr for the 100%, 44%, 26%
manual deconstruction and 100% mechanical demolition scenarios, respectively. These
rates were found by dividing the lbs of material salvaged and landfilled by the labor
hours minus the machine hours and machine hours respectively.
The rate of dismantling material for salvage was observed to influence the
emissions much more than the disposal rate because the slower rate of hand demolition
greatly increased the amount of time the workers spent at the site and thus the times
required for driving to work and using the generator. For the scenarios involving manual
deconstruction, decreasing the rate of dismantling by 5 lb/hr increased human toxicity by
21%, acidification by 4%, and eutrophication and ozone depletion by 3%, whereas very
little change in the impacts was observed in the 100% Mechanical scenario because no
salvaging of materials was performed. Increasing the rate of dismantling by 5 lb/hr
58
showed that human toxicity was also most sensitive by resulting in a decrease of 27.4%,
while acidification and eutrophication decreased by 6% and ozone depletion by 4.0%.
Increasing and decreasing the rate of demolition resulted in no significant change in
impacts.
Commuting Distance
Decreasing and increasing the commuting distance of 20 miles assumed in the
baseline case by 5 and 10 miles and in the number of people/car from 1 in the baseline
case to 4 tested for their sensitivity on the impacts from the 100% Manual scenario. The
importance of carpooling to the site by increasing the number of occupants to four was
evident by a decrease in eutrophication by 561%, in acidification by 77.5%, and in
human toxicity by 39%. Less dramatic results were observed with increasing the driving
distance by 5 miles, where the largest changes were observed in impacts on
eutrophication, acidification and human toxicity (2.12%, 0.290% and 0.146% increases,
respectively).
Recycling
When recycling was removed from the scenarios involving manual methods,
acidification, eutrophication, and ecotoxicity decreased as much as 23.5%, 36.4% and
77.9%, respectively (for the 100% Manual scenario).
Transportation Requirements
Driving distances for transportation of demolition equipment, salvaged material,
recycled material and landfill material, for moving equipment to the woods, felled wood
from the woods to the mill and boards from the mill to the store or site were increased
and decreased by 5 and 10 miles from their assumed transport distances (listed in the
Assumptions and Limitations section). Most of the emissions categories did not increase
59
or decrease significantly. Global warming, ozone depletion, acidification and
eutrophication changed the most as a result of elevated emissions resulting from
increased diesel fuel requirements. For example, when the mileage of an eighteen-wheel
truck was increased by 5 miles, eutrophication increased by 18.3%, acidification
increased by 2.38%, global warming increased by 2.11%, and ozone depletion increased
by 1.25%.
Time Required for Paint and Nail Removal
According to the deconstruction team’s past experience, 30% of the total time for
manual deconstruction involves paint stripping and denailing the wood and thus use of
the generator. However, this time percentage was increased and decreased by 5 and 10%
to account for differences in methods and experience levels of deconstruction teams. The
results show that large changes in acidification, eutrophication and human toxicity occur
when the generator times for paint stripping and denailing runs were altered.
Acidification increased the most, 106%, when the time for material preparation was
increased by 5%, while eutrophication and human toxicity impacts increased by 48.5%
and 26.1%, respectively. Thus, the amount of time spent on material preparation can
greatly affect the environmental impacts that occur from manual deconstruction.
Conclusions
Of the three options considered, that involve salvaging and reuse within a 20-mile
distance yielded the lowest impacts. Both the CML 2000 and EDIP methods resulted in
significantly lower environmental and health impacts when manual methods of
deconstruction were used. Of the three manual scenarios considered with salvaging, the
100% and 44% Manual scenarios yielded, for the most part, the lowest impacts.
Compared to the scenarios involving manual methods of deconstruction, the 100%
60
Mechanical scenario was the fastest option, as anticipated, and, if the salvaged wood does
not replace virgin wood in other building applications, this traditional means of building
removal was shown to be the best option in terms of environmental emissions and
resulting impacts. However, if the reuse of salvaged wood is assumed to avoid the
production of virgin wood then either the 100% Manual or 44% Manual scenario would
be preferred because of the decrease in environmental emissions and thus impacts. The
LCA model presented herein is most sensitive to changes in car mileage and the amount
of time the generator runs. It is recommended, therefore, that the deconstruction occur on
or near the site where the materials will be reused, for the workers to live near the site,
and for the amount of time spent on material preparation to be minimal.
Social and economic impacts of deconstruction and demolition processes were not
quantified in this study. Economic impacts of deconstruction have been discussed by
Guy and Williams (2004), however. Because deconstruction takes longer and is more
labor-intensive, it provides work for a crew for several days. Deconstruction also
provides lower-cost building materials, which, in turn, can lower the cost of new
construction or can allow people who cannot afford virgin materials to buy materials of
good quality to make repairs on their own homes. Given that the Department of Defense
must dispose of nearly 2.5 million square feet of army barracks in the U.S. EPA Region 4
alone, incorporating some degree of manual deconstruction offers potential benefits well
beyond those quantified in this study. Given the influence of transportation of salvaged
materials for reuse applications, it is recommended, however, that a strategy be
developed to foster reuse within the deconstruction site region.
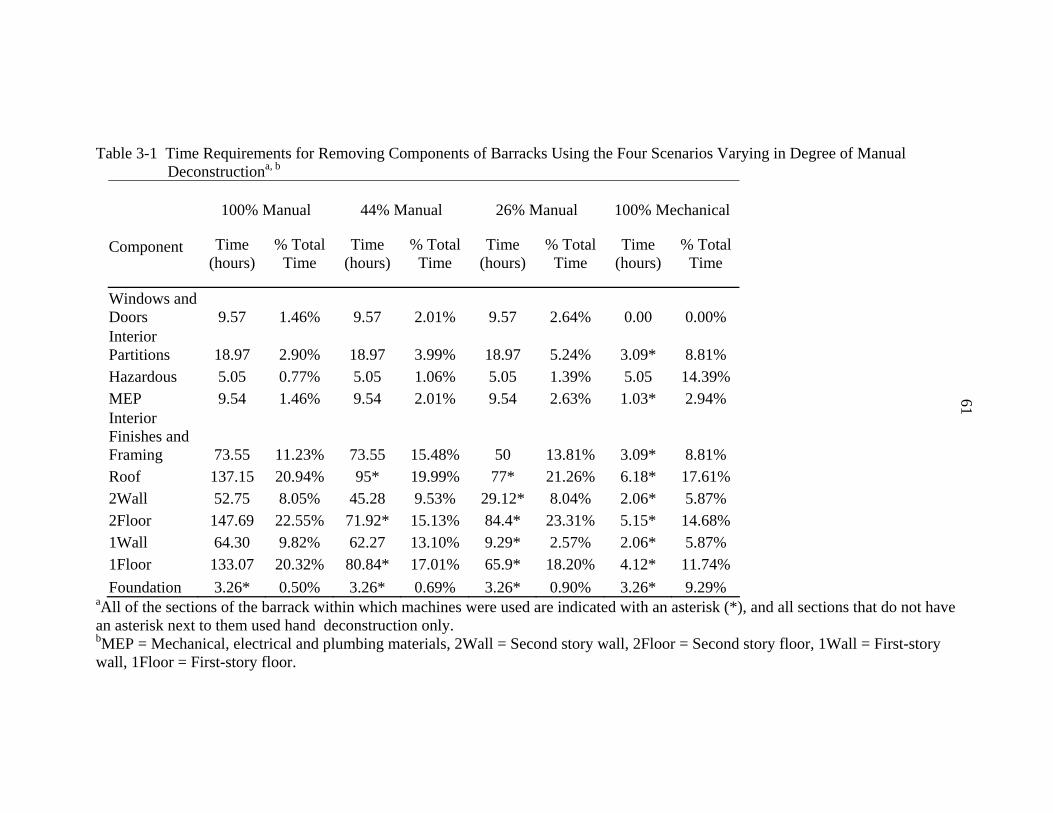
61
Table 3-1 Time Requirements for Removing Components of Barracks Using the Four Scenarios Varying in Degree of Manual Deconstructiona, b
100% Manual
44% Manual
26% Manual
100% Mechanical
Component Time
(hours) % Total
Time Time
(hours) % Total
Time Time
(hours) % Total
Time Time
(hours) % Total
Time
Windows and Doors 9.57 1.46% 9.57 2.01% 9.57 2.64% 0.00 0.00% Interior Partitions 18.97 2.90% 18.97 3.99% 18.97 5.24% 3.09* 8.81% Hazardous 5.05 0.77% 5.05 1.06% 5.05 1.39% 5.05 14.39% MEP 9.54 1.46% 9.54 2.01% 9.54 2.63% 1.03* 2.94% Interior Finishes and Framing 73.55 11.23% 73.55 15.48% 50 13.81% 3.09* 8.81% Roof 137.15 20.94% 95* 19.99% 77* 21.26% 6.18* 17.61% 2Wall 52.75 8.05% 45.28 9.53% 29.12* 8.04% 2.06* 5.87% 2Floor 147.69 22.55% 71.92* 15.13% 84.4* 23.31% 5.15* 14.68% 1Wall 64.30 9.82% 62.27 13.10% 9.29* 2.57% 2.06* 5.87% 1Floor 133.07 20.32% 80.84* 17.01% 65.9* 18.20% 4.12* 11.74% Foundation 3.26* 0.50% 3.26* 0.69% 3.26* 0.90% 3.26* 9.29%
aAll of the sections of the barrack within which machines were used are indicated with an asterisk (*), and all sections that do not have an asterisk next to them used hand deconstruction only. bMEP = Mechanical, electrical and plumbing materials, 2Wall = Second story wall, 2Floor = Second story floor, 1Wall = First-story wall, 1Floor = First-story floor.
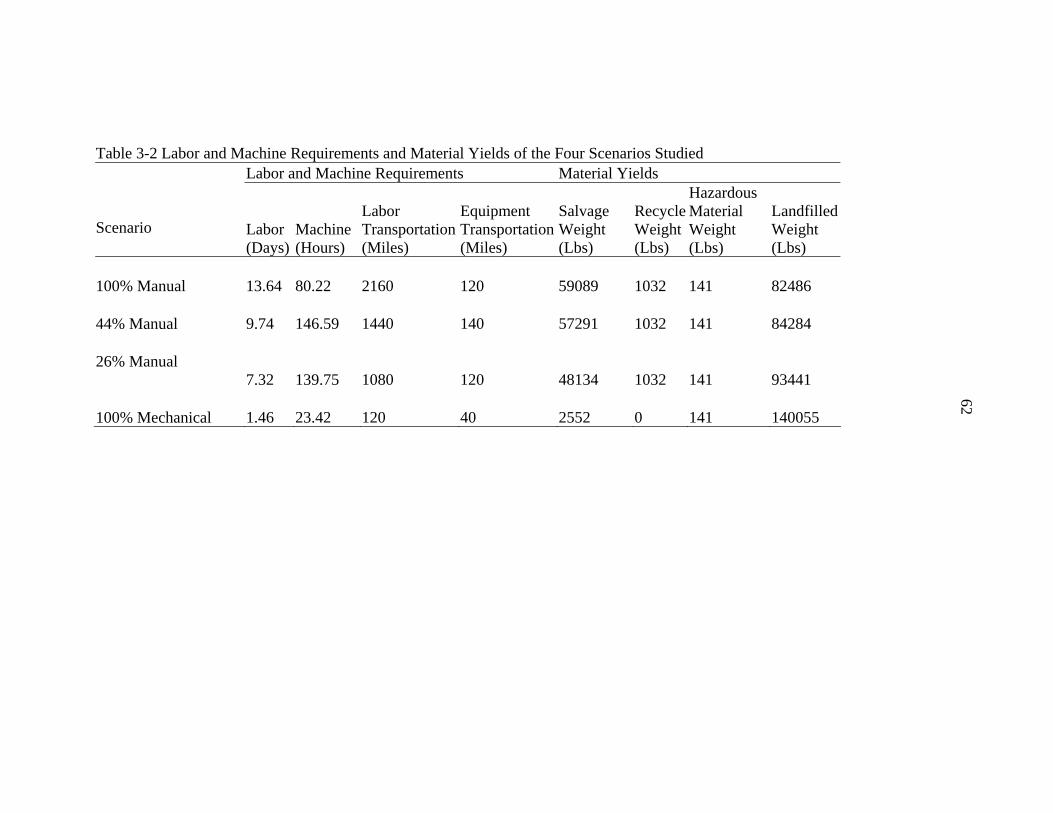
62
Table 3-2 Labor and Machine Requirements and Material Yields of the Four Scenarios Studied Labor and Machine Requirements Material Yields
Scenario
Labor (Days)
Machine (Hours)
Labor Transportation (Miles)
Equipment Transportation (Miles)
Salvage Weight (Lbs)
Recycle Weight (Lbs)
Hazardous Material Weight (Lbs)
Landfilled Weight (Lbs)
100% Manual 13.64 80.22 2160 120 59089 1032 141 82486 44% Manual 9.74 146.59 1440 140 57291 1032 141 84284 26% Manual 7.32 139.75 1080 120 48134 1032 141 93441 100% Mechanical 1.46 23.42 120 40 2552 0 141 140055

63
Table 3-3 Fuel and Electricity Requirements for Associated Processesa,b
Processes Involved Stagesc
Gasoline (gal)
Diesel Fuel (gal)
Electricity (kWh)
Labor
Transportation (1 laborer, 1 day of work) -- 8.0E-01 -- --
Deconstruction Transportation To and From the Site -- -- 6.4E+00 -- Lift (hr) 7, 8 -- 2.5E+00 --
Bobcat (hr)
6, 7, 9, 10, 11, 12 -- 5.0E+00 --
Excavator (hr) 7, 12 -- 8.1E+00 -- Crane (hr) 7 -- 4.0E+00 -- Chopsaw (hr) 7, 11 2.0E-01 -- --
Chainsaw (hr) 7, 8, 9, 10, 11 1.2E-01 -- --
Generator (hr) 13 6.3E-01 -- -- End-of-Life Stages Salvaging Wood (1 lb) Harvesting
Transportation of Equipment to and from the Forest 14 -- 2.9E+01 --
Feller Buncher (1 lb) 15 -- 1.7E-03 -- Rubber Tired Skidder (1 lb) 15 -- 2.8E-03 -- Log Loader (1 lb) 15 -- 3.1E-03 -- Transport from Site to Sawmill (1 lb) 15 -- 9.0E-03 -- Sawmill Electricity (1 lb) 16 -- -- 6.2E-03
Transportation from the Sawmill to Construction the Site (1 lb) 16 -- 3.0E-03 --
Recycling Steel (1 lb) Electricity (1 lb) 5a -- -- 2.1E+00 Transportation to Recycling Facility 5a -- 1.6E-02 -- Landfill (1 lb) Transportation to Landfill 1b -- 1.6E-02 --
aValues of fuel requirements by the equipment are presented on an hourly basis, and values of electricity. bAll fuel usage values were obtained by contacting the manufacturers of the machines and asking for average fuel usage values. cStage numbers refer to the specific stages involved and shown in Figure 3-2. dMileage workers drove to/from the site was assumed to be 20 miles, equipment transported from within a 20 mile radius to site, 30 miles to/from the forest, 60 mile transport for harvested wood to sawmill, 100 mile transport from sawmill to construction site and an 80 mile transport distance for salvaged material to new construction site.

64
Table 3-4 Emissions from the Scenario Involving 100% Manual Methodsa
aThe functional unit is per ft2 of barrack removed. The emissions in this table are expressed in terms of g/ft2 of barrack removed. bEquipment includes a lift, bobcat, excavator, chopsaw, chainsaw and weedeater. cTransportation includes labor and equipment.
Emission Total Salvaged Material Disposal
Recycled Material Equipmentb Transportationc
Criteria Pollutants Carbon Monoxide (CO) 3.52E+03 -8.29E+01 6.94E+01 9.36E-01 1.94E+03 1.59E+03
Nitrogen Oxides (NOx) 7.46E+01 -7.06E+01 4.79E+01 -9.59E-01 5.55E+01 4.28E+01 Air Toxics Dioxin -8.16E-12 -2.76E-11 1.50E-11 1.87E-13 3.17E-12 1.08E-12
Greenhouse Gases Methane (CH4) 8.49E-01 -2.29E+00 2.43E+00 3.03E-02 5.09E-01 1.70E-01
Carbon Dioxide (CO2) 3.45E+02 -1.46E+03 1.57E+03 -2.72E+02 3.86E+02 1.11E+02 Metals Arsenic (As) 1.62E-05 -4.49E-05 4.73E-05 5.92E-07 9.88E-06 3.32E-06 Lead (Pb) -4.72E-04 -7.08E-05 8.38E-05 -5.09E-04 1.76E-05 5.92E-06 Mercury (Hg) 3.05E-06 -1.71E-05 1.56E-05 1.95E-07 3.26E-06 1.09E-06
Miscellaneous Chemicals Volatile Organic Compounds (VOCs) 1.69E+02 -2.61E-01 0.00E+00 -2.46E-02 9.40E+01 7.53E+01

65
Table 3-5 Emissions from the Scenario Involving 44% Manual Methodsa
Emission Total Salvaged Material Disposal
Recycled Material Equipmentb Transportationc
Criteria Pollutants Carbon Monoxide (CO) 2.22E+03 -8.04E+01 7.09E+01 9.36E-01 1.17E+03 1.06E+03
Nitrogen Oxides (NOx) 4.69E+01 -6.84E+01 4.90E+01 -9.59E-01 3.83E+01 2.90E+01Air toxics Dioxin -6.96E-12 -2.68E-11 1.53E-11 1.87E-13 3.46E-12 8.65E-13
Greenhouse Gases Methane (CH4) 9.87E-01 -2.22E+00 2.48E+00 3.03E-02 5.57E-01 1.37E-01
Carbon Dioxide (CO2) 5.38E+02 -1.42E+03 1.61E+03 -2.72E+02 5.22E+02 8.92E+01Metals Arsenic (As) 6.68E-05 -1.46E-04 1.97E-04 5.92E-07 1.09E-05 2.67E-06Lead (Pb) -3.00E-03 -7.50E-05 9.49E-05 -3.04E-03 2.13E-05 5.28E-06Mercury (Hg) 3.98E-06 -1.66E-05 1.60E-05 1.96E-07 3.58E-06 8.79E-07
Miscellaneous Chemicals Volatile Organic Compounds (VOCs) 1.04E+02 -2.53E-01 0.00E+00 -2.46E-02 5.38E+01 5.02E+01
aThe functional unit is per ft2 of barrack removed. The emissions in this table are expressed in terms of g/ft2 of barrack removed. bEquipment includes a lift, bobcat, excavator, chopsaw, chainsaw and weedeater. cTransportation includes labor and equipment.
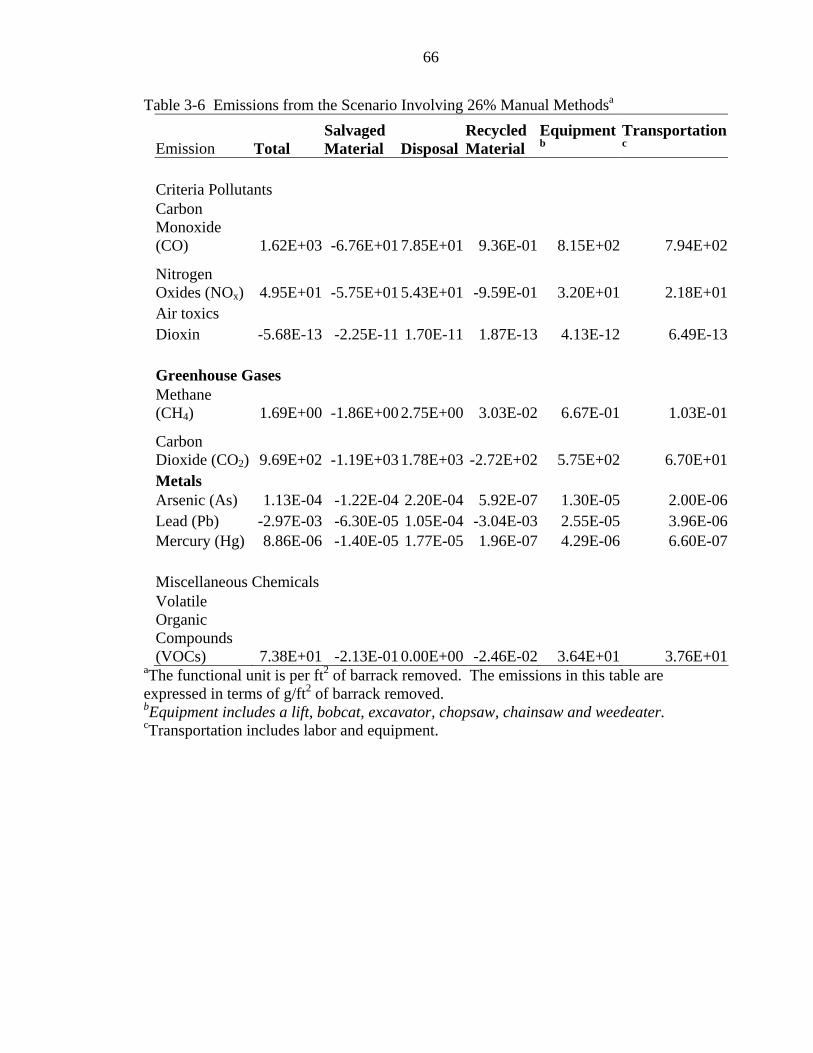
66
Table 3-6 Emissions from the Scenario Involving 26% Manual Methodsa
Emission Total Salvaged Material Disposal
Recycled Material
Equipmentb
Transportationc
Criteria Pollutants Carbon Monoxide (CO) 1.62E+03 -6.76E+01 7.85E+01 9.36E-01 8.15E+02 7.94E+02
Nitrogen Oxides (NOx) 4.95E+01 -5.75E+01 5.43E+01 -9.59E-01 3.20E+01 2.18E+01Air toxics Dioxin -5.68E-13 -2.25E-11 1.70E-11 1.87E-13 4.13E-12 6.49E-13
Greenhouse Gases Methane (CH4) 1.69E+00 -1.86E+00 2.75E+00 3.03E-02 6.67E-01 1.03E-01
Carbon Dioxide (CO2) 9.69E+02 -1.19E+03 1.78E+03 -2.72E+02 5.75E+02 6.70E+01Metals Arsenic (As) 1.13E-04 -1.22E-04 2.20E-04 5.92E-07 1.30E-05 2.00E-06Lead (Pb) -2.97E-03 -6.30E-05 1.05E-04 -3.04E-03 2.55E-05 3.96E-06Mercury (Hg) 8.86E-06 -1.40E-05 1.77E-05 1.96E-07 4.29E-06 6.60E-07
Miscellaneous Chemicals Volatile Organic Compounds (VOCs) 7.38E+01 -2.13E-01 0.00E+00 -2.46E-02 3.64E+01 3.76E+01
aThe functional unit is per ft2 of barrack removed. The emissions in this table are expressed in terms of g/ft2 of barrack removed. bEquipment includes a lift, bobcat, excavator, chopsaw, chainsaw and weedeater. cTransportation includes labor and equipment.
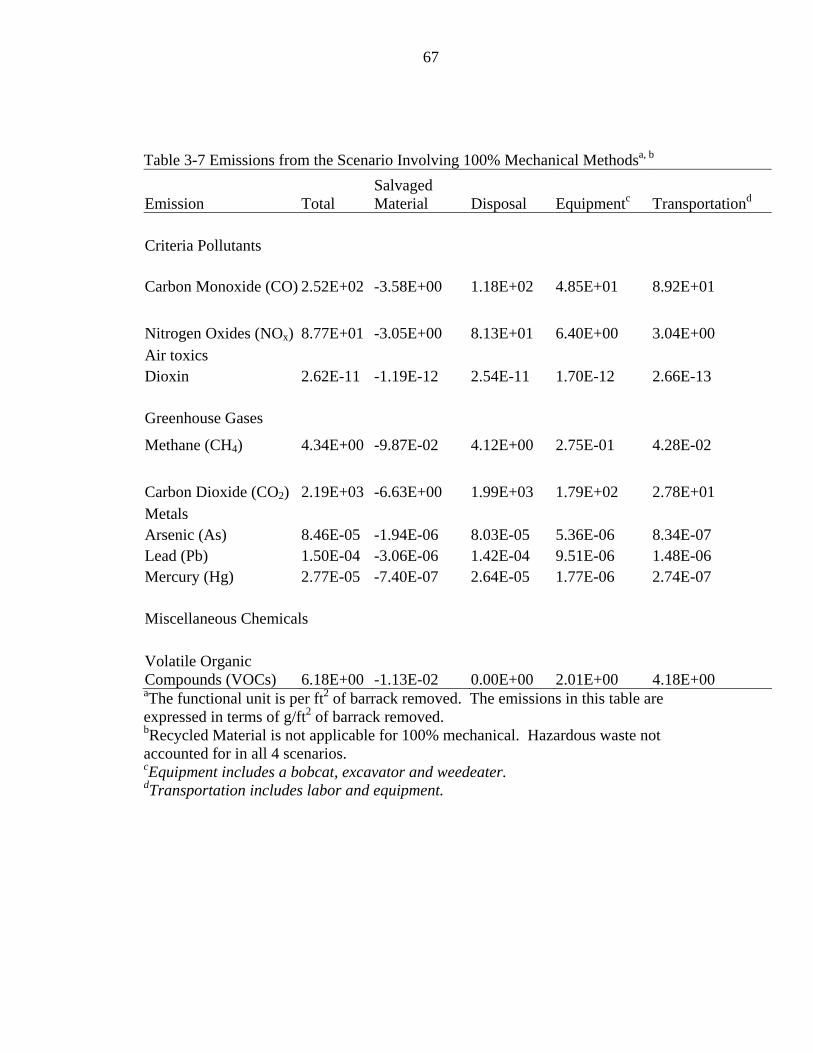
67
Table 3-7 Emissions from the Scenario Involving 100% Mechanical Methodsa, b
Emission Total Salvaged Material Disposal Equipmentc Transportationd
Criteria Pollutants
Carbon Monoxide (CO) 2.52E+02 -3.58E+00 1.18E+02 4.85E+01 8.92E+01
Nitrogen Oxides (NOx) 8.77E+01 -3.05E+00 8.13E+01 6.40E+00 3.04E+00 Air toxics Dioxin 2.62E-11 -1.19E-12 2.54E-11 1.70E-12 2.66E-13
Greenhouse Gases
Methane (CH4) 4.34E+00 -9.87E-02 4.12E+00 2.75E-01 4.28E-02
Carbon Dioxide (CO2) 2.19E+03 -6.63E+00 1.99E+03 1.79E+02 2.78E+01 Metals Arsenic (As) 8.46E-05 -1.94E-06 8.03E-05 5.36E-06 8.34E-07 Lead (Pb) 1.50E-04 -3.06E-06 1.42E-04 9.51E-06 1.48E-06 Mercury (Hg) 2.77E-05 -7.40E-07 2.64E-05 1.77E-06 2.74E-07
Miscellaneous Chemicals
Volatile Organic Compounds (VOCs) 6.18E+00 -1.13E-02 0.00E+00 2.01E+00 4.18E+00 aThe functional unit is per ft2 of barrack removed. The emissions in this table are expressed in terms of g/ft2 of barrack removed. bRecycled Material is not applicable for 100% mechanical. Hazardous waste not accounted for in all 4 scenarios. cEquipment includes a bobcat, excavator and weedeater. dTransportation includes labor and equipment.
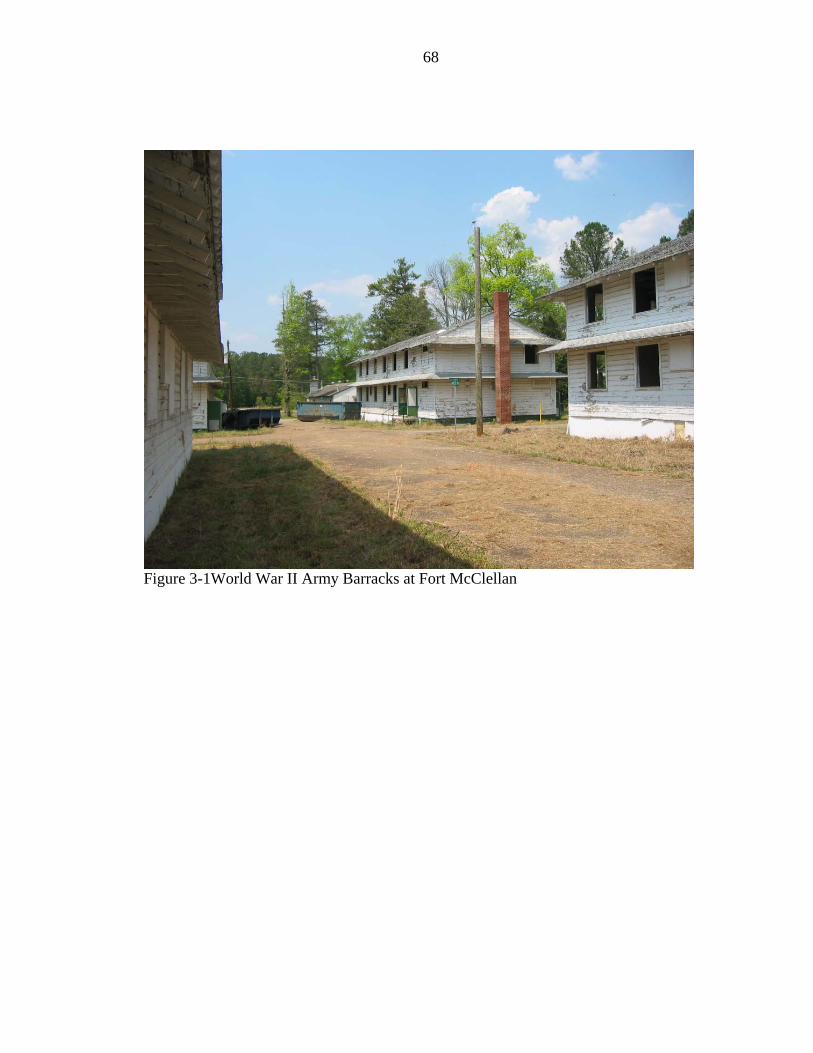
68
Figure 3-1World War II Army Barracks at Fort McClellan

69
Figure 3-2 Stages Involved in the Deconstruction Process
Avoided Virgin Wood Production
16. Sawmill
15. Harvesting
14. Transportation of Machinery
Deconstruction on Site
1a. Transportation of Labor and Machinery
1. Asbestos Removal
1b. C&D Landfill
2. Hazardous Waste Removal
2a. Hazardous Waste Disposal
5. MEP 5a. Recycled Steel
13. Mechanical Cleaning and Preparation of Salvaged Material
3. Interior Partitions
4. Windows and Doors
6. Interior Finishes and Framing
7. Roof 8. Second Story Wall
9. Second Story Floor
10. First Story Wall
11. First Story Floor
12. Foundation
13a. Salvaged Material Avoids Virgin Wood
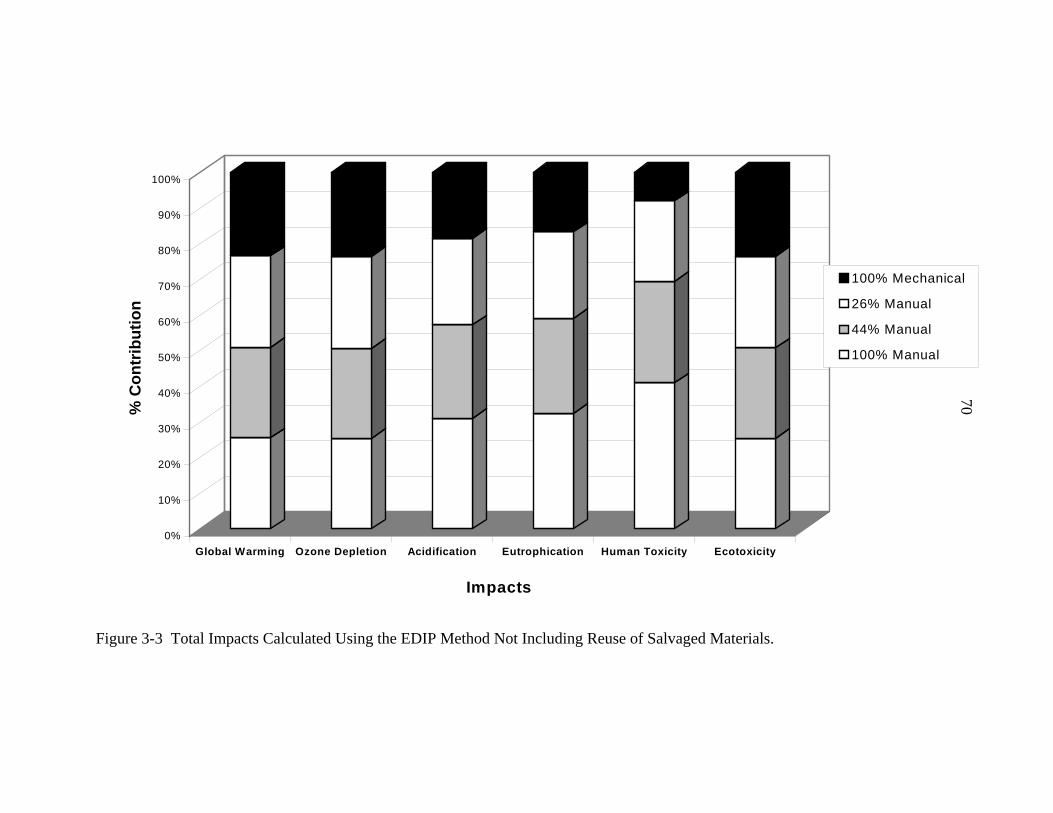
70
Figure 3-3 Total Impacts Calculated Using the EDIP Method Not Including Reuse of Salvaged Materials.
0%
10%
20%
30%
40%
50%
60%
70%
80%
90%
100%
% C
ontr
ibut
ion
Global Warming Ozone Depletion Acidification Eutrophication Human Toxicity Ecotoxicity
Impacts
100% Mechanical
26% Manual
44% Manual
100% Manual
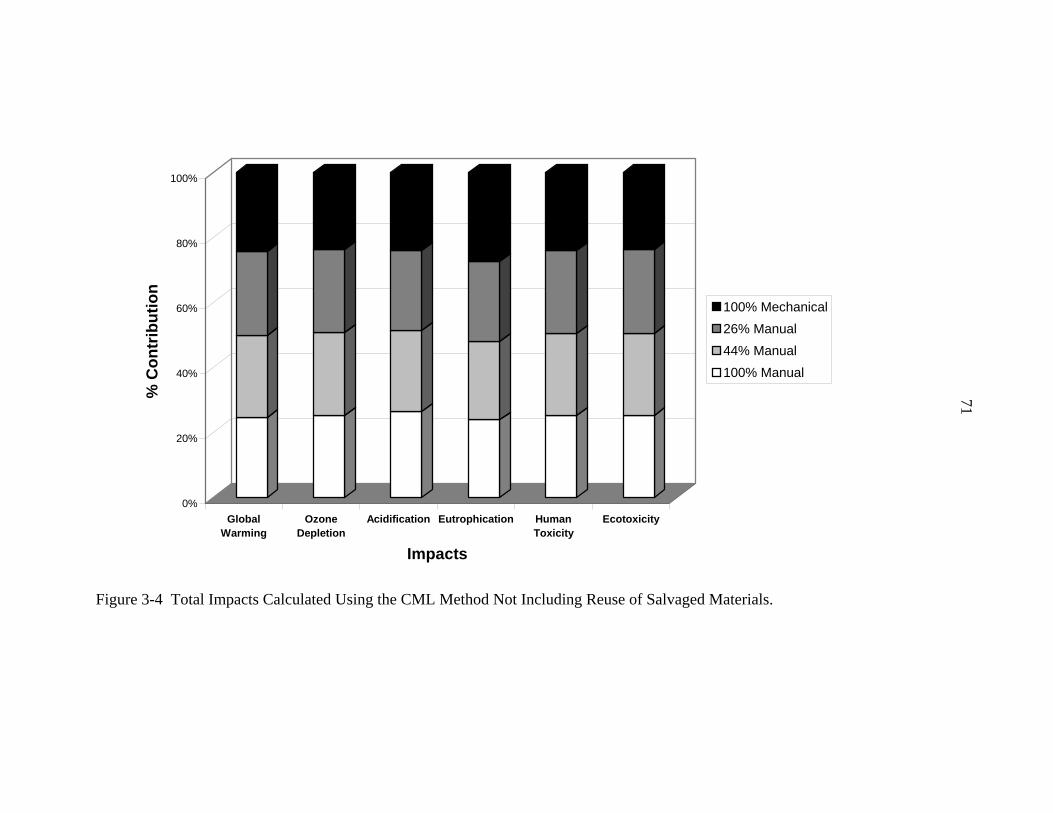
71
0%
20%
40%
60%
80%
100%
% C
ontr
ibut
ion
GlobalWarming
OzoneDepletion
Acidification Eutrophication HumanToxicity
Ecotoxicity
Impacts
100% Mechanical26% Manual44% Manual100% Manual
Figure 3-4 Total Impacts Calculated Using the CML Method Not Including Reuse of Salvaged Materials.
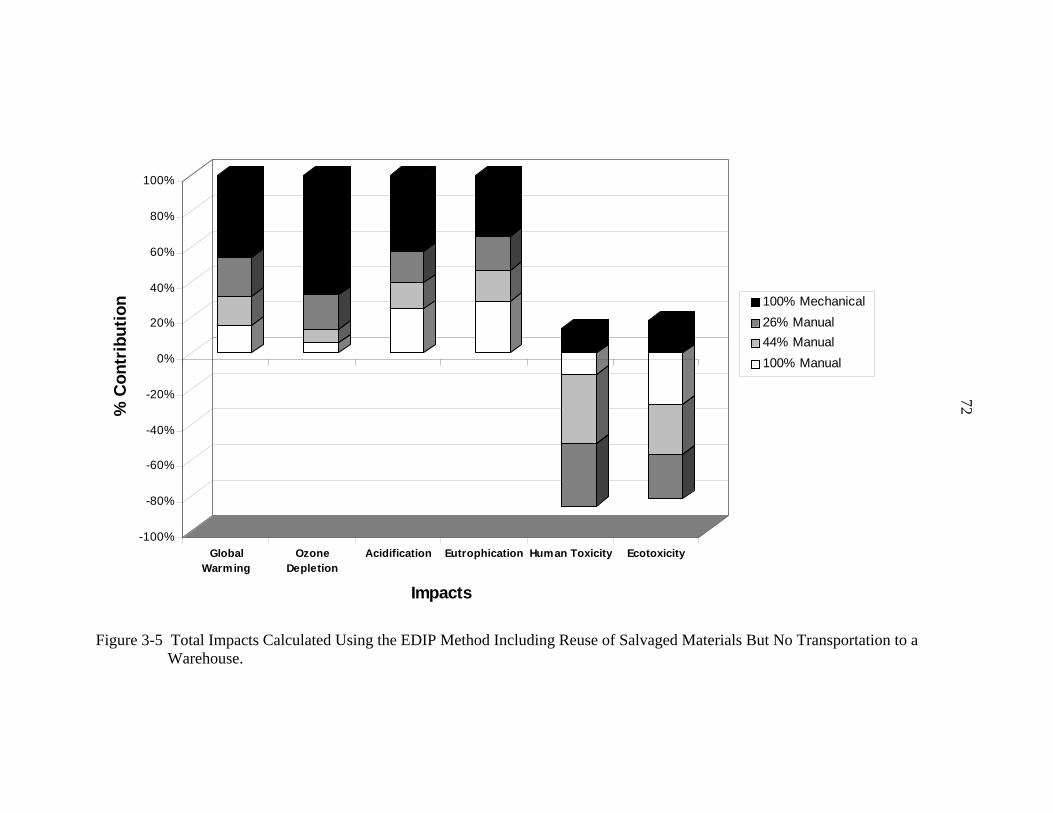
72
-100%
-80%
-60%
-40%
-20%
0%
20%
40%
60%
80%
100%
% C
ontr
ibut
ion
GlobalWarming
OzoneDepletion
Acidification Eutrophication Human Toxicity Ecotoxicity
Impacts
100% Mechanical26% Manual44% Manual100% Manual
Figure 3-5 Total Impacts Calculated Using the EDIP Method Including Reuse of Salvaged Materials But No Transportation to a
Warehouse.

73
-40%
-20%
0%
20%
40%
60%
80%
100%
% C
ontri
butio
n
GlobalWarming
OzoneDepletion
Acidification Eutrophication Human Toxicity Ecotoxicity
Impacts
100% Mechanical26% Manual44% Manual100% Manual
Figure 3-6 Total Impacts Calculated Using the CML Method Reuse of Salvaged Materials But No Transportation to a Warehouse.

74
0%
20%
40%
60%
80%
100%
% C
ontr
ibut
ion
Global Warming Ozone Depletion Acidification Eutrophication Human Toxicity Ecotoxicity
Impacts
100% Mechanical26% Manual44% Manual100% Manual
Figure 3-7 Total Impacts Calculated Using the EDIP Method Including Reuse of Salvaged Materials and Transport to the Habitat for
Humanity Warehouse in Austin, Texas.
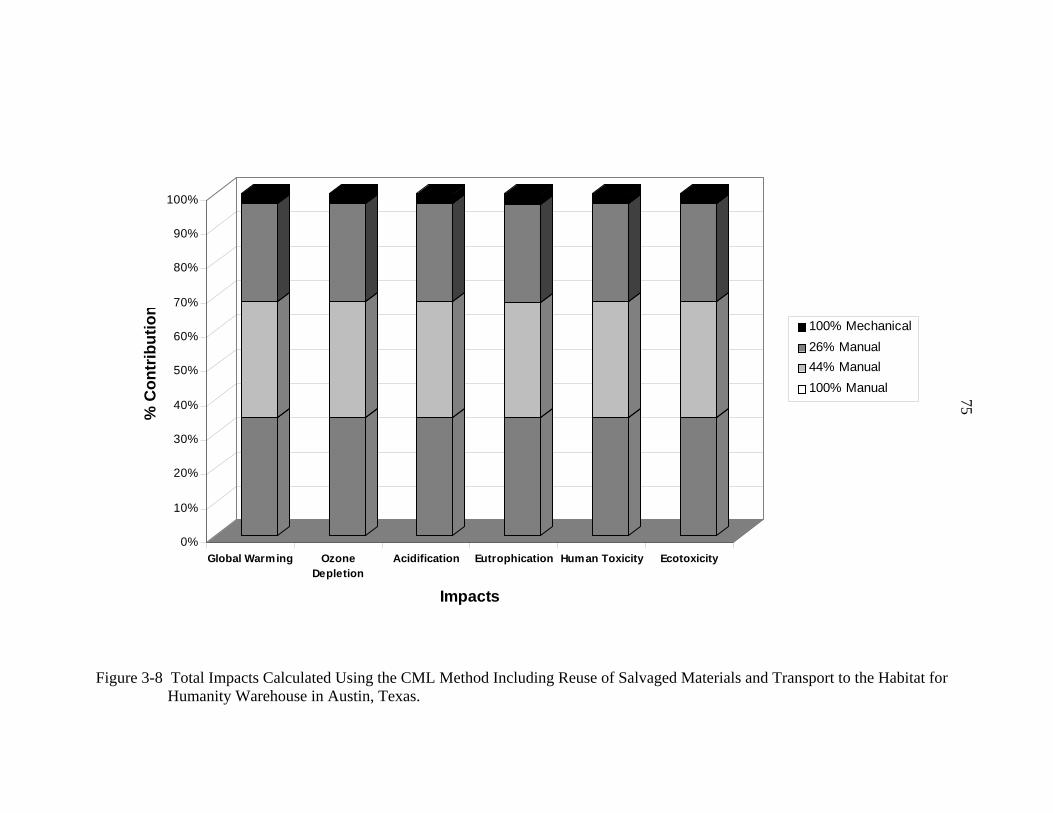
75
0%
10%
20%
30%
40%
50%
60%
70%
80%
90%
100%
% C
ontr
ibut
ion
Global Warming OzoneDepletion
Acidification Eutrophication Human Toxicity Ecotoxicity
Impacts
100% Mechanical26% Manual44% Manual100% Manual
Figure 3-8 Total Impacts Calculated Using the CML Method Including Reuse of Salvaged Materials and Transport to the Habitat for Humanity Warehouse in Austin, Texas.
76
CHAPTER 4 SUMMARY, CONCLUSIONS AND RECOMENDATIONS
Summary
An LCA was performed comparing deconstruction and demolition of World War II
army barracks to determine the contribution of each life cycle stage to the total
environmental impacts and to compare impacts of material reuse and disposal. Before
this LCA was conducted, a combination of deconstruction and demolition was performed
on three barracks. Once the time requirements for each stage of these processes were
found, four modeled scenarios were produced. An LCA was then performed on these
four scenarios using SimaPro. The four life cycle stages considered for the
deconstruction process were deconstructing the building, cleaning the salvaged materials,
salvaged material reuse, and disposal. The four life cycle stages considered for the
demolition process were harvesting of trees, processing of trees to boards at the sawmill,
use of materials in buildings, and disposal. The LCA was performed according to ISO
14040 standards and included scope and goal definition, inventory analysis, impact
assessment, and interpretation. Impact assessment was performed using two published
impact methods—CML and EDIP.
Conclusions
Results from the inventory analysis have shown that demand for virgin material is
highest for 100% mechanical demolition. The largest amount of emissions to water, air
and soil is derived from the disposal of the materials into landfills when compared to all
the other process considered throughout this LCA. In fact, in most cases the salvaging of
77
the materials had an almost opposite effect on the environment than did the disposal of
the materials into landfills. This is due not only to the effects of disposal of materials into
the landfill but also to impacts resulting from reproduction of that material. Salvaging
materials circumvented both landfilling and reproduction of new virgin materials, thus
yielding environmental savings.
The impact assessment methods used showed some variation based on the chosen
model. According to the EDIP method of analysis, the 100% Manual and 44% Manual
deconstruction scenarios were shown to be superior when material was salvaged and
transported nearby. The largest emissions that occurred for 100% manual deconstruction
scenario, shown in Table 3-4, were CO2, CO, NOx, and VOCs, ranging from 7.46E+01
g/ft2 NOx to 3.52E+03 g/ft2 CO. Both CO and CO2 emissions were greater than observed
in the 100% mechanical deconstruction scenario, primarily because of increased
generator operation and labor transportation requirements. The transportation of labor
and the use of the generator were also the largest contributors to the nitrogen oxides and
VOC’s in this scenario. Table 3-5 illustrates that in the 44% manual scenario, the largest
emissions were CO2, CO, NOx, and VOCs ranging from 2.22E+03 to 4.69E+01. The
major sources of these emissions are also transportation of labor to/from the site and
generator operation. An increased amount of landfilled material contributes to increased
CH4 emissions and, in part, to increased CO2 and CO emissions when compared to the
100% manual deconstruction scenario. With less time spent at the site less transportation
of workers occurred to and from the site and with less salvaged material the generator
was used for a smaller amount of time thus all of the emissions for this scenario were less
than the 100% manual emissions. As seen in Table 3-6 the 26% manual scenario had the
78
same top 4 emissions and the same contributing processes to the emissions ranging from
4.95E+01 to 1.62E+03. Due to the higher transportation of machinery and the lower
amount of salvaged materials, the largest producer of carbon dioxide was the
transportation of equipment, followed closely by the transportation of labor and the use of
the generator. As with the 44% manual scenario the emissions were lower than the 100%
manual and the 100% mechanical scenario due to less material being landfilled and less
time being spent in transportation of labor and cleanup of the salvaged materials. Table
3-7 provides emissions resulting from 100% mechanical demolition of a barrack. The
highest total emissions in this scenario were greenhouse gases, carbon dioxide (CO2,
3.40E+02 g/ft2) and carbon monoxide (CO, 2.52E+02 g/ft2). Also high were emissions
of nitrogen oxides (NOx), volatile organic compounds (VOCs) and methane (CH4). The
greatest contributor of CO2, CO, NOx and CH4 was the landfill used for disposal of waste
materials, whereas the main source of VOC’s was the transportation of labor and
equipment to and from the site. Equipment operation was also a significant contributor to
CO2 emissions.
A sensitivity analysis was performed on the results from the impact assessment to
determine the influence of variables on the environmental impacts considered. The
model produced in SimaPro was most sensitive to changes in the mileage driven by
workers onsite machine use and the operation time of the generator. It was shown that
environmental impacts decrease with higher levels of materials salvaged. However,
detrimental impacts were shown to rise with transportation distance to the new
construction site or to a storage facility. Impacts also increased with increasing
deconstruction time because of the increased number of days workers drove their cars to

79
the site. Ideally, salvaged materials would be reused at a construction site located on or
near the property where the building is deconstructed.
The results found from this project will be used by the DOD to aid in development
of best management practices for the 2,357,094 square feet of army barracks, slated for
removal within EPA Region 4 and the countless more square footage of buildings in need
of removal on bases throughout the U.S. The implementation of these practices by the
DOD will decrease the impact of the disposal of these buildings on both public health and
the environment through decreased environmental impacts.
While cost and societal impacts of deconstruction were not considered in this study,
some discussion of these aspects is worth mention. While increases in environmental
savings were shown herein, the availability of materials for reuse has tremendous social
implications. Jobs are created by deconstruction, and companies and individuals unable
to afford large amounts virgin materials would be able to access materials at a decreased
cost. With careful planning and execution, deconstruction costs less than demolition
considering the resale value of the materials and decreased landfill disposal costs and
certainly provides greater positive contributions to society.
Recommendations
The most significant limitation to this study was the small number of scenarios
studied. Because the most efficient way to take down a building in terms of time and
environmental impacts is a combination of hand deconstruction and mechanical
demolition, it would have been beneficial to have more scenarios that combined the two.
This would give a more accurate representation of the most effective way to take down a
building. It is recommended that for each building, contractors should determine the

80
amount of available materials that could be salvaged and the worth of these salvageable
materials. In doing so, the building can be removed using a combination of
deconstruction and demolition methods, resulting in maximum environmental savings
from prevention of disposal of the reusable materials and production the new replacement
materials.
81
APPENDIX A DATA COLLECTION AND DAILY NARRRRATIVE
Introduction to the Form
The heart of the data collection method is the data collection form. The form
guides the documentation of each worker. It gives information on where they are
working, what they are doing, and what equipment they are using. Since each form
covers 15 minutes of activity, one is completed every 15 minutes from the start to the end
of each workday. Later, the forms are entered into a spreadsheet format that allows the
data to be sorted in different ways. This information was collected by the deconstruction
team.

82
Team : Deconstruction
Completed by: Date Time: 7:30-7:45
Name Building Room Location Activity Assembly Equipment
1
2
3
4
5
6
7
8
9
10

83
Key to Form
Team
Starting in the upper left hand corner, the first box identifies the team which is
going to be recorded on the form. For this project, we had two main teams. The first one
was the Deconstruction Team, which was primarily composed of the demolition
contractor and crew. This was the team that was responsible for removing the materials
from the building. The other was the Processing Team. This Team was composed of
Americorp and Habitat for Humanity (HfH) volunteers. This Team was responsible for
taking the deconstructed materials, getting them into a ready-for-use state, and
transporting them to the HfH storage facility.
Completed by
Record of who completed the data form.
Date
Date form was completed.
Time
15-minute interval that the form documents. When a worker changes activity, the
amount of time is rounded to the nearest quarter hour.
Name
Recording the name of each worker organizes the data collection and allows
someone who wasn’t present at the deconstruction site to follow an individual worker’s
activity through a day in order to get a mental picture of the deconstruction process.
Additionally, when the labor hours are reported, it is possible to break down the labor by
skill level and pay-rate. The name entry will be used to sort the data for this part of the
analysis.
84
Building
To begin with buildings 839, 840, and 841 were deconstructed. Each building was
basically identical, so it was important to write down which building was being worked
on. No one reading the data forms later would be able to infer the building number solely
by the description of what was taking place that day. In the event that work was being
done simultaneously on two or more buildings, it became difficult to always notice who
was working on which building, but at the same time it remained critical to be accurate in
assigning the correct building number to the entry for the analysis and comparison of
methods.
Room
On the back of each data collection clipboard, there was a small plan of each floor
of the building. Each room was numbered. To track the progression of work, a record
was kept of where each person was working. If the worker is inside the building, the
number of the room where they were working was recorded. Other designations included
roof, ext for exterior and site for work not occurring specifically on the building.
Location
This column was used to more specifically record where work was being done. If
the worker was on the roof, the slope he or she is on (north or south) was recorded. If the
worker was on the exterior, the side of the building was recorded (north, south, east, or
west). If the worker was inside, records were kept of which surface was being worked
on. Data was kept by using such designations as “F” for floor, “C” for ceiling, and N, S,
W, or E for wall surfaces.
85
Activity
This column was used to identify what type of work was being done. While the
activity categories were simplified as much as possible, they still encompass the variety
of tasks that will occur during the project. An attempt was made to explain the range of
tasks that can fall under each category. In completing this column the data collector
needed to exercise careful observation and good judgment in order to understand what
each worker was doing and into which category that activity fell. If the collector was not
sure what someone was doing, he was to obtain clarification from the worker. If the
collector was not sure which category to use, a supervisor was to be consulted.
HDec (hand deconstruction)
This category includes all work associated with removing materials that had
potential for processing and salvage from the building using hand labor. It includes
the use of hammers, crowbars, or hand-held power tools such as circular saws or
sawzalls. It would also include the use of a man-lift, forklift, or crane provided that
this equipment is being used to transport workers or individual pieces of building
materials. The key to differentiating between “Hand” and “Mechanically-Assisted”
work is that hand methods are directed towards removing the materials piece-by-
piece from the building and mechanically-assisted methods are directed towards
removing large sections or assemblies from the building with separation into
individual pieces occurring later.
HDem (hand demolition)
This category includes all work associated with removing materials from the
building by hand for disposal. It includes the use of hammers, crowbars, or hand-
held power tools such as circular saws or sawzalls. The key to differentiating
86
between deconstruction and demolition is that with deconstruction the materials are
handled with a level of care sufficient to preserve their condition and suitability for
reuse. Demolition will generally be faster and less gentle than deconstruction.
This project is primarily directed towards research into the methods, labor, and
costs involved in deconstruction. Actual salvage of building materials is a
secondary benefit. Also, the amount of actual salvage will be limited by the
widespread use of lead-based paint on the wooden building materials, making them
unsuitable for reuse. In the case of most of the smaller pieces of dimensional
lumber, stripping the lead-based paint is simply not cost effective or
environmentally beneficial. For these reasons, many of the parts of the building
will be dismantled using deconstruction techniques in order to document the
process, while still eventually ending up in the dumpster. 2x4 small wall studs for
instance are typically salvageable. In this project, since they are painted they will
be disposed in a landfill. However, since the information on salvage time and costs
will be needed in the accurate planning of future projects, the wall studs were
deconstructed rather than demolished. Generally, meetings were held at the start of
each day, to discuss the planned activities for the day, what methods were used, and
which materials were being demolished or deconstructed. Any worker who was
unsure about any activity was told to ask for clarification immediately, because the
accurate distinction between how much time was spent on each building
deconstructing for theoretical salvage or demolishing for theoretical disposal was
critical.
87
MDec (mechanically assisted deconstruction)
This category includes all work associated with removing materials with
potential for processing and salvage from the building with mechanical assistance.
This includes both mechanical labor time and any hand labor time that is needed to
prepare for the mechanical work. For instance, on one of the buildings, the
deconstruction method involved removing large panels of the roof using a crane.
The time spent actually lifting the panels off by crane is MDec, and so is any time
spent bracing a panel by hand so that it will stay in one piece while being lifted off,
cutting the panel free from surrounding materials, and attaching the lifting
mechanism.
MDem (mechanically assisted demolition)
This category includes work associated with removing materials from the
building with mechanical assistance for disposal.
N (non-productive)
Non-productive time includes all “on-the-clock” time that is not spent in any of
the other categories. Activities such as water breaks (though not lunch), discussing
what to do next, receiving instruction, tool and work station set-up at the beginning
of the day and break-down at the end, miscellaneous clean-up (though not disposal
of an individual material that has just been demolished – getting materials to the
roll-offs is part of demolition), building ramps or sawhorses, running caution tape,
and many other activities that do not directly contribute to the removal or
processing of the building materials are non-productive.
88
P (processing)
Processing includes all the work done to prepare the materials for reuse after
they have been removed from the building. This includes denailing, cleaning,
trimming, sorting, bundling, and loading for transport.
S (supervising)
Supervisory work is time spent by a job supervisor instructing, directing,
coordinating, etc.
Assembly
This column is used to record which part of the building is being worked on. When
the labor time is analyzed, this column will be used to describe how much effort is
needed to salvage each part of the building as well as the whole. For the purpose of data
collection, the buildings are divided into the following assemblies:
R (Roof)
2W (Second floor walls)
2F (Second floor).
1W (First floor walls)
1F (First floor)
Fnd (Foundation)
MEP (Mechanical, Electrical, and Plumbing systems)
Equipment
This column is used to record what tools were used for the work. To be sure, the
most critical tools to record are the tools that require energy to operate (electric saws or
drills, as well as heavy equipment such as cranes, manlifts, forklifts, bobcats, etc.). Some
workers will change hand tools often, switching between a crowbar and a flatbar as they
89
work. In these cases, it is more important to document that they are using a set of prying
tools, rather than exactly which one they use at any given time. The equipment
information is useful to provide an image of what was being done at any given time for
someone who was not present and to help calculate energy consumption for the life-cycle
analysis component of the project. Keeping these goals in mind will help simplify what
can become the most tedious section of data collection. Generally, it allows future
project decision makers to know what type of work was being done and to calculate how
long energy consuming equipment was being operated.
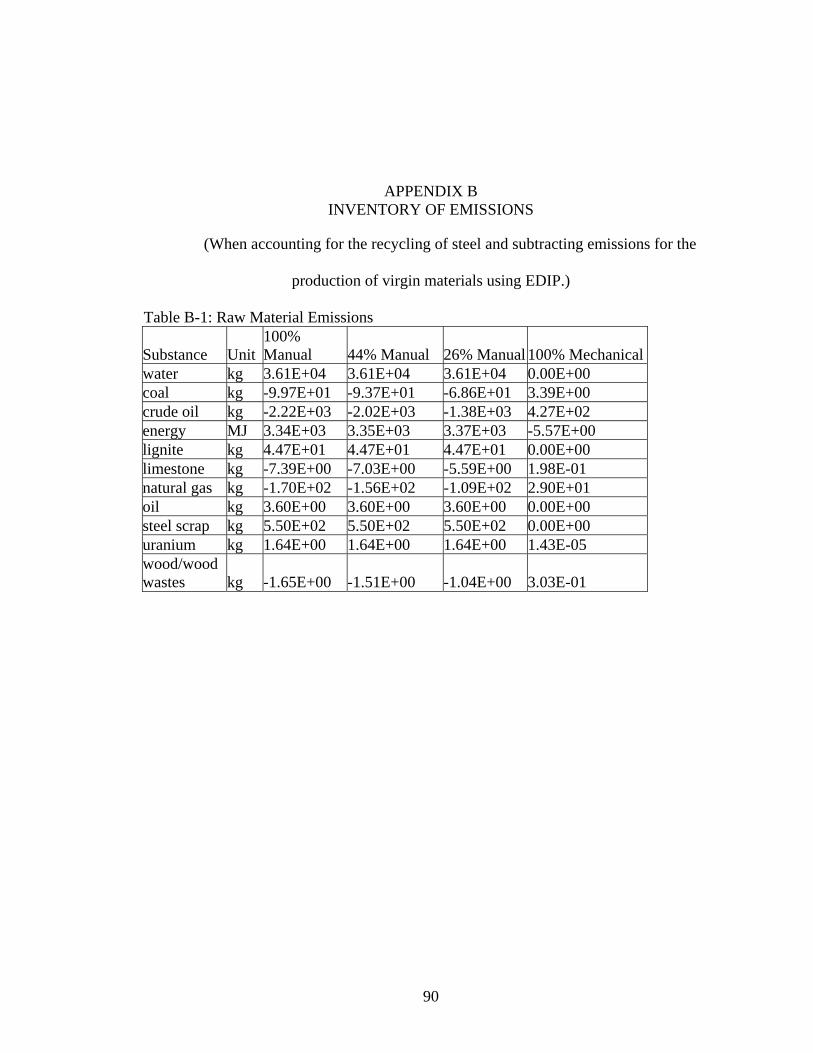
90
APPENDIX B INVENTORY OF EMISSIONS
(When accounting for the recycling of steel and subtracting emissions for the
production of virgin materials using EDIP.)
Table B-1: Raw Material Emissions
Substance Unit 100% Manual 44% Manual 26% Manual 100% Mechanical
water kg 3.61E+04 3.61E+04 3.61E+04 0.00E+00 coal kg -9.97E+01 -9.37E+01 -6.86E+01 3.39E+00 crude oil kg -2.22E+03 -2.02E+03 -1.38E+03 4.27E+02 energy MJ 3.34E+03 3.35E+03 3.37E+03 -5.57E+00 lignite kg 4.47E+01 4.47E+01 4.47E+01 0.00E+00 limestone kg -7.39E+00 -7.03E+00 -5.59E+00 1.98E-01 natural gas kg -1.70E+02 -1.56E+02 -1.09E+02 2.90E+01 oil kg 3.60E+00 3.60E+00 3.60E+00 0.00E+00 steel scrap kg 5.50E+02 5.50E+02 5.50E+02 0.00E+00 uranium kg 1.64E+00 1.64E+00 1.64E+00 1.43E-05 wood/wood wastes kg -1.65E+00 -1.51E+00 -1.04E+00 3.03E-01
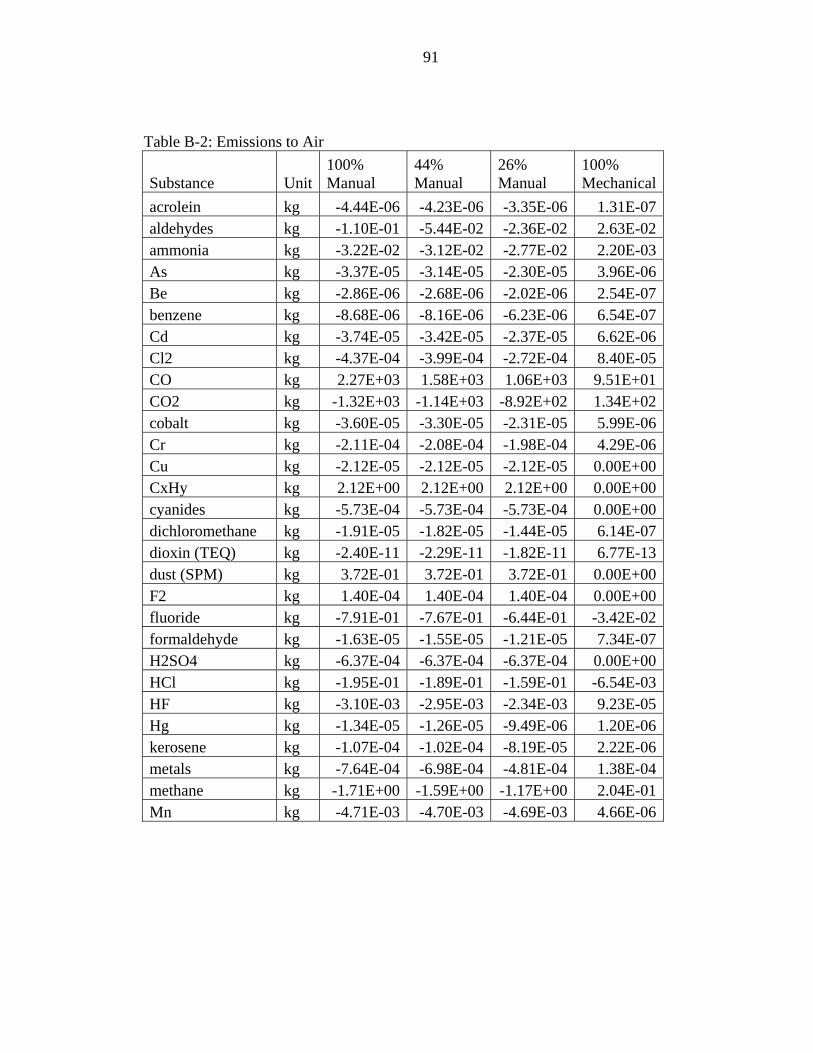
91
Table B-2: Emissions to Air
Substance Unit 100% Manual
44% Manual
26% Manual
100% Mechanical
acrolein kg -4.44E-06 -4.23E-06 -3.35E-06 1.31E-07aldehydes kg -1.10E-01 -5.44E-02 -2.36E-02 2.63E-02ammonia kg -3.22E-02 -3.12E-02 -2.77E-02 2.20E-03As kg -3.37E-05 -3.14E-05 -2.30E-05 3.96E-06Be kg -2.86E-06 -2.68E-06 -2.02E-06 2.54E-07benzene kg -8.68E-06 -8.16E-06 -6.23E-06 6.54E-07Cd kg -3.74E-05 -3.42E-05 -2.37E-05 6.62E-06Cl2 kg -4.37E-04 -3.99E-04 -2.72E-04 8.40E-05CO kg 2.27E+03 1.58E+03 1.06E+03 9.51E+01CO2 kg -1.32E+03 -1.14E+03 -8.92E+02 1.34E+02cobalt kg -3.60E-05 -3.30E-05 -2.31E-05 5.99E-06Cr kg -2.11E-04 -2.08E-04 -1.98E-04 4.29E-06Cu kg -2.12E-05 -2.12E-05 -2.12E-05 0.00E+00CxHy kg 2.12E+00 2.12E+00 2.12E+00 0.00E+00cyanides kg -5.73E-04 -5.73E-04 -5.73E-04 0.00E+00dichloromethane kg -1.91E-05 -1.82E-05 -1.44E-05 6.14E-07dioxin (TEQ) kg -2.40E-11 -2.29E-11 -1.82E-11 6.77E-13dust (SPM) kg 3.72E-01 3.72E-01 3.72E-01 0.00E+00F2 kg 1.40E-04 1.40E-04 1.40E-04 0.00E+00fluoride kg -7.91E-01 -7.67E-01 -6.44E-01 -3.42E-02formaldehyde kg -1.63E-05 -1.55E-05 -1.21E-05 7.34E-07H2SO4 kg -6.37E-04 -6.37E-04 -6.37E-04 0.00E+00HCl kg -1.95E-01 -1.89E-01 -1.59E-01 -6.54E-03HF kg -3.10E-03 -2.95E-03 -2.34E-03 9.23E-05Hg kg -1.34E-05 -1.26E-05 -9.49E-06 1.20E-06kerosene kg -1.07E-04 -1.02E-04 -8.19E-05 2.22E-06metals kg -7.64E-04 -6.98E-04 -4.81E-04 1.38E-04methane kg -1.71E+00 -1.59E+00 -1.17E+00 2.04E-01Mn kg -4.71E-03 -4.70E-03 -4.69E-03 4.66E-06
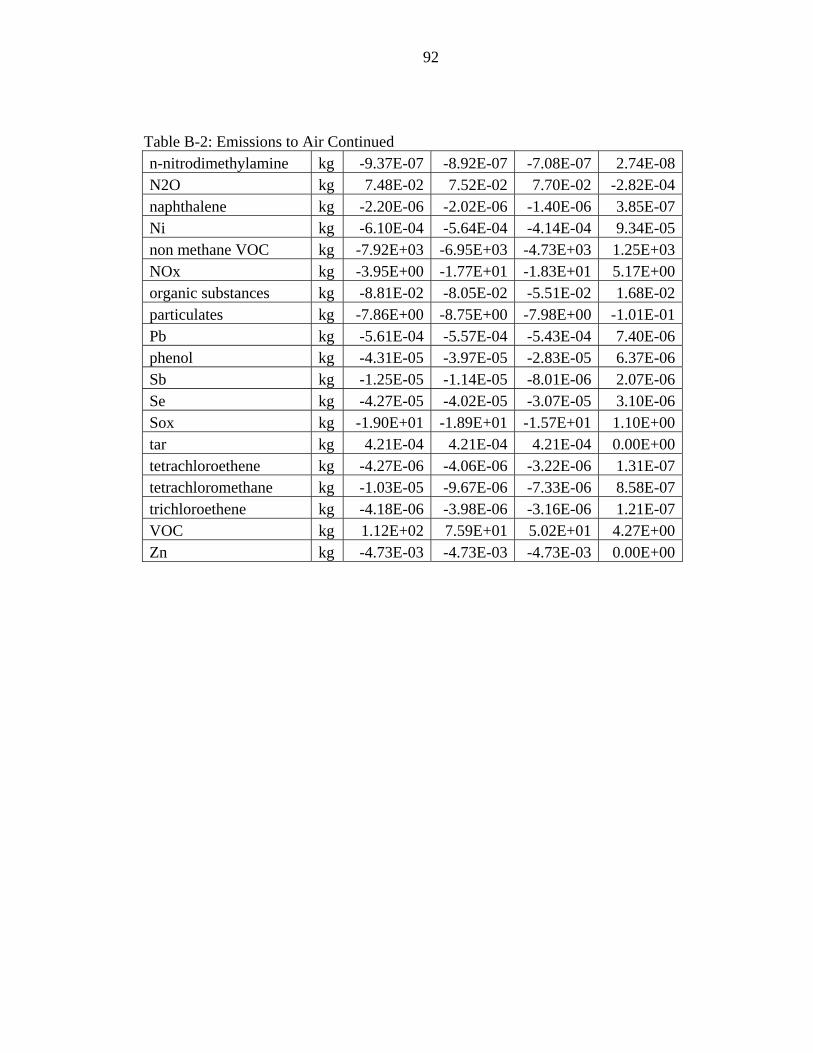
92
Table B-2: Emissions to Air Continued n-nitrodimethylamine kg -9.37E-07 -8.92E-07 -7.08E-07 2.74E-08N2O kg 7.48E-02 7.52E-02 7.70E-02 -2.82E-04naphthalene kg -2.20E-06 -2.02E-06 -1.40E-06 3.85E-07Ni kg -6.10E-04 -5.64E-04 -4.14E-04 9.34E-05non methane VOC kg -7.92E+03 -6.95E+03 -4.73E+03 1.25E+03NOx kg -3.95E+00 -1.77E+01 -1.83E+01 5.17E+00organic substances kg -8.81E-02 -8.05E-02 -5.51E-02 1.68E-02particulates kg -7.86E+00 -8.75E+00 -7.98E+00 -1.01E-01Pb kg -5.61E-04 -5.57E-04 -5.43E-04 7.40E-06phenol kg -4.31E-05 -3.97E-05 -2.83E-05 6.37E-06Sb kg -1.25E-05 -1.14E-05 -8.01E-06 2.07E-06Se kg -4.27E-05 -4.02E-05 -3.07E-05 3.10E-06Sox kg -1.90E+01 -1.89E+01 -1.57E+01 1.10E+00tar kg 4.21E-04 4.21E-04 4.21E-04 0.00E+00tetrachloroethene kg -4.27E-06 -4.06E-06 -3.22E-06 1.31E-07tetrachloromethane kg -1.03E-05 -9.67E-06 -7.33E-06 8.58E-07trichloroethene kg -4.18E-06 -3.98E-06 -3.16E-06 1.21E-07VOC kg 1.12E+02 7.59E+01 5.02E+01 4.27E+00Zn kg -4.73E-03 -4.73E-03 -4.73E-03 0.00E+00

93
Table B-3: Emissions to Water
Substance Unit 100% Manual
44% Manual
26% Manual
100% Mechanical
Acid as H+ kg -2.46E-06 -2.24E-06 -1.53E-06 4.70E-07 As kg 4.15E-05 4.79E-05 8.03E-05 2.44E-04 B kg -1.64E-02 -1.54E-02 -1.18E-02 1.21E-03 BOD kg -3.86E-02 -3.52E-02 -2.41E-02 7.24E-03 calcium ions kg 1.06E-01 1.23E-01 2.06E-01 6.25E-01 Cd kg -4.17E-04 -3.82E-04 -2.66E-04 7.12E-05 chromate kg -3.06E-05 -2.80E-05 -1.94E-05 5.40E-06 Cl- kg -3.70E-01 -3.30E-01 -1.84E-01 3.11E-01 COD kg -2.65E-01 -2.42E-01 -1.67E-01 4.82E-02 Cr kg -4.02E-04 -3.63E-04 -2.26E-04 2.36E-04 crude oil kg 9.36E-05 9.36E-05 9.36E-05 0.00E+00 Cu kg 1.94E-05 2.42E-05 4.87E-05 1.84E-04 cyanide kg -1.27E-04 -1.26E-04 -1.26E-04 1.04E-07 dissolved solids kg -1.10E+01 -1.00E+01 -6.98E+00 1.91E+00 dissolved substances kg 4.27E-01 4.27E-01 4.27E-01 0.00E+00 F2 kg 9.89E-03 9.89E-03 9.89E-03 0.00E+00 Fe kg 2.91E-02 2.99E-02 3.34E-02 5.37E-04 fluoride ions kg -4.32E-04 -4.12E-04 -3.29E-04 9.46E-06 H2SO4 kg -4.07E-03 -3.83E-03 -2.93E-03 2.97E-04 HCl kg 9.36E-01 9.36E-01 9.36E-01 0.00E+00 Hg kg -3.15E-08 -2.89E-08 -2.01E-08 5.36E-09 K kg 1.00E-01 1.16E-01 1.94E-01 5.90E-01 metallic ions kg -5.28E-02 -4.81E-02 -3.28E-02 1.01E-02 Mg kg 2.04E-02 2.35E-02 3.94E-02 1.20E-01 Mn kg -1.01E-02 -9.56E-03 -7.31E-03 3.01E-03 Na kg 4.69E-02 5.41E-02 9.08E-02 2.76E-01 NH3 kg -3.99E-03 -3.63E-03 -2.42E-03 7.78E-04 Ni kg -3.59E-05 -3.59E-05 -3.59E-05 0.00E+00 nitrate kg 1.49E-02 1.72E-02 2.87E-02 8.69E-02 oil kg -2.51E-01 -2.29E-01 -1.59E-01 4.47E-02 other organics kg -2.87E-02 -2.64E-02 -1.86E-02 4.59E-03 Pb kg -5.83E-05 -5.79E-05 -5.67E-05 8.40E-07 phenol kg -1.70E-04 -1.55E-04 -1.06E-04 3.25E-05 phosphate kg -2.05E-03 -1.93E-03 -1.47E-03 1.51E-04 sulphate kg -3.53E-01 -3.22E-01 -2.13E-01 1.45E-01 sulphide kg 4.07E-04 4.70E-04 7.88E-04 2.39E-03 suspended solids kg -3.82E-01 -3.58E-01 -2.67E-01 3.77E-02 suspended substances kg 1.41E-01 1.41E-01 1.41E-01 0.00E+00 TOC kg 1.13E+00 3.10E+00 2.70E+00 0.00E+00 Zn kg -7.00E-04 -6.82E-04 -6.25E-04 3.58E-05
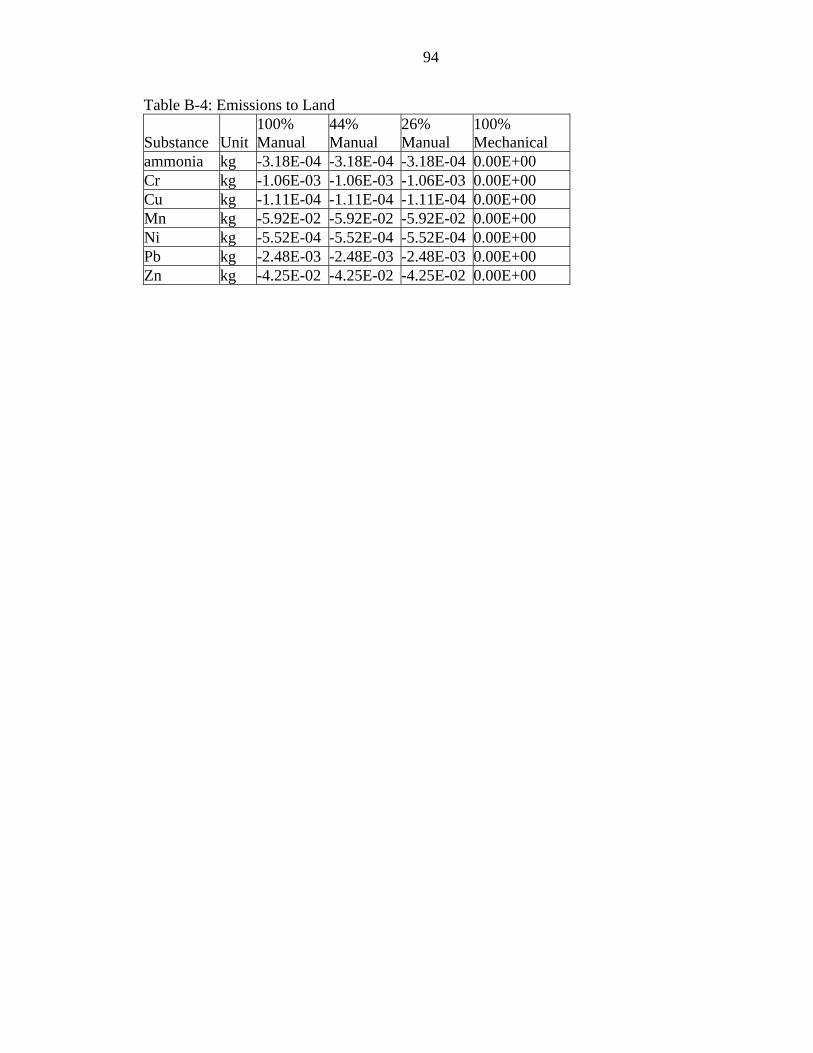
94
Table B-4: Emissions to Land
Substance Unit 100% Manual
44% Manual
26% Manual
100% Mechanical
ammonia kg -3.18E-04 -3.18E-04 -3.18E-04 0.00E+00 Cr kg -1.06E-03 -1.06E-03 -1.06E-03 0.00E+00 Cu kg -1.11E-04 -1.11E-04 -1.11E-04 0.00E+00 Mn kg -5.92E-02 -5.92E-02 -5.92E-02 0.00E+00 Ni kg -5.52E-04 -5.52E-04 -5.52E-04 0.00E+00 Pb kg -2.48E-03 -2.48E-03 -2.48E-03 0.00E+00 Zn kg -4.25E-02 -4.25E-02 -4.25E-02 0.00E+00
95
LIST OF REFERENCES
Adams, DM. (2002). “Solid Wood Products: Rising consumption and imports, modest price growth.” Journal of Forestry, 100(2),14-19.
Block, D. (1998). “Deconstructing Buildings at Former Army Base.” BioCycle, 39(11), 46-49.
Centrum Voor Milieukunde Leiden (CML). (2001). “Part 3: Scientific Background. In: Guinée et al., eds., Life Cycle Assessment: An Operational Guide to the ISO Standards, A Report for the Ministries of Housing, Spatial Planning and the Environment, Economic Affairs, Transport, Public Works and Water Management, Agriculture, Nature Management and Fisheries, CML, Leiden University, The Netherlands.” <www.leidenuniv.nl.interfac/cml/ssp/projects/lca2/lca2.html> (October 4, 2004).
Consortium for Research on Renewable Industrial Materials CORRIM (2004). “Understanding the Value of Wood,” <http://www.corrim.org/.> (January 17, 2005).
Demographia Smart Growth and Urban Containment: Misguided Urban Policy. (2005). <http://www.demographia.com/db-smgmisguide.pdf.> (March 6, 2005).
Dolan, P., Lampo, R. and Dearborn, J. (1999). “Concepts for Reuse and Recycling of Construction and Demolition Waste.” USACERL Technical Report, 99/58.
Environmental Protection Agency AP 42. (1986). “Iron and Steel Production.” <http://www.epa.gov/ttn/chief/ap42/ch12/final/c12s05.pdf.> (January 10, 2003).
Environmental Protection Agency AP 42. (1995). “Transportation and Marketing of Petroleum Liquids.” <http://www.epa.gov/ttn/chief/ap42/ch05/final/c05s02.pdf.> (January 8, 2003).
Environmental Protection Agency AP 42. (1997). “Brick and Structural Clay Product Manufacturing.” <http://www.epa.gov/ttn/chief/ap42/ch11/final/c11s03.pdf.> (January 2, 2003).
Falk, R. (2002). “Wood-Framed Building Deconstruction: A Source of Lumber for Construction?” Forest Products Journal, 52(3), 8-15.
96
Falk, R. and Lantz, S. (1996). “Feasibility of Recycling Timber from Military Industrial Buildings.” Proceedings for Use of Recycled Wood and Paper in Building Applications, Madison, WS. Sponsored by the USDA and the Forest Products Society.
Falk, R., Devisser, D., Cook, S. and Stansbury, D. (1999). “Effect of Damage on the Grade Yield of Recycled Lumber.” Forest Products Journal, 49(7/8), 71-79.
Falk, R. and Green, D. (1999). “Stress Grading of Recycled Lumber and Timber.” In: 1999 Structures Congress: Structural Engineering In The 21 Century; 1999 April 18-21; New Orleans, LA. Reston, VA: Sponsored by the American Society of Civil Engineers. 650-653.
Falk, R., Green, D., Rammer, D. and Lantz, S. (2000). “Engineering Evaluation of 55-Year-Old Timber Columns Recycled from an Industrial Military Building.” Forest Products Journal, 50(4), 71-76.
Florida Administrative Code 62-701.200. (2003). <http://fac.dos.state.fl.us/.> (August 1, 2003).
Fort McClellan Pelham Range. (2005). Global Security.org. <http://www.globalsecurity.org/military/facility/fort-mcclellan.htm.> (April 22, 2005).
Franklin Associates. (1998). “Characterization of Building-related Construction and Demolition Debris in the United States.” Report No. EPA 530-R-98-010. Prarie Village, KS.
Goedkoop, M., Hoffstetter, P., Muller-Wenk, R. and Spriensma, R. (1998). “The Eco-indicator 98 – Explained.” International Journal of LCA, 3, 352-260.
Goedkoop, M.J. and Spriensma, R. (1999). “The Eco-indicator 99 a Damage Oriented Approach for LCIA.” Ministry VROM, The Hague, Amersfoot, The Netherlands: PRé Consultants.
Goedkoop, M., Oele, M. and Effting, S., (2003). “PRe Consultants, SIMAPRO 5.1, Database Manual.” Amersfoot, The Netherlands: PRé Consultants.
Green, D., Falk, R. and Lantz, S. (1999). “Evaluation of Lumber Recycled from an Industrial Military Building.” Forest Products Journal, 49(5), 49-55.
Guinee, J. and Heijungs, R. (1993). “A Proposal For The Classification Of Toxic Substances Within The Frame Work Of Life Cycle Assessment Of Products.” Centre of Environmental Science, Leiden University. Chemosphere, 26, 1925-1944.
97
Guinée, J.B., ed., M. Gorrée, R. Heijungs, G. Huppes, R. Kleijn, A. de Koning, L. van Oers, A.W. Sleeswijk, S. Suh, H.A. Udo de Haes, H. de Bruijn, R. van Duin, M.A.J. Huijbregts, E. Lindeijer, A.A.H. Roorda, B.L. van der Ven and B.P. Weidema. (2002). Handbook on Life Cycle Assessment: Operational Guide to the ISO Standards. Dordrecht, The Netherlands: Kluwer Academic Publishers.
Guy, B. (2001). “How Cost Effective Is Deconstruction?” (Statistical Data Included). BioCycle. 42(7), 75.
Guy, B. and Williams, T., (2004). “Pollution Prevention through the Optimization of Building Deconstruction for DoD Facilities: Ft. McClellan Deconstruction Project.” Final Report for the Department of Defense Regional P2 Program Region 4, administered by the University of South Carolina. Columbia, South Carolina.
ICF Incorporated. (1995). “Construction and Demolition Waste Landfills.” Contract No. 68-W3-0008. <http://www.epa.gov/epaoswer/hazwaste/sqg/const/cdrpt.pdf.> (July 25, 2003).
Jambeck, J., Townsend, T. and Solo-Gabriele, H. (2004). “Leachate Quality from Simulated Landfills Containing CCA-Treated Wood.” Environmental Impact of Preservative-Treated Wood Conference, The Florida Interdisciplinary Center for Environmentally Sound Solutions (FICESS). Orlando, FL. February 8-11.
Khattak, A., Amerlynck, V. and Quercia, R., (2005). “Are Traveling Times And Distances To Work Greater For Residents Of Poor Urban Neighborhoods?” <http://www.unc.edu/~khattak/wktt.html.> (November 10th, 2005).
Lippiatt, B. (1998). “Balancing Environmental and Economic Sustainability.” The Construction Specifier. April 1998. 35-42.
Mcphee, M. (2002). “Latest Trends in Deconstruction: Interview with a Pioneer.” BioCycle, 28-32.
Murray, C. and Lopez, A., (1996). “The Global Burden of Disease.” WHO, World Bank, and Harvard School of Public Health, Boston, MA, USA
National Association Of Home Builders (NAHB) Research Center. Materials Salvaged Through Deconstruction. (2003). “Case Study: Riverdale Village Apartments.” <http://www.epa.gov/epaoswer/non-hw/debris/pubs/decon_br.pdf.> (September 15, 2005).
Rammer, Douglas R. (1999). “Evaluation of Recycled Timber Members In: Bank, Lawrence C., ed. Materials and construction--Exploring the connection. Proceedings, 5th ASCE materials engineering congress; 1999 May 10-12; Cincinnati, OH. Reston, VA:” Sponsored by the American Society of Civil Engineers, 46-51.

98
Sivaraman, D. and Lindner, A. (2004). “A Comparative Life Cycle Analysis of Gasoline-, Battery-, and Electricity Powered Lawn Mowers.” Environmental Engineering Science, 21(6), 768-785.
99
BIOGRAPHICAL SKETCH
Elizabeth O’Brien received her Bachelor of Science in environmental engineering
from the University of Florida in 2003 and her Master of Engineering in environmental
engineering sciences from the University of Florida in 2006. Ms. O’Brien is currently
working at BCI Engineers and Scientists in Minneola, Florida, designing stormwater
treatment systems. From January 2004 – August 2004 she worked with Jones, Edmunds
and Associates as a consultant to the St. Johns River Water Management District on the
Lake Apopka Clean Up Project. This project uses a constructed wetland to decrease the
phosphorus levels in Lake Apopka.


