
Linear refractive index and absorptionmeasurements of nonlinear optical
liquids in the visible and near-infraredspectral region
S. Kedenburg, M. Vieweg, T. Gissibl, and H. Giessen*
4th Physics Institute and Research Center SCOPE, University of Stuttgart,70550 Stuttgart, Germany
Abstract: Liquid-filled photonic crystal fibers and optofluidic devicesrequire infiltration with a variety of liquids whose linear optical propertiesare still not well known over a broad spectral range, particularly in the nearinfrared. Hence, dispersion and absorption properties in the visible andnear-infrared wavelength region have been determined for distilled water,heavy water, chloroform, carbon tetrachloride, toluene, ethanol, carbondisulfide, and nitrobenzene at a temperature of 20 °C. For the refractiveindex measurement a standard Abbe refractometer in combination with awhite light laser and a technique to calculate correction terms to compensatefor the dispersion of the glass prism has been used. New refractive indexdata and derived dispersion formulas between a wavelength of 500 nm and1600 nm are presented in good agreement with sparsely existing referencedata in this wavelength range. The absorption coefficient has been deducedfrom the difference of the losses of several identically prepared liquid filledglass cells or tubes of different lengths. We present absorption data in thewavelength region between 500 nm and 1750 nm.
© 2012 Optical Society of America
OCIS codes:(160.4330) Nonlinear optical materials; (260.2030) Dispersion; (300.1030) Ab-sorption.
References and links1. D. Psaltis, S. R. Quake, and C. Yang, “Developing optofluidic technology through the fusion of microfluidics and
optics,” Nature (London)442,381–386 (2006).2. C. Monat, P. Domachuk, and B. J. Eggleton, “Integrated optofluidics: A new river of light,” Nat. Photonics1,
106–114 (2007).3. R. Zhang, J. Teipel, and H. Giessen, “Theoretical design of a liquid-core photonic crystal fiber for supercontin-
uum generation,” Opt. Express14,6800–6812 (2006).4. M. Vieweg, T. Gissibl, S. Pricking, B. T. Kuhlmey, D. C. Wu, B. J. Eggleton, and H. Giessen, “Ultrafast nonlinear
optofluidics in selectively liquid-filled photonic crystal fibers,” Opt. Express18,25232–25240 (2010).5. J. Bethge, A. Husakou, F. Mitschke, F. Noack, U. Griebner, G. Steinmeyer, and J. Herrmann, “Two-octave super-
continuum generation in a water-filled photonic crystal fiber,” Opt. Express18,6230–6240 (2010).6. S. Pricking and H. Giessen, “Generalized retarded response of nonlinear media and its influence on soliton
dynamics,” Opt. Express19,2895–2903 (2011).7. K. Kieu, L. Schneebeli, R. A. Norwood, and N. Peyghambarian, “Integrated liquid-core optical fibers for ultra-
efficient nonlinear liquid photonics,” Opt. Express20,8148–8154 (2012).8. M. Vieweg, S. Pricking, T. Gissibl, Y. V. Kartashov, L. Torner, and H. Giessen, “Tunable ultrafast nonlinear
optofluidic coupler,” Opt. Lett.37,1058–1060 (2012).
#170502 - $15.00 USD Received 12 Jun 2012; revised 26 Sep 2012; accepted 2 Oct 2012; published 15 Oct 2012(C) 2012 OSA 1 November 2012 / Vol. 2, No. 11 / OPTICAL MATERIALS EXPRESS 1588

9. S. Pricking, M. Vieweg, and H. Giessen, “Influence of the retarded response on an ultrafast nonlinear optofluidicfibercoupler,” Opt. Express19,21673–21679 (2011).
10. K. Kieu, L. Schneebeli, E. Merzlyak, J. M. Hales, A. DeSimone, J. W. Perry, R. A. Norwood, and N. Peygham-barian, “All-optical switching based on inverse Raman scattering in liquid-core optical fibers,” Opt. Lett.37,942–944 (2012).
11. M. Vieweg, T. Gissibl, Y. V. Kartashov, L. Torner, and H. Giessen, “Spatial solitons in optofluidic waveguidearrays with focusing ultrafast Kerr nonlinearity,” Opt. Lett.37,2454–2456 (2012).
12. W. Gao, D. Sun, Y. F. Bi, J. Y. Li, and Y. L. Wang, “Stimulated Brillouin scattering with high reflectivity andfidelity in liquid-core optical fibers,” Appl. Phys. B: Lasers Opt.107,355–359 (2012).
13. M. C. P. Huy, A. Baron, S. Lebrun, R. Frey, and P. Delaye, “Characterization of self-phase modulation in liquidfilled hollow core photonic bandgap fibers,” J. Opt. Soc. Am. B27,1886–1893 (2010).
14. R. Zhang, J. Teipel, X. Zhang, D. Nau, and H. Giessen, “Group velocity dispersion of tapered fibers immersed indifferent liquids,” Opt. Express12,1700–1707 (2004).
15. A. Samoc, “Dispersion of refractive properties of solvents: Chloroform, toluene, benzene, and carbon disulfidein ultraviolet, visible, and near-infrared,” J. Appl. Phys.94,6167–6174 (2003).
16. J. Rheims, J. Koser, and T. Wriedt, “Refractive-index measurements in the near-IR using an Abbe refractometer,”Meas. Sci. Technol.8, 601–605 (1997).
17. K. C. Kao and T. W. Davies, “Spectrophotometric studies of ultra low loss optical glasses 1: single beam method,”J. Phys. E: Sci. Instrum.1, 1063–1068 (1968).
18. M. Daimon and A. Masumura, “Measurement of the refractive index of distilled water from the near-infraredregion to the ultraviolet region,” Appl. Opt.46,3811–3820 (2007).
19. J. Curcio and C. Petty, “The near infrared absorption spectrum of liquid water,” J. Opt. Soc. Am.41, 302–304(1951).
20. R. M. Pope and E. S. Fry, “Absorption spectrum (380-700 nm) of pure water: II. Integrating cavity measure-ments,” Appl. Opt.36,8710–8723 (1997).
21. D. N. Nikogosyan, “Chapter 8: Liquids,” inProperties of Optical and Laser-Related Materials: A Handbook,(John Wiley & Sons, Chichester, 1997), pp. 400–495.
22. M. J. Weber, “Section 5: Liquids,” inHandbook of Optical Materials,(CRC Press LLC, Boca Raton, 2003), pp.373–393.
23. Carl Zeiss AG, Correction tables for the Abbe rfractometer model A with serial number 7, Oberkochen, Germany.24. Carl Zeiss AG, Engineering drawing for the measuring prism 7, Oberkochen, Germany.25. Schott AG, Refractive index of SF 13, Mainz, Germany.26. B. Metzger, A. Steinmann, F. Hoos, S. Pricking, and H. Giessen, “Compact laser source for high-power white-
light and widely tunable sub 65 fs laser pulses,” Opt. Lett.35,3961–3963 (2010).27. Thorlabs, Bandpass filter,http://www.thorlabs.de/navigation.cfm?Guide_ID=2210.
1. Introduction
Liquids offer striking possibilities for the field of optics. New optical devices have been devel-oped which opened a new field: optofluidics, which combines liquids and photonics [1,2]. Thisfield has encountered an increased amount of interest in the recent past due to novel flexibleconcepts.
Liquids are especially suited for generating supercontinua due to their relatively high nonlin-ear refractive indexn2 with respect to solids. Examples for applications are include selectivelyliquid-filled photonic crystal fibers [3–6], and liquid-core optical fibers [7] whose dispersionproperties can be tailored accordingly for the formation of a supercontinuum. Liquid-filledpatterns in such fibers allow for the realization of directional couplers [8,9], all-optical switch-ing [10] as well as discrete optofluidic spatial solitons in waveguide arrays [11]. Furthermore,characteristics of stimulated Brillouin scattering [12] and self-phase modulation [13] can bestudied. Also pulse propagation in tapered fibers immersed in liquids can be tailored [14].Moreover, the transparency in the visible and near-infrared range plays an important role forunobstructed propagation of light in these structures.
There is an increasing need for rapid and easy measurements of linear optical properties ofnonlinear liquids over a broad wavelength range. The knowledge of the linear refractive indexnand the absorption coefficientα are important to control the optical properties and to determinen2 [15].
Due to the fact that published papers [15–20] and reference books [21, 22] currently cannot
#170502 - $15.00 USD Received 12 Jun 2012; revised 26 Sep 2012; accepted 2 Oct 2012; published 15 Oct 2012(C) 2012 OSA 1 November 2012 / Vol. 2, No. 11 / OPTICAL MATERIALS EXPRESS 1589

cover a broad wavelength range in the visible and near-infrared and some data even seem tonot exist in published form, we take measurements in regions which have previously not beeninvestigated to our knowledge.
In this paper precise constants for Cauchy and Sellmeier dispersion equations of linear re-fractive indices at a temperature of 20 °C are derived from measurement data between a wave-length of 500 nm and 1600 nm for the following eight liquids: distilled water (H2O), heavy wa-ter (D2O), chloroform (CHCl3), carbon tetrachloride (CCl4), toluene (C7H8), ethanol (C2H6O),carbon disulfide (CS2), and nitrobenzene (C6H5NO2). A measurement method which is basedon an extension of a standard Abbe refractometer is used to determinen(λ ) [16]. The requiredcorrection terms for the application in the near-infrared and the experimental realization aredescribed in detail.
Furthermore, the absorption coefficientα as a function of wavelength is given between500 nm and 1750 nm for distilled water, heavy water, chloroform, toluene, ethanol, and car-bon tetrachloride (up to a wavelength of 1500 nm). For the measurement ofα thin glass cellsor long tubes filled with the liquids have been used, depending on the magnitude of absorp-tion. Accurate alignments of the samples were required becauseα has been calculated fromthe difference of the losses of several equally prepared specimens of different lengths [17]. Thedescription of the utilized methods and the experimental setups are also presented in this paper.
The structure of the paper is as follows: First the measurement techniques and the experimen-tal setups for the determination of the linear refractive index and the absorption coefficients aredescribed. Second, in Section 3, the measurement results are presented, starting with the refrac-tive index values and dispersion curves, followed by the absorption spectra of the investigatedliquids. The absorption coefficient values are given in the supplement as comma-separated valuetext files.
2. Measurement techniques
2.1. Refractive index
2.1.1. Abbe refractometer
An easy and precise method to measure the linear refractive indexn in the visible spectralrange is provided by an Abbe refractometer. Commonly, such instruments are designed for theuse at the wavelength of the sodium D line (589.3 nm). Correction tables enable the use of therefractometer in the complete spectral range covered by the listed values therein. A differentdescription is given in the paper of J. Rheims et al. [16] which allows determination of therefractive index over a wider wavelength regime. However, since the refractometer is an opticalmeasurement device which is read out by naked eye, the wavelength region is still limited tothe visible. Only by using infrared-cameras as replacement for the human eye, the method canbe extended to the infrared-region.
Regardless of the wavelength, the general working principle is based on the dependenceof the angle of total reflection from the refractive index of the investigated liquid. The Abberefractometer is composed of two orthogonal prisms as shown in Fig. 1.
To apply the principle of total reflection the refractive index of the investigated liquidnliq
has to be smaller than the refractive index of the measuring prismnpr. The specimen is placedbetween the two prisms and the incoming light is transmitted only in an angular range belowthe angle of total reflectionαT , generating a sharp separation line between the bright and thedark range. This image can be observed with the eyepiece of the refractometer. Matching theseparation line with the point of intersection of a reticle allows for readout of the measuredrefractive indexn′liq from a scale.
However, the measured refractive indexn′liq only corresponds to the actual refractive index
#170502 - $15.00 USD Received 12 Jun 2012; revised 26 Sep 2012; accepted 2 Oct 2012; published 15 Oct 2012(C) 2012 OSA 1 November 2012 / Vol. 2, No. 11 / OPTICAL MATERIALS EXPRESS 1590

b aT
f
illumination prism
measuring prism withrefractive index npr investigated liquid with
refractive index nliq
bright-darkseparation line
image
aT
Fig. 1. Beam path in the Abbe refractometer: in transmission mode (solid line) the incominglight passes the illumination prism and is scattered in all directions at the rough surface.However, the light is only transmitted into the measuring prism if the incident angle isbelow the angle of total reflectionαT . The image displays a sharp separation between thebright and dark range. The image is observed with a telescope and the point of intersectionof the reticle has to be adjusted to this separation line. One can then read the measuredrefractive indexn′liq from a scale of the refractometer; in reflection mode (dotted line)the measuring prism is directly illuminated and the incoming light is only reflected in theangular range above the angle of total reflection. Hence, the bright and the dark range areinterchanged which does not affect the deflection angleβ which has a fixed geometricalrelationship to the measured refractive index (see Eq. (5)).φ is the prism apex angle whichis 63 °in our case.
nliq of the liquid at the sodium D line atλD = 589.3 nm because of the used calibration from themanufacturer Carl Zeiss. To deduce the refractive indexnliq also at other wavelengths one hasto apply a correction term∆nliq to n′liq to compensate for the dispersion of the glass prism. Cor-rection tables are offered by the manufacturer of the refractometer where∆nliq depends on theillumination wavelength, the measured refractive index, and the used glass prism. However, thecorrection data are only provided in the visible spectral range between 400 nm and 680 nm [23].
To extend the application range of the refractometer one has to establish a relationship be-tween the deflection angleβ and the displayed refractive indexn′liq from the scale of the refrac-tometer. This geometrical relationship has to be determined only once because it is not affectedby changing the illumination wavelength [16].
2.1.2. Correction terms
The refractive index of a liquid is given by Snellius’ law as
nliq = npr sinαT . (1)
By geometrical thoughts and trigonometrical identities (see Fig. 1) and the fact that the changein the refractive index with temperature is negligible for the glass prism [16] one obtains
nliq(λ ,T) = sinφ√
n2pr(λ )−sin2 β (λ ,T)−cosφ sinβ (λ ,T). (2)
Thus, the refractive index of the liquid for a certain wavelength and temperature is a functionof the deflection angleβ , the refractive indexnpr, and the apex angleφ of the glass prism.
In order to obtain the actual refractive index of the liquidnliq , the measured refractive indexn′liq has to be corrected by the term∆nliq
nliq(λ ,T) = n′liq(λ ,T)+∆nliq(λ ,n′liq). (3)
#170502 - $15.00 USD Received 12 Jun 2012; revised 26 Sep 2012; accepted 2 Oct 2012; published 15 Oct 2012(C) 2012 OSA 1 November 2012 / Vol. 2, No. 11 / OPTICAL MATERIALS EXPRESS 1591

As the Abbe refractometer is calibrated with respect to the sodium D line,∆nliq(λD,n′liq) be-comes zero andnliq is equal ton′liq for this wavelength (see Eq. (3)). Replacingnliq by n′liq inEq. (2) one obtains the desired fixed relationship betweenn′liq andβ
n′liq(λD,T) = sinφ√
n2pr(λD)−sin2 β (λD,T)−cosφ sinβ (λD,T). (4)
Solving Eq. (4) forβ yields
sinβ (λ ,T) = sinφ√
n2pr(λD)−n′2liq(λ ,T)−n′liq(λ ,T)cosφ . (5)
Hence, by inserting Eq. (5) into Eq. (2) the expression for the actual refractive index reads
nliq(λ ,T,n′liq) = sinφ [n2pr(λ )− (sinφ
√
n2pr(λD)−n′2liq(λ ,T)− (6)
n′liq(λ ,T)cosφ)2]1/2−
cosφ(sinφ√
n2pr(λD)−n′2liq(λ ,T)−n′liq(λ ,T)cosφ).
This equation gives the actual refractive index at a certain wavelength in dependence of theprism dispersion, the prism apex angle, and the measured index valuen′liq .
In our experiment we use an Abbe refractometer Model A from Carl Zeiss with the serialnumber 7 and device number 64305. The apex angle of the glass prismφ is given in the engi-neering drawing as 63 ° in the present case [24]. The refractive index of the glass prism madefrom Schott SF13 glass is given from the glass manufacturer at different wavelengths [25]. AtλD = 589.3 nm the refractive index of the prism isnpr(λD) = 1.74054. Fornpr(λ ) the Cauchyformula in Eq. (7) is used:
npr = 1.70708+10943.47279
λ 2 +2.54416×10⁸
λ 4 +3.46802×10¹³
λ 6 −2.93242×10⁻⁹λ 2. (7)
The Cauchy formula together with the given refractive indices of SF13 are plotted in Fig. 2.
0.6 1.0 1.4 1.8 2.2
1.70
1.74
1.78
Wavelength ( m)μ
Re
fra
ctive
in
de
x n
pr
Data points [25]
Cauchy dispersion formula
Fig. 2. Dispersion of refractive index of the measuring prism made of SF13. The datapoints(diamonds) are listed in the datasheet from the glass manufacturer Schott [25]. Thecalculated Cauchy dispersion formula (blue line) is given in Eq. (7).
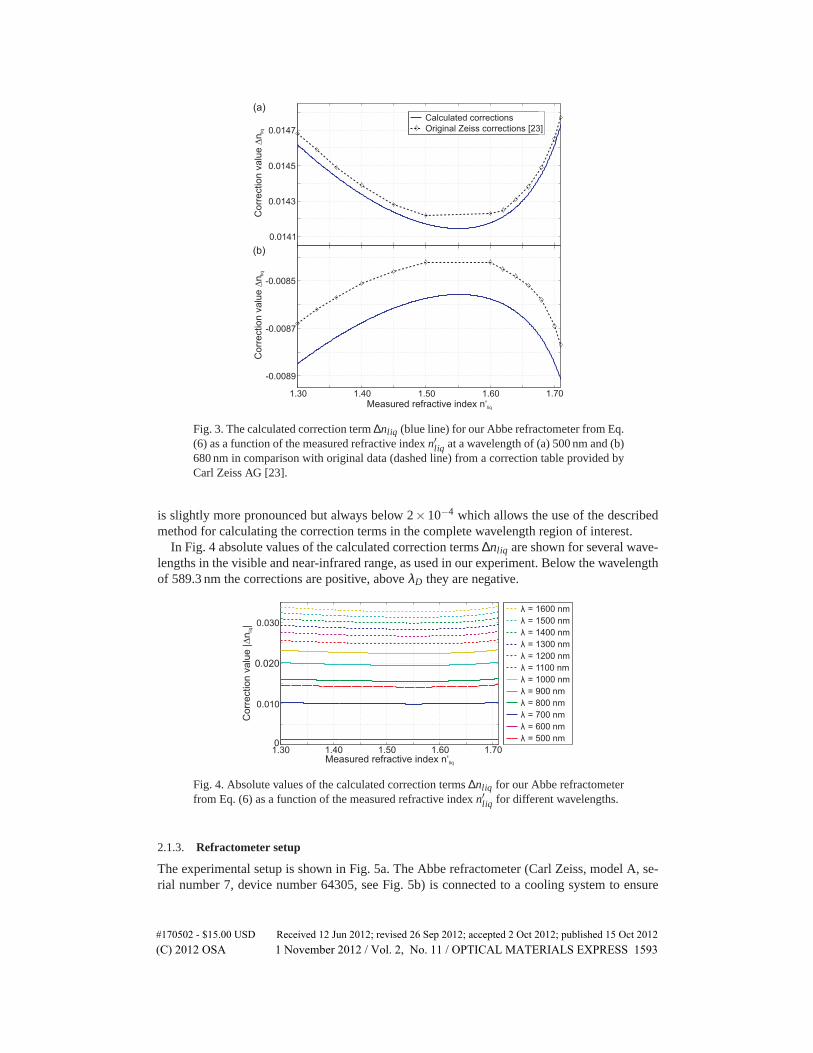
For verification the calculated correction term∆nliq is compared with data from a correctiontable provided by Zeiss at two wavelengths ofλ = 500 nm andλ = 680 nm [23]. The resultsare plotted in Fig. 3.∆nliq matches very well with the original data given by Zeiss and themaximum deviation is less than 1×10⁻⁴ at 500 nm. At a wavelength of 680 nm the deviation
#170502 - $15.00 USD Received 12 Jun 2012; revised 26 Sep 2012; accepted 2 Oct 2012; published 15 Oct 2012(C) 2012 OSA 1 November 2012 / Vol. 2, No. 11 / OPTICAL MATERIALS EXPRESS 1592
0.0141
0.0143
0.0145
0.0147
Calculated corrections
Original Zeiss corrections [23]
1.30 1.40 1.50 1.60 1.70
-0.0089
-0.0087
-0.0085
Measured refractive index n‘liq
(a)
(b)C
orr
ection v
alu
en
liq∆
Corr
ection v
alu
en
liq∆
Fig. 3. The calculated correction term∆nliq (blue line) for our Abbe refractometer from Eq.(6) as a function of the measured refractive indexn′liq at a wavelength of (a) 500 nm and (b)680 nm in comparison with original data (dashed line) from a correction table provided byCarl Zeiss AG [23].
is slightly more pronounced but always below 2×10⁻⁴ which allows the use of the describedmethod for calculating the correction terms in the complete wavelength region of interest.
In Fig. 4 absolute values of the calculated correction terms∆nliq are shown for several wave-lengths in the visible and near-infrared range, as used in our experiment. Below the wavelengthof 589.3 nm the corrections are positive, aboveλD they are negative.
1.30 1.40 1.50 1.60 1.700
0.010
0.020
0.030
Measured refractive index n‘liq
λ = 500 nm
λ = 600 nm
λ = 700 nm
λ = 800 nm
λ = 900 nm
λ = 1000 nm
λ = 1100 nm
λ = 1200 nm
λ = 1300 nm
λ = 1400 nm
λ = 1500 nm
λ = 1600 nm
Co
rre
ctio
n v
alu
e |
n|
liq∆
Fig. 4. Absolute values of the calculated correction terms∆nliq for our Abbe refractometerfrom Eq. (6) as a function of the measured refractive indexn′liq for different wavelengths.
2.1.3. Refractometer setup
The experimental setup is shown in Fig. 5a. The Abbe refractometer (Carl Zeiss, model A, se-rial number 7, device number 64305, see Fig. 5b) is connected to a cooling system to ensure
#170502 - $15.00 USD Received 12 Jun 2012; revised 26 Sep 2012; accepted 2 Oct 2012; published 15 Oct 2012(C) 2012 OSA 1 November 2012 / Vol. 2, No. 11 / OPTICAL MATERIALS EXPRESS 1593

a constant temperature of 20 °C which can be controlled by a thermometer at the illuminationprism.Due to the cooling mechanism the temperature varies in the range of±0.5 °C. A super-continuum generated by a tapered fiber with fiber diameters of 2.5µm or 3.0µm, respectively,are used as light sources [26]. A modelocked Ti:Sapphire femtosecond laser at a central wave-length of 800 nm for the 2.5µm fiber and a modelocked PolarOnyx Uranus fiber laser with fspulse compressor at a central wavelength of 1035 nm for the 3.0µm fiber serve as pump sourcesto ensure a broad spectral range. White light spectra are shown in Fig. 6. Bandpass filters witha bandwidth of∆λ = 10 nm and a tolerance of the central filter wavelength of±2nm [27] areplaced into the laser beam path to select certain wavelengths between 500 nm and 1600 nm.
bandpass filter
Abbe refractometer
infrared viewer orinfrared camera
white light laserillumination prism
measuring prism
telescope
(b)(a)
Fig.5. (a) Experimental setup for refractive index measurements with the Abbe refractome-ter in the visible and near-infrared in transmission mode. In reflection mode one directlyilluminates the measuring prism. (b) Abbe refractometer model A from Carl Zeiss.
Depending on the absorption strength of the investigated liquid, the refractometer can also beused in reflection mode to enhance the visibility of the dark-bright separation line. Therefore asecond illumination window is mounted at the front of the measuring prism. Thus the beam pathshown in Fig. 1 is somewhat modified which does not affect the formula of the correction term.The compensator of the refractometer, which filters out the sodium D line and deflects otherwavelengths, is set during the whole measurement to the position 30 in which no wavelengthdependent beam deviation occurs. To match the reticle with the separation line an infraredviewer of FJW Optical Systems (Find-R-Scope Model 84499A) is used in the wavelength rangebetween 500 nm and 1200 nm. Due to the reduced sensitivity of the infrared viewer above awavelength of 1200 nm, an infrared camera NIR-300FGE from Allied Vision Technologies isused in the wavelength region between 900 nm and 1600 nm.
2.2. Absorption coefficient
2.2.1. Loss spectroscopy
According to the Lambert-Beer law the transmitted intensity through a sample declines expo-nentially with increasing lengthL
I(L) = I(0)exp(−αL). (8)
I(0) is the intensity of the incident light andα the absorption coefficient of the investigatedliquid per unit length. To measure the absorption coefficient as a function of the wavelength,the difference in the losses of two identically prepared samples of different lengths has to bedetermined [17]. For the ratio of the transmitted intensities for two liquid filled tubes of lengthsL1 andL2 at the wavelengthλ one obtains [17]
Iliq(L1,λ )
Iempty(L1,λ )
Iempty(L2,λ )
Iliq(L2,λ )= exp(α(L2−L1)). (9)
#170502 - $15.00 USD Received 12 Jun 2012; revised 26 Sep 2012; accepted 2 Oct 2012; published 15 Oct 2012(C) 2012 OSA 1 November 2012 / Vol. 2, No. 11 / OPTICAL MATERIALS EXPRESS 1594

0.6 0.8 1.0 1.2
10-9
10-7
Inte
nsity (
arb
. u
nits)
Ti:Sapphire laser
10-5
Wavelength (µm)
(a)
0.9 1.1 1.3 1.5 1.710
-4
10-3
10-2
Wavelength (µm)
Inte
nsity (
arb
. u
nits)
PolarOnyx laser(b)
Fig. 6. White light spectra of (a) a Ti:Sapphire laser with a 2.5µm thick tapered fiber and(b) a PolarOnyx laser with a 3.0µm thick tapered fiber with 80 mm waist length.
As a reference signal the corresponding transmitted intensity through the empty tubeIempty isused. Rewriting the Eq. (9) one can calculate the absorption coefficient
α(λ ) =ln
(
Iliq(L1,λ )
Iliq(L2,λ )Iempty(L2,λ )Iempty(L1,λ )
)
L2−L1. (10)
The effect of reflections at the end faces of the sample which also diminish the transmittedintensity cancels out by division of the measured intensities since for identically prepared sam-ples these losses are the same and do not depend on the length of the tube. Furthermore, onecan neglect multiple interferences according to the paper of K. C. Kao et al. [17].
2.2.2. Absorption setup
The experimental setup is shown in Fig. 7a. A Yokogawa AQ4305 white light source is usedas light source. Because of its broad wavelength range spanning from 400 nm to 1800 nm andits very stable intensity spectrum, the light source is particularly suitable for the application ofwavelength dependent loss spectroscopy.
A 4x objective with a numerical aperture of 0.10 provides a suitable collimation of the beam.The liquids are either filled into glass cells of Hellma Analytics or into quadratic stainless steeltubes with 1 mm thick microscope slides from Menzel Glaser at their end faces, depending onthe absorption magnitude (see Fig. 7b). The glass cells provide shorter, the tubes longer samplelengths. The glass cell lengths vary between 1 mm and 40 mm and the tube lengths between25 mm and 1000 mm. The collimated beam of about 7 mm diameter travels through the tubes orglass cells whose parallel end faces have to be precisely aligned perpendicular to the incominglight to avoid beam displacement. Furthermore, it has to be considered that the samples with andwithout the liquid are placed identically so that the reflection coefficients, which are dependenton the incident angle, remain unchanged. A system of mirrors and a lens focus the beam directly
#170502 - $15.00 USD Received 12 Jun 2012; revised 26 Sep 2012; accepted 2 Oct 2012; published 15 Oct 2012(C) 2012 OSA 1 November 2012 / Vol. 2, No. 11 / OPTICAL MATERIALS EXPRESS 1595

spectrometer
lens
objectivewhite light source
stainless steel tube with glass end facesor glass cells
sample holder
deflecting mirror
multimodeglass fiber
(b)(a)
Fig. 7. (a) Experimental setup for absorption measurements in the visible and near-infrared.(b) Glass cells and stainless steel tubes enclosed with glass plates.
into the Ando AQ-6315E spectrometer with a spectral measuring range from 350 nm up to1750 nm. With the last two mirrors one can compensate slight beam displacements to obtain amaximum detection signal.
3. Experimental data and numerical dispersion results
3.1. Refractive indices
At each wavelength several measurements at a temperature of 20 °C are taken to calculatethe arithmetic average ofn′liq(λ ). With this averaged value the actual refractive index of theliquid nliq is then obtained by using Eq. (6) and Eq. (7) withnpr(λD) = 1.74054 andφ = 63 °.To calculate the uncertainties associated with the measurement, error propagation is used toaccount for the uncertainties in the dispersion of the prism∆npr and in the measured refractiveindex∆n′liq . The error for the dispersion of the prism can be obtained from the standard error of
the Cauchy formula (Eq. (7)) and is 1×10⁻⁴. The uncertainty inn′liq is given by the standarderror of the single measurements. Hence, the absolute maximum error at each wavelength canbe calculated by
∆nliq =
∣
∣
∣
∣
∂nliq
∂npr
∣
∣
∣
∣
∆npr +
∣
∣
∣
∣
∣
∂nliq
∂n′liq
∣
∣
∣
∣
∣
∆n′liq . (11)
The corrected refractive indices with their uncertainties are listed in Table 1 and Table 2 forthe eight investigated liquids. The absolute maximum error∆nliq(λ ) ranges between 1×10⁻⁴
and 6×10⁻⁴ and arise from temperature variations, reading and adjustment errors of the re-fractometer, the bandwidth of the filters, and errors in the dispersion of the prism. Duringthe measuring procedure filters in 50 nm steps in the wavelength region between 500 nm and900 nm and in 100 nm steps from 900 nm up to 1600 nm are used. Furthermore, the measure-ment series from the different white light sources match very well so that they can be combinedand used for a single dispersion formula that covers the whole spectral range in the visible andnear-infrared.
From the various refractive indices at different wavelengths one can calculate a dispersionequation by nonlinear curve fitting using the least square method. Among the various dispersionequations the Sellmeier and the Cauchy formula are the most common. The ansatz of Sellmeiercan be used in the whole spectral region and is up to the second order given by
n2(λ ) = 1+A1λ 2
λ 2−B1+
A2λ 2
λ 2−B2, (12)
with A1/2 being material parameters and√
B1/2 thewavelengths of corresponding absorptionbands.
#170502 - $15.00 USD Received 12 Jun 2012; revised 26 Sep 2012; accepted 2 Oct 2012; published 15 Oct 2012(C) 2012 OSA 1 November 2012 / Vol. 2, No. 11 / OPTICAL MATERIALS EXPRESS 1596

Table 1. Experimental values of the refractive index of distilled water, heavy water, ethanol,andtoluene at a temperature of 20 °C.
λ (µm) nwater nheavy water nethanol ntoluene
0.50 1.3372±0.0002 1.3315±0.0002 1.3653±0.0004 1.5059±0.00020.55 1.3345±0.0002 1.3294±0.0002 1.3625±0.0002 1.4998±0.00030.60 1.3328±0.0002 1.3278±0.0002 1.3612±0.0003 1.4958±0.00030.65 1.3314±0.0003 1.3264±0.0002 1.3596±0.0002 1.4926±0.00030.70 1.3301±0.0002 1.3258±0.0002 1.3589±0.0003 1.4901±0.00030.75 1.3291±0.0003 1.3248±0.0002 1.3579±0.0003 1.4879±0.00030.80 1.3282±0.0001 1.3240±0.0002 1.3573±0.0003 1.4865±0.00020.85 1.3273±0.0002 1.3235±0.0002 1.3569±0.0003 -0.90 1.3263±0.0003 1.3228±0.0002 1.3565±0.0003 1.4837±0.00031.00 1.3249±0.0002 1.3217±0.0004 1.3551±0.0004 1.4823±0.00031.10 1.3235±0.0003 1.3209±0.0004 1.3542±0.0003 1.4809±0.00031.20 1.3218±0.0004 1.3198±0.0003 1.3539±0.0003 1.4800±0.00031.30 1.3201±0.0002 1.3191±0.0002 1.3532±0.0003 1.4792±0.00031.40 1.3183±0.0003 1.3183±0.0003 1.3528±0.0003 1.4783±0.00031.50 1.3167±0.0004 1.3173±0.0004 1.3522±0.0003 1.4779±0.00031.60 1.3141±0.0004 1.3167±0.0005 1.3518±0.0004 1.4773±0.0004
Table 2. Experimental values of the refractive index of carbon disulfide, carbon tetrachlo-ride,chloroform, and nitrobenzene at a temperature of 20 °C.
λ (µm) ncarbon disulfide ncarbon tetrachloride nchloroform nnitrobenzene
0.50 1.6473±0.0003 1.4652±0.0002 1.4495±0.0003 1.5671±0.00020.55 1.6348±0.0006 1.4616±0.0002 1.4461±0.0002 1.5574±0.00030.60 1.6266±0.0004 1.4595±0.0002 1.4434±0.0002 1.5505±0.00050.65 1.6186±0.0005 1.4570±0.0003 1.4418±0.0002 1.5456±0.00030.70 1.6136±0.0005 1.4558±0.0002 1.4402±0.0004 1.5420±0.00030.75 1.6091±0.0003 1.4547±0.0002 1.4391±0.0002 1.5390±0.00020.80 1.6058±0.0004 1.4536±0.0002 1.4383±0.0003 1.5367±0.00040.85 1.6032±0.0005 1.4523±0.0002 1.4374±0.0003 1.5346±0.00040.90 1.6008±0.0005 1.4519±0.0002 1.4369±0.0005 1.5333±0.00021.00 1.5976±0.0004 1.4512±0.0003 1.4357±0.0004 1.5307±0.00031.10 1.5947±0.0004 1.4504±0.0003 1.4351±0.0004 1.5290±0.00031.20 1.5929±0.0003 1.4497±0.0004 1.4346±0.0003 1.5273±0.00021.30 1.5909±0.0005 1.4491±0.0004 1.4342±0.0003 1.5264±0.00031.40 1.5900±0.0004 1.4488±0.0004 1.4340±0.0003 1.5256±0.00031.50 1.5888±0.0003 1.4484±0.0003 1.4335±0.0003 1.5247±0.00031.60 1.5880±0.0004 1.4479±0.0003 1.4332±0.0003 1.5240±0.0003
Far away from any resonance one can use the simpler Cauchy equation. Therefore the firstorder Sellmeier equation can be expanded into a power series. Up to the second order oneobtains
n2(λ ) = 1+A1λ 2
λ 2−B1≈ 1+A1(1+
B1
λ 2 +B2
1
λ 4 ) = C0 +C1
λ 2 +C2
λ 4 . (13)
An improvement in fitting the refractive index of liquids in the visible to near-infrared regioncan be expected if a termC3λ 2 in Eq. (13) is added due to infrared vibrational absorption
#170502 - $15.00 USD Received 12 Jun 2012; revised 26 Sep 2012; accepted 2 Oct 2012; published 15 Oct 2012(C) 2012 OSA 1 November 2012 / Vol. 2, No. 11 / OPTICAL MATERIALS EXPRESS 1597

bands [15] which leads to
n2(λ ) = C0 +C1
λ 2 +C2
λ 4 +C3λ 2. (14)
For each liquid the constants of the Sellmeier and the Cauchy formulas are calculated. Tochoose the number of terms, the standard error of the constants, the summed squares of residuals(SSE), the adjusted R-square, and the fit standard error (Root Mean Squared Error, RMSE) aretaken into account.
By careful comparison of the fitting results it turns out that one or two terms in the Sellmeierformula (Eq. (12)) deliver satisfying results. However, the additional term in Eq. (14) offersindeed better fitting results than Eq. (13) for the Cauchy formula.
In Table 3 and Table 4 the constants of Sellmeier and Cauchy formula and their statistics aregiven for each liquid. The values of the standard deviation indicate good quality of the fits. Theerror forn2
liq is in the best case about 3.0×10⁻⁴ for chloroform and still below 6.2×10⁻⁴ forcarbon tetrachloride in the worst case.
Sellmeier and Cauchy formulas shown in the following Figs. 8, 9, 10, 11, 12, 13, 14, 15 arebased on data between wavelengths of 500 nm and 1600 nm. For reasons of clarity no absoluteerror bars associated with each measured refractive index value are plotted. In general, the re-fractive index in the wavelength range of the visible to the near-infrared is caused by electronicabsorption in the ultraviolet and the vibrational absorption in the infrared. In the followingpreviously published data are shown in comparison, being in very good agreement with ourmeasurements.
3.1.1. Refractive index of distilled water
In Fig. 8 the measured values for the refractive index of distilled water are shown which arelisted in Table 1. We plotted there as well the Sellmeier formula given in Table 3 together withreference values from Refs. [16, 18, 21]. For distilled water many reference data have beenpublished; only three are shown in Fig. 8. The dispersion curve from Ref. [18] is plotted in thewavelength range between 405 nm and 1129 nm. From a wavelength of 800 nm upwards the
0.6 0.8 1.0 1.2 1.4 1.61.31
1.32
1.33
Wavelength (µm)
Re
fra
ctive
in
de
x
Measured values
Sellmeier formula of measurement
Reference values [18]
Sellmeier formula of reference [18]
Reference values [16,21]
WATER (H O)2
Fig. 8. Dispersion of the linear refractive index of liquid water at a temperature of 20 °C.Diamonds represent the experimental data listed in Table 1; the solid red curve is the cal-culated Sellmeier dispersion formula given in Table 3; for comparison we also plotted thereference data as squares and the corresponding dispersion curve (dashed black line) fromRef. [18]. Circles are published data extracted from Refs. [16,21].
#170502 - $15.00 USD Received 12 Jun 2012; revised 26 Sep 2012; accepted 2 Oct 2012; published 15 Oct 2012(C) 2012 OSA 1 November 2012 / Vol. 2, No. 11 / OPTICAL MATERIALS EXPRESS 1598
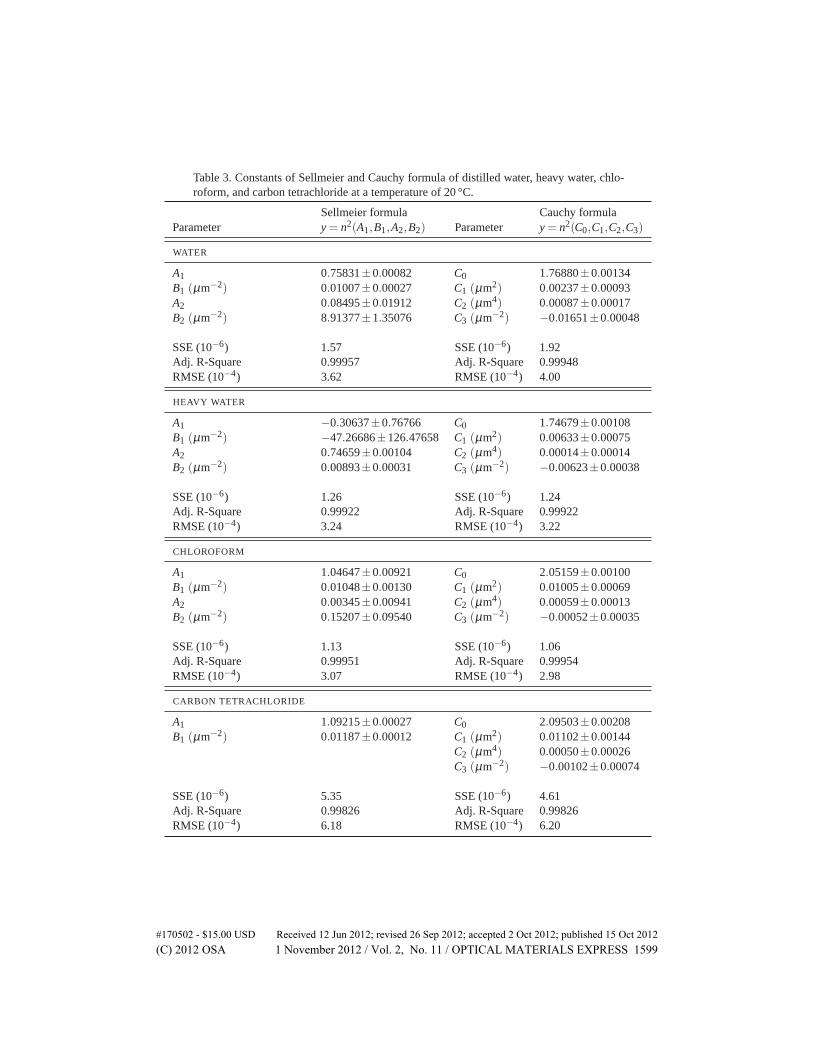
Table 3. Constants of Sellmeier and Cauchy formula of distilled water, heavy water, chlo-roform,and carbon tetrachloride at a temperature of 20 °C.
Sellmeier formula Cauchy formulaParameter y = n2(A1,B1,A2,B2) Parameter y = n2(C0,C1,C2,C3)
WATER
A1 0.75831±0.00082 C0 1.76880±0.00134B1 (µm−2) 0.01007±0.00027 C1 (µm2) 0.00237±0.00093A2 0.08495±0.01912 C2 (µm4) 0.00087±0.00017B2 (µm−2) 8.91377±1.35076 C3 (µm−2) −0.01651±0.00048
SSE (10−6) 1.57 SSE (10−6) 1.92Adj. R-Square 0.99957 Adj. R-Square 0.99948RMSE (10−4) 3.62 RMSE (10−4) 4.00
HEAVY WATER
A1 −0.30637±0.76766 C0 1.74679±0.00108B1 (µm−2) −47.26686±126.47658 C1 (µm2) 0.00633±0.00075A2 0.74659±0.00104 C2 (µm4) 0.00014±0.00014B2 (µm−2) 0.00893±0.00031 C3 (µm−2) −0.00623±0.00038
SSE (10−6) 1.26 SSE (10−6) 1.24Adj. R-Square 0.99922 Adj. R-Square 0.99922RMSE (10−4) 3.24 RMSE (10−4) 3.22
CHLOROFORM
A1 1.04647±0.00921 C0 2.05159±0.00100B1 (µm−2) 0.01048±0.00130 C1 (µm2) 0.01005±0.00069A2 0.00345±0.00941 C2 (µm4) 0.00059±0.00013B2 (µm−2) 0.15207±0.09540 C3 (µm−2) −0.00052±0.00035
SSE (10−6) 1.13 SSE (10−6) 1.06Adj. R-Square 0.99951 Adj. R-Square 0.99954RMSE (10−4) 3.07 RMSE (10−4) 2.98
CARBON TETRACHLORIDE
A1 1.09215±0.00027 C0 2.09503±0.00208B1 (µm−2) 0.01187±0.00012 C1 (µm2) 0.01102±0.00144
C2 (µm4) 0.00050±0.00026C3 (µm−2) −0.00102±0.00074
SSE (10−6) 5.35 SSE (10−6) 4.61Adj. R-Square 0.99826 Adj. R-Square 0.99826RMSE (10−4) 6.18 RMSE (10−4) 6.20
#170502 - $15.00 USD Received 12 Jun 2012; revised 26 Sep 2012; accepted 2 Oct 2012; published 15 Oct 2012(C) 2012 OSA 1 November 2012 / Vol. 2, No. 11 / OPTICAL MATERIALS EXPRESS 1599

Table 4. Constants of Sellmeier and Cauchy formula of toluene, ethanol, carbon disulfide,andnitrobenzene at a temperature of 20 °C.
Sellmeier formula Cauchy formulaParameter y = n2(A1,B1,A2,B2) Parameter y = n2(C0,C1,C2,C3)
TOLUENE
A1 1.17477±0.00022 C0 2.17873±0.00138B1 (µm−2) 0.01825±0.00009 C1 (µm2) 0.01886±0.00095
C2 (µm4) 0.00086±0.00017C3 (µm−2) −0.00145±0.00049
SSE (10−6) 3.20 SSE (10−6) 1.82Adj. R-Square 0.99964 Adj. R-Square 0.99976RMSE (10−4) 4.96 RMSE (10−4) 4.07
ETHANOL
A1 0.83189±0.00196 C0 1.83347±0.00199B1 (µm−2) 0.00930±0.00052 C1 (µm2) 0.00648±0.00138A2 −0.15582±1.59085 C2 (µm4) 0.00031±0.00025B2 (µm−2) −49.45200±537.47222 C3 (µm−2) −0.00352±0.00071
SSE (10−6) 4.53 SSE (10−6) 4.23Adj. R-Square 0.99667 Adj. R-Square 0.99689RMSE (10−4) 6.15 RMSE (10−4) 5.94
CARBON DISULFIDE
A1 1.50387±0.00027 C0 2.50984±0.00161B1 (µm−2) 0.03049±0.00008 C1 (µm2) 0.04101±0.00112
C2 (µm4) 0.00252±0.00021C3 (µm−2) −0.00183±0.00057
SSE (10−6) 5.84 SSE (10−6) 2.77Adj. R-Square 0.99987 Adj. R-Square 0.99993RMSE (10−4) 6.46 RMSE (10−4) 4.81
NITROBENZENE
A1 1.30628±0.00449 C0 2.31952±0.00125B1 (µm−2) 0.02268±0.00079 C1 (µm2) 0.02355±0.00087A2 0.00502±0.00474 C2 (µm4) 0.00266±0.00016B2 (µm−2) 0.18487±0.02830 C3 (µm−2) −0.00259±0.00044
SSE (10−6) 2.57 SSE (10−6) 1.67Adj. R-Square 0.99986 Adj. R-Square 0.99991RMSE (10−4) 4.63 RMSE (10−4) 3.73
#170502 - $15.00 USD Received 12 Jun 2012; revised 26 Sep 2012; accepted 2 Oct 2012; published 15 Oct 2012(C) 2012 OSA 1 November 2012 / Vol. 2, No. 11 / OPTICAL MATERIALS EXPRESS 1600

red solid and dashed black lines run nearly parallel to each other with a maximum deviationof 6×10⁻⁴. Also, the values given in the Refs. [16] and [21] match very well with our data.Moreover, a Cauchy formula from Ref. [16] in the range between 486 nm and 943 nm and thevalues of Ref. [22] fit quite well our own measured values but are not shown in Fig. 8 forreasons of clarity.
In general, the trend of dispersion of water differs from that of the other investigated liquidsdue to the huge vibrational overtone absorption band at a wavelength of around 1400 nm (seeFig. 16).
3.1.2. Refractive index of heavy water
In Fig. 9 the measured values for the refractive index of heavy water are shown which arealso listed in Table 1. Presented there as well are the Sellmeier data given in Table 3 togetherwith reference values from Ref. [21]. The corresponding dispersion curve is plotted in the wave-length range between 405 nm and 768 nm. In this regime the solid red and the dashed black linesshow good agreement and deviate between 1.5×10⁻⁴ and 4.5×10⁻⁴. The deviations of theextended Cauchy formula derived in Ref. [21] from our own Sellmeier formula increase withincreasing wavelength which indicates the limited usability of dispersion curves beyond theirmeasuring range. Furthermore, we observe a weaker influence of the first overtone vibrationon the dispersion curve compared to H2O since the absorption band is shifted to higher wave-lengths (around 2.1µm). This effect results from the heavier deuterium nucleus (see Fig. 17).
0.6 0.8 1.0 1.2 1.4 1.61.315
1.321
1.327
Re
fra
ctive
in
de
x
Measured values
Sellmeier formula of measurement
Reference values [21]
Cauchy formula of reference [21]
HEAVY WATER (D O)2
Wavelength ( m)μ
Fig. 9. Dispersion of the linear refractive index of liquid heavy water at a temperatureof 20 °C. Diamonds represent the experimental data listed in Table 1; the solid red curverepresents the calculated Sellmeier dispersion formula given in Table 3; for comparison wealso plotted the reference data as squares and the corresponding dispersion curve (dashedblack line) from Ref. [21].
3.1.3. Refractive index of chloroform
In Fig. 10 the measured values for the refractive index of chloroform are shown which arelisted in Table 2. Presented there as well are the Sellmeier data from Table 3 together withreference values from Ref. [22]. The single data points from Ref. [22] match very good withthe solid red curve and the deviations lie always below 4×10⁻⁴. We observe a deviation of at
#170502 - $15.00 USD Received 12 Jun 2012; revised 26 Sep 2012; accepted 2 Oct 2012; published 15 Oct 2012(C) 2012 OSA 1 November 2012 / Vol. 2, No. 11 / OPTICAL MATERIALS EXPRESS 1601

maximum 20×10−4 in comparison to Ref. [15]. In this reference the data points are located inthe wavelength range between 265 nm and 2480 nm, however, with a lack of measured valuesbetween 656 nm and 2130 nm which is the reason for this huge deviation. Dispersion effectsdue to the absorption bands displayed in Fig. 18 have not been found since the vibrationalovertones are too weak in the infrared range.
CHLOROFORM (CHCl )3
0.6 0.8 1.0 1.2 1.4 1.61.432
1.440
1.448
Refr
active index
Measured values
Sellmeier formula of measurement
Reference values [22]
Wavelength ( m)μ
Fig. 10. Dispersion of the linear refractive index of liquid chloroform at a temperature of20 °C. Diamonds represent the experimental data listed in Table 2; the solid red curve is thecalculated Sellmeier dispersion formula given in Table 3; also shown is for comparison thereference data from Ref. [22] as squares.
3.1.4. Refractive index of carbon tetrachloride
In Fig. 11 the measured values for the refractive index of carbon tetrachloride are plotted aslisted in Table 2. Presented as well is our Cauchy fit from Table 3 together with reference
0.6 0.8 1.0 1.2 1.4 1.61.447
1.453
1.459
1.465
Refr
active index
Measured values
Cauchy formula of measurement
Reference values [16,21,22]
CARBON TETRACHLORIDE (CCl )4
Wavelength ( m)μ
Fig. 11. Dispersion of the linear refractive index of liquid carbon tetrachloride at a tem-perature of 20 °C. Diamonds represent the experimental data listed in Table 2; the solidred curve is the calculated Cauchy dispersion formula given in Table 3; for comparison weshow the reference data from Refs. [16,21,22] as squares.
#170502 - $15.00 USD Received 12 Jun 2012; revised 26 Sep 2012; accepted 2 Oct 2012; published 15 Oct 2012(C) 2012 OSA 1 November 2012 / Vol. 2, No. 11 / OPTICAL MATERIALS EXPRESS 1602

values from Refs. [16, 21, 22]. The three single reference data points lie slightly above thered solid curve, but differ not more than 4× 10⁻⁴. Due to the consistently small absorptioncoefficient (see Fig. 19) no influences on the dispersion trend are noticeable.
3.1.5. Refractive index of toluene
In Fig. 12 we plot the measured values for the refractive index of toluene which are listed inTable 1. Presented there as well are the Cauchy data given in Table 4 together with referencevalues from Refs. [16, 22]. The dispersion curve from Ref. [15] is plotted in the wavelengthrange between 405 nm and 830 nm. The solid red and dashed black curve match very well, andthe largest deviation above a wavelength of 600 nm is less than 2×10⁻⁴. Also the measuredreference value of Ref. [16] derived with the Abbe refractometer at a wavelength ofλ = 830 nmdiffers less than 1×10⁻⁴. The steep decline of the refractive index of toluene is not affected bythe observed resonances shown in Fig. 20.
0.6 0.8 1.0 1.2 1.4 1.6
1.48
1.49
1.50
Re
fra
ctive
in
de
x
Measured values
Cauchy formula of measurement
Reference values [16,22]
Cauchy formula of reference [15]
TOLUENE (C H )7 8
Wavelength ( m)μ
Fig. 12. Dispersion of the linear refractive index of liquid toluene at a temperature of 20 °C.Diamonds represent the experimental data listed in Table 1; the solid red curve is the cal-culated Cauchy dispersion formula given in Table 4; for comparison we also plotted thereference data from Refs. [16,22] as squares as well as the dispersion curve (dashed blackline) from Ref. [15].
3.1.6. Refractive index of ethanol
In Fig. 13 the measured values for the refractive index of ethanol are shown as given in Table 1.Presented there are also the Sellmeier data given in Table 4 together with reference valuesfrom Refs. [16,21,22]. The dispersion curve from Ref. [16] is plotted in the wavelength rangebetween 476 nm and 633 nm. The solid red and dashed black curve agree very well and donot differ more than 2× 10⁻⁴. The reference data point from Ref. [16] at a wavelength ofλ = 830 nm varies not more than 1×10⁻⁴ from our own Sellmeier equation, whereas the otherpoints from Refs. [21,22] a more scattered. The bend of the solid red curve is slightly influencedby the strong absorption bands at a wavelength of around 1500 nm shown in Fig. 21.
#170502 - $15.00 USD Received 12 Jun 2012; revised 26 Sep 2012; accepted 2 Oct 2012; published 15 Oct 2012(C) 2012 OSA 1 November 2012 / Vol. 2, No. 11 / OPTICAL MATERIALS EXPRESS 1603

0.6 0.8 1.0 1.2 1.4 1.61.350
1.354
1.358
1.362
1.366
Re
fra
ctive
in
de
x
Measured values
Sellmeier formula of measurement
Reference values [16,21,22]
Cauchy formula of reference [16]
ETHANOL (C H O)2 6
Wavelength ( m)μ
Fig. 13. Dispersion of the linear refractive index of liquid ethanol at a temperatureof 20 °C.Diamonds represent the experimental data listed in Table 1; the solid red curve is the cal-culated Sellmeier dispersion formula given in Table 4; for comparison we also plotted thereference data as squares from Refs. [16, 21, 22] and the dispersion curve (dashed blackline) from Ref. [16].
3.1.7. Refractive index of carbon disulfide
In Fig. 14 the measured values for the refractive index of carbon disulfide are displayed as listedin Table 2. We also plot the Cauchy fit as given in Table 4 together with the dispersion curvefrom Ref. [15] plotted in the wavelength range between 340 nm and 2430 nm. The trend of thesolid red and dashed black curve match very well. Due to the very steep decline of the refractiveindex the maximal deviation is around 8×10⁻⁴.
0.6 0.8 1.0 1.2 1.4 1.6
1.59
1.61
1.63
1.65
Re
fra
ctive
in
de
x
Measured values
Cauchy formula of measurement
Cauchy formula of reference [15]
CARBON DISULFIDE (CS )2
Wavelength ( m)μ
Fig. 14. Dispersion of the linear refractive index of liquid carbon disulfide ata temperatureof 20 °C. Diamonds represent the experimental data listed in Table 2; the solid red curve isthe calculated Cauchy dispersion formula given in Table 4; for comparison we also plottedthe dispersion curve (dashed black line) from Ref. [15].
#170502 - $15.00 USD Received 12 Jun 2012; revised 26 Sep 2012; accepted 2 Oct 2012; published 15 Oct 2012(C) 2012 OSA 1 November 2012 / Vol. 2, No. 11 / OPTICAL MATERIALS EXPRESS 1604

3.1.8. Refractive index of nitrobenzene
In Fig. 15 the measured values for the refractive index of nitrobenzene are shown which arelisted in Table 2. Presented there as well is the Cauchy formula given in Table 4 together withreference values from Ref. [22]. The difference between the solid red curve and the referencedata points lies between 7×10⁻⁴ and 9×10⁻⁴. There also exist published data in Ref. [21]which differ between 4×10⁻⁴ and 26×10−4 from our own Cauchy equation. The considerablevariations in the deviations result from the multitude of different reference sources mentionedin the Handbook of Nikogosyan [21].
0.6 0.8 1.0 1.2 1.4 1.61.522
1.538
1.554
1.570
Re
fra
ctive
in
de
x
Measured values
Cauchy formula of measurement
Reference values [22]
NITROBENZENE (C H NO )6 5 2
Wavelength ( m)μ
Fig. 15. Dispersion of the linear refractive index of liquid nitrobenzene at atemperature of20 °C. Diamonds represent the experimental data listed in Table 2; the solid red curve is thecalculated Cauchy dispersion formula given in Table 4; for comparison we also plotted thereference data from Ref. [22] as squares.
3.2. Absorption coefficients
At each tube length several measurements at a room temperature of 20 °C are taken to mini-mize the effect of unequal coupling into the spectrometer. From the transmission spectra foreach tube length with and without liquid filling one can calculate the wavelength dependentabsorption coefficient by Eq. (10). An average absorption coefficient can be calculated fromseveral possible combinations of the different sample lengths. On the one hand, at wavelengthswith strong absorption, only the short glass cells provide meaningful results because they canbest follow the steep rise and decline at the resonance positions. More light can be collectedby the spectrometer with the short cells. On the other hand at weak absorption regimes thelong tube lengths deliver more precise results since they can resolve the reduced effect of theabsorption by an increased propagation length (see Eq. (8)). All values of the absorption co-efficient of the six investigated liquids and their standard error are given in the appendix ascomma-separated value text files. The uncertainty at each wavelength is calculated by the stan-dard deviation of the average value. Generally, the absolute standard error is quite small, butfor low values of the absorption coefficient the relative deviation can become large as can alsobe seen in the comparison with reference values in the water measurement in Section 3.2.1.
#170502 - $15.00 USD Received 12 Jun 2012; revised 26 Sep 2012; accepted 2 Oct 2012; published 15 Oct 2012(C) 2012 OSA 1 November 2012 / Vol. 2, No. 11 / OPTICAL MATERIALS EXPRESS 1605
3.2.1. Absorption of distilled water
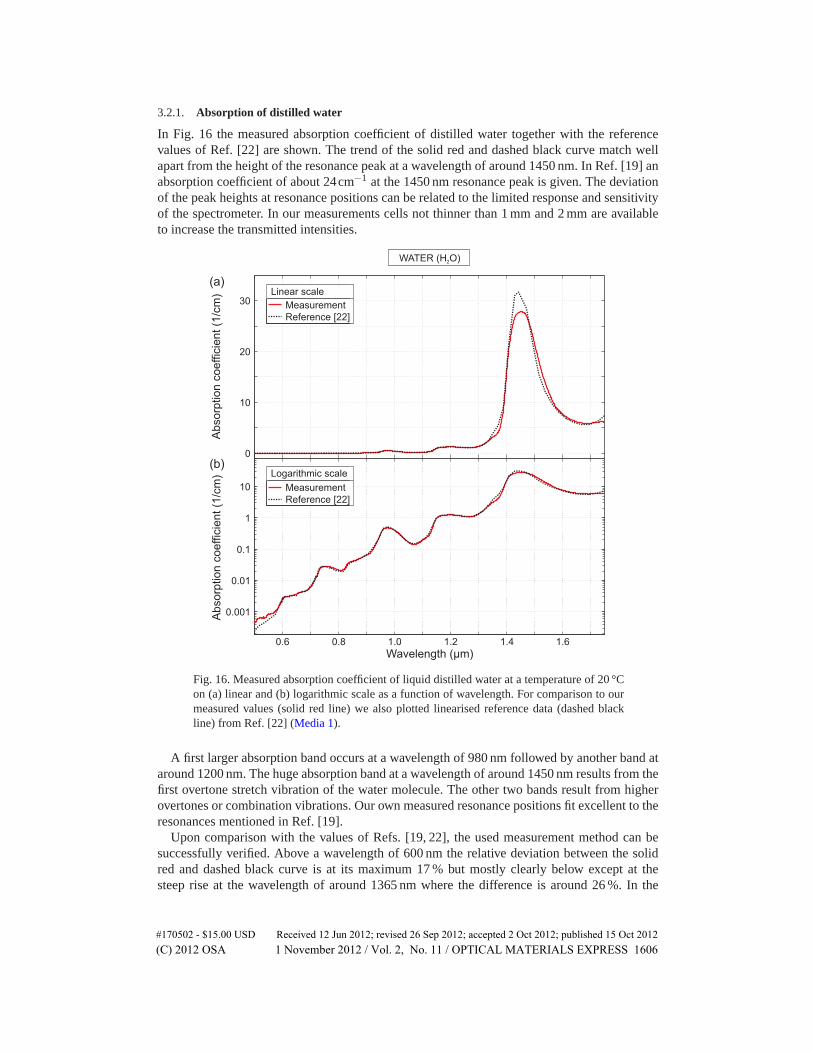
In Fig. 16 the measured absorption coefficient of distilled water together with the referencevalues of Ref. [22] are shown. The trend of the solid red and dashed black curve match wellapart from the height of the resonance peak at a wavelength of around 1450 nm. In Ref. [19] anabsorption coefficient of about 24cm−1 at the 1450 nm resonance peak is given. The deviationof the peak heights at resonance positions can be related to the limited response and sensitivityof the spectrometer. In our measurements cells not thinner than 1 mm and 2 mm are availableto increase the transmitted intensities.
WATER (H O)2
500 600 700 800 900 1000 1100 1200 1300 1400 1500 1600 1700
0
10
20
30
Wavelength (nm)
Ab
so
rptio
n c
oe
ffic
ien
t (1
/cm
)
Measurement
Reference [22]
Linear scale
0.6 0.8 1.0 1.2 1.4 1.6
0.001
0.01
0.1
1
10
Wavelength ( m)μ
Ab
so
rptio
n c
oe
ffic
ien
t (1
/cm
)
Measurement
Reference [22]
Logarithmic scale
Fig. 16. Measured absorption coefficient of liquid distilled water at a temperature of 20 °Con (a) linear and (b) logarithmic scale as a function of wavelength. For comparison to ourmeasured values (solid red line) we also plotted linearised reference data (dashed blackline) from Ref. [22] (Media 1).
A first larger absorption band occurs at a wavelength of 980 nm followed by another band ataround 1200 nm. The huge absorption band at a wavelength of around 1450 nm results from thefirst overtone stretch vibration of the water molecule. The other two bands result from higherovertones or combination vibrations. Our own measured resonance positions fit excellent to theresonances mentioned in Ref. [19].
Upon comparison with the values of Refs. [19, 22], the used measurement method can besuccessfully verified. Above a wavelength of 600 nm the relative deviation between the solidred and dashed black curve is at its maximum 17 % but mostly clearly below except at thesteep rise at the wavelength of around 1365 nm where the difference is around 26 %. In the
#170502 - $15.00 USD Received 12 Jun 2012; revised 26 Sep 2012; accepted 2 Oct 2012; published 15 Oct 2012(C) 2012 OSA 1 November 2012 / Vol. 2, No. 11 / OPTICAL MATERIALS EXPRESS 1606

range between 500 nm to 600 nm in which the absorption coefficient falls below 1×10⁻³cm−1,the relative deviation can become large. However, the average relative deviation over the fullmeasurement range is only 8.5 %.
Possible error sources arise from the different incoupling into the spectrometer entrance, thetemporal instability of the white light source, dust on the end faces or in the liquid, temperaturevariations, the measurement inaccuracy of the spectrometer, and slightly different reflectioncoefficients at the interfaces. The main error from the slight difference in beam incoupling canbe minimized by several measurements searching each time for the highest detection signalby fine adjustments of the mirrors. All together, these errors can serve as explanation for thestandard deviation as well as for the differences between our measurements and the referencesfor distilled water. However, these effects will cause uncertainties in further measurements andhave to be minimized.
3.2.2. Absorption of heavy water
In Fig. 17 the measured absorption coefficient of heavy water is shown. In contrast to H2O theabsorption bands are considerably weaker and shifted to higher wavelengths due to the heavierdeuterium nucleus. Resonance positions occur at a wavelength of around 1000 nm, 1330 nm,and 1600 nm. Because only the shorter glass cells are applied for measuring the absorptioncoefficient below a wavelength of 1200 nm, the measurement is noisy. Some reference data
500 600 700 800 900 1000 1100 1200 1300 1400 1500 1600 1700
0.2
0.4
0.6
Wavelength (nm)
Ab
so
rptio
n c
oe
ffic
ien
t (1
/cm
)
Measurement
Linear scale
0
0.6 0.8 1.0 1.2 1.4 1.6
0.01
0.1
0.5
Wavelength ( m)μ
Absorp
tion c
oeffic
ient (1
/cm
)
Measurement
Logarithmic scale
HEAVY WATER (D O)2
Fig. 17. Measured absorption coefficient of liquid heavy water at a temperature of 20 °C on(a) linear and (b) logarithmic scale as a function of wavelength (Media 2).
#170502 - $15.00 USD Received 12 Jun 2012; revised 26 Sep 2012; accepted 2 Oct 2012; published 15 Oct 2012(C) 2012 OSA 1 November 2012 / Vol. 2, No. 11 / OPTICAL MATERIALS EXPRESS 1607

have been published in Ref. [22] for the wavelength range between 400 nm and 790 nm. In thisreferencethe values for the absorption coefficient are clearly smaller and lie between 0.3×10⁻³cm−1 and 1.0×10⁻³cm−1. The deviation results from the application of the shorter glasscells instead of the longer tubes in this wavelength region with very low absorption. We did notuse the longer tubes for the absorption measurement in the visible due to the high cost of heavywater.
3.2.3. Absorption of chloroform
In Fig. 18 the measured absorption coefficient of chloroform is shown. The absorption bandsof chloroform are relatively narrow when compared with water. They arise from overtones ofthe CH-group stretch mode and from combination vibrations. Additionally to the sharp peaksat a wavelength of around 1150 nm, 1420 nm, and 1680 nm, numerous smaller peaks below anabsorption coefficient of 0.2cm−1 can be observed. The large peak at a wavelength of 1680 nmcould only be measured exactly when using the thinnest glass cells of 1 mm and 2 mm length,whereas the smaller peaks are only visible with the longest tubes.
Wavelength ( m)μ
600 700 800 900 1000 1100 1200 1300 1400 1500 1600 17000
5
10
15
20
Wavelength (nm)
Ab
so
rptio
n c
oe
ffic
ien
t (1
/cm
)
Measurement
Linear scale
0.6 0.8 1.0 1.2 1.4 1.6
0.01
0.1
1
10
Ab
so
rptio
n c
oe
ffic
ien
t (1
/cm
)
Measurement
Logarithmic scale
CHLOROFORM (CHCl )3
Fig. 18. Measured absorption coefficient of liquid chloroform at a temperature of 20 °C on(a) linear and (b) logarithmic scale as a function of wavelength (Media 3).
3.2.4. Absorption of carbon tetrachloride
In Fig. 19 the measured absorption coefficient of carbon tetrachloride is shown. Due to the con-sistently small absorption coefficientα, which never exceeds 6×10⁻³cm−1, only the longest
#170502 - $15.00 USD Received 12 Jun 2012; revised 26 Sep 2012; accepted 2 Oct 2012; published 15 Oct 2012(C) 2012 OSA 1 November 2012 / Vol. 2, No. 11 / OPTICAL MATERIALS EXPRESS 1608

tubes of 250 mm, 500 mm, 750 mm, and 1000 mm length are used to determine the value ofα.The wavelength range only spans from 500 nm up to 1500 nm as the glass cell measurementsabove 1500 nm are dominated by noise.
500 600 700 800 900 1000 1100 1200 1300 1400 1500
0.002
0.004
0.006
Wavelength (nm)
Ab
so
rptio
n c
oe
ffic
ien
t (1
/cm
)Measurement
Linear scale
0
0.6 0.8 1.0 1.2 1.4
0.001
0.005
Wavelength ( m)μ
Absorp
tion c
oeffic
ient (1
/cm
)
Measurement
Logarithmic scale
CARBON TETRACHLORIDE (CCl )4
Fig. 19. Measured absorption coefficient of liquid carbon tetrachloride at a temperature of20 °C on (a) linear and (b) logarithmic scale as a function of wavelength (Media 4).
3.2.5. Absorption of toluene
In Fig. 20 the measured absorption coefficient of toluene is shown. The same shapes of thethree absorption bands at a wavelength of around 730 nm, 900 nm, and 1150 nm with decreas-ing intensities indicate higher vibrational overtones. The pronounced peak at a wavelength ofaround 1700 nm could not be fully resolved due to the decreasing intensity of the white lightsource at this wavelength range. Toluene consists of a benzene ring with an additional CH3-group. Amongst others, the absorption bands result from stretching overtones of the CH- andCH3-group.
3.2.6. Absorption of ethanol
In Fig. 21 the measured absorption coefficient of ethanol is shown. The spectra are dominatedby vibrational overtones from the groups CH2, CH3 and CH2OH. The shapes of the absorptionbands at wavelengths of around 630 nm, 730 nm, 930 nm, and 1200 nm are very similar. Alsothe peak at a wavelength of around 1700 nm could be not fully assessed.
#170502 - $15.00 USD Received 12 Jun 2012; revised 26 Sep 2012; accepted 2 Oct 2012; published 15 Oct 2012(C) 2012 OSA 1 November 2012 / Vol. 2, No. 11 / OPTICAL MATERIALS EXPRESS 1609

TOLUENE (C H )7 8
500 600 700 800 900 1000 1100 1200 1300 1400 1500 1600 1700
4
8
12
Wavelength (nm)
Absorp
tion c
oeffic
ient (1
/cm
)
Measurement
Linear scale
0.6 0.8 1.0 1.2 1.4 1.6
0.01
0.1
1
10
Wavelength ( m)μ
Absorp
tion c
oeffic
ient (1
/cm
)
Measurement
0
Logarithmic scale
Fig. 20. Measured absorption coefficient of liquid toluene at a temperature of 20 °C on (a)linear and (b) logarithmic scale as a function of wavelength (Media 5).
4. Conclusion
The dispersion and absorption properties of several frequently used nonlinear liquids in thevisible and near-infrared have been measured at a temperature of 20 °C. The refractive indexmeasurement requires the calculation of correction terms in order to use a standard Abbe refrac-tometer in a wider wavelength region beyond the visible. Comparisons with original correctionsfrom Zeiss confirm the used method. All modifications which are needed to extend the applica-tion range are described and given in detail. Accurate measurement data between a wavelengthrange from 500 nm up to 1600 nm together with their fitting constants of Cauchy and Sellmeierequations are given for the first time over this broad wavelength region and were successfullycompared with sparsely existing published data.
The described technique can easily be applied and extended to longer wavelengths above1600 nm with suitable cameras and more powerful and broadband white light sources. A lim-iting factor due to the transmittance of lenses, prism, and their coatings according to Ref. [16]could not be observed in our spectral range. Strongly absorbing liquids such as water or ethanolhave to be investigated in reflection mode and may cause problems at higher wavelengths dueto a reduction of the image contrast. Moreover, the refraction index measurement with the Abberefractometer can be easily transferred to further liquids. An improvement in accuracy could beachieved by a more stable cooling system.
The absorption coefficientα can be determined from the transmitted intensity through cellsor tubes of different lengths. Due to the fact that each valueα is calculated by using two
#170502 - $15.00 USD Received 12 Jun 2012; revised 26 Sep 2012; accepted 2 Oct 2012; published 15 Oct 2012(C) 2012 OSA 1 November 2012 / Vol. 2, No. 11 / OPTICAL MATERIALS EXPRESS 1610

500 600 700 800 900 1000 1100 1200 1300 1400 1500 1600 1700
2
4
6
8
Wavelength (nm)
Ab
so
rptio
n c
oe
ffic
ien
t (1
/cm
)
Measurement
Linear scale
0
0.6 0.8 1.0 1.2 1.4 1.6
0.001
0.01
0.1
1
10
Wavelength ( m)μ
Ab
so
rptio
n c
oe
ffic
ien
t (1
/cm
)
Measurement
Logarithmic scale
ETHANOL (C H O)2 6
Fig. 21. Measured absorption coefficient of liquid ethanol at a temperature of 20 °C on (a)linear and (b) logarithmic scale as a function of wavelength (Media 6).
different length combinations, identical positioning and preparation of the samples have to betaken into account. Also the suitable choice of cells or tubes depending on the magnitude ofabsorption have to be considered. For small values of the absorption coefficient the longer tubesare ideal, whereas at absorption resonances the thinner glass cells provide meaningful results.The measurement technique could be successfully verified by comparison with reference datafor distilled water. Measurements in a wavelength region between 500 nm and 1750 nm (forCCl4 only up to a wavelength of 1500 nm) were taken.
The used technique can also easily be extended to other liquids and different wavelengths.However, for strongly absorbing liquids the application range is restricted because of the avail-able thicknesses of the glass cells below 1 mm. The transmitted intensity could be increasedby a more powerful white light laser, however possibly at the expense of spectral stability andtherefore also leading to reduced accuracy.
In general, the presented methods provide an easy and accurate way to determine the refrac-tive index and the absorption coefficient of liquids. If the desired liquid is not included in thecollection presented in this paper, all necessary information are provided here to transfer thesetechniques and apply them to the liquid of interest.
Acknowledgments
This work was supported financially by DFG, BMBF, GIF, BW-Stiftung, and Alexander vonHumboldt Stiftung. We acknowledge support from the German Research Foundation (DFG)within the funding program Open Access Publishing.
#170502 - $15.00 USD Received 12 Jun 2012; revised 26 Sep 2012; accepted 2 Oct 2012; published 15 Oct 2012(C) 2012 OSA 1 November 2012 / Vol. 2, No. 11 / OPTICAL MATERIALS EXPRESS 1611


