
Liquid-Liquid Phase Separation in an Elastic Network
Robert W. Style,1,* Tianqi Sai,1 Nicoló Fanelli,1 Mahdiye Ijavi,1 Katrina Smith-Mannschott,1
Qin Xu,1 Lawrence A. Wilen,2 and Eric R. Dufresne11Department of Materials, ETH Zürich, 8093 Zürich, Switzerland
2Center for Engineering Innovation and Design, School of Engineering and Applied Sciences,Yale University, New Haven, Connecticut 06520, USA
(Received 5 October 2017; revised manuscript received 17 December 2017; published 16 February 2018)
Living and engineered systems rely on the stable coexistence of two interspersed liquid phases. Yet,surface tension drives their complete separation. Here, we show that stable droplets of uniform and tunablesize can be produced through arrested phase separation in an elastic matrix. Starting with a cross-linked,elastic polymer network swollen by a solvent mixture, we change the temperature or composition to drivedemixing. Droplets nucleate and grow to a stable size that is tunable by the network cross-linking density,the cooling rate, and the composition of the solvent mixture. We discuss thermodynamic and mechanicalconstraints on the process. In particular, we show that the threshold for macroscopic phase separation isaltered by the elasticity of the polymer network, and we highlight the role of correlations between nucleipositions in determining the droplet size and polydispersity. This phenomenon has potential applicationsranging from colloid synthesis and structural color to phase separation in biological cells.
DOI: 10.1103/PhysRevX.8.011028 Subject Areas: Materials Science, Soft Matter
I. INTRODUCTION
Nucleation and growth of liquid droplets is a ubiquitousprocess. In the sky above us, it underlies the formation ofclouds. Inside our own cells, the condensation of protein-rich droplets helps to regulate the translation of RNA,among other cellular phenomena [1,2]. The essentialthermodynamics of condensation was worked out in the19th century by Gibbs [3]. The kinetics of nucleation ismore complex and depends sensitively on the presence ofimpurities [4–7].A growing appreciation for the biological implications of
the phase separation of proteins within living cells [1,8–13]raises a host of questions about the underlying physics [14].Examples include the role of active processes in deter-mining the properties of phase-separated droplets [15] andthe combination of phase separation with kinetic arrest[10,16]. Of particular interest here is the interplay of thestructure of the cytoplasm and phase separation. The physicsof droplet growth has been extensively studied when thesurrounding matrix is a simple fluid such as a vapor orNewtonian liquid. However, a living cell has a complex
rheology, including significant elasticity from the cytoske-leton [17,18].Here, we investigate nucleation and growth of liquid
droplets inside of a cross-linked polymer network.We showthat the resulting droplets are stable and highly uniform,witha size that can be tuned by the cross-linking density, quenchrate, and loading of the minority fluid. Condensation in acompliant elastic network is a generic physical process formaking monodisperse droplets, and it works for a widevariety of chemistries. We demonstrate its efficacy for bothtemperature- and composition-driven condensation inside ofcovalently or physically cross-linked polymer networksswollen with silicone or aqueous solvents. This processmay provide a flexible route to the bulk synthesis ofmonodisperse, polymeric microparticles and nanoparticlesand enable the self-assembly of flexible, structurally coloredmaterials [19,20]. The interaction of condensation andnetwork elasticity may play a role in the cellular physiologyof phase-separated proteins, and the physical parametersidentified here could possibly be exploited by living cells toregulate phase separation [16,21].
II. LIQUID-LIQUID PHASE SEPARATIONIN AN ELASTIC NETWORK
The stability of a fluid mixture depends on the temper-ature and the concentrations of its components (e.g.,Refs. [6,8,22,23]). A schematic phase diagram for a typicalmixture of two liquids, A and B, is shown in Fig. 1(a).Above a critical temperature, any mixture of the two fluids
Published by the American Physical Society under the terms ofthe Creative Commons Attribution 4.0 International license.Further distribution of this work must maintain attribution tothe author(s) and the published article’s title, journal citation,and DOI.
PHYSICAL REVIEW X 8, 011028 (2018)
2160-3308=18=8(1)=011028(9) 011028-1 Published by the American Physical Society
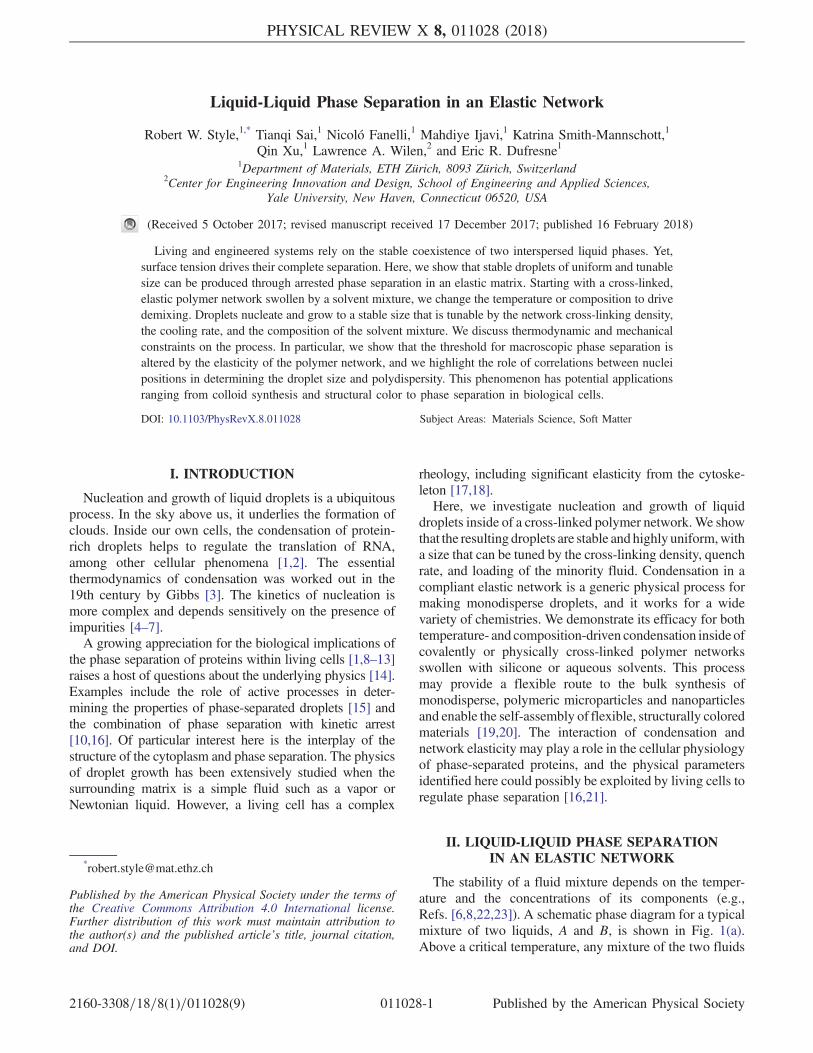
is stable. Below the critical temperature, some mixtures—indicated by the gray region in Fig. 1(a)—are unstable.Now consider a marginally stable fluid mixture at theboundary between the stable and unstable regions, asindicated by point (i). When the mixture is cooled rapidlyto point (ii) in the unstable region, i.e., “quenched,” itspontaneously separates into two stable compositions[Figs. 1(b) and 1(c)]. When the quench is not too deep,separation happens through the nucleation of discretedroplets rich in A (iii’), which grow until the concentrationof A reaches its saturation value in the continuous phase(iii). Since the interface between the droplet and thecontinuous phase costs energy, the droplets tend to coarsenover time. Just like forced mixtures of oil and water,droplets continue to grow until there is a single blob of eachphase. This can occur by direct coalescence or throughdiffusion of the minority component through the continu-ous phase (i.e., Ostwald ripening).We investigate how this classic process is modified by the
presence of a cross-linked polymer network. Consider apolymer network that is swollen by amixture of two solvents,A and B, as shown in Fig. 1(d). Imagine that this solventmixture initially lies at point (i) on the phase diagram and isquenched to the unstable point (ii). As before, the fluid
mixture needs to separate. For simplicity, assume that thepolymer network is excluded by the A-rich droplet phase.Provided that the network is not too dense, we might expectthat initial nucleation and growth will not be affected by thenetwork. However, once the droplet is comparable to orbigger than the network mesh size, it cannot grow withoutdeforming the network [Fig. 1(e)]. How does this impactphase separation? At a minimum, we expect the network toprevent motion of the droplets, blocking direct coalescenceas a route to coarsening. More intriguingly, the thermody-namic forces that drive condensation could be balanced byelastic forces in the polymer network, arresting growth.When a mixture is quenched into the two-phase regime,
it is imbued with excess free energy that can deform apolymer network. Consider an unconstrained liquid inequilibrium with a dilute solute. Here, the solute concen-tration c will take its saturation value csatðTÞ. If c isincreased beyond csat, the solute will condense into theliquid phase until equilibrium is achieved. From idealsolution theory, this is driven by an excess free energyper solute molecule given by ΔgðT; cÞ ¼ kBT lnðc/csatÞ,where kB is Boltzmann’s constant (e.g., Ref. [24]).However, if the liquid phase is constrained by the elasticnetwork of a gel, it can have an increased internal pressureP. Now, the pressure and volume in the droplet willincrease as the solute condenses until the work done bythe condensing solute in order to grow the droplet by asolute molecule, PΔV ¼ PM/ρlNA (e.g., Ref. [25]),balances Δg (here, ρl is the density of the liquid, M isthe molar mass of the solute, and NA is Avogadro’snumber). Thus, in equilibrium, we expect
P ¼ ρlRTM
ln
�ccsat
�; ð1Þ
whereR ¼ kBNA is the gas constant (cf. Refs. [26,27]). If therestraining force of the polymer network exceeds thispressure, it cannot grow. This is perfectly analogous tothe stalling of a processive molecular motor by a sufficientlylarge opposing force [28]. Note that these arguments do notrely on phase separation being driven by changes in temper-ature. Thus, Eq. (1) can also be used to estimate the drivingpressure when phase separation is triggered by otherprocesses, such as changes in solvent or solute composition.Droplets grow freely when they are smaller than the
network mesh size, but to grow beyond the mesh size, theyhave to deform the network. Applying the classic theory ofelastic cavitation [29–34] to droplet growth, we expect tworegimes delimited by a critical pressure Pcrit ¼ 5E/6, whereE is Young’s modulus of the gel. When P < Pcrit, agrowing droplet should make only modest deformationsto the network and will not grow much beyond the networkmesh size. However, when P > Pcrit, droplet growth cannotbe stopped by a linear-elastic or neo-Hookean material(e.g., Refs. [31,34,35]) and is only limited by the
(a) (b)
(c)
(d) (e)
FIG. 1. Phase separation of a liquid mixture in a polymernetwork. (a)–(c) Schematic diagram of simple liquid-liquid phaseseparation in a system with an upper-critical solution temper-ature. Point (i) on the phase diagram indicates a marginally stablemixture where the majority component B is saturated with adilute component A. Upon cooling to (ii), the system sponta-neously separates into two phases, a continuous phase (iii) with alow concentration of A and a droplet phase rich in A (iii’). (d,e)Schematics of (d) a polymer network swollen by a mixture of Aand B [at point (i) in the phase diagram], and (e) the same systemafter quenching to (ii) and phase separating. Note that the dropletmust deform the network in order to grow beyond the mesh size.
ROBERT W. STYLE et al. PHYS. REV. X 8, 011028 (2018)
011028-2
availability of solute. Note, though, that once a droplet ismuch larger than the mesh size, it will be well beyond therange where we can apply the concepts of linear elasticity.Equivalently, since elastic forces make nucleation andgrowth energetically unfavorable at small supersaturations,the apparent phase boundary for macroscopic phase sep-aration is shifted:
cappsat ¼ csatðTÞe½ð5EMÞ/ð6ρlRTÞ�: ð2Þ
Simple scaling arguments suggest that the condition forsolute-limited growth can readily be satisfied in mostsolvent-swollen polymer networks. Ideal rubber elasticitytheory [30] relates Young’s modulus to the structure of thepolymer network, E ≈ nckT. Here, nc is the number densityof cross-links in the network. Combining this result withEq. (1), we find P/E ≈ nl/nc, where nl is the numberdensity of molecules in the droplet phase [assuming thatlnðc/csatÞ ∼Oð1Þ]. Thus, we find that droplets can stronglydeform a polymer network whenever nl ≳ nc or, equiv-alently, when the size of a molecule in the droplet is smallerthan the mesh size of the polymer network. Polymernetworks swollen with a reasonably supersaturated mixturereadily meet this condition.
III. THERMALLY INDUCED PHASESEPARATION IN SILICONE GELS
To demonstrate this process, we grow droplets offluorinated oil in a silicone gel. The silicone gel consistsof a cross-linked silicone polymer network swollen insilicone oil. By varying the cross-linking density, we cantune Young’s modulus E from about 5 kPa to 1 MPa (e.g.,Ref. [36]). We saturate the gels with fluorinated oil at anelevated temperature Te. The saturation concentration ofthe oil in the gel has no significant dependence on the cross-linking density, but it increases with temperature in therange 23 °C–55 °C, as csat½wt%� ¼ 0.093Te½°C� þ 3.2 (seeRef. [37]). To initiate droplet formation, we cool samples to23 °C at a controlled rate.We estimate the pressure available to deform the elastic
network using Eq. (1). For fluorinated oil (ρl/M ¼4494 mol/m3), the pressure prefactor ρlRT/M ¼ 11 MPa.In these experiments, we can readily reach c/csat up to 2,corresponding to a driving pressure of 7.7 MPa. Thisexceeds the anticipated threshold for droplet growth, evenfor the stiffest gels we consider here.
A. Tuning droplet size
Over a wide range of experimental conditions, weobserved uniform micron-scale spherical droplets
(a)
(b)
(c)
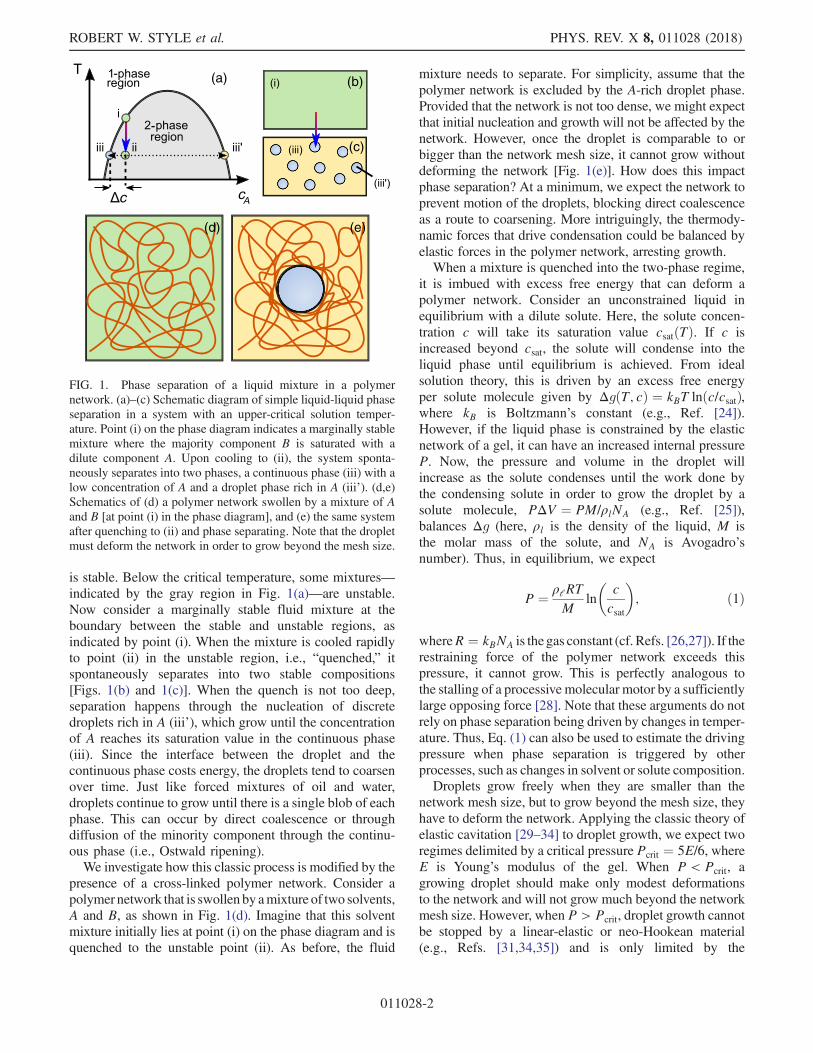
FIG. 2. Droplets formed by phase separation of fluorinated oil in silicone gels. (a) Examples of droplets formed in a soft (top) and stiff(bottom) gels. Examples in the left column have a lower loading than the right column, as they are saturated at 37/44 °C respectively,before being cooled at a rate of 1.5 °C/ min to 23 °C. Note that some of the droplets appear to have other droplets embedded within them,or some sort of substructure. In fact, this corresponds to the imaging of other droplets that lie behind the current plane of focus.(b) Examples of typical droplet distributions in different stiffness gels, each saturated at 44 °C. (c) The dependence of droplet size onstiffness and saturation temperature. Data points are centered on the average value, and the error bars indicate the standard deviation. Ineach panel, P is calculated using Eq. (1).
LIQUID-LIQUID PHASE SEPARATION IN AN ELASTIC … PHYS. REV. X 8, 011028 (2018)
011028-3
distributed homogeneously throughout the sample. Typicalmicrostructures of the resulting droplet dispersions areshown in Fig. 2(a), and bright-field optical z stacks arefound in Videos 1–4 in Ref. [37]. The droplets are fixed inposition and show no visible changes in their radii overtime scales of hours. At longer time scales, the dropletsshrink as the oil evaporates. Perhaps obscured by the slowevaporation of the oil, we see no evidence for Ostwaldripening or other slow processes. In contrast, droplets offluorinated oil nucleating and growing in liquid siliconecoarsen to the millimeter scale as their density causes themto settle out upon cooling. As described below, the size ofthe droplets depends on the cross-linking density, the levelof saturation, and the quench rate.The droplet size is primarily controlled by the cross-
linking density of the gel. Analysis of the bright-field zstacks allows us to size each droplet and construct sizedistributions, as shown in Fig. 2(b). In these data, samplesare saturated at T ¼ 44 °C and quenched to 23 °C at1.5 °C/ min. This corresponds to a driving pressure of3.4 MPa. We varied the cross-linking density to achieveYoung’s moduli from 4.2 to 840 kPa. In all cases, thedroplets have single-peaked size distributions that are verywell approximated by normal distributions with mean μ andstandard deviation σ. The mean droplet radius varies fromabout 5 μm to 14 μm. The decrease in mean droplet sizewith gel stiffness is shown in Fig. 2(c). The dependence onYoung’s modulus is modest, such that a 200-fold increase ingel stiffness only decreases the droplet size by a factor of 2.Droplet size is also impacted by the level of saturation.
By varying the incubation temperature, we varied theloading of the oil from c/csat ¼ 1.24 to 1.37 wt %. This10% increase in loading (corresponding to a 50% increase
in the supersaturation, c − csat) leads to a 25% increase indroplet radius, as shown in Fig. 2(c).We can also control droplet size by controlling the
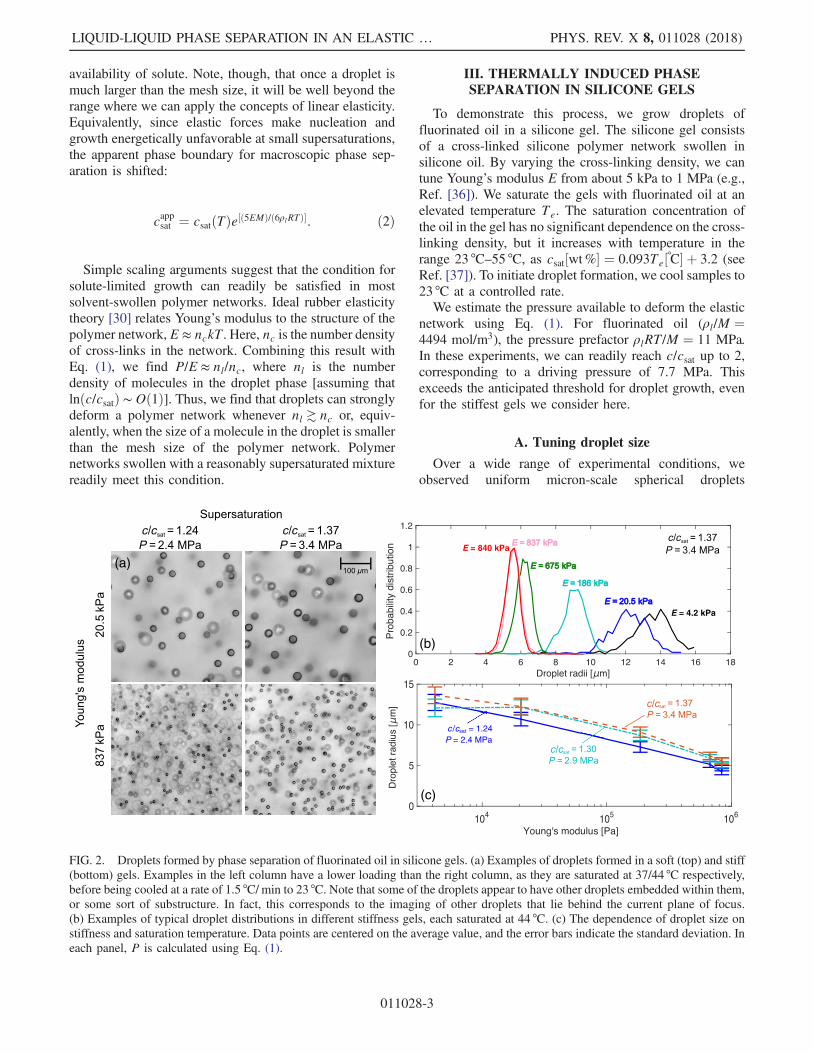
cooling rate: Droplets decrease in size as the cooling rateincreases, as shown in Fig. 3(a). Again, we find a modest,roughly logarithmic, dependence of droplet radius oncooling rate. Droplets are slightly more uniform whencooled at a slower rate. We quantify the uniformity with thepolydispersity index (σ/μ), shown in Fig. 3(b). Over therange of two decades in cooling rate, the polydispersityranged from 7% to 9%. Thus, we can control the size withsurprisingly little penalty in droplet uniformity as thecooling rate increases.
B. Optical properties of compositeswith uniform droplets
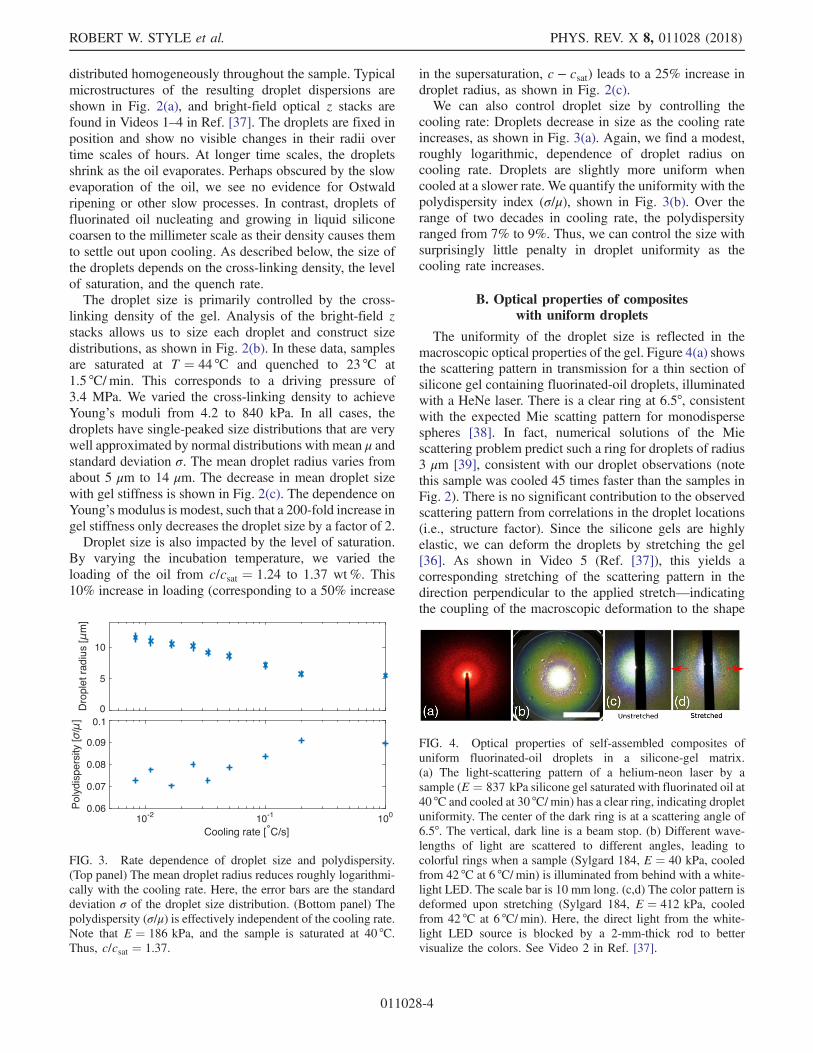
The uniformity of the droplet size is reflected in themacroscopic optical properties of the gel. Figure 4(a) showsthe scattering pattern in transmission for a thin section ofsilicone gel containing fluorinated-oil droplets, illuminatedwith a HeNe laser. There is a clear ring at 6.5°, consistentwith the expected Mie scatting pattern for monodispersespheres [38]. In fact, numerical solutions of the Miescattering problem predict such a ring for droplets of radius3 μm [39], consistent with our droplet observations (notethis sample was cooled 45 times faster than the samples inFig. 2). There is no significant contribution to the observedscattering pattern from correlations in the droplet locations(i.e., structure factor). Since the silicone gels are highlyelastic, we can deform the droplets by stretching the gel[36]. As shown in Video 5 (Ref. [37]), this yields acorresponding stretching of the scattering pattern in thedirection perpendicular to the applied stretch—indicatingthe coupling of the macroscopic deformation to the shape
FIG. 3. Rate dependence of droplet size and polydispersity.(Top panel) The mean droplet radius reduces roughly logarithmi-cally with the cooling rate. Here, the error bars are the standarddeviation σ of the droplet size distribution. (Bottom panel) Thepolydispersity (σ/μ) is effectively independent of the cooling rate.Note that E ¼ 186 kPa, and the sample is saturated at 40 °C.Thus, c/csat ¼ 1.37.
FIG. 4. Optical properties of self-assembled composites ofuniform fluorinated-oil droplets in a silicone-gel matrix.(a) The light-scattering pattern of a helium-neon laser by asample (E ¼ 837 kPa silicone gel saturated with fluorinated oil at40 °C and cooled at 30 °C/ min) has a clear ring, indicating dropletuniformity. The center of the dark ring is at a scattering angle of6.5°. The vertical, dark line is a beam stop. (b) Different wave-lengths of light are scattered to different angles, leading tocolorful rings when a sample (Sylgard 184, E ¼ 40 kPa, cooledfrom 42 °C at 6 °C/ min) is illuminated from behind with a white-light LED. The scale bar is 10 mm long. (c,d) The color pattern isdeformed upon stretching (Sylgard 184, E ¼ 412 kPa, cooledfrom 42 °C at 6 °C/ min). Here, the direct light from the white-light LED source is blocked by a 2-mm-thick rod to bettervisualize the colors. See Video 2 in Ref. [37].
ROBERT W. STYLE et al. PHYS. REV. X 8, 011028 (2018)
011028-4

of the microscopic droplets. Different wavelengths arescattered to rings of different radii by the samples, sowe observe a pattern of color when a point source of whitelight is viewed through the sample [Fig. 4(b)]. This patternchanges as the sample is stretched and the microstructure isdeformed, as shown in Figs. 4(c) and 4(d) and Video 6(Ref. [37]). Note that this approach to generating strain-dependent color is similar to previous work where colloidalparticles were embedded in a soft silicone elastomer [40].
C. Correlated nucleation and growth
As expected for gentle quenches far from the criticalpoint, droplets form by subsequent nucleation and growth(e.g., Refs. [41,42]). Video 7 in Ref. [37] shows a typicalexample. Here, E ¼ 186 kPa, and the sample is cooledfrom 42 °C to 22 °C at 2 °C/ min. New droplet nuclei appearover a period of about 150 s and grow over a longerinterval, of about 800 s. This suggests that nucleation andgrowth can be thought of as two separate stages of dropletformation [7]. Here, we show that while these twoprocesses are separated in time, they are strongly coupledin a manner that impacts the droplet size distributions.Since droplets are trapped in an elastic matrix, nucleation
positions are given by the final positions of the droplets. Weidentified the position of each nucleus using the samebright-field z stacks underlying Fig. 2. First, we determinedthe number density of droplets, nd, as a function of cross-linking density and supersaturation. As shown in Fig. 5(a),nd increases linearly with Young’s modulus, but it isindependent of the supersaturation. By a simple applicationof mass conservation, this variation in nucleation numberdensity fully accounts for the dependence of the meandroplet size on the cross-linking density and extent ofsupersaturation (see Ref. [37]).In classic theory, nucleation events are typically assumed
to be independent. However, we find that the locations ofnucleation sites are significantly correlated and central tothe form of the final droplet distribution. We quantifiedspatial correlations in the nucleation positions using theradial distribution function gðrÞ, as shown in Fig. 5(b) fortypical experimental data. The pair-correlation functioncompares the probability of observing two objects at agiven separation, relative to a case where all objects areplaced perfectly randomly. We find that the number densityof closely neighboring droplets is strongly reduced over adistance comparable to the mean interdroplet spacing,about 40 μm in the example of Fig. 5. This suggests thatthere is some mechanism that prevents droplets fromnucleating near each other. Two possible reasons for thisare the depletion of the dissolved droplet phase and thecompression of the polymer network around nuclei, whichboth hinder further nucleation.Intriguingly, variations in the local spacing of nuclei
have a significant impact on the size distribution. Wecharacterized the structure about each nucleus using the
Voronoi construction. The Voronoi cell associated with anucleus is the collection of points that are closer to it thanany other nucleus. In general, this is a complex polyhedralshape. We reduce it to a single length scale by taking thecube root of the cell volume, or Voronoi radius, rv. Asshown in Fig. 5(c), the Voronoi radius is strongly correlatedto the droplet size. Thus, droplets in tight clusters tend to besmaller than more widely spaced droplets. This effect, ifpresent in conventional liquid-liquid phase separation, ismasked by Brownian motion and coalescence of droplets.Monte Carlo simulations suggest that the correlation of
droplet size and nuclei spacing is a natural consequence ofthe diffusion-limited growth of droplets. Using Browniandynamics, we simulated the diffusion and capture of solutemolecules by a number of fixed nuclei. In one case, thenuclei were positioned completely randomly; in the othercase, the nuclei positions were selected to have the samegðrÞ as experiments. In both cases, we find a pronouncedcorrelation between rv and droplet radii, as shown by thegreen (random) and pink (correlated) points in Fig. 5(c),which nicely match the experimentally observed correla-tion (blue). However, the simulation with correlated
(a)
(c) (d)
(b)
FIG. 5. Correlated nucleation and growth. (a) The numberdensity of droplets depends on stiffness but not saturation. Thedashed line is the line of best fit to the data. (b) The pair-correlation function gðrÞ of droplet centers for a typical experi-ment (blue crosses) shows that nuclei do not form near each other.The range of internuclei repulsions is comparable to the inter-droplet distance. The pink line shows the gðrÞ for nuclei positionsin our Monte Carlo growth simulation. Note that the experimentalmeasurements of gðrÞ are only accurate for r ≳ 5 μm because ofthe inaccuracy of out-of-plane tracking of droplet centers.(c) Droplet sizes are strongly correlated with the radius of theirVoronoi cell. Blue: Data from the experiment in (b). Green andpink points show results of growth simulations with random andcorrelated nuclei positions. (d) Droplet size distributions for theexperimental data in (b) (blue) and simulations with random(green) or correlated (pink) positions.
LIQUID-LIQUID PHASE SEPARATION IN AN ELASTIC … PHYS. REV. X 8, 011028 (2018)
011028-5
nucleation positions shows a narrower spread in rv anddroplet radii, which closely matches the experiments, asshown in Fig. 5(d). Thus, long-range interactions of nucleimake the structure around each nucleus more regular andresult in more uniform droplet radii.Together, these results suggest that understanding
the nucleation process is crucial to gaining a quantitativeunderstanding of droplet size and monodispersity.
IV. ISOTHERMAL PHASE SEPARATIONIN HYDROGELS
To show the generality of uniform droplet production byphase separation in a polymer network, we demonstrate itsefficacy for a distinct form of phase separation and diversepolymeric networks.Previously, we supersaturated the system by quenching a
binary liquid mixture with a change of temperature. Now,we drive the phase separation of a solute by changing thecomposition of a solvent mixture [7,43]. This form of phaseseparation is familiar from aperitifs like ouzo and pastis. Inthese drinks, fragrant anise oil is solubilized in water by ahigh concentration of ethanol [44]. When water is added tothe drink, the mixture becomes unstable, and oil-richdroplets nucleate and grow.We use three hydrogels with distinct chemistries: a
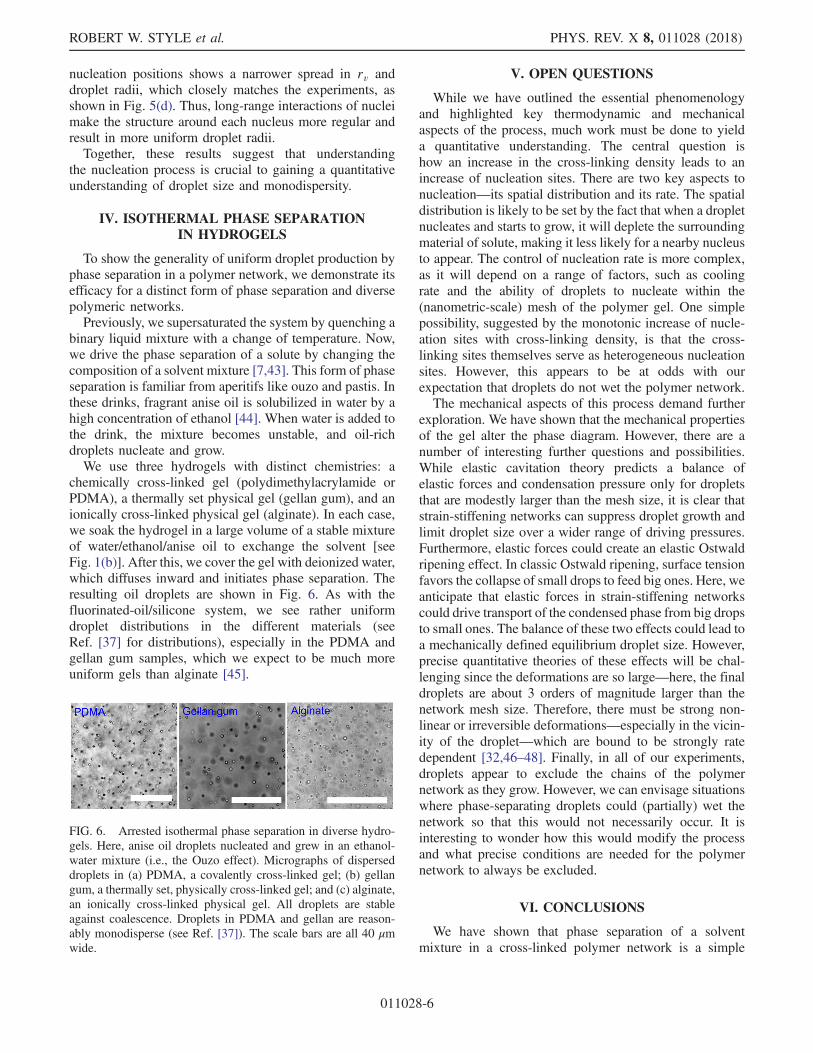
chemically cross-linked gel (polydimethylacrylamide orPDMA), a thermally set physical gel (gellan gum), and anionically cross-linked physical gel (alginate). In each case,we soak the hydrogel in a large volume of a stable mixtureof water/ethanol/anise oil to exchange the solvent [seeFig. 1(b)]. After this, we cover the gel with deionized water,which diffuses inward and initiates phase separation. Theresulting oil droplets are shown in Fig. 6. As with thefluorinated-oil/silicone system, we see rather uniformdroplet distributions in the different materials (seeRef. [37] for distributions), especially in the PDMA andgellan gum samples, which we expect to be much moreuniform gels than alginate [45].
V. OPEN QUESTIONS
While we have outlined the essential phenomenologyand highlighted key thermodynamic and mechanicalaspects of the process, much work must be done to yielda quantitative understanding. The central question ishow an increase in the cross-linking density leads to anincrease of nucleation sites. There are two key aspects tonucleation—its spatial distribution and its rate. The spatialdistribution is likely to be set by the fact that when a dropletnucleates and starts to grow, it will deplete the surroundingmaterial of solute, making it less likely for a nearby nucleusto appear. The control of nucleation rate is more complex,as it will depend on a range of factors, such as coolingrate and the ability of droplets to nucleate within the(nanometric-scale) mesh of the polymer gel. One simplepossibility, suggested by the monotonic increase of nucle-ation sites with cross-linking density, is that the cross-linking sites themselves serve as heterogeneous nucleationsites. However, this appears to be at odds with ourexpectation that droplets do not wet the polymer network.The mechanical aspects of this process demand further
exploration. We have shown that the mechanical propertiesof the gel alter the phase diagram. However, there are anumber of interesting further questions and possibilities.While elastic cavitation theory predicts a balance ofelastic forces and condensation pressure only for dropletsthat are modestly larger than the mesh size, it is clear thatstrain-stiffening networks can suppress droplet growth andlimit droplet size over a wider range of driving pressures.Furthermore, elastic forces could create an elastic Ostwaldripening effect. In classic Ostwald ripening, surface tensionfavors the collapse of small drops to feed big ones. Here, weanticipate that elastic forces in strain-stiffening networkscould drive transport of the condensed phase from big dropsto small ones. The balance of these two effects could lead toa mechanically defined equilibrium droplet size. However,precise quantitative theories of these effects will be chal-lenging since the deformations are so large—here, the finaldroplets are about 3 orders of magnitude larger than thenetwork mesh size. Therefore, there must be strong non-linear or irreversible deformations—especially in the vicin-ity of the droplet—which are bound to be strongly ratedependent [32,46–48]. Finally, in all of our experiments,droplets appear to exclude the chains of the polymernetwork as they grow. However, we can envisage situationswhere phase-separating droplets could (partially) wet thenetwork so that this would not necessarily occur. It isinteresting to wonder how this would modify the processand what precise conditions are needed for the polymernetwork to always be excluded.
VI. CONCLUSIONS
We have shown that phase separation of a solventmixture in a cross-linked polymer network is a simple
FIG. 6. Arrested isothermal phase separation in diverse hydro-gels. Here, anise oil droplets nucleated and grew in an ethanol-water mixture (i.e., the Ouzo effect). Micrographs of disperseddroplets in (a) PDMA, a covalently cross-linked gel; (b) gellangum, a thermally set, physically cross-linked gel; and (c) alginate,an ionically cross-linked physical gel. All droplets are stableagainst coalescence. Droplets in PDMA and gellan are reason-ably monodisperse (see Ref. [37]). The scale bars are all 40 μmwide.
ROBERT W. STYLE et al. PHYS. REV. X 8, 011028 (2018)
011028-6
bulk technique to create uniform droplets. The size of theresulting droplets depends on a range of factors, includingthe cross-linking density of the polymer network, thesupersaturation, and the quench rate. This process forthe production of monodisperse droplets in bulk has broadpotential applications. For example, it could be used tocreate quantities of composites with well-defined micro-structures that enable novel optical or mechanical proper-ties [16,36], without the expense of using monodispersecolloidal templates (e.g., Ref. [40]). Additionally, by usinga monomer as the phase-separating component, it canoffer a flexible route for the synthesis of uniform micro-particles. This process separates the control of particle sizefrom polymerization kinetics and thus may allow a greaterlevel of control over final particle size than othertechniques.Our results suggest a potential role for polymer
networks in the regulation of membraneless organelleswithin living cells. Consider phase-separating macromole-cules with molecular weights in the range of 75–600 kDa.Equation (1) suggests they can exert pressures of order4–33 kPa. These pressures are comparable to the stiffnessof many cytoskeletal networks, which suggests thatliving cells may be able to regulate the nucleation andgrowth of membraneless organelles through their mechani-cal properties.
VII. MATERIALS AND METHODS
A. Silicone-gel preparation and characterization
We prepare silicone gels following the recipe ofRef. [36], except where stated otherwise. These areprepared with a mixture of vinyl-terminated polydime-thylsiloxane chains (DMS-V31, Gelest), cross-linker:trimethylsiloxane terminated (25%–35% methylhydrosi-loxane)-dimethylsiloxane copolymer (HMS-301, GelestInc.), and catalyst (SIP6831.2, Gelest). Stiffness is tunedby varying the proportion of cross-linker in the gel between0.8% and 3.3%. We measure Young’s modulus of eachsample by making an additional bulk sample and perform-ing a compression test. For this test, the silicone gel isformed in a cylindrical plastic mold (depth 10 mm, radius15 mm) and then indented with a 1-mm radius, cylindricalindenter using a TA.XT plus texture analyzer with a 500-gload cell (Stable Micro Systems).For some of the light-scattering experiments, we used a
different variety of silicone gel (Sylgard 184, DowCorning), as this is less sticky and thus easier to stretchmanually. For these samples, stiffness was again tuned byvarying the ratio of base to cross-linker.Silicone-gel samples are made by coating the inside of
glass-bottomed petri dishes with a thin, Oð1-mmÞ-thickfilm of silicone gel. Silicone-gel samples are then saturatedwith fluorinated oil (Fluorinert FC770, Fluorochem) at anelevated temperature Te.
The solubility of fluorinated oil in the gels was measuredby weighing samples of silicone gels of two differentstiffnesses (E ¼ 20, 840 kPa) before and after saturation at23 °C, 40 °C, and 55 °C. No significant change in solubilitywas found with E. See Ref. [37] for further details.
B. Hydrogel preparation
PDMA samples were fabricated by free-radical polym-erization of N-N-dimethylacrylamide (99% DMA, Sigma-Aldrich) with N,N’-methylenebisacrylamide (99% MBA,Sigma-Aldrich) as a cross-linker. Ammonium persulphate(≥ 98% APS, Fisher-Bio) and N,N,N’,N’-tetramethylethy-lenediamine (99.8% TEMED, Apollo Scientific) were usedas the redox/initiator system (e.g., Ref. [49]). All chemicalswere used as received, and the reaction was performed in anitrogen glovebox to avoid inhibition of the reaction byoxygen. We prepared fresh stock solutions with deionizedwater (18.2 MΩ:cm) as follows: 30% w/v DMA, 2% w/vMBA, 10% w/v APS, and 10% w/v TEMED. To make10 mL of PDMA, we combined 2.5-mL of DMA solution,0.8-mL of MBA solution, and 6.64-mL of deionized waterbefore gently mixing. Then we added 0.03-mL of TEMEDsolution and 0.03-mL of APS solution, mixing the samplegently after each addition. Finally, the sample was pouredinto a mold and left to completely cure.Gellan-gum samples were fabricated from 0.5 wt%
gellan gum (BIPG434, Apollo Scientific Ltd.), 59.5 wt% deionized water, and 40 wt% ethanol (99.8%, ChemieBrunschwig). The gum powder is mixed with water, heatedto 90 °C, and stirred until fully dissolved. Ethanol is thenadded dropwise while stirring, and the sample is removedfrom the heat. Typically, we see a separation of the sampleinto an upper, cloudy part and a lower, transparent part. Wepipette the lower, clear phase into petri dishes and allow itto gel. Finally, the gel is soaked in a 50–500-mM CaCl2solution (98% Sigma-Aldrich) to allow full cross-linkingby the calcium ions.Alginate-gel samples were fabricated from 2 wt %
sodium alginate (Acros) in deionized water. This mixtureis gently placed in contact with a 100-mM CaCl2 solutionand left for long enough to allow the calcium ions to diffuseinto and cross-link the alginate solution (e.g., Ref. [50]).
C. Controlled cooling apparatus
To repeatedly cool our samples in a precise manner, webuilt a computer-controlled cooling chamber. This consistsof a 7 × 7 × 7-cm, insulated, aluminium-foil-lined, insu-lated chamber on a 4-mm-thick aluminium plate, which ismounted on a 12V peltier element. A fan in the chambercirculates the air inside to maintain a uniform temperature.A thermistor (NTC 30 kΩ, Amphenol Advanced Sensors)is embedded in the aluminium plate. This is connected via aPID controller (programmed on an Arduino microcontrol-ler) to the peltier element, allowing the chamber to be set ata defined temperature. The air temperature inside the
LIQUID-LIQUID PHASE SEPARATION IN AN ELASTIC … PHYS. REV. X 8, 011028 (2018)
011028-7
chamber is then measured with an Arduino temperaturesensor (TMP36).To cool the sample, we preheat the chamber, insert the
sample, and wait for the temperature to equilibrate. We thenset the sample to cool at a fixed rate until it reaches roomtemperature, 23 °C.
D. 3D image analysis
For each sample, we recorded a stack of images througha section of a sample with depth of approximately 250 μmat 2.5-μm intervals. We performed bright-field microscopywith a Nikon Eclipse Ti2 microscope and either a 20x (NA0.45) or 40x (NA 0.6) air objective (see Ref. [37] forexamples of stacks). The images are then analyzed using abespoke programme with MATLAB’s imfindcircles function-ality to identify, for each droplet in the stack, its radius andlocation in 3D. There is some ambiguity as to what todefine as the precise edge of a droplet in images, as dropletedges appear as a dark, OðμmÞ-thick ring. We choose tomeasure radii as being at the outer edge of this ring. Thischoice gives excellent reliability in relative measurementsof droplet size. However, there may be a systematic error ofup to about 1.5 μm. We calculated the volume of theVoronoi cell for each droplet using MATLAB’s voronoifunction. The Voronoi cell of a droplet is the collection ofpoints in 3D that are closer to its center than the center ofany other droplet.
E. Growth simulations
We explored the effect of internuclei structural correla-tions on the growth of droplets using Monte Carlo simu-lations. In the first step, we positioned 103 nuclei in a cubewith periodic boundary conditions, either by placing thenuclei independently or using the Metropolis algorithm togenerate a pattern of points with the same gðrÞ as observedin experiments. In the second step, we released 106
molecules, which underwent a random walk until theywere captured by a nucleus. By counting how manymolecules were captured by each nucleus, we were ableto determine the final size of each nucleus. For simplicity,the target radius for each nucleus was fixed throughout thesimulation so that the volume fraction of the targetswas 1.25%.
F. Optical experiments
We observed the scattering of red, laser light from aHeNe laser (Thorlabs HNL020L) through Oð1-mmÞ-thicksamples. The scattering pattern was projected onto a sheetof thin, tracing paper, which was then imaged from behindwith a Nikon 1 J5 camera.We observed the scattering of white light by positioning
a white-light LED (Apple, iPhone 6) behind a sample andthen imaging the scattering pattern with the same camera.
ACKNOWLEDGMENTS
We acknowledge helpful discussions with Alain Gorielyand Ian Griffiths and funding from the Swiss NationalScience Foundation (Grants No. 200021_172824 andNo. 200021_172827). The authors declare no competingfinancial interests.
R. W. S., L. A.W., and E. R. D. designed experiments.R. W. S., T. S., N. F., M. I., K. S.-M., and Q. X. performedexperiments. R. W. S., L. A.W., and E. R. D. analyzed data.R.W. S., L. A.W., and E. R. D. developed the theory.R.W. S. and E. R. D. wrote the paper.
[1] C. P. Brangwynne, Soft Active Aggregates: Mechanics,Dynamics and Self-Assembly of Liquid-like IntracellularProtein Bodies, Soft Matter 7, 3052 (2011).
[2] D. M. Mitrea and R.W. Kriwacki, Phase Separation inBiology; Functional Organization of a Higher Order, CellCommun. Signaling 14, 1 (2016).
[3] J. Willard Gibbs, The Scientific Papers of J. Willard Gibbs,Vol. 1 (Longmans, Green, New York, 1906).
[4] V. J. Anderson and H. N.W. Lekkerkerker, Insights intoPhase Transition Kinetics from Colloid Science, Nature(London) 416, 811 (2002).
[5] M. Avrami, Kinetics of Phase Change I. General Theory,J. Chem. Phys. 7, 1103 (1939).
[6] J. W. Cahn, Phase Separation by Spinodal Decompositionin Isotropic Systems, J. Chem. Phys. 42, 93 (1965).
[7] V. K. LaMer and R. H. Dinegar, Theory, Production andMechanism of Formation of Monodispersed Hydrosols,J. Am. Chem. Soc. 72, 4847 (1950).
[8] A. A. Hyman, C. A. Weber, and F. Jülicher, Liquid-LiquidPhase Separation in Biology, Annu. Rev. Cell Dev. Biol. 30,39 (2014).
[9] A. Molliex, J. Temirov, J. Lee, M. Coughlin, A. P.Kanagaraj, H. J. Kim, T. Mittag, and J. P. Taylor, PhaseSeparation by Low Complexity Domains Promotes StressGranule Assembly and Drives Pathological Fibrillization,Cell 163, 123 (2015).
[10] A. Patel, H. O. Lee, L. Jawerth, S. Maharana, M. Jahnel,M. Y.Hein, S. Stoynov, J.Mahamid, S. Saha, T.M. Franzmannet al., A Liquid-to-Solid Phase Transition of the ALS ProteinFUS Accelerated byDiseaseMutation, Cell 162, 1066 (2015).
[11] J. A. Riback, C. D. Katanski, J. L. Kear-Scott, E. V. Pilipenko,A. E. Rojek, T. R. Sosnick, and D. A. Drummond, Stress-Triggered Phase Separation Is an Adaptive, EvolutionarilyTuned Response, Cell 168, 1028 (2017).
[12] L. Zhu and C. P. Brangwynne, Nuclear Bodies: The Emerg-ing Biophysics of Nucleoplasmic Phases, Curr. Opin. CellBiol. 34, 23 (2015).
[13] D. Zwicker, M. Decker, S. Jaensch, A. A. Hyman, andF. Jülicher, Centrosomes Are Autocatalytic Droplets ofPericentriolar Material Organized by Centrioles, Proc.Natl. Acad. Sci. U.S.A. 111, E2636 (2014).
[14] C. P. Brangwynne, P. Tompa, and R. V. Pappu, PolymerPhysics of Intracellular Phase Transitions, Nat. Phys. 11,899 (2015).
ROBERT W. STYLE et al. PHYS. REV. X 8, 011028 (2018)
011028-8
[15] C. P. Brangwynne, T. J. Mitchison, and A. A. Hyman, ActiveLiquid-like Behavior of Nucleoli Determines Their Size andShape in Xenopus Laevis Oocytes, Proc. Natl. Acad. Sci.U.S.A. 108, 4334 (2011).
[16] E. R. Dufresne, H. Noh, V. Saranathan, S. G. J. Mochrie, H.Cao, and R. O. Prum, Self-Assembly of AmorphousBiophotonic Nanostructures by Phase Separation, SoftMatter 5, 1792 (2009).
[17] M. L. Gardel, J. H. Shin, F. C. MacKintosh, L. Mahadevan,P. Matsudaira, and D. A. Weitz, Elastic Behavior ofCross-linked and Bundled Actin Networks, Science 304,1301 (2004).
[18] Q. Wen and P. A. Janmey, Polymer Physics of the Cytoske-leton, Curr. Opin. Solid State Mater. Sci. 15, 177(2011).
[19] J. H. Holtz and S. A. Asher, Polymerized Colloidal CrystalHydrogel Films as Intelligent Chemical Sensing Materials,Nature (London) 389, 829 (1997).
[20] M. Kolle, A. Lethbridge, M. Kreysing, J. J. Baumberg, J.Aizenberg, and P. Vukusic, Bio-inspired Band-gap TunableElastic Optical Multilayer Fibers, Adv. Mater. 25, 2239(2013).
[21] M. Feric and C. P. Brangwynne, A Nuclear F-actin ScaffoldStabilizes RNP Droplets Against Gravity in Large Cells,Nat. Cell Biol. 15, 1253 (2013).
[22] E. M. Herzig, K. A. White, A. B. Schofield, W. C. K. Poon,and P. S. Clegg, Bicontinuous Emulsions Stabilized Solelyby Colloidal Particles, Nat. Mater. 6, 966 (2007).
[23] H. Tanaka, Viscoelastic Phase Separation, J. Phys.Condens. Matter 12, R207 (2000).
[24] P. Atkins and J. De Paula, Elements of Physical Chemistry(Oxford University, New York, 2013).
[25] Q. Liu and Z. Suo, Osmocapillary Phase Separation,Extreme Mech. Lett. 7, 27 (2016).
[26] S. Cai, K. Bertoldi, H. Wang, and Z. Suo, Osmotic Collapseof a Void in an Elastomer: Breathing, Buckling andCreasing, Soft Matter 6, 5770 (2010).
[27] T. D. Wheeler and A. D. Stroock, The Transpiration ofWater at Negative Pressures in a Synthetic Tree, Nature(London) 455, 208 (2008).
[28] M. J. Schnitzer, K. Visscher, and S. M. Block, ForceProduction by Single Kinesin Motors, Nat. Cell Biol. 2,718 (2000).
[29] J. M. Ball, Discontinuous Equilibrium Solutions and Cav-itation in Nonlinear Elasticity, Phil. Trans. R. Soc. A 306,557 (1982).
[30] A. N. Gent, Rubber and Rubber Elasticity: A Review, J.Polym. Sci., Polym. Symp. 48, 1 (1974).
[31] A. N. Gent and P. B. Lindley, Internal Rupture of BondedRubber Cylinders in Tension, Proc. R. Soc. A 249, 195(1959).
[32] A. N. Gent and C. Wang, Fracture Mechanics andCavitation in Rubber-like Solids, J. Mater. Sci. 26, 3392(1991).
[33] S. Kundu and A. J. Crosby, Cavitation and FractureBehavior of Polyacrylamide Hydrogels, Soft Matter 5,3963 (2009).
[34] J. A. Zimberlin, N. Sanabria-DeLong, G. N. Tew, and A. J.Crosby, Cavitation Rheology for Soft Materials, Soft Matter3, 763 (2007).
[35] J. Zhu, T. Li, S. Cai, and Z. Suo, Snap-through Expansionof a Gas Bubble in an Elastomer, J. Adhes. 87, 466 (2011).
[36] R. W. Style, R. Boltyanskiy, B. Allen, K. E. Jensen, H. P.Foote, J. S. Wettlaufer, and E. R. Dufresne, Stiffening Solidswith Liquid Inclusions, Nat. Phys. 11, 82 (2015).
[37] See Supplemental Material at http://link.aps.org/supplemental/10.1103/PhysRevX.8.011028 for further ex-perimental details and supplemental videos.
[38] C. F. Bohren and D. R. Huffman, Absorption and Scatteringof Light by Small Particles (John Wiley & Sons, New York,2008).
[39] C. Mätzler, Technical Report No. 2002-11, Institut fürAngewandte Physik, 2002.
[40] H. Fudouzi and T. Sawada, Photonic Rubber Sheets withTunable Color by Elastic Deformation, Langmuir 22, 1365(2006).
[41] E. Lepeltier, C. Bourgaux, and P. Couvreur, Nanoprecipi-tation and the “Ouzo Effect": Application to Drug DeliveryDevices, Adv. Drug Delivery Rev. 71, 86 (2014).
[42] H. T. Meryman, Mechanics of Freezing in Living Cells andTissues, Science 124, 515 (1956).
[43] S. A. Vitale and J. L. Katz, Liquid Droplet DispersionsFormed by Homogeneous Liquid-Liquid Nucleation: “TheOuzo Effect,” Langmuir 19, 4105 (2003).
[44] H. Tan, C. Diddens, P. Lv, J. G. M. Kuerten, X. Zhang, andD. Lohse, Evaporation-Triggered Microdroplet Nucleationand the Four Life Phases of an Evaporating Ouzo Drop,Proc. Natl. Acad. Sci. U.S.A. 113, 8642 (2016).
[45] M. Heinemann, H. Meinberg, J. Büchs, H.-J. Koß, andM. B. Ansorge-Schumacher, Method for QuantitativeDetermination of Spatial Polymer Distribution in AlginateBeads Using Raman Spectroscopy, Appl. Spectrosc. 59, 280(2005).
[46] C. Creton and M. Ciccotti, Fracture and Adhesion ofSoftMaterials:AReview,Rep.Prog.Phys.79, 046601(2016).
[47] S. B. Hutchens, S. Fakhouri, and A. J. Crosby, ElasticCavitation and Fracture via Injection, Soft Matter 12,2557 (2016).
[48] C. W. MacMinn, E. R. Dufresne, and J. S. Wettlaufer, Fluid-Driven Deformation of a Soft Granular Material, Phys. Rev.X 5, 011020 (2015).
[49] N. Orakdogen and O. Okay, Influence of the Initiator Systemon the Spatial Inhomogeneity in Acrylamide-based Hydro-gels, J. Appl. Polym. Sci. 103, 3228 (2007).
[50] B. Joddar, E. Garcia, A. Casas, and C. M. Stewart,Development of Functionalized Multi-walled Carbon-Nanotube-Based Alginate Hydrogels for Enabling Biomi-metic Technologies, Sci. Rep. 6, 32456 (2016).
LIQUID-LIQUID PHASE SEPARATION IN AN ELASTIC … PHYS. REV. X 8, 011028 (2018)
011028-9


