
KYUSHU ELECTRIC POWER CO., INC. Proprietary Information Page 408 of 1497 © Kyushu Electric Power Co., Inc., 2016, All Rights Reserved
LIST OF ANNEXURES

KYUSHU ELECTRIC POWER CO., INC. Proprietary Information Page 409 of 1497 © Kyushu Electric Power Co., Inc., 2016, All Rights Reserved
LIST OF ANNEXURES
Annexure - I Soil Investigation and Topographical
Survey 410
Annexure - II Geo-Technical Investigation / Geo-
Hydrological Study 442
Annexure - III ESIA report (Draft) 808
Annexure - IV Land Acquisition Due Diligence
Report 1258
Annexure - V Resettlement Action Plan Framework 1295
Annexure - VI Stakeholders Engagement Plan
(Draft) 1365
Annexure - VII Initial Environmental Evaluation of
Transmission line Project (Draft) 1371
Annexure - VIII Drainage Study 1413
Annexure - IX Railway Siding Feasibility Study 1415
Annexure - X Tariff Calculation 1490

KYUSHU ELECTRIC POWER CO., INC. Proprietary Information Page 410 of 1497 © Kyushu Electric Power Co., Inc., 2016, All Rights Reserved
ANNEXURE - I
SOIL INVESTIGATION AND TOPOGRAPHICAL SURVEY
TOPOGRAPHIC SURVEY REPORT FOR
(ASH DYKE AREA, PIPE CORRIDOR, INTAKE, WATER RESERVOIR)
RELATED TO
THE PREPARATORY SURVEY FOR
CONSTRUCTION OF
BARAUNI SUPER CRITICAL COAL FIRED
THERMAL POWER STATION
(UNIT#10)
OF
BIHAR STATE POWER GENERATION COMPANY LTD.
CONSULTANT
STEAG Energy Services India Pvt. Ltd.
(Formerly Evonik Energy Services India Ltd.)
(A wholly owned subsidiary of Steag Energy Services GmbH, Germany)
A-29, Sector-16, NOIDA-201301, India
DECEMBER 2015

TOPOGRAPHIC SURVEY REPORT PAGE 2 OF 18
Information about the Project SL. No.
1 Name of the Project
TOPOGRAPHIC SURVEY AND GEOTECHNICAL INVESTIGATION FOR BARAUNI COAL FIRE SUPER CRITICAL THERMAL POWER PLANT
2 Main client Bihar State Power Generation Company Limited 3 Main Contractor KYUSHU ELECTRIC POWER CO. INC. 4 Sub Contractor STEAG Energy Services (India) Pvt. Ltd. 5 Date of start 12th May, 2015. 6 Date of Completion 17th June, 2015. 7 Total area 431.25Hectares
TOPOGRAPHIC SURVEY REPORT PAGE 3 OF 18
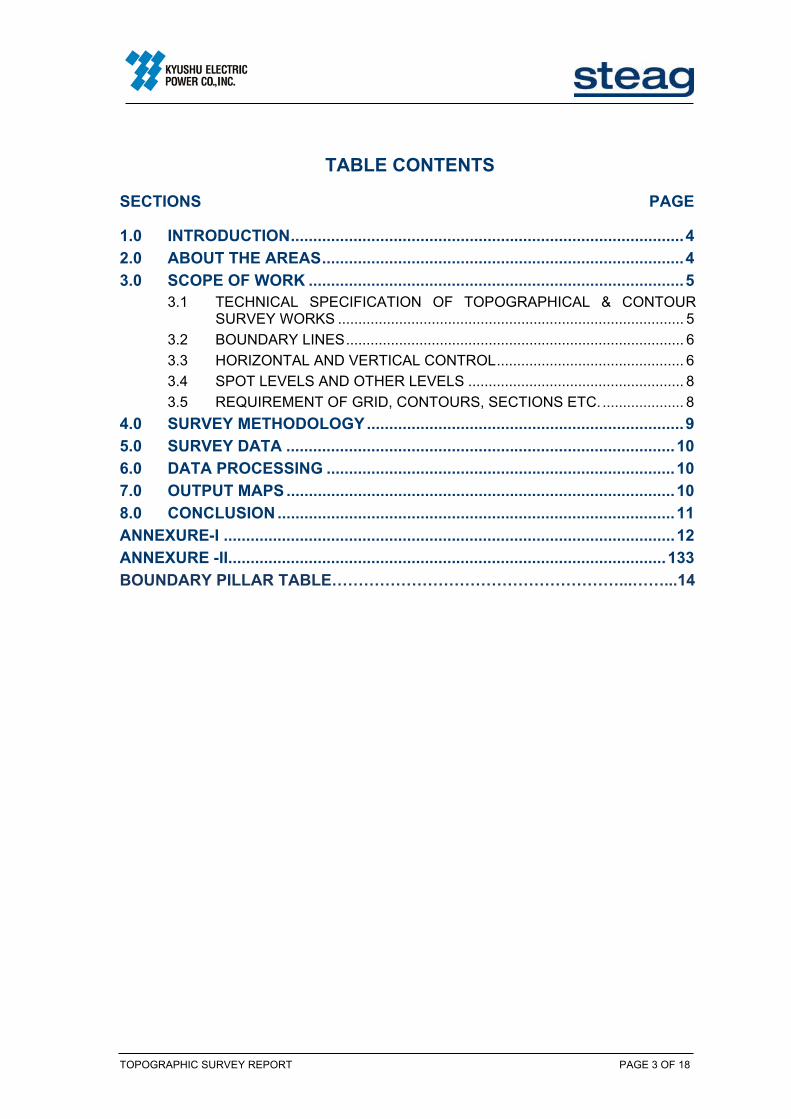
TABLE CONTENTS
SECTIONS PAGE
1.0 INTRODUCTION ........................................................................................ 4
2.0 ABOUT THE AREAS ................................................................................. 4
3.0 SCOPE OF WORK .................................................................................... 5 3.1 TECHNICAL SPECIFICATION OF TOPOGRAPHICAL & CONTOUR
SURVEY WORKS ..................................................................................... 5
3.2 BOUNDARY LINES ................................................................................... 6
3.3 HORIZONTAL AND VERTICAL CONTROL .............................................. 6
3.4 SPOT LEVELS AND OTHER LEVELS ..................................................... 8
3.5 REQUIREMENT OF GRID, CONTOURS, SECTIONS ETC. .................... 8
4.0 SURVEY METHODOLOGY ....................................................................... 9
5.0 SURVEY DATA ....................................................................................... 10
6.0 DATA PROCESSING .............................................................................. 10
7.0 OUTPUT MAPS ....................................................................................... 10
8.0 CONCLUSION ......................................................................................... 11
ANNEXURE-I ..................................................................................................... 12
ANNEXURE -II.................................................................................................. 133
BOUNDARY PILLAR TABLE………………………………………………...……...14

TOPOGRAPHIC SURVEY REPORT PAGE 4 OF 18
1.0 INTRODUCTION Topographic survey work is carried out for water intake area, fresh water reservoir area, ash dyke area and ash transport pipe corridor. This topographic survey work was carried out from 12th May, 2015 to 17th June, 2015. Topographic survey works of these areas are required to start construction works of Coal fire Barauni Super Critical Thermal Power Plant unit no: 10. Survey work was started from water intake area and reservoir near river Ganga. Next, topographic survey work was conducted at Ash pond area and pipe corridor. Ash pond is the largest area of all the areas covering an area of 371.82 hectares, taking a butter of 10m from the kutcha roads surrounding the area. This area also covers four villages namely kasaha Diara, Dumra Diara, Vijaygarh and Sitarampur. Most of the areas are agriculture land and some areas are settlement. From this survey, detail maps of these areas are prepared. Not only detail map Contours were also generated from the ground levels surveyed. 2.0 ABOUT THE AREAS The areas which are survey can be grouped into two groups. 1. Intake and Water reservoir area at Village Simariya. These two areas are attached to each other and are located in the flood plains of river Ganga, therefore the area is totally plain and monotonous. An artificial levee is passing through in the project site near river Ganga. Height of this artificial levee is about 5.3m in average from the ground. The area is flooded by monsoon rain at every 3-4 years. A railway track is passing through at about 680m away from the project site from North east to south west direction. This railway line is connecting between Barauni Junction and Begusarai. The area is very near to Simariya Ghat a worshiping place for Hindu at river Ganga. The area is extended between longitude degree 85°59ʹ38.97ʺ and 86°00ʹ13.23ʺ, Latitude degree 25°23ʹ03.83ʺ to 25°23ʹ34.21ʺ. In this area group, two areas of Ash Dyke and ash transport pipe corridor include. Ash dyke area is surrounded by kutcha roads from all directions. Total area of Ash Dyke area is 371.82 hectares including 10m buffer from the kutcha roads. In this area, four villages namely Kasaha diara, Dumra Diara, Vijaygarh and Sitarampur are located. Dumra diara is the largest village amongst them. Size of the total survey area is increased by 167.82 hectares because of possibility of shifting the ash pond area towards north east direction, towards village Dumra. Thgis is because of strong objection by the villagers of Kasaha diara and Sitarampur.This area is mainly agricultural land, plain in nature, ground level hardly change above 3m in entire area. Isolated and very small forested area is available in the area. Majority of the houses are Kutcha. No important worshiping place or any historically important monuments is located in the area. The pipe corridor connects with this ash dyke area at Village Vijaygarh at the North West. Pipe corridor is a 60m wide corridor which comes out of the power plant at eastern side at village Malhipur. The Arial distance or pipe corridor distance is 2.5km from the power plant passing though two villages namely Vijaygarh and Malhipur. All the villages mention here are sparsely populated hamlets. Ash dyke area is located between Latitude degree 25°21ʹ10.17432ʺ to 25°22ʹ26.91032ʺ and longitude degree 86°02ʹ20.83726ʺ to 86°03ʹ51.18601ʺ.

TOPOGRAPHIC SURVEY REPORT PAGE 5 OF 18
3.0 SCOPE OF WORK
3.1 TECHNICAL SPECIFICATION OF TOPOGRAPHICAL & CONTOUR SURVEY WORKS
3.1.1 Scope The scope covers all the work for conducting site survey using “Total Station” instruments for the total land area which is 201 Ha of Ash pond area, 18 Ha of Water Intake area (at river Ganges), 33 Ha of raw water reservoir area and 60m width of route survey along ash pipe corridor (2.5km). The scope also covers preparation of detailed drawings on the basis of the survey carried out by the Consultant and collated information gathered by the Consultant all as detailed in the Tender document and as directed by Engineer in charge. The scope also includes preparation of a detailed survey report, and recommendation. The scope of work also includes mobilization of necessary instruments and equipment providing necessary skilled, semi-skilled and unskilled personnel, conducting all the field and design office work and preparation of detailed drawings and reports all as required for the successful completion of the work. The brief scope of work for different areas as mentioned shall generally cover but not limited to the following
a) Marking of boundary between Baruani Thermal Power Station and other owners b) Locating the existing and/ or under construction structures of Unit 6-9 of the station
within the area to be surveyed c) Contouring of the whole scope area. d) Locating all structures, nallah, ponds, transmission towers and poles, pipelines, roads,
culverts, graveyard or any other structures etc. existing within scope area and dimensioning the same.
e) Locating all approaches to the area, structures, buildings, nallah, ponds, transmission lines and poles existing nearby, those may have a bearing on construction of the plant; dimensioning these.
f) Developing cross sections of the existing nallah and discharge channels g) Clearing of small plants, bushes & debris and (to the minimum extent as required for
the work and as per instruction of the Client) etc. shall also form a part of the scope of work.
h) Determination of latitude and longitude for the project area. 3.1.2 Technical Specification for Survey Works The technical details for the survey works to be carried out for the scope of works as mentioned hereinabove shall be as follows. This is basically a detailed technical description for survey works and form a part of scope of work.
a) To demarcate the plant and existing Ash Pond areas and check Boundary Pillars at
site in co-ordination with Engineer in charge and as well as representatives of other agencies as applicable. Lengths and bearings with respect to the Magnetic North of each Boundary line shall be determined.
b) To establish a Baseline, with reference to grid lines provided by the Client, within the area being surveyed at suitable location in consultation with the Engineer in Charge and determination of its bearings with respect to the True (geographic) North as well as the Magnetic North.
c) To establish and construct permanent Benchmarks on site at locations to be indicated by the Engineer in Charge. These shall be tied to the nearest authenticated

TOPOGRAPHIC SURVEY REPORT PAGE 6 OF 18
GTS/Survey of India Benchmark or reference benchmarks provided by the Client. d) For Ash Pond area, reference baseline and benchmarks has to be transferred from
plant Area (approx. 2km distance) and similarly for Ash Pipe corridor also which connects the main Plant area to the Ash Pond.
e) For raw water intake and reservoir area, reference baseline and benchmarks has to be transferred from plant Area (approx. 4.5km distance) and similarly for raw water pipe corridor also which connects the main Plant area to the intake area.
f) To establish Horizontal Ground Control Points including those defining the baseline and demarcate them by permanent pillars within the area by Triangular or Closed Traverse or both based on the nearest GTS/ Survey of India station. These control points shall form the basis of the Site Triangulation Network.
g) To determine the latitude and longitude of one of the Horizontal Ground Control Points, decided in co-ordination with the Engineer in Charge.
h) To establish a Site Co-ordinate Grid at specified intervals as per clause 6.7, incorporating the established baseline. Each intersection grids shall be demarcated by a grid pillar with the co-ordinate engraved on the plate.
i) To survey and determine the ground levels and map (incorporating contour and topographic details) of the entire site including land 50 m beyond the boundaries or to the opposite edge of adjoining roads/major rail track whichever is farther, as directed by the Engineer in charge.
j) To measure size and depths of wells, nullahs if any, tanks, ponds, etc. within the scope area, temperature of water in these and simultaneously recording the ambient temperature and the time of the day and the date. Levels of the ground at the well locations shall be specifically taken and recorded. The survey shall also record bed levels including lowest invert of the nullahs if any.
k) To obtain Highest High Flood Levels and Lowest Low Water Levels of nullahs; overflow levels and lowest levels of ponds levels, etc. and high and low tide levels as applicable.
l) To record clearance below bridges, telephone lines, transmission lines, etc. at the lowest point of the catenary.
m) To identify and mark on the Survey Drawings places of worship, tombs, relics of archaeological importance, trees with girth more than 300 mm at 1 m above ground level, transmission lines and towers, telephone/telegraph lines and poles, power and lighting poles, trenches, identified underground services, all permanent and temporary structures, etc. Temporary structures shall be indicated separately.
n) To locate any other existing structures with their dimensions including its height coming in the scope area.
3.2 BOUNDARY LINES Boundary lines of the land plot, shall be physically established at site by Closed Traverse with a precision theodolite at all bends, turning points and at intermediate points of the boundaries located not more than 100 m as shown on the drawing or as directed by the Engineer in charge. The sub-contractor shall establish co-ordinates of each of these Boundary Pillars with respect to the Site Co-ordinate Grid. Bearings of all boundary lines shall be established with respect to the Magnetic North. The general directions of the next Boundary Pillar on either side shall also be etched on the plate. For straight stretches of lengths exceeding 100 m, Boundary Pillars shall be established at every 100 m interval. The establishment of such pillars shall apply in case of roads, railway alignment and pipe-cable routes also.
3.3 HORIZONTAL AND VERTICAL CONTROL Horizontal control and vertical control of the topographic survey being carried out shall be with reference to the nearest GTS control pillars and benchmarks of the Survey of India / reference gridlines and benchmark pillars provided by the Client. These GTS
TOPOGRAPHIC SURVEY REPORT PAGE 7 OF 18
control pillars / reference gridlines and benchmark pillars provided by the Client shall be the basis for the Baseline on the site being surveyed. The levels from such benchmarks shall be transferred to the site being surveyed either on a permanent and firm feature or on a pillar as specified and specially erected for the purpose. In case there are existing Control Points at the site being surveyed or near the site, the same shall be identified and a preliminary survey shall be carried out to check their correctness. All such control points shall be identified and demarcated in the area plan. Horizontal Control shall be fixed by either any or a combination of Triangulation Method or Closed Traverse Method or as directed by the Engineer in charge. All angles shall be measured by theodolite only. In case of the Traverse Method distance between any two consecutive traverse stations shall not exceed 100 m. The Baseline shall first be conveniently defined at site by a series of Control Pillars. The length of the Baseline shall be at least 100 m. The baseline shall be the basis of an orthogonal co-ordinate system for the site. Hence, the Baseline shall be oriented as directed by the Engineer in charge.
The Baseline shall then be established with respect to the GTS Control Point Pillars / reference gridlines and benchmark pillars provided by the Client. The Bearing of the Baseline shall be determined with respect to the Magnetic North. While determining the Magnetic North, the Consultant shall ensure minimum interference from external factors such as transmission lines, telephone line, significant metal objects, etc. Any error due to such interference shall be rectified. Vertical control points shall be established by theodolite and level on all Triangulation or Closed Traverse Stations. The vertical control shall be closed by returning the traverse to the starting point. Features that shall be incorporated in the Land Survey shall include, but shall not be limited to the following: a. Buildings, houses, huts, other structures b. Compound walls, fencing, gates, etc. c. Places of worship d. Burial grounds, isolated graves, cremation grounds e. Transmission lines, towers, poles and power transformers f. Microwave towers g. Underground utilities h. Cable (buried or above ground) i. Pipelines (buried or above ground) j. Telephone lines and poles k. Road side lighting poles and cables l. Highways, pucca topped roads, macadam roads, dirt roads m. Cart tracks, pathways, causeways n. Railway tracks if any o. Culverts, bridges, cross drainage, open wells, bore wells, pumps p. Underground water tanks, overhead water tanks q. Cultivated areas; r. Rock outcrops; s. Channels, drains, nallah if any t. Ponds, lakes, reservoirs and any natural or man-made water body u. Marshy areas v. Bunds, dykes, levees, embankments, weirs, dams

TOPOGRAPHIC SURVEY REPORT PAGE 8 OF 18
w. Trees of girth more than 300 mm measured at 1000 mm above ground level, orchards, grooves, etc.
x. All temporary structures The details shall incorporate inter alia all the above features which adjoin the plot or have any approach path or right of way adjacent to or through the plot or are located up to about 50 m from the plot boundary or to the opposite edge of adjoining roads, rail tracks, boundary walls or major structures whichever is farther as directed by the Engineer in charge. The list given above shall not be construed as being exhaustive and complete and the Consultant shall include all features in the Survey Drawings and Maps with their proper sizes (dimensions), elevations or depths, co-ordinates and bearings, names of places, road numbers or names, etc. 3.4 SPOT LEVELS AND OTHER LEVELS Spot level if any shall be taken at nodes on grids as mentioned in clause 6.7. The grid shall essentially be perpendicular and parallel to the established Baseline. A finer grid shall be plotted in the field drawing. Contours shall also be drawn in the field and their trend checked in situ with the general ground profile and terrain. 3.5 REQUIREMENT OF GRID, CONTOURS, SECTIONS ETC. The Consultant shall establish one Base Line in consultation with the Engineer in charge. The bearing of the base line shall be in the direction of the plant North-South or plant East-West. The base line shall be identified and marked permanently by Benchmark Pillars. Gridlines shall be established in two orthogonal directions with grid distance as mentioned in below table in either direction. Grid pillars shall be established with co-ordinates and RL written on the top to serve as permanent reference. The reference pillars shall be of PCC structure founding minimum 1.5 meter depth from ground level with minimum 0.5meter projection from ground level. The size of pillars shall be as shown in the drawing. The grid pillars/ boundary pillars shall be of PCC structure founding minimum 0.5 meter depth from ground level with minimum 0.3 meter projection from ground level. The size of pillars shall be as shown in the drawing. Location of the pillars shall be such that these should cover a minimum of four pillars, two in each orthogonal direction. Concrete for reference pillars shall be of mix 1:2:4 (one cement: two coarse sand: four 20 mm down stone aggregates) and those for boundary demarcation shall be in P.C.C. 1:2:4. All the component materials shall be of best and acceptable quality and conforming to the provisions of the latest version of the Indian Standards. Steel plates for engraving B.M. value and reference grids shall be of mild steel, conforming to IS: 2062. The entire area shall be surveyed and contours developed. However, unevenness of ground shall be appropriately covered by taking spot levels at closer intervals wherever required. Contour drawings shall be drawn to a scale as with this specification and shall

TOPOGRAPHIC SURVEY REPORT PAGE 9 OF 18
identify and depict all prominent features and details with their sizes, bearings and co-ordinates.
Cross-Sections of the alignment of roads, railway lines and power lines shall be developed as mentioned later in this clause or at every 25 m for cross distances of 10 m on either side of the centerline. For ash/ pipe and coal conveyer and transmission line corridor, the route survey shall be done at 25 m longitudinal interval with cross section developed on each side of the centerline as per the available corridor (half width or 15 m whichever is less i.e. total maximum width 30 m) . 4.0 SURVEY METHODOLOGY This was conducted applying all the technical specification mentioned in the work order. Ground level was transfer from nearest Permanent Bench Marks established by government approved departments. A pair of Temporary Bench Marks is established using Differential Global Positioning System (DGPS) for each site See Photo no: 1. the following table shows list of Temporary Bench Marks established on the different sites. Projection: UTM Datum: WGS 84 Everest Zone: 45 North SL. No.
TBM No.
LOCATION EASTING NORTHING ELEVATION (METER)
1 B.M-1 Water Intake area 398976.7139 2808320.5782 38.838 RL 2 B.M-2 Water Intake area 399058.8627 2808369.6602 38.231 RL 3 B.M-3 Water Reservoir 399343.2300 2808503.1666 38.246 RL 4 B.M-4 Water Reservoir 399365.5894 2808575.8493 38.357 RL 5 B.M-5 Ash pond area 403420.4223 2805382.1716 42.78627MSL6 B.M-6 Ash Pond area 403471.3439 2805452.4024 42.74264MSL LATITUDE LONGITUDE 1 B.M-1 Water Intake area 25°23ʹ17.7540ʺ 85°59ʹ44.6214ʺ 38.838 RL 2 B.M-2 Water Intake area 25°23ʹ19.3704ʺ 85°59ʹ47.5478ʺ 38.231 RL 3 B.M-3 Water Intake area 25°23ʹ23.7768ʺ 85°59ʹ57.6876ʺ 38.246 RL 4 B.M-4 Water Intake area 25°23ʹ26.1456ʺ 85°59ʹ58.4682ʺ 38.357 RL 5 B.M-5 Ash pond area 25°21ʹ43.3008ʺ 86°02ʹ24.3878ʺ 42.78627MSL6 B.M-6 Ash pond area 25°21ʹ45.5940ʺ 86°02ʹ26.1916ʺ 42.74264MSL
Table no: 1 List of Temporary Bench Marks Established at Different site These TBMs are connected with Permanent Bench Marks by Closed traversing Method. Level is transferred by using auto levels with proper closing. The following table shows instruments and equipments use in establishing TBMs, traversing and transferring of levels from Permanent Bench Marks at Unit 9 and 10.
SL. No.
Instruments Model no. No of Instruments
Equipments Purpose
1. DGPS Trimble R3 2 Tripods Establishing TBMs
2. ETS Topcon 235N
1 2Prisms Traversing
3 ETS Topcon 235N
1 2 Prisms Ground levels
4 Auto level Sokkia 1 Tripod, Staff Transferring level
Table No.2 List of Instruments used in this survey work.

TOPOGRAPHIC SURVEY REPORT PAGE 10 OF 18
TBMs are established using concrete pillars as specified on technical specification. Photo no.1 shows DGPS establishing a TBM. After establishing these TBMs ground levels were picked up at the interval of 10m by close traversing method. Photo no.2 shows ground level survey. 5.0 SURVEY DATA The data which is captured by DGPS is in the form of DAT or To2 file format which after downloading and processing is can be saved as ESIR shape files or Auto Cad DWG files. The data captured by Electronic total Station is in the form of csv. file format separated the value by coma. This data format can easily be plotted on auto cad software. 6.0 DATA PROCESSING The DGPS data of Trimble R3 is processed through Trimble Business Centre. Electronic Total Station data does not need to process so it is downloaded using Topcon link software 7.5. After Processing and downloading of survey data, mapping is done using software Auto cad and ESRI software Arc- GIS 10.2. 7.0 OUTPUT MAPS As final output from this survey, we get four different maps for each area. Details of maps for each area is as follows: Map Plats is attached as Annexure-II I. Intake and water Reservoir area
Map Plate no: 1 Detail map of intake and Fresh Water Reservoir Area Map Plate no: 2 Contour map of Intake and Fresh Water Reservoir Area Map Plate no: 3 Superimposition of contour over Detail map of Intake and Reservoir
Area Map Plate no: 4 Superimposition of Khasra map over Contour and Detail map of Intake and Reservoir
II. Ash Dyke area Map Plate no: 5 Detail map of Ash Dyke Area Map Plate no: 6 Contour map of Ash Dyke Area Map Plate no: 7 Superimposition of contour over Detail map of Ash Dyke Area Map Plate no: 8 Superimposition of Khasra map over Contour and Detail map of Ash
Dyke area III. Ash Transport Pipe Corridor
Map Plate no: 9 Detail map of Ash Pipe Corridor Area Map Plate no: 10 Contour map of Ash Pipe Corridor Area Map Plate no: 11 Superimposition of contour over Detail map of Ash Pipe Corridor
Area IV. L-Section and Cross Section of Ash Pipe Corridor Map Plate no.12 L- Section Pipe Corridor
Map Plate no.13 Cross Section of ash pipe corridor
From this survey boundary pillars co-ordinates data in table format is fixed. Table no. 3 List of Boundary Pillars for Intake and Water reservoir area Table no: 4 list of boundary Pillars for Ash Pond area Table no: 5 List of Boundary Pillars for Transport Pipe Corridor.

TOPOGRAPHIC SURVEY REPORT PAGE 11 OF 18
7.1 ROAD NETWORK IN THE PROJECT SITE: The approaching road in Intake area i.e. road on embankment is 2.28m wide in half southern portion and half northern portion is 2 m width. The Concrete road of Ash pond area has an average width of 2.5 m and that of Temporary unpaved road is 2m wide. Those roads passing through Pipe Corridor have average width of 2.5 m
8.0 CONCLUSION From this topographic survey, we are able to generate required information and data about the area on which construction will start in near future. Digital Elevation Model (DEM) is generated from the data collected for all the areas which are surveyed. From this DEM contours of required interval can generate. Detail map about the surface features both artificial and natural is captured also. From these maps, we can plan future course of action and estimation of materials and cost

TOPOGRAPHIC SURVEY REPORT PAGE 12 OF 18
ANNEXURE-I List of Photographs.
1. Photo no.1 shows DGPS Establishing a TBM.
Photo no.2 Shows Ground Level survey

TOPOGRAPHIC SURVEY REPORT PAGE 13 OF 18
ANNESXURE -II Map Plate no: 1 - Detail map of intake and Fresh Water Reservoir Area
Map Plate no: 2 - Contour map of Intake and Fresh Water Reservoir Area
Map Plate no: 3 - Superimposition of contour over Detail map of Intake and
Reservoir Area Map Plate no: 4 - Superimposition of Khasra map over Contour and Detail
map of Intake and Reservoir Map Plate no: 5 - Detail map of Ash Dyke Area
Map Plate no: 6 - Contour map of Ash Dyke Area
Map Plate no: 7 - Superimposition of contour over Detail map of Ash Dyke
Area Map Plate no: 8 - Superimposition of Khasra map over Contour and Detail
map of Ash Dyke area Map Plate no: 9 - Detail map of Ash Pipe Corridor Area
Map Plate no: 10 - Contour map of Ash Pipe Corridor Area
Map Plate no: 11 Map Plateno:12- Map Plateno:13-
-
Superimposition of contour over Detail map of Ash Pipe Corridor Area L- Section Pipe Corridor Cross Section of Ash Pipe Corridor
TOPOGRAPHIC SURVEY REPORT PAGE 14 OF 18
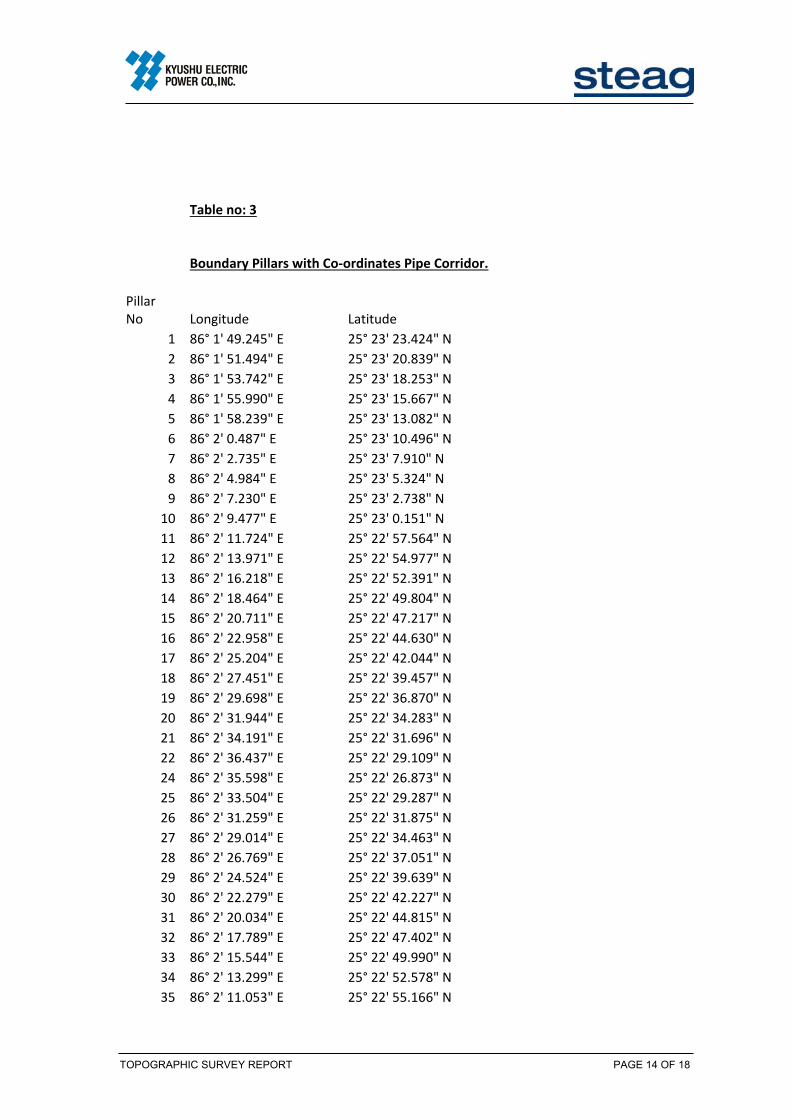
Table no: 3 Boundary Pillars with Co‐ordinates Pipe Corridor.
Pillar No Longitude Latitude
1 86° 1' 49.245" E 25° 23' 23.424" N
2 86° 1' 51.494" E 25° 23' 20.839" N
3 86° 1' 53.742" E 25° 23' 18.253" N
4 86° 1' 55.990" E 25° 23' 15.667" N
5 86° 1' 58.239" E 25° 23' 13.082" N
6 86° 2' 0.487" E 25° 23' 10.496" N
7 86° 2' 2.735" E 25° 23' 7.910" N
8 86° 2' 4.984" E 25° 23' 5.324" N
9 86° 2' 7.230" E 25° 23' 2.738" N
10 86° 2' 9.477" E 25° 23' 0.151" N
11 86° 2' 11.724" E 25° 22' 57.564" N
12 86° 2' 13.971" E 25° 22' 54.977" N
13 86° 2' 16.218" E 25° 22' 52.391" N
14 86° 2' 18.464" E 25° 22' 49.804" N
15 86° 2' 20.711" E 25° 22' 47.217" N
16 86° 2' 22.958" E 25° 22' 44.630" N
17 86° 2' 25.204" E 25° 22' 42.044" N
18 86° 2' 27.451" E 25° 22' 39.457" N
19 86° 2' 29.698" E 25° 22' 36.870" N
20 86° 2' 31.944" E 25° 22' 34.283" N
21 86° 2' 34.191" E 25° 22' 31.696" N
22 86° 2' 36.437" E 25° 22' 29.109" N
24 86° 2' 35.598" E 25° 22' 26.873" N
25 86° 2' 33.504" E 25° 22' 29.287" N
26 86° 2' 31.259" E 25° 22' 31.875" N
27 86° 2' 29.014" E 25° 22' 34.463" N
28 86° 2' 26.769" E 25° 22' 37.051" N
29 86° 2' 24.524" E 25° 22' 39.639" N
30 86° 2' 22.279" E 25° 22' 42.227" N
31 86° 2' 20.034" E 25° 22' 44.815" N
32 86° 2' 17.789" E 25° 22' 47.402" N
33 86° 2' 15.544" E 25° 22' 49.990" N
34 86° 2' 13.299" E 25° 22' 52.578" N
35 86° 2' 11.053" E 25° 22' 55.166" N
TOPOGRAPHIC SURVEY REPORT PAGE 15 OF 18
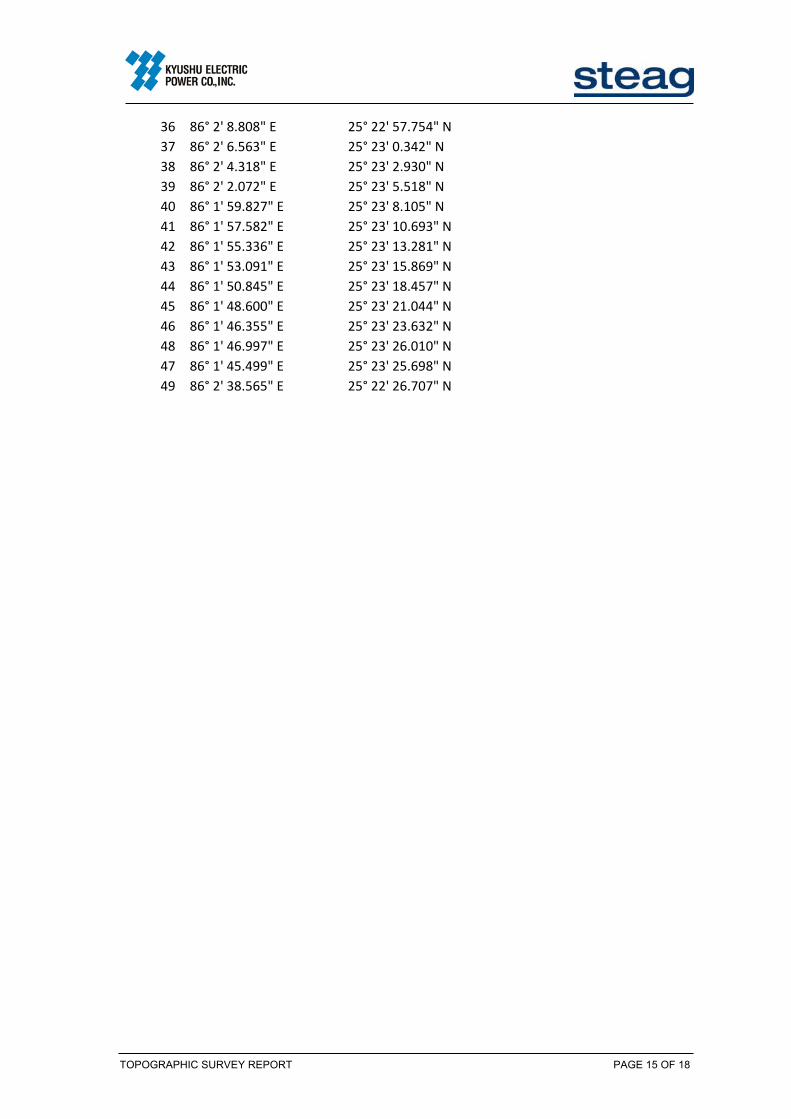
36 86° 2' 8.808" E 25° 22' 57.754" N
37 86° 2' 6.563" E 25° 23' 0.342" N
38 86° 2' 4.318" E 25° 23' 2.930" N
39 86° 2' 2.072" E 25° 23' 5.518" N
40 86° 1' 59.827" E 25° 23' 8.105" N
41 86° 1' 57.582" E 25° 23' 10.693" N
42 86° 1' 55.336" E 25° 23' 13.281" N
43 86° 1' 53.091" E 25° 23' 15.869" N
44 86° 1' 50.845" E 25° 23' 18.457" N
45 86° 1' 48.600" E 25° 23' 21.044" N
46 86° 1' 46.355" E 25° 23' 23.632" N
48 86° 1' 46.997" E 25° 23' 26.010" N
47 86° 1' 45.499" E 25° 23' 25.698" N
49 86° 2' 38.565" E 25° 22' 26.707" N

TOPOGRAPHIC SURVEY REPORT PAGE 16 OF 18
Table no: 4 Boundary Pillars for Ash Pond area PillarNo Longitude Latitude
1 86° 3' 7.408" E 25° 22' 26.976" N
2 86° 3' 8.771" E 25° 22' 23.756" N
3 86° 3' 10.275" E 25° 22' 20.600" N
4 86° 3' 11.694" E 25° 22' 17.405" N
5 86° 3' 13.120" E 25° 22' 14.212" N
6 86° 3' 14.547" E 25° 22' 11.019" N
7 86° 3' 15.922" E 25° 22' 7.804" N
8 86° 3' 17.451" E 25° 22' 4.665" N
9 86° 3' 18.992" E 25° 22' 1.526" N
10 86° 3' 20.502" E 25° 21' 58.373" N
11 86° 3' 22.003" E 25° 21' 55.214" N
12 86° 3' 23.438" E 25° 21' 52.026" N
13 86° 3' 25.122" E 25° 21' 49.054" N
14 86° 3' 26.470" E 25° 21' 45.829" N
15 86° 3' 27.923" E 25° 21' 42.648" N
16 86° 3' 29.281" E 25° 21' 39.429" N
17 86° 3' 30.853" E 25° 21' 36.314" N
18 86° 3' 32.386" E 25° 21' 33.178" N
19 86° 3' 34.054" E 25° 21' 30.107" N
20 86° 3' 35.705" E 25° 21' 27.035" N
21 86° 3' 38.469" E 25° 21' 25.171" N
22 86° 3' 41.019" E 25° 21' 22.960" N
23 86° 3' 43.374" E 25° 21' 20.390" N
24 86° 3' 45.408" E 25° 21' 17.577" N
25 86° 3' 47.662" E 25° 21' 14.904" N
26 86° 3' 49.766" E 25° 21' 12.114" N
27 86° 3' 51.008" E 25° 21' 9.599" N
28 86° 3' 47.597" E 25° 21' 8.851" N
29 86° 3' 44.129" E 25° 21' 8.837" N
30 86° 3' 40.653" E 25° 21' 9.220" N
31 86° 3' 37.167" E 25° 21' 9.480" N
32 86° 3' 33.696" E 25° 21' 9.325" N
33 86° 3' 30.390" E 25° 21' 8.271" N
34 86° 3' 26.902" E 25° 21' 8.154" N
35 86° 3' 23.440" E 25° 21' 7.680" N
36 86° 3' 20.000" E 25° 21' 7.074" N
37 86° 3' 16.512" E 25° 21' 7.282" N
38 86° 3' 13.029" E 25° 21' 7.158" N
TOPOGRAPHIC SURVEY REPORT PAGE 17 OF 18
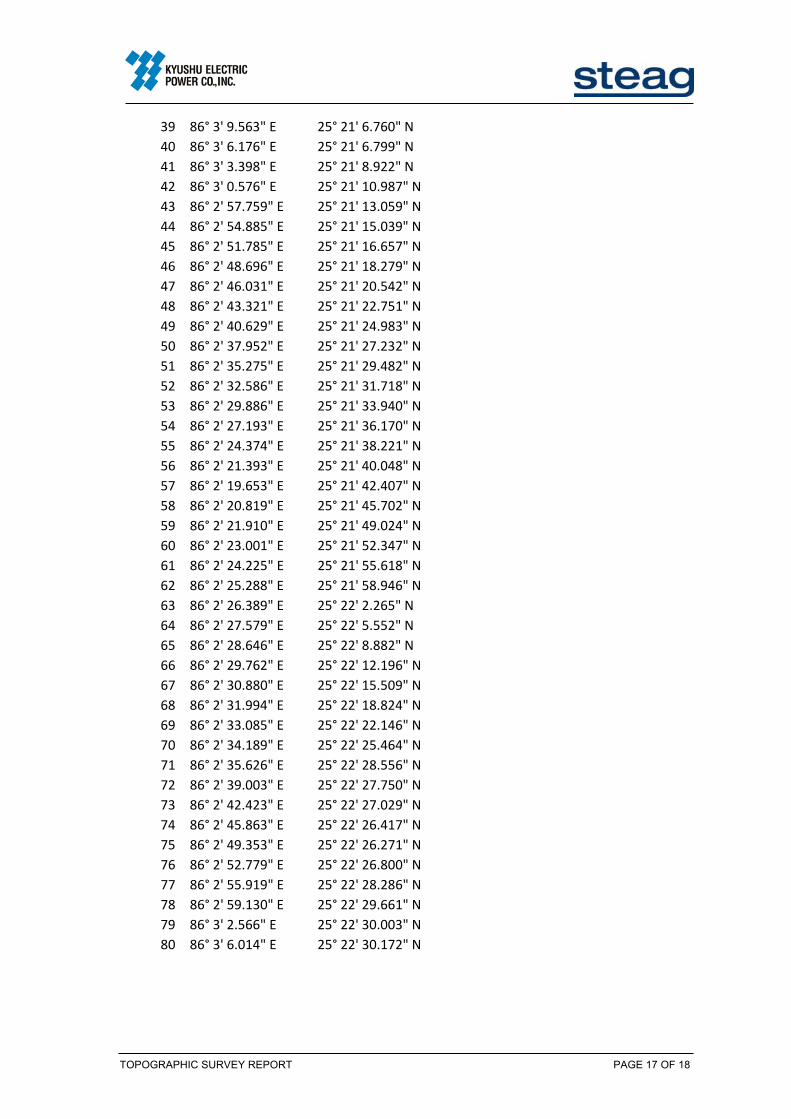
39 86° 3' 9.563" E 25° 21' 6.760" N
40 86° 3' 6.176" E 25° 21' 6.799" N
41 86° 3' 3.398" E 25° 21' 8.922" N
42 86° 3' 0.576" E 25° 21' 10.987" N
43 86° 2' 57.759" E 25° 21' 13.059" N
44 86° 2' 54.885" E 25° 21' 15.039" N
45 86° 2' 51.785" E 25° 21' 16.657" N
46 86° 2' 48.696" E 25° 21' 18.279" N
47 86° 2' 46.031" E 25° 21' 20.542" N
48 86° 2' 43.321" E 25° 21' 22.751" N
49 86° 2' 40.629" E 25° 21' 24.983" N
50 86° 2' 37.952" E 25° 21' 27.232" N
51 86° 2' 35.275" E 25° 21' 29.482" N
52 86° 2' 32.586" E 25° 21' 31.718" N
53 86° 2' 29.886" E 25° 21' 33.940" N
54 86° 2' 27.193" E 25° 21' 36.170" N
55 86° 2' 24.374" E 25° 21' 38.221" N
56 86° 2' 21.393" E 25° 21' 40.048" N
57 86° 2' 19.653" E 25° 21' 42.407" N
58 86° 2' 20.819" E 25° 21' 45.702" N
59 86° 2' 21.910" E 25° 21' 49.024" N
60 86° 2' 23.001" E 25° 21' 52.347" N
61 86° 2' 24.225" E 25° 21' 55.618" N
62 86° 2' 25.288" E 25° 21' 58.946" N
63 86° 2' 26.389" E 25° 22' 2.265" N
64 86° 2' 27.579" E 25° 22' 5.552" N
65 86° 2' 28.646" E 25° 22' 8.882" N
66 86° 2' 29.762" E 25° 22' 12.196" N
67 86° 2' 30.880" E 25° 22' 15.509" N
68 86° 2' 31.994" E 25° 22' 18.824" N
69 86° 2' 33.085" E 25° 22' 22.146" N
70 86° 2' 34.189" E 25° 22' 25.464" N
71 86° 2' 35.626" E 25° 22' 28.556" N
72 86° 2' 39.003" E 25° 22' 27.750" N
73 86° 2' 42.423" E 25° 22' 27.029" N
74 86° 2' 45.863" E 25° 22' 26.417" N
75 86° 2' 49.353" E 25° 22' 26.271" N
76 86° 2' 52.779" E 25° 22' 26.800" N
77 86° 2' 55.919" E 25° 22' 28.286" N
78 86° 2' 59.130" E 25° 22' 29.661" N
79 86° 3' 2.566" E 25° 22' 30.003" N
80 86° 3' 6.014" E 25° 22' 30.172" N
TOPOGRAPHIC SURVEY REPORT PAGE 18 OF 18
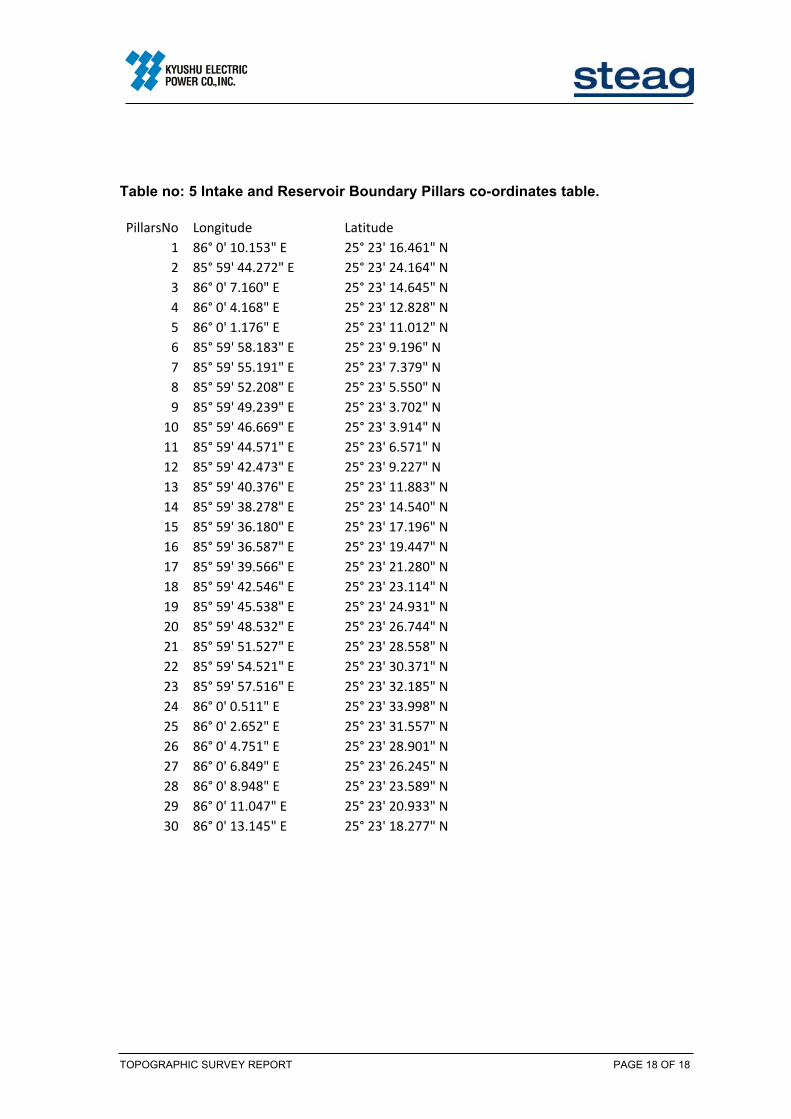
Table no: 5 Intake and Reservoir Boundary Pillars co-ordinates table. PillarsNo Longitude Latitude
1 86° 0' 10.153" E 25° 23' 16.461" N
2 85° 59' 44.272" E 25° 23' 24.164" N
3 86° 0' 7.160" E 25° 23' 14.645" N
4 86° 0' 4.168" E 25° 23' 12.828" N
5 86° 0' 1.176" E 25° 23' 11.012" N
6 85° 59' 58.183" E 25° 23' 9.196" N
7 85° 59' 55.191" E 25° 23' 7.379" N
8 85° 59' 52.208" E 25° 23' 5.550" N
9 85° 59' 49.239" E 25° 23' 3.702" N
10 85° 59' 46.669" E 25° 23' 3.914" N
11 85° 59' 44.571" E 25° 23' 6.571" N
12 85° 59' 42.473" E 25° 23' 9.227" N
13 85° 59' 40.376" E 25° 23' 11.883" N
14 85° 59' 38.278" E 25° 23' 14.540" N
15 85° 59' 36.180" E 25° 23' 17.196" N
16 85° 59' 36.587" E 25° 23' 19.447" N
17 85° 59' 39.566" E 25° 23' 21.280" N
18 85° 59' 42.546" E 25° 23' 23.114" N
19 85° 59' 45.538" E 25° 23' 24.931" N
20 85° 59' 48.532" E 25° 23' 26.744" N
21 85° 59' 51.527" E 25° 23' 28.558" N
22 85° 59' 54.521" E 25° 23' 30.371" N
23 85° 59' 57.516" E 25° 23' 32.185" N
24 86° 0' 0.511" E 25° 23' 33.998" N
25 86° 0' 2.652" E 25° 23' 31.557" N
26 86° 0' 4.751" E 25° 23' 28.901" N
27 86° 0' 6.849" E 25° 23' 26.245" N
28 86° 0' 8.948" E 25° 23' 23.589" N
29 86° 0' 11.047" E 25° 23' 20.933" N
30 86° 0' 13.145" E 25° 23' 18.277" N

X: 398968.418489893Y: 2808517.792626
X: 399428.512649134Y: 2808819.5673193
X: 399315.358061027Y: 2808029.17944644
X: 399086.247563679Y: 2807876.32943658
X: 398826.219437616Y: 2808423.16497589
X: 399773.911373948Y: 2808330.66520443
X: 399057.2538004Y: 2807856.78401831
X: 398711.299760331Y: 2808346.78222102
3.5771(Hectares) Ganga River
4142
43
44
40.5
41.542.5
43.5
44.5
38
37
39
37.5
38.5
40
36
39.5
36.5
35.5
394035.5
39
39
38
39.5
38.5
38
40
36.5
37
3740
38.5
39
37
41
38
35.5
36
39.5
40
40
39.5
39
42.5
41.5
35.5
39.5
37.5
37.543
39
40.5
37
38.5
40.5
40
40
38
39
40
36.5
4039
38
38
40
39.5
38.5
37
35.5
39.5
40
35.5
40
39.5
36.5
38.5
36
36
38.5
38
36.5
36.5
37
37
36.5
39
38.5
36
39
38
38
38.5
42
37.5
38.5
39.5
38
37
39
39
38.5
38.5
39.5
37
39
40
39
37.5
36
38
39.5
36.5
8
7
6
5
4
3
1
28
27
26
2523
22
21
20
19
18
16
15
14
13
12
11
10
X: 398977.313927315Y: 2808321.5782368
Z: 38.838
X: 399368.142423859Y: 2808577.10936536
Z: 38.357
X: 399343.230065531Y: 2808503.16664767
Z: 38.246
X: 399053.862718277Y: 2808370.11621712
Z: 38.231X: 399056.200518732Y: 2808369.83128898
Z: 38.353
398800
398800
399000
399000
399200
399200
399400
399400
399600
399600
399800
3998002807
400
2807
400
2807
600
2807
600
2807
800
2807
800
2808
000
2808
000
2808
200
2808
200
2808
400
2808
400
2808
600
2808
600
2808
800
2808
800
CONTOUR & GROUND DETAIL DATA OF INTAKE & RESERVOIR AREA
Steag Energy Services (India) Pvt. Ltd.
Barauni Coal Fire Super Critical Thermal Power Plant Unit10Bihar State Power Generation Corporation Limited
Checked By Drawn By: Date:Kyushu Electric Power Co.Inc.
Project TitleOwnerPrepared byConsultant
0 19095Meters
LegendContourProject_BoundarySurvey_BoundaryKhasara_PointVegetationSettlementBoundary_CornerPillarTube_WellBench_MarkIBCFencingPipe_LineRoadRiver
IBC-1:X-399001.330806 Y-2808360.22921
Z-38.182IBC-2:X-399026.393579 Y-2808311.21746
Z-38.148IBC-3:X-399055.173410 Y-2808256.61569
Z-38.223

4142
43
44
40.5
41.542.5
43.5
44.5
38
37
39
37.5
38.5
40
36
39.5
36.5
35.5
3940
35.5
39
39
38
39.5
38.5
38
40
36.5
37
37
38.5
40
38.5
39
37
41
38
35.5
36
39.5
40
40
39.5
39
42.5
41.5
35.5
39.5
37.5
37.543
39
40.5
37
38.5
40.5
40
40
38
39
40
36.5
4039
38
38
40
39.5
38.5
3735.5
39.5
40
35.5
40
39.5
36.5
38.5
36
36
38.5
38
36.5
37
37
36.5
39
38.5
36
39
38
38
38.5
42
37.5
38.5
39.5
38
37
39
39
38.5
38.5
39.5
37
39
40
39
37.5
36
38
39.5
36.5
398800
398800
399000
399000
399200
399200
399400
399400
399600
399600
399800
3998002807
400
2807
400
2807
600
2807
600
2807
800
2807
800
2808
000
2808
000
2808
200
2808
200
2808
400
2808
400
2808
600
2808
600
2808
800
2808
800
CONTOUR PLAN & ROAD MAPS OF INTAKE & RESERVOIR AREA
Steag Energy Services (India) Pvt. Ltd.
Barauni Coal Fire Super Critical Thermal Power Plant Unit10Bihar State Power Generation Corporation Limited
Checked By Drawn By: Date:Kyushu Electric Power Co.Inc.
Project TitleOwnerPrepared byConsultant
0 19095Meters
LegendContourRoadProject_BoundarySurvey_Boundary

X: 398968.418489893Y: 2808517.792626
X: 399428.512649134Y: 2808819.5673193
X: 399315.358061027Y: 2808029.17944644
X: 399086.247563679Y: 2807876.32943658
X: 398826.219437616Y: 2808423.16497589
X: 399773.911373948Y: 2808330.66520443
X: 399057.2538004Y: 2807856.78401831
X: 398711.299760331Y: 2808346.78222102
3.5771(Hectares) Ganga River
4142
43
44
40.5
41.542.5
43.5
44.5
38
37
39
37.5
38.5
40
36
39.5
36.5
35.5
394035.5
39
39
38
39.5
38.5
38
40
36.5
37
3740
38.5
39
37
41
38
35.5
36
39.5
40
40
39.5
39
42.5
41.5
35.5
39.5
37.5
37.543
39
40.5
37
38.5
40.5
40
40
38
39
40
36.5
4039
38
38
40
39.5
38.5
37
35.5
39.5
40
35.5
40
39.5
36.5
38.5
36
36
38.5
38
36.5
36.5
37
37
36.5
39
38.5
36
39
38
38
38.5
42
37.5
38.5
39.5
38
37
39
39
38.5
38.5
39.5
37
39
40
39
37.5
36
38
39.5
36.5
8
7
6
5
4
3
1
28
27
26
2523
22
21
20
19
18
16
15
14
13
12
11
10
X: 398977.313927315Y: 2808321.5782368
Z: 38.838
X: 399368.142423859Y: 2808577.10936536
Z: 38.357
X: 399343.230065531Y: 2808503.16664767
Z: 38.246
X: 399053.862718277Y: 2808370.11621712
Z: 38.231X: 399056.200518732Y: 2808369.83128898
Z: 38.353
398800
398800
399000
399000
399200
399200
399400
399400
399600
399600
399800
3998002807
400
2807
400
2807
600
2807
600
2807
800
2807
800
2808
000
2808
000
2808
200
2808
200
2808
400
2808
400
2808
600
2808
600
2808
800
2808
800
CONTOUR & GROUND DETAIL DATA OF INTAKE & RESERVOIR AREA
Steag Energy Services (India) Pvt. Ltd.
Barauni Coal Fire Super Critical Thermal Power Plant Unit10Bihar State Power Generation Corporation Limited
Checked By Drawn By: Date:Kyushu Electric Power Co.Inc.
Project TitleOwnerPrepared byConsultant
0 19095Meters
LegendContourProject_BoundarySurvey_BoundaryKhasara_PointVegetationSettlementBoundary_CornerPillarTube_WellBench_MarkIBCFencingPipe_LineRoadRiver
IBC-1:X-399001.330806 Y-2808360.22921
Z-38.182IBC-2:X-399026.393579 Y-2808311.21746
Z-38.148IBC-3:X-399055.173410 Y-2808256.61569
Z-38.223

X: 398968.418489893Y: 2808517.792626
X: 399428.512649134Y: 2808819.5673193
X: 399315.358061027Y: 2808029.17944644
X: 399086.247563679Y: 2807876.32943658
X: 398826.219437616Y: 2808423.16497589
X: 399773.911373948Y: 2808330.66520443
X: 399057.2538004Y: 2807856.78401831
X: 398711.299760331Y: 2808346.78222102
3.5771(Hectares) Ganga River
4142
43
44
40.5
41.542.5
43.5
44.5
38
37
39
37.5
38.5
40
36
39.5
36.5
35.5
394035.5
39
39
38
39.5
38.5
38
40
36.5
37
3740
38.5
39
37
41
38
35.5
36
39.5
40
40
39.5
39
42.5
41.5
35.5
39.5
37.5
37.543
39
40.5
37
38.5
40.5
40
40
38
39
40
36.5
4039
38
38
40
39.5
38.5
37
35.5
39.5
40
35.5
40
39.5
36.5
38.5
36
36
38.5
38
36.5
36.5
37
37
36.5
39
38.5
36
39
38
38
38.5
42
37.5
38.5
39.5
38
37
39
39
38.5
38.5
39.5
37
39
40
39
37.5
36
38
39.5
36.5
8
7
6
5
4
3
1
28
27
26
2523
22
21
20
19
18
16
15
14
13
12
11
10
X: 398977.313927315Y: 2808321.5782368
Z: 38.838
X: 399368.142423859Y: 2808577.10936536
Z: 38.357
X: 399343.230065531Y: 2808503.16664767
Z: 38.246
X: 399053.862718277Y: 2808370.11621712
Z: 38.231X: 399056.200518732Y: 2808369.83128898
Z: 38.353
398800
398800
399000
399000
399200
399200
399400
399400
399600
399600
399800
3998002807
400
2807
400
2807
600
2807
600
2807
800
2807
800
2808
000
2808
000
2808
200
2808
200
2808
400
2808
400
2808
600
2808
600
2808
800
2808
800
SUPERIMPOSITION OF CONTOUR & GROUND DETAIL DATA OVER KHASARA OF
INTAKE & RESERVOIR AREA
Steag Energy Services (India) Pvt. Ltd.
Barauni Coal Fire Super Critical Thermal Power Plant Unit10Bihar State Power Generation Corporation Limited
Checked By Drawn By: Date:Kyushu Electric Power Co.Inc.
Project TitleOwnerPrepared byConsultant
0 19095Meters
LegendContourSurvey_BoundaryProject_BoundaryKhasara_PointVegetationSettlementBoundary_CornerPillarTube_WellBench_MarkIBCFencingPipe_LineRoadRiver
khasara_intake_site.imgRGB
Red: Layer_1Green: Layer_2Blue: Layer_3
IBC-1:X-399001.330806 Y-2808360.22921
Z-38.182IBC-2:X-399026.393579 Y-2808311.21746
Z-38.148IBC-3:X-399055.173410 Y-2808256.61569
Z-38.223

X: 405281.07971397Y: 2805089.45323631
X: 404647.969059029Y: 2806661.87883747
X: 403735.621871625Y: 2806721.78388365
X: 403309.864494695Y: 2805323.13209898
X: 405157.791701882Y: 2805399.45225964
X: 403474.106518901Y: 2805856.13329134
9
8
7
6
5
4
3
2
1
80797877
76757473
71
70
69
68
67
66
65
64
63
62
61
60
59
58
57
5655
54
53
52
51
50
49
48
47
4645
4443
42
41
40 39 38 37 36 35 34 3332 31 30 29 28 27
26
25
24
23
22
2120
19
18
17
16
15
14
13
12
11
10
X: 403715.750659827Y: 2805109.23058225
Z: 41.946236
X: 403506.172652173Y: 2805238.87130761
Z: 42.207962
X: 403480.207896821Y: 2805801.51520643
Z: 41.921631
X: 404597.967106678Y: 2806646.80495902
Z: 41.701149X: 404202.932750524Y: 2806545.44866791
Z: 41.719097
X: 403748.763985627Y: 2806651.09868519
Z: 41.682312
X: 403577.446283889Y: 2806142.68996345
Z: 41.695713
X: 404594.097005538Y: 2806815.68517771
X: 404580.455002535Y: 2804250.91405805
42
41
41.5
42.5
40.5
40.542
41.5
41
41
41
42.5
41.5
42
42
42
41.5
41.5
41
42
41.5
41
41
42
42
41.5
42.5
Banyan Tree
X: 403744.496311001Y: 2806772.02384326
X: 403287.880951807Y: 2805355.57759966
X: 405834.226762752Y: 2804328.24042613
403200
403200
403400
403400
403600
403600
403800
403800
404000
404000
404200
404200
404400
404400
404600
404600
404800
404800
405000
405000
405200
405200
405400
405400
405600
405600
405800
405800
2803
600
2803
600
2803
800
2803
800
2804
000
2804
000
2804
200
2804
200
2804
400
2804
400
2804
600
2804
600
2804
800
2804
800
2805
000
2805
000
2805
200
2805
200
2805
400
2805
400
2805
600
2805
600
2805
800
2805
800
2806
000
2806
000
2806
200
2806
200
2806
400
2806
400
2806
600
2806
600
2806
800
2806
800
2807
000
2807
000
CONTOUR & GROUND DETAIL DATA OF ASH POND AREA
Steag Energy Services (India) Pvt. Ltd.
Barauni Coal Fire Super Critical Thermal Power Plant Unit10Bihar State Power Generation Corporation Limited
Checked By Drawn By: Date:Kyushu Electric Power Co.Inc.
Project TitleOwnerPrepared byConsultant
0 225112.5Meters
LegendcontourSurvey_BoundaryKhasara_PointProject_BoundaryConcrete_BuildingSettlementVegetationBoundary_CornerPillarBoreholeBench_MarkPaved_RoadTemporary_Katcha_RoadPipe_CorridorBoundary_Line_Unit10Drainage
BM5 : X= 403420.422320214 Y =2805382.17165281
Z =42.78627BM6 : X= 403471.343938034 Y =2805452.40240944
Z =42.74264

42
4141.5
42.5
40.5
40.542
41.5
41
41
41
42.5
41.5
42
42
42
41.5
41.5
41
42 41.5
41
41
42
42
41.5
42.5
403200
403200
403400
403400
403600
403600
403800
403800
404000
404000
404200
404200
404400
404400
404600
404600
404800
404800
405000
405000
405200
405200
405400
405400
405600
405600
405800
405800
2803
600
2803
600
2803
800
2803
800
2804
000
2804
000
2804
200
2804
200
2804
400
2804
400
2804
600
2804
600
2804
800
2804
800
2805
000
2805
000
2805
200
2805
200
2805
400
2805
400
2805
600
2805
600
2805
800
2805
800
2806
000
2806
000
2806
200
2806
200
2806
400
2806
400
2806
600
2806
600
2806
800
2806
800
CONTOUR PLAN MAP OF ASH POND AREA
±
Steag Energy Services (India) Pvt. Ltd.
Barauni Coal Fire Super Critical Thermal Power Plant Unit10Bihar State Power Generation Corporation Limited
Checked By Drawn By: Date:Kyushu Electric Power Co.Inc.
Project TitleOwnerPrepared byConsultant0 225 450112.5
Meters
LegendcontourSurvey_BoundaryProject_Boundary

X: 405281.07971397Y: 2805089.45323631
X: 404647.969059029Y: 2806661.87883747
X: 403735.621871625Y: 2806721.78388365
X: 403309.864494695Y: 2805323.13209898
X: 405157.791701882Y: 2805399.45225964
X: 403474.106518901Y: 2805856.13329134
42
4141.5
42.5
40.5
40.5
42
41.5
41
41
41
42.5
41.5
42
42
42
41.5
41.5
41
42
41.5
41
41
42
42
41.5
42.5X: 404594.097005538Y: 2806815.68517771X: 403744.496311001
Y: 2806772.02384326
X: 403287.880951807Y: 2805355.57759966
X: 404580.455002535Y: 2804250.91405805
X: 405834.226762752Y: 2804328.24042613
9
8
7
6
5
4
3
2
1
7877
7675747370
69
68
67
66
65
61
60
59
58
5655
54
53
52
51
50
49
48
47
4645
4443
42
4138 37 36 35 34 33
32 31 30
26
25
24
23
22
2120
19
18
17
16
15
14
13
12
11
10
X: 403715.750659827Y: 2805109.23058225
Z: 41.946236
X: 403506.172652173Y: 2805238.87130761
Z: 42.207962
X: 403480.207896821Y: 2805801.51520643
Z: 41.921631
X: 404597.967106678Y: 2806646.80495902
Z: 41.701149
X: 404202.932750524Y: 2806545.44866791
Z: 41.719097
X: 403748.763985627Y: 2806651.09868519
Z: 41.682312
X: 403577.446283889Y: 2806142.68996345
Z: 41.695713
403200
403200
403400
403400
403600
403600
403800
403800
404000
404000
404200
404200
404400
404400
404600
404600
404800
404800
405000
405000
405200
405200
405400
405400
405600
405600
405800
405800
2803
600
2803
600
2803
800
2803
800
2804
000
2804
000
2804
200
2804
200
2804
400
2804
400
2804
600
2804
600
2804
800
2804
800
2805
000
2805
000
2805
200
2805
200
2805
400
2805
400
2805
600
2805
600
2805
800
2805
800
2806
000
2806
000
2806
200
2806
200
2806
400
2806
400
2806
600
2806
600
2806
800
2806
800
SUPERIMPOSITION OF CONTOUR& GROUND DETAIL DATA OVER KHASARA OF
ASH POND AREA
Steag Energy Services (India) Pvt. Ltd.
Barauni Coal Fire Super Critical Thermal Power Plant Unit10Bihar State Power Generation Corporation Limited
Checked By Drawn By: Date:Kyushu Electric Power Co.Inc.
Project TitleOwnerPrepared byConsultant
0 225 450112.5Meters
LegendcontourKhasara_PointSurvey_BoundaryProject_BoundarySettlementConcrete_BuildingVegetationBoundary_CornerPillarBoreholeBench_MarkPaved_RoadTemporary_Katcha_RoadDrainagePipe_CorridorBoundary_Line_Unit10
khasara_ash pond.imgRGB
Red: Layer_1Green: Layer_2Blue: Layer_3
BM5 : X= 403420.422320214 Y =2805382.17165281
Z =42.78627BM6 : X= 403471.343938034 Y =2805452.40240944
Z =42.74264

Tower4
Tower3
Tower2
Powe
r_Plan
t_Wall
41
40
4241
.5
39.5
40.5
39
38.5
41
41
41.5
41
41
42
41
4141.5
9
8
7
6
5
4
3
2
1
23
46
44
43
42
41
40
39
38
37
35
34
33
32
31
30
29
28
27
26 21
20
19
18
17
16
14
13
12
10
X: 403741.35736203Y: 2806722.80163651
X: 403824.189859718Y: 2806717.10044953
X: 402352.536994572Y: 2808511.30752543
X: 402363.507026542Y: 2808593.89105833
402100
402100
402175
402175
402250
402250
402325
402325
402400
402400
402475
402475
402550
402550
402625
402625
402700
402700
402775
402775
402850
402850
402925
402925
403000
403000
403075
403075
403150
403150
403225
403225
403300
403300
403375
403375
403450
403450
403525
403525
403600
403600
403675
403675
403750
403750
403825
403825
403900
403900
403975
403975
404050
404050
404125
4041252806
25028
0633
0
2806
33028
0640
0
2806
40028
0648
0
2806
48028
0655
0
2806
55028
0663
0
2806
63028
0670
0
2806
70028
0678
0
2806
78028
0685
0
2806
85028
0693
0
2806
93028
0700
0
2807
00028
0708
0
2807
08028
0715
0
2807
15028
0723
0
2807
23028
0730
0
2807
30028
0738
0
2807
38028
0745
0
2807
45028
0753
0
2807
53028
0760
0
2807
60028
0768
0
2807
68028
0775
0
2807
75028
0783
0
2807
83028
0790
0
2807
90028
0798
0
2807
98028
0805
0
2808
05028
0813
0
2808
13028
0820
0
2808
20028
0828
0
2808
28028
0835
0
2808
35028
0843
0
2808
43028
0850
0
2808
50028
0858
0
2808
58028
0865
0
2808
65028
0873
0
2808
73028
0880
0
2808
800
CONTOUR & GROUND DETAIL DATA OF PIPE CORRIDOR
Steag Energy Services (India) Pvt. Ltd.
Barauni Coal Fire Super Critical Thermal Power Plant Unit10Bihar State Power Generation Corporation Limited
Checked By Drawn By: Date:Kyushu Electric Power Co.Inc.
Project TitleOwnerPrepared byConsultant
0 225112.5Meters
LegendContourBroken_BridgeHT_TowerPower_Plant_WallAsh_Pond_BoundaryPillarBoundary_CornerHT_LineIOCKatcha_RoadBoundaryDrainageVegetationSettlement

41
40
4241
.5
39.5
40.5
39
38.5
41
41
41.5
41
41
42
41
4141.5
402100
402100
402175
402175
402250
402250
402325
402325
402400
402400
402475
402475
402550
402550
402625
402625
402700
402700
402775
402775
402850
402850
402925
402925
403000
403000
403075
403075
403150
403150
403225
403225
403300
403300
403375
403375
403450
403450
403525
403525
403600
403600
403675
403675
403750
403750
403825
403825
403900
403900
403975
403975
404050
404050
404125
4041252806
25028
0633
0
2806
33028
0640
0
2806
40028
0648
0
2806
48028
0655
0
2806
55028
0663
0
2806
63028
0670
0
2806
70028
0678
0
2806
78028
0685
0
2806
85028
0693
0
2806
93028
0700
0
2807
00028
0708
0
2807
08028
0715
0
2807
15028
0723
0
2807
23028
0730
0
2807
30028
0738
0
2807
38028
0745
0
2807
45028
0753
0
2807
53028
0760
0
2807
60028
0768
0
2807
68028
0775
0
2807
75028
0783
0
2807
83028
0790
0
2807
90028
0798
0
2807
98028
0805
0
2808
05028
0813
0
2808
13028
0820
0
2808
20028
0828
0
2808
28028
0835
0
2808
35028
0843
0
2808
43028
0850
0
2808
50028
0858
0
2808
58028
0865
0
2808
65028
0873
0
2808
73028
0880
0
2808
800
CONTOUR PLAN & ROAD MAPS OF PIPE CORRIDOR
Steag Energy Services (India) Pvt. Ltd.
Barauni Coal Fire Super Critical Thermal Power Plant Unit10Bihar State Power Generation Corporation Limited
Checked By Drawn By: Date:Kyushu Electric Power Co.Inc.
Project TitleOwnerPrepared byConsultant0 225112.5
Meters
LegendContourKatcha_RoadBoundary

X: 403741.35736203Y: 2806722.80163651
X: 403824.189859718Y: 2806717.10044953
X: 402352.536994572Y: 2808511.30752543
X: 402363.507026542Y: 2808593.89105833
9
8
7
6
5
4
3
2
1
23
47 48
46
45
44
43
42
41
40
39
38
37
36
35
34
33
32
31
30
29
28
27
26
25
24
22
21
20
19
18
17
16
15
14
13
12
11
10
Tower4
Tower2
Powe
r_Plan
t_Wall
41
40
4241
.5
41
4141
41
41
4141.5
402100
402100
402175
402175
402250
402250
402325
402325
402400
402400
402475
402475
402550
402550
402625
402625
402700
402700
402775
402775
402850
402850
402925
402925
403000
403000
403075
403075
403150
403150
403225
403225
403300
403300
403375
403375
403450
403450
403525
403525
403600
403600
403675
403675
403750
403750
403825
403825
403900
403900
403975
403975
404050
404050
404125
4041252806
25028
0633
0
2806
33028
0640
0
2806
40028
0648
0
2806
48028
0655
0
2806
55028
0663
0
2806
63028
0670
0
2806
70028
0678
0
2806
78028
0685
0
2806
85028
0693
0
2806
93028
0700
0
2807
00028
0708
0
2807
08028
0715
0
2807
15028
0723
0
2807
23028
0730
0
2807
30028
0738
0
2807
38028
0745
0
2807
45028
0753
0
2807
53028
0760
0
2807
60028
0768
0
2807
68028
0775
0
2807
75028
0783
0
2807
83028
0790
0
2807
90028
0798
0
2807
98028
0805
0
2808
05028
0813
0
2808
13028
0820
0
2808
20028
0828
0
2808
28028
0835
0
2808
35028
0843
0
2808
43028
0850
0
2808
50028
0858
0
2808
58028
0865
0
2808
65028
0873
0
2808
73028
0880
0
2808
800
SUPERIMPOSITION OF CONTOUR & GROUND DETAIL DATA OF PIPE CORRIDOR
Steag Energy Services (India) Pvt. Ltd.
Barauni Coal Fire Super Critical Thermal Power Plant Unit10Bihar State Power Generation Corporation Limited
Checked By Drawn By: Date:Kyushu Electric Power Co.Inc.
Project TitleOwnerPrepared byConsultant
0 225112.5Meters
LegendBoundary_CornerBroken_BridgeContourHT_TowerAsh_Pond_BoundaryPower_Plant_WallPillarHT_LineIOCKatcha_RoadBoundaryDrainageVegetationSettlement

10
20
30
40
50
25 50 75 100 125 150 175 200 225 250 275 300 325 350 375 400 425 450 475 500 525 550 575 600 625 650 675 700 725 750 775 800 825 850 875 900 925 950 975 1000 1025 1050 1075 1100 1125 1150 1175 1200 1225 1250 1275 1300 1325 1350 1375 1400 1425 1450 1475 1500 1525 1550 1575 1600 1625 1650 1675 1700 1725 1750 1775 1800 1825 1850 1875 1900 1925 1950 1975 2000 2025 2050 2075 2100 2125 2150 2175 2200 22250
Distance (Meters)
Elevation (M
)
L-SECTION MAP OF PIPE CORRIDOR
2250
Nala (Stream)

10
20
30
40
50
20 500
Distance (Meters)
Ele
va
tio
n (M
)
CROSS SECTION MAP OF PIPE CORRIDOR
10 30 40 60
10
20
30
40
50
20 500
Distance (Meters)
Ele
va
tio
n (M
)
10 30 40 60
10
20
30
40
50
20 500
Distance (Meters)
Ele
va
tio
n (M
)
10 30 40 60
10
20
30
40
50
20 500
Distance (Meters)
Ele
va
tio
n (M
)
10 30 40 60
10
20
30
40
50
20 500
Distance (Meters)
Ele
va
tio
n (M
)
10 30 40 60
10
20
30
40
50
20 500
Distance (Meters)
Ele
va
tio
n (M
)
10 30 40 60
10
20
30
40
50
20 500
Distance (Meters)
Ele
va
tio
n (M
)
10 30 40 60
10
20
30
40
50
20 500
Distance (Meters)
Ele
va
tio
n (M
)
10 30 40 60
10
20
30
40
50
20 500
Distance (Meters)
Ele
va
tio
n (M
)
10 30 40 60 707070707070707070
Distance From Ash Pond Area (65m)
Distance From Ash Pond Area (154m)Distance From Ash Pond Area (649m)
Distance From Ash Pond Area (1429m)Distance From Ash Pond Area (2030m)Distance From Ash Pond Area (2076m)Distance From Ash Pond Area (2190m)Distance From Ash Pond Area (2209m)Distance From Ash Pond Area (2264m)
Nala (Stream)

KYUSHU ELECTRIC POWER CO., INC. Proprietary Information Page 442 of 1497 © Kyushu Electric Power Co., Inc., 2016, All Rights Reserved
ANNEXURE - II
GEO-TECHNICAL INVESTIGATION / GEO-HYDROLOGICAL STUDY

GEOTECHNICAL INVESTIGATION REPORT (VOLUME-1)
FOR
ASH POND AREA
RELATED TO
THE PREPARATORY SURVEY FOR
CONSTRUCTION OF
BARAUNI SUPER CRITICAL COAL FIRED
THERMAL POWER STATION
(UNIT#10)
OF
BIHAR STATE POWER GENERATION COMPANY LTD.
CONSULTANT
STEAG Energy Services India Pvt. Ltd. (Formerly Evonik Energy Services India Ltd.)
(A wholly owned subsidiary of Steag Energy Services GmbH, Germany) A-29, Sector-16, NOIDA-201301, India

Page 2 of 15
TABLE OF CONTENTS Sheet No.
1.0 INTRODUCTION 4 1.1 Project Description 4 1.2 Purposes of Study 4 1.3 Report Format 4 1.4 Scope of Geotechnical Investigations covered in this Report (Ash Pond Area) 5
2.0 FIELD INVESTIGATIONS 5 2.1 Soil Boring 5 2.2 Groundwater 6 2.3 Field Permeability Tests 6
2.3.1 Constant Head Method 6 2.3.2 Falling Head Method 7
3.0 LABORATORY TESTS 7 4.0 GENERAL SITE CONDITIONS 8
4.1 Site Details 8 4.2 Regional Geology 8 4.3 Site Stratigraphy 8 4.4 Groundwater 9
5.0 FIELD PERMEABILITY TEST RESULTS 9 6.0 FOUNDATION ANALYSIS AND RECOMMENDATIONS 11
6.1 General 11 6.2 Liquefaction Susceptibility Assessment 11 6.3 Construction of Ash Dyke 11 6.4 Foundation Type and Depth 11 6.5 Concept for Foundation Analysis 12 6.6 Design Soil Parameters 13 6.7 Recommended Net Allowable Bearing Pressures 13 6.8 Definition of Gross and Net Bearing Pressure 14
7.0 FOUNDATION CONSTRUCTION CONSIDERATION 14 7.1 Excavation 14 7.2 Foundation Level Preparation 14 7.3 Chemical Attack 15
8.0 VARIABILITY IN SUB-SURFACE CONDITIONS 15

Page 3 of 15
LIST OF ILLUSTRATIONS
Caption Plate Satellite Image of Site and Test Locations 1 Engineering Description of Soils 2 Uncertainty in Laboratory Measurements 3 Soil Profiles 4 to 19 Summary of Borehole Profiles 20 Standard Penetration Test Results 21 to 24 Field Permeability Test 25 to 121 Grain Size Analysis 122 to 137 Shear Test Results 138 to 153 Chemical Test Results 154
Appendix A: Typical Calculations
-------------------------------------------------------
DEFINITION OF ACRONYMS USL United Spirit Limited CENGRS Cengrs Geotechnica Pvt. Ltd. UTM Universal Transverse Mercator coordinates system NABL National Accreditation Board for Testing and Calibration Laboratories ISO International Standards Organization BIS Bureau of Indian Standards EGL Existing Ground Level NGL Natural Ground Level RL Reduced Level SPT Standard Penetration Test NCEER National Center for Earthquake Engineering Research UUT Unconsolidated undrained triaxial shear test DS Consolidated drained direct shear test BIS REFERENCES
Compendium of Indian Standard on Soil Engineering (Part-2, Field Testing of Soils for Civil Engineering Purposes), SP36 (Part-2:1988)-RA 2006
Compendium of Indian Standard on Soil Engineering (Part-1, Laboratory Testing of Soils for Civil
Engineering Purposes), SP36 (Part-1:1987)-RA 2006

Page 4 of 15
1.0 INTRODUCTION
1.1 Project Description
Japan International Cooperation Agency (JICA) has appointed Kyushu Electric Power Co. INC. as a consultant, to conduct the preparatory survey on construction of the Barauni Super Critical Coal Fired Thermal Power Station. Kyushu Electric Power Co. INC has appointed M/s. STEAG Energy Services (India) Pvt. Ltd to conduct the civil construction work at site.
M/s. Cengrs Geotechnica Pvt. Ltd. (Cengrs) has been contracted by M/s. STEAG Energy
Services (India) Pvt. Ltd to carry out the geotechnical investigation for the project. The site has been divided into three different areas as detailed below:
Ash Pond Site Powerhouse Site Raw Water Intake Site
This report volume (Volume-I) presents field and laboratory test results along with our
geotechnical recommendations for the proposed pump house in ash pond area. An accompanying volume (Volume-II) presents results of the geotechnical investigation for the Powerhouse facilities & Volume-III for the Raw Water Intake area.
1.2 Purposes of Study
The overall purposes of this study are to investigate the stratigraphy at the site, and to develop geotechnical recommendations for design and construction of foundations for the Ash Pond, Powerhouse and Raw Water Intake Areas.
To accomplish these purposes, the study was conducted in the following phases: (i) drilling 8 boreholes to 20m depth in the Ash Pond area, in order to evaluate the
stratigraphy, and to collect soil and groundwater samples for laboratory testing; (ii) performing seventy three (73) field permeability tests in the Ash Pond area at eight (8)
borehole locations to assess the in-situ coefficient of permeability of the strata; (iii) drilling 6 boreholes to 40m depth in the Powerhouse area in order to evaluate the stratigraphy,
and to collect soil and groundwater samples for laboratory testing;
(iv) drilling 3 boreholes to 20m depth at the Raw Water Intake location in order to evaluate the stratigraphy, and to collect soil and groundwater samples for laboratory testing;
(v) testing selected soil and groundwater samples in the laboratory to determine pertinent index and
engineering properties; and
(vi) analyzing all field and laboratory data to develop geotechnical recommendations for foundations.
The scope of work presented in this report volume (Volume-I) consists of 8 boreholes to 20m
depth & 73 permeability tests for the proposed Ash Pond area.
1.3 Report Format This report is presented in three volumes. The scope of work included in each volume is as
described below:
Page 5 of 15
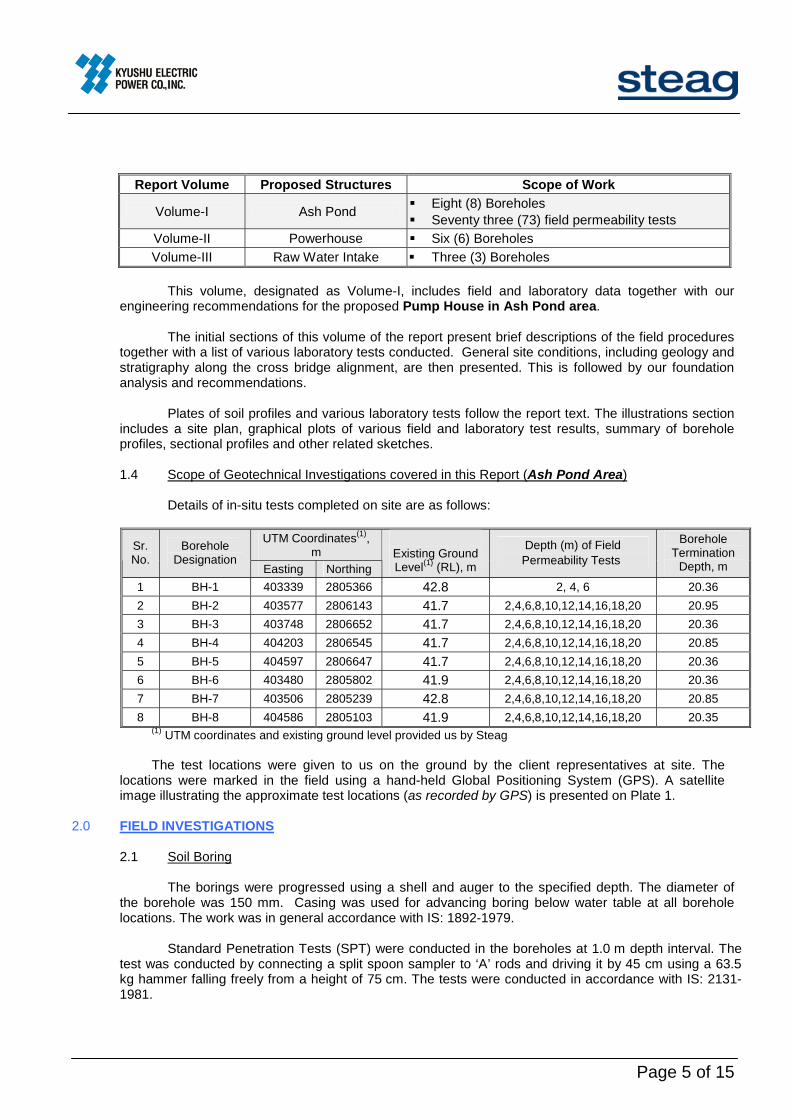
Report Volume Proposed Structures Scope of Work
Volume-I Ash Pond Eight (8) Boreholes Seventy three (73) field permeability tests
Volume-II Powerhouse Six (6) Boreholes Volume-III Raw Water Intake Three (3) Boreholes
This volume, designated as Volume-I, includes field and laboratory data together with our
engineering recommendations for the proposed Pump House in Ash Pond area. The initial sections of this volume of the report present brief descriptions of the field procedures
together with a list of various laboratory tests conducted. General site conditions, including geology and stratigraphy along the cross bridge alignment, are then presented. This is followed by our foundation analysis and recommendations.
Plates of soil profiles and various laboratory tests follow the report text. The illustrations section
includes a site plan, graphical plots of various field and laboratory test results, summary of borehole profiles, sectional profiles and other related sketches.
1.4 Scope of Geotechnical Investigations covered in this Report (Ash Pond Area)
Details of in-situ tests completed on site are as follows:
UTM Coordinates(1), m Sr.
No. Borehole
Designation Easting Northing
Existing Ground Level(1) (RL), m
Depth (m) of Field Permeability Tests
Borehole Termination
Depth, m 1 BH-1 403339 2805366 42.8 2, 4, 6 20.36 2 BH-2 403577 2806143 41.7 2,4,6,8,10,12,14,16,18,20 20.95 3 BH-3 403748 2806652 41.7 2,4,6,8,10,12,14,16,18,20 20.36 4 BH-4 404203 2806545 41.7 2,4,6,8,10,12,14,16,18,20 20.85 5 BH-5 404597 2806647 41.7 2,4,6,8,10,12,14,16,18,20 20.36 6 BH-6 403480 2805802 41.9 2,4,6,8,10,12,14,16,18,20 20.36 7 BH-7 403506 2805239 42.8 2,4,6,8,10,12,14,16,18,20 20.85 8 BH-8 404586 2805103 41.9 2,4,6,8,10,12,14,16,18,20 20.35
(1) UTM coordinates and existing ground level provided us by Steag The test locations were given to us on the ground by the client representatives at site. The
locations were marked in the field using a hand-held Global Positioning System (GPS). A satellite image illustrating the approximate test locations (as recorded by GPS) is presented on Plate 1.
2.0 FIELD INVESTIGATIONS
2.1 Soil Boring The borings were progressed using a shell and auger to the specified depth. The diameter of
the borehole was 150 mm. Casing was used for advancing boring below water table at all borehole locations. The work was in general accordance with IS: 1892-1979.
Standard Penetration Tests (SPT) were conducted in the boreholes at 1.0 m depth interval. The
test was conducted by connecting a split spoon sampler to ‘A’ rods and driving it by 45 cm using a 63.5 kg hammer falling freely from a height of 75 cm. The tests were conducted in accordance with IS: 2131-1981.

Page 6 of 15
The number of blows for each 15 cm of penetration of the split spoon sampler was recorded.
The blows required to penetrate the initial 15 cm of the split spoon for seating the sampler is ignored due to the possible presence of loose materials or cuttings from the drilling operation. Where refusal (N>100) to further penetration of the split spoon sampler is encountered in the first 15 cm seating penetration itself, SPT test could not be completed and "Ref" is indicated in the bore logs, along with the penetration achieved. The ‘N’ values are presented on the soil profile for each borehole.
Disturbed samples were collected from the split spoon after conducting SPT. The samples were preserved in transparent polythene bags. Undisturbed samples were collected by attaching 75 mm diameter thin walled `Shelby’ tubes and driving the sampler using a 63.5 kg hammer in accordance with IS: 2132-1986. The tubes were sealed with wax at both ends. All samples were transported to our NABL accredited laboratory at Noida for further examination and testing.
2.2 Groundwater
Groundwater level was measured in the boreholes after drilling and sampling was completed.
The measured water levels are recorded on the individual soil profiles.
2.3 Field Permeability Tests In soils, field permeability tests were done by constant head & falling head methods. In soils with
high permeability, constant head permeability test was performed. In soils where fines content exceeded 25-30%, falling head permeability test was performed.
2.3.1 Constant Head Method
The constant head tests were carried out in sands with high permeability accordance with IS:
5529 (Part-I) -1985 (RA 2013). The borehole was drilled to the desired depth and was casing was placed in the hole, ensuring a tight fit.
To conduct the test, a large water storage tank was kept at the ground surface. A GI pipe was
placed in the hole to the bottom of the test. The flow of the water into the hole was controlled using a valve at the connection of the tank and the pipe. The volume of water flowing into the hole was measured using a water meter.
The flow of water into the hole was regulated using the control valve so that the water does not
overflow the casing and remains at the same level. The tests were conducted at the depths specified by client.
In general, the casing extended to the bottom of the hole and the water seepage occurred through the bottom of the hole only, the following equation (In accordance with IS: 5529 (Part-I) -1985 RA 2013) was used to compute the coefficient of permeability:
⎥⎦⎤
⎢⎣⎡=
HQCk where ⎥⎦
⎤⎢⎣⎡=
rC
5.51
where: k = mean coefficient of permeability, cm/sec Q = Discharge, litre /min r = radius of casing, mm H = Differential Head, m

Page 7 of 15
2.3.2 Falling Head Method
The falling head tests were carried out in accordance with IS: 5529 (Part-I) -1985 RA 2013. The
tests were conducted in selected boreholes at the specified depths. The field coefficient of permeability was computed using the following equation;
where:
k = mean coefficient of permeability d = diameter of intake pipe (stand pipe) r = radius of hole L = length of test section h1 = head at time t1 h2 = head at time t2
3.0 LABORATORY TESTS
The laboratory testing has been carried out in our NABL accredited laboratory. The quality
procedures in our laboratory conform to ISO/IEC-17025-2005.
Laboratory tests were conducted on selected soil and groundwater samples, to determine their physical and engineering properties. The testing procedures were in accordance with current applicable IS specifications.
The following tests were conducted on selected soil and groundwater samples recovered from
the boreholes:
Name of Test IS Code No.
Bulk Density IS : 2386 (Part-3)-1963 Natural moisture content IS : 2720 (Part-2)-1973, RA-2010 Grain size analysis IS : 2720 (Part-4)-1985, RA-2010 Specific gravity IS : 2720 (Part-3)-1980, RA-2007 Liquid and plastic limits IS : 2720 (Part-5)-1985, RA-2010 Consolidated drained direct shear test IS : 2720 (Part-13)-1986, RA-2010
pH value IS : 2720 (Part 26)-1987, RA-2007 Total soluble sulphates IS : 2720 (Part-27)-1977, RA-2010 Chemical analysis of soil* Total soluble chlorides IS : 3025 (Part-32)-1988, RA-2009 pH value IS : 3025 (Part-11)-1983, RA-2006 Total soluble sulphates IS : 3025 (Part-24)-1986, RA-2009 Chemical analysis of
water* Total soluble chlorides IS : 3025 (Part-32)-1988, RA-2009
* Outside NABL Scope Engineering terms used to describe soils are explained on Plate 2. A note on our NABL
accreditation together with the uncertainty in laboratory measurements is presented on Plate 3.
)()/(ll
nn
12212
8 tthh
rL
Ldk
−⎟⎠⎞
⎜⎝⎛=

Page 8 of 15
4.0 GENERAL SITE CONDITIONS
4.1 Site Details
The site located in Barauni district, Bihar. Rajendra pul railway Station is located about 2.5 k m west of the site. The site is open land and fairly level.
4.2 Regional Geology
The deposits in the project area belong to the Indo-Gangetic alluvium (1). The alluvial tract is of
the nature of a synclinal basin formed concomitantly with the elevation of the Himalaya to its North. The Indo-Gangetic depression was formed in the later stages of Himalayan Orogeny when the
Indian shield under-thrust the Asian continent. The well-consolidated crust of the shield became engulfed under the light, soft, moist sediments. As the northward drift of India continued, the more consolidated and metamorphosed older strata and the granitic magmas intrusive into them slid southwards, impelled partly by gravity and partly by compressive force.
The Pleistocene and recent deposits covering the Indo-Gangetic Basin are upto 1,000 m thick.
They are composed of gravels, sands and clays with remains of animals and plants. The older alluvium (called Bhangar) is rather dark colored and generally rich in concretions and
nodules of impure calcium carbonate (kankar). It is of Middle to Upper Pleistocene age. The Newer alluvium (called Khadar) is light colored and poor in calcareous matter. It contains
lenticular beds of sand and gravel and peat beds. It merges by insensible gradations into the recent or deltaic alluvia and should be assigned an Upper Pleistocene to Recent age.
4.3 Site Stratigraphy
The stratigraphy at site may be divided into two (2) generalized strata as described below:
Stratum – I (Sandy silt silt): A medium dense surficial sandy silt layer is present all over the site to about 0.5-2.0 m depth (RL 39.9-42.2 m). Stratum – II (Medium dense to very dense silty fine sand / fine sand): Stratum-II consists of loose to very dense silty fine sand / fine sand to the maximum explored depth of 20 m (RL 37.7 m). The field SPT values generally range from 10 to 19 to about 4 m depth (RL 37.7 m) and 20 to 30 to 8 m depth (RL 33.7 m). Below this, SPT values range from 26 to 42 to about 12 m depth (RL 29.7 m). SPT values then range from 36 to 58 to 16 m depth (RL 25.7 m). In the underlying soils, the SPT values range from 51 to refusal (N>100) to the final explored depth of 20 m (RL 37.7 m). In this stratum, bulk density values range from 1.80 g/cm3 to 1.87 g/cm3 and moisture content values range from 13.3 % to 18.5 %.
Detailed description of the soil encountered at the borehole locations are presented on the individual soil profiles in Plate 4 to 19. A pictorial summary of the borehole profiles is illustrated on Plate 20. Plots of field and corrected SPT values versus depth are presented on Plate 21 to 24.
(1) Krishnan, M.S. (1982), “Geology of India and Burma”, CBS Publishers & Distributors, Delhi, Sixth
Edition.

Page 9 of 15
4.4 Groundwater
Based on the field data of eight (8) completed boreholes, groundwater was met at 7.0-7.1 m depth during the period of our field investigation (June-July, 2015). Fluctuations may occur in the measured water levels due to seasonal variations in rainfall and surface evaporation rates.
5.0 FIELD PERMEABILITY TEST RESULTS
Seventy three (73) field permeability tests have been conducted in the boreholes at depths as
specified by client. The tests were conducted by constant head method in soils with high permeability. In soils with more than 25-35% fines and where some clay is present, falling head permeability test was performed. The decision regarding conducting falling head or constant head test was taken on site after visual assessment of soil gradation by our site engineer.
Field permeability results are presented on Plate 25 to 121.The test results are summarized
below together with the soil classification and fines content:
S. No. Test Designation
Borehole Location
Test Depth below EGL,
m Soil
Classification Fines
Content, % Coefficient of Permeability
(k), cm/s Test Method
1 FPT-1 2.00 Silty fine sand 38 7.8 X 10⁻⁵ Falling Head 2 FPT-2 4.00 Silty fine sand 22 1.0 X 10⁻⁴ Falling Head 3 FPT-3
BH-1 6.00 Silty fine sand 14 2.6 X 10⁻⁴ Falling Head
4 FPT-4 2.00 Silty fine sand 20 4.6 X 10⁻⁴ Falling Head 5 FPT-5 4.00 Silty fine sand 20 1.2 X 10⁻⁴ Falling Head 6 FPT-6 6.00 Fine sand 14 1.2 X 10⁻⁵ Falling Head 7 FPT-7 8.00 Fine sand 5 8.6 X 10⁻³ Constant Head 8 FPT-8 10.00 Fine sand 5 1.5 X 10⁻² Constant Head 9 FPT-9 12.00 Fine sand 4 1.8 X 10⁻² Constant Head 10 FPT-10 14.00 Fine sand 7 2.3 X 10⁻² Constant Head 11 FPT-11 16.00 Fine sand 2 1.8 X 10⁻² Constant Head 12 FPT-12 18.00 Fine sand 2 1.2 X 10⁻² Constant Head 13 FPT-13
BH-2
20.00 Fine sand 2 9.6 X 10⁻³ Constant Head 14 FPT-14 2.00 Silty fine sand 39 3.2 X 10⁻⁴ Falling Head 15 FPT-15 4.00 Silty fine sand 16 4.7 X 10⁻⁴ Falling Head 16 FPT-16 6.00 Silty fine sand 40 6.0 X 10⁻⁴ Falling Head 17 FPT-17 8.00 Silty fine sand 19 1.1 X 10⁻¹ Constant Head 18 FPT-18 10.00 Fine sand 5 1.3 X 10⁻² Constant Head 19 FPT-19 12.00 Fine sand 5 6.6 X 10⁻² Constant Head 20 FPT-20 14.00 Fine sand 18 6.7 X 10⁻² Constant Head 21 FPT-21 16.00 Fine sand 1 5.5 X 10⁻² Constant Head 22 FPT-22 18.00 Fine sand 1 5.3 X 10⁻² Constant Head 23 FPT-23
BH-3
20.00 Fine sand 1 5.3 X 10⁻² Constant Head 24 FPT-24 2.00 Silty fine sand 44 1.1 X 10⁻³ Falling Head 25 FPT-25 4.00 Silty fine sand 44 4.7 X 10⁻⁴ Falling Head 26 FPT-26 6.00 Silty fine sand 42 1.7 X 10⁻⁴ Falling Head 27 FPT-27 8.00 Fine sand 8 1.1 X 10⁻¹ Constant Head 28 FPT-28 10.00 Fine sand 8 8.7 X 10⁻² Constant Head 29 FPT-29 12.00 Fine sand 1 6.1 X 10⁻² Constant Head 30 FPT-30 14.00 Fine sand 1 1.0 X 10⁻¹ Constant Head 31 FPT-31 16.00 Fine sand 5 6.7 X 10⁻² Constant Head 32 FPT-32 18.00 Fine sand 2 7.1 X 10⁻² Constant Head 33 FPT-33
BH-4
20.00 Fine sand 2 4.8 X 10⁻² Constant Head

Page 10 of 15
S. No. Test Designation
Borehole Location
Test Depth below EGL,
m Soil
Classification Fines
Content, % Coefficient of Permeability
(k), cm/s Test Method
34 FPT-34 2.00 Silty fine sand 38 2.5 X 10⁻⁴ Falling Head 35 FPT-35 4.00 Silty fine sand 38 8.3 X 10⁻⁴ Falling Head 36 FPT-36 6.00 Silty fine sand 38 2.8 X 10⁻⁴ Falling Head 37 FPT-37 8.00 Fine sand 3 1.2 X 10⁻¹ Constant Head 38 FPT-38 10.00 Fine sand 3 8.9 X 10⁻² Constant Head 39 FPT-39 12.00 Fine sand 4 5.3 X 10⁻² Constant Head 40 FPT-40 14.00 Fine sand 4 1.3 X 10⁻¹ Constant Head 41 FPT-41 16.00 Fine sand 4 8.4 X 10⁻² Constant Head 42 FPT-42 18.00 Fine sand 4 6.8 X 10⁻² Constant Head 43 FPT-43
BH-5
20.00 Fine sand 4 4.8 X 10⁻² Constant Head 44 FPT-44 2.00 Clayey Silt 80 2.7 X 10⁻⁴ Falling Head 45 FPT-45 4.00 Silty fine sand 36 3.6 X 10⁻⁴ Falling Head 46 FPT-46 6.00 Silty fine sand 20 1.1 X 10⁻³ Falling Head 47 FPT-47 8.00 Fine sand 3 6.3 X 10⁻² Constant Head 48 FPT-48 10.00 Fine sand 3 2.2 X 10⁻² Constant Head 49 FPT-49 12.00 Fine sand 3 6.7 X 10⁻² Constant Head 50 FPT-50 14.00 Fine sand 3 3.6 X 10⁻² Constant Head 51 FPT-51 16.00 Fine sand 3 3.1 X 10⁻² Constant Head 52 FPT-52 18.00 Fine sand 2 2.6 X 10⁻² Constant Head 53 FPT-53
BH-6
20.00 Fine sand 2 3.3 X 10⁻² Constant Head 54 FPT-54 2.00 Silty fine sand 49 4.2 X 10⁻⁴ Falling Head 55 FPT-55 4.00 Silty fine sand 49 2.7 X 10⁻⁴ Falling Head 56 FPT-56 6.00 Silty fine sand 36 7.5 X 10⁻⁴ Falling Head 57 FPT-57 8.00 Silty fine sand 15 6.5 X 10⁻² Constant Head 58 FPT-58 10.00 Fine sand 11 2.6 X 10⁻² Constant Head 59 FPT-59 12.00 Silty fine sand 35 7.9 X 10⁻² Constant Head 60 FPT-60 14.00 Fine sand 9 4.3 X 10⁻² Constant Head 61 FPT-61 16.00 Fine sand 9 4.6 X 10⁻² Constant Head 62 FPT-62 18.00 Fine sand 9 4.5 X 10⁻² Constant Head 63 FPT-63
BH-7
20.00 Fine sand 9 4.2 X 10⁻² Constant Head 64 FPT-64 2.00 Sandy silt 19 6.6 X 10⁻⁴ Falling Head 65 FPT-65 4.00 Silty fine sand 36 4.0 X 10⁻⁴ Falling Head 66 FPT-66 6.00 Silty fine sand 19 1.0 X 10⁻³ Falling Head 67 FPT-67 8.00 Silty fine sand 19 9.4 X 10⁻² Constant Head 68 FPT-68 10.00 Silty fine sand 19 8.2 X 10⁻² Constant Head 69 FPT-69 12.00 Silty fine sand 21 1.1 X 10⁻¹ Constant Head 70 FPT-70 14.00 Silty fine sand 21 8.4 X 10⁻² Constant Head 71 FPT-71 16.00 Silty fine sand 21 7.3 X 10⁻² Constant Head 72 FPT-72 18.00 Silty fine sand 21 5.9 X 10⁻² Constant Head 73 FPT-73
BH-8
20.00 Silty fine sand 21 4.3 X 10⁻² Constant Head
The lower permeabilities are in soils with higher fines content and in samples containing some quantity of clay.

Page 11 of 15
6.0 FOUNDATION ANALYSIS AND RECOMMENDATIONS
6.1 General
A suitable foundation for any structure should have an adequate factor of safety against exceeding the bearing capacity of the supporting soils. Also the vertical movements due to compression of the soils should be within tolerable limits for the structure. We consider that foundations designed in accordance with the recommendations herein will satisfy these criteria.
6.2 Liquefaction Susceptibility Assessment
Liquefaction is defined as the transformation of a granular material from a solid to a liquefied
state as a consequence of increased pore-water pressure and reduced effective stress (Marcuson, 19782). Increased pore pressure may be induced by the tendency of granular materials to compact when subjected to cyclic shear deformation, such as in the event of an earthquake.
As per IS: 1893 (Part 1) - 2002, liquefaction is likely in loose fine sand (SP) below the water
table. The following issues are highlighted below with regard to liquefaction potential in the Ash Pond area:
1. The natural soils at the site consist of sandy silt from ground level to 0.5-2.0 m depth. This is
underlain by silty fine sand/ fine sand to the maximum explored depth of 20 m.
2. Groundwater was met at depth of about 7.0- 7.1 m depth below EGL.
3. SPT values indicate soils are in medium dense to dense conditions below water table. Reviewing the site conditions, we are of the opinion that the soils at this site are not likely to
liquefy in the event of an earthquake. According Fig. 2 of IS: 1893 (Part-1)-2002 showing seismic zones, the project site falls under Zone-IV. The design for seismic forces should be done considering the project site in Zone- IV.
6.3 Construction of Ash Dyke
The ash dyke is planned to have a height of 18 m. We suggest that a clay core with an outer shell of sand be used to construct the dyke. In general, we suggest slopes of 1-vertical on 2.5-3.5-horizontal for the dyke with 3-4 m wide horizontal berms at every 4-5 m height. A slope stability analysis should be done to ensure a safety factor of not less than 1.5.
To limit seepage of the water into the ground, HDPE / LDPE lining is suitable. Other materials
such as geotextile clay liners are also suitable. The overlap / joint between adjacent sheets should be checked carefully for any leakage.
6.4 Foundation Type and Depth
Open foundation may be used to support the structural loads of foundations of the proposed ash
dyke. Our recommended values of net allowable bearing pressures for open foundations bearing at 1.5 – 3.0 m embedment depth are presented in Section 6.6.
(2) Marcuson, W.F. (III) (1978), “Definition of terms related to liquefaction”, J. Geotech Engg. Div,, ASCE, 104(9), 1197-
1200.

Page 12 of 15
Ash pond is generally built using a ring embankment to enclose the disposal site. For the design
process primarily focus is on handling seepage and ensuring slope stability.
6.5 Concept for Foundation Analysis
Bearing capacity analysis for open foundations has been done in general accordance with IS: 6403-1981.
The bearing capacity equation used is as follows:
qnet safe = 1 [cNcζc dc+ q(Nq-1) ζqdq+ 0.5 Bϒ Nγζγ dϒ Rw]
F Where: qnet safe = safe net bearing capacity of soil based on the shear failure criterion. q = overburden pressure Rw = water table correction factor, F = Factor of safety, taken as equal to 2.5 in accordance with IS:1904-1986. ζc,ζq,ζγ = Shape factors. For Strip footings, ζc = ζq = ζγ = 1 For Square footing, ζc = 1.3, ζq = 1.2, ζγ = 0.6 dc ,dq, dγ = Depth factors
For φ ≤ 10, dc = 1 + 0.2 tan (45 + φ / 2) D / B, dq = dγ = 1 For φ > 10, dq = dγ = 1 + 0.1 tan (45 + φ / 2) D / B
Appropriate values have been substituted into the bearing capacity equation given above to compute the safe net bearing capacity. The values have been checked to determine the settlement of the foundation under the safe bearing pressure. The allowable bearing pressure has been taken as the lower of the two values computed from the bearing capacity shear failure criterion as well as that computed from the tolerable settlement criterion.
Settlement analysis has been performed based on SPT values in accordance with Clause 9.1.4
of IS 8009 (Part 1) - 1976 Fig.9. The values have been cross checked with the classical theory as the sum of immediate settlement and consolidation settlement. Since sand is primarily encountered, consolidation is not likely to occur. Thus the total settlement is equal to the immediate settlement, which is computed using the following equation [Clause 9.2.3 of IS 8009 Part 1-1976](3):
Si =
qB ' (1 − μ 2 )E
Idf dr where: Si = immediate (elastic) settlement B = foundation width, B’ = B/2
μ = Poisson’s ratio q = applied bearing pressure E = modulus of elasticity df = depth factor dr = rigidity factor I = influence factor at corner of rectangular loaded area (B’x L’)
(3) Bowles, J.E. (1996), “Foundation Analysis and Design”, International Edition, pp. 303-317.

Page 13 of 15
6.6 Design Soil Parameters
Soil parameters used for foundation analysis based on shear criterion are as follows:
Bearing Capacity Factors Foundation Depth below
EGL c,
T/m2 φ° Nc Nq Nγ’ Nc
’ Nq’ Nγ
’ Failure Criterion
Used for Analysis
1.5-3.0 0 30 30.14 18.40 22.40 15.87 7.11 6.24 Average of Local and General Shear Failure
where: c = cohesion intercept
φ = angle of internal friction Nc, Nq, Nγ = bearing capacity factors (General Shear Failure Criterion) Nc
’, Nq’, Nγ
’ = bearing capacity factors (Local Shear Failure Criterion)
Reviewing the soil characteristics, the following soil parameters have been selected for foundation settlement analysis:
Depth, m
From To Stratigraphy c, T/m2 φ γ, T/m3 E, T/m2 0.0 1.5 Sandy silt 1.70 650 1.5 4.0 Silty fine sand 0 30 1.80 1000 4.0 8.0 Silty fine sand 0 31 1.85 1200 8.0 12.0 Silty fine sand 0 31 1.90 1600
12.0 20.0 Silty fine sand 0 32 2.00 2800 where:
c = cohesion intercept φ = angle of internal friction γ = bulk density E = modulus of elasticity4
6.7 Recommended Net Allowable Bearing Pressures
The following table presents our recommended net allowable bearing pressures for open
foundations in the ash dyke area:
Recommended Net Allowable Bearing Pressure, T/m2 Foundation Embedment
Depth below EGL, m Total Settlement = 25 mm
Total Settlement = 40 mm
Suggested Modulus of Subgrade Reaction, kN/m3
1.5 9.0 14.4 3600 3.0 13.0 20.8 5200
The above recommended values include a bearing capacity safety factor of 2.5. The appropriate
value of net bearing pressure may be selected as per the permissible settlement criterion. Net bearing pressure for foundations at intermediate depths may be interpolated linearly between the values given above. Fill placed above EGL should be treated as surcharge load.
4 estimated based on empirical correlations with SPT N-values
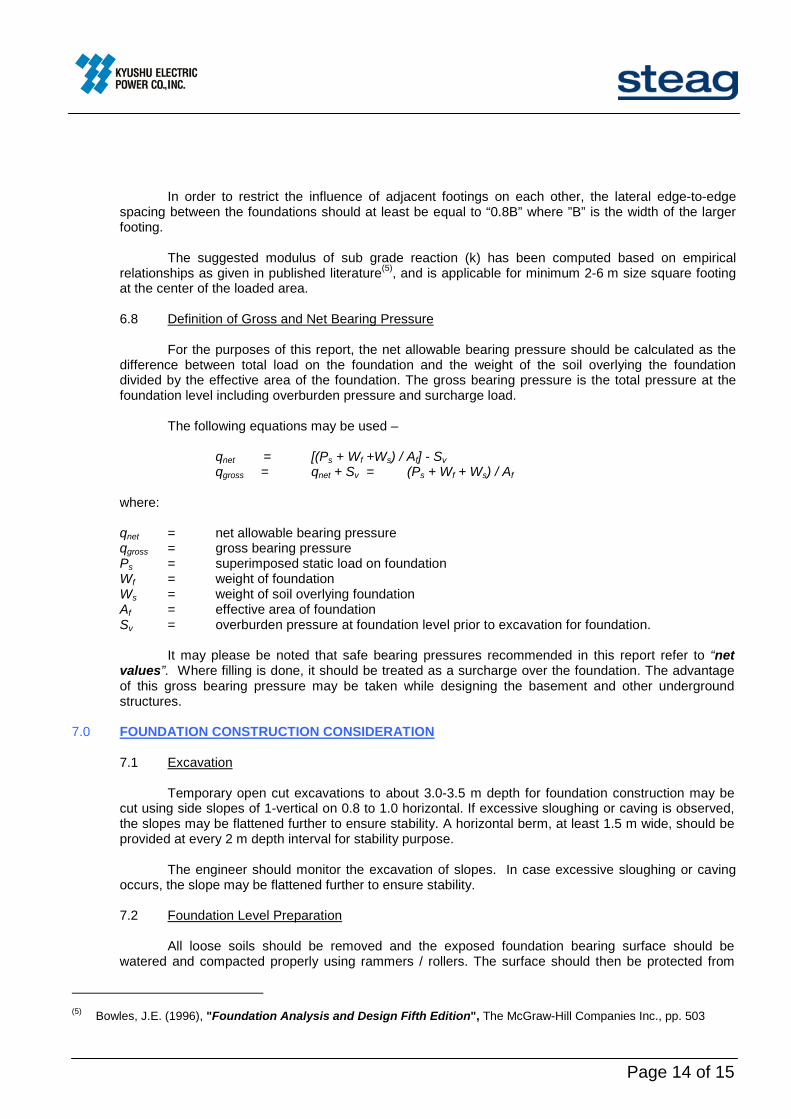
Page 14 of 15
In order to restrict the influence of adjacent footings on each other, the lateral edge-to-edge
spacing between the foundations should at least be equal to “0.8B” where ”B” is the width of the larger footing.
The suggested modulus of sub grade reaction (k) has been computed based on empirical
relationships as given in published literature(5), and is applicable for minimum 2-6 m size square footing at the center of the loaded area.
6.8 Definition of Gross and Net Bearing Pressure
For the purposes of this report, the net allowable bearing pressure should be calculated as the
difference between total load on the foundation and the weight of the soil overlying the foundation divided by the effective area of the foundation. The gross bearing pressure is the total pressure at the foundation level including overburden pressure and surcharge load.
The following equations may be used –
qnet = [(Ps + Wf +Ws) / Af] - Sv qgross = qnet + Sv = (Ps + Wf + Ws) / Af
where: qnet = net allowable bearing pressure qgross = gross bearing pressure
Ps = superimposed static load on foundation Wf = weight of foundation Ws = weight of soil overlying foundation Af = effective area of foundation Sv = overburden pressure at foundation level prior to excavation for foundation.
It may please be noted that safe bearing pressures recommended in this report refer to “net
values”. Where filling is done, it should be treated as a surcharge over the foundation. The advantage of this gross bearing pressure may be taken while designing the basement and other underground structures.
7.0 FOUNDATION CONSTRUCTION CONSIDERATION
7.1 Excavation Temporary open cut excavations to about 3.0-3.5 m depth for foundation construction may be
cut using side slopes of 1-vertical on 0.8 to 1.0 horizontal. If excessive sloughing or caving is observed, the slopes may be flattened further to ensure stability. A horizontal berm, at least 1.5 m wide, should be provided at every 2 m depth interval for stability purpose.
The engineer should monitor the excavation of slopes. In case excessive sloughing or caving
occurs, the slope may be flattened further to ensure stability.
7.2 Foundation Level Preparation All loose soils should be removed and the exposed foundation bearing surface should be
watered and compacted properly using rammers / rollers. The surface should then be protected from (5) Bowles, J.E. (1996), "Foundation Analysis and Design Fifth Edition", The McGraw-Hill Companies Inc., pp. 503
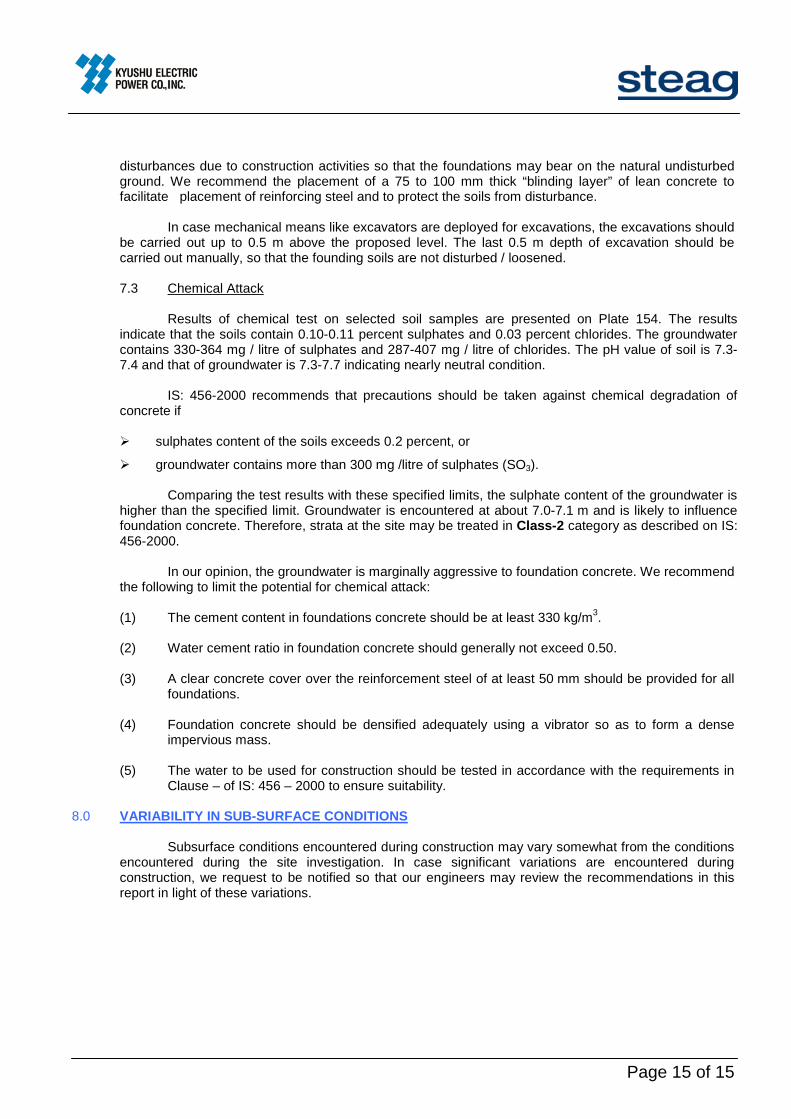
Page 15 of 15
disturbances due to construction activities so that the foundations may bear on the natural undisturbed ground. We recommend the placement of a 75 to 100 mm thick “blinding layer” of lean concrete to facilitate placement of reinforcing steel and to protect the soils from disturbance.
In case mechanical means like excavators are deployed for excavations, the excavations should
be carried out up to 0.5 m above the proposed level. The last 0.5 m depth of excavation should be carried out manually, so that the founding soils are not disturbed / loosened.
7.3 Chemical Attack
Results of chemical test on selected soil samples are presented on Plate 154. The results
indicate that the soils contain 0.10-0.11 percent sulphates and 0.03 percent chlorides. The groundwater contains 330-364 mg / litre of sulphates and 287-407 mg / litre of chlorides. The pH value of soil is 7.3-7.4 and that of groundwater is 7.3-7.7 indicating nearly neutral condition.
IS: 456-2000 recommends that precautions should be taken against chemical degradation of
concrete if
sulphates content of the soils exceeds 0.2 percent, or groundwater contains more than 300 mg /litre of sulphates (SO3).
Comparing the test results with these specified limits, the sulphate content of the groundwater is
higher than the specified limit. Groundwater is encountered at about 7.0-7.1 m and is likely to influence foundation concrete. Therefore, strata at the site may be treated in Class-2 category as described on IS: 456-2000.
In our opinion, the groundwater is marginally aggressive to foundation concrete. We recommend
the following to limit the potential for chemical attack: (1) The cement content in foundations concrete should be at least 330 kg/m3. (2) Water cement ratio in foundation concrete should generally not exceed 0.50. (3) A clear concrete cover over the reinforcement steel of at least 50 mm should be provided for all
foundations. (4) Foundation concrete should be densified adequately using a vibrator so as to form a dense
impervious mass. (5) The water to be used for construction should be tested in accordance with the requirements in
Clause – of IS: 456 – 2000 to ensure suitability.
8.0 VARIABILITY IN SUB-SURFACE CONDITIONS
Subsurface conditions encountered during construction may vary somewhat from the conditions encountered during the site investigation. In case significant variations are encountered during construction, we request to be notified so that our engineers may review the recommendations in this report in light of these variations.

Satellite image taken from Google Earth ®
Test Locations marked as per GPS coordinates taken on site using hand-held Garmin ® deviceAccuracy of hand-held GPS device generally ranges from 4-6m, and varies depending on the availability of satellite connection at the site
Satellite Image of Site and Test Locations
N
Location: Ash Pond Area
Extension of Barauni Super Critical Coal Fired Thermal Power Station at Barauni, Bihar.M/s. STEAG Energy Services (India) Pvt. Ltd.
Plate 1 of 154Project No. 215081-I

SPT (N) Value
SPT (N) Value
0 to 2
2 to 4
4 to 8
8 to 15
15 to 30
> 30
Degree of Expansion
Low
Medium
High
Very High
35 - 50
20 - 35
Liquid Limit
< 15
15 -30
< 12
12 - 23
< 50
50 -100
100 - 200
> 200
30 - 60
Engineering Description of Soils
> 60
23 - 32
> 3270 - 90
50 - 70
Free Swell Percent
Degree of Expansion of Fine Grained Soils
> 2.0
Plasticity Index
Density Descriptor
Plasticity Chart
Static Cone Tip Resistance kg/sq.cm
Density Condition of Granular Soils
Degree of Severity
0.5 to 1.0
Hard
< 0.1
1.0 to 2.0
0.1 to 0.25
0.25 to 0.5
Shrinkage Index
Very Stiff
Stiff
Severe
Critical
Marginal
Non-critical
Plasticity of Clay
Plasticity Liquid Limit
Low Plastic
Medium Plastic
High Plastic
< 35
35 to 50
> 50
Consistency of Cohesive Soils
Firm/Medium
Soft
Consistency Cohesion Intercept, kg/sq.cm
Very SoftVery Loose
Loose
Medium Dense
Dense
Very dense
0 to 4
4 to 10
10 to 30
30 to 50
> 50
< 20
20 to 40
40 to 120
120 to 200
> 200
Extension of Barauni Super Critical Coal Fired Thermal Power Station at Barauni, Bihar.M/s. STEAG Energy Services (India) Pvt. Ltd.
Plate 2 of 154Project No. 215081-I

NABL Accredited Laboratory Our laboratory is accredited to National Accreditation Board for Testing and Calibration Laboratories (NABL), New Delhi. The quality procedures in our laboratory conform to the International Standard ISO/IEC: 17025-2005. The accreditation assures our clients of work quality in conformance with international norms and practices. It authorizes us to use the NABL logo on test results. To maintain the necessary level of quality and reliability in all measurements on a continual basis, we indulge in the following:
Use of calibrated equipment, regular maintenance and good housekeeping are a part of our work culture.
Inter-laboratory comparison, proficiency testing and replicate testing, continuing education - ensure uniform quality of results.
Internal Audit of quality procedures is done by our qualified ISO 17025 auditors to maintain the requisite standards. NABL conducts external audit.
Uncertainty Every measurement entails an uncertainty. It is well known that no measuring instrument can determine the true value of any measurement. The cumulative effect of factors such as sensitivity of equipment, accuracy in calibration, human factors and environmental conditions will determine the overall uncertainty in the parameter determined from these measurements. As a part of our commitment to our clients, we have worked out the uncertainty in the parameters reported by our laboratory. Although this does not form a part of our contract agreement, we present below our statistical estimate of uncertainty of various parameters based on our most recent evaluation (Feb., 2015).
Test / Parameter Uncertainty* Test / Parameter Uncertainty*
Moisture Content 0.13 % Free Swell Index, % 2.0 %
Bulk & Dry Density 0.0015 g/cc Swell Pressure 0.43 % Specific Gravity 0.014 cc1 0.0003
Liquid Limit 0.27 % cc2 0.003 Plastic Limit 0.19 % mv 0.0003 cm2/kg
Shrinkage Limit 0.30 %
Consolidation
pc 0.15 kg/cm2 Unconfined
Compression c 0.079 kg/cm2 CD Direct Shear Test 0.29
c 0.42 % Coarse grained soils 0.6% of particle size
UU Triaxial Test 0.2 %
Soil Gradation Fine grained
soils 0.5% of particle size
MDD 0.03 g/cc Coefficient of Permeability 1.3 % of value Std/Mod Proctor Compaction OMC 0.13 % Crushing
Strength 0.80 % of value
Laboratory CBR 0.57% Rock Point Load
Strength Index 0.04 % of value
* at 95 percent confidence level for coverage factor of 2
Uncertainty in Laboratory Measurements
Extension of Barauni Super Critical Coal Fired Thermal Power Station at Barauni, Bihar.M/s. STEAG Energy Services (India) Pvt. Ltd.
Plate 3 of 154Project No. 215081-I

Location : Boring Method :UTM Coordinates : Casing Depth :
Boring Start :Boring Finish :
From
To Field
Value
, Nf
Corre
cted V
alue,
N" Grav
el (%
)
Sand
(%)
Silt (
%)
Clay
(%)
Liquid
(%)
Plasti
c (%
)Pla
sticit
y Ind
ex
(%)
Bulk
Dens
ity
(gms/c
m3 )Dr
y Den
sity
(gms/c
m3 )Mo
isture
Con
tent
(%)
Type
of Te
stCo
nfinin
g Pr
essu
res,
(kg/cm
2)
Cohe
sion
Interc
ept, '
c' (kg
/cm2 )
Angle
of In
terna
l Fri
ction
,
(degre
es)
0.00 0.50 DS1 #N/A 0.50 0 17 62 20 27.5 16.4 11.1 #N/A #N/A #N/A #N/A #N/A #N/A #N/A
0.50 1.00 DS2 #N/A #N/A #N/A #N/A #N/A ### #N/A #N/A #N/A #N/A #N/A #N/A #N/A #N/A
1.00 1.45 SPT1 14 20 0 62 35 3 #N/A #N/A #N/A #N/A #N/A #N/A #N/A
2.00 2.45 SPT2 16 20 0 83 17 0 ### #N/A #N/A #N/A #N/A #N/A #N/A #N/A #N/A
3.00 3.30 UDS1 #N/A #N/A #N/A #N/A #N/A ### #N/A 1.83 1.57 16.5 #N/A DS 0.5 ,1, 1.5 0.0 32.1
4.00 4.45 SPT3 22 24 0 78 17 5 ### #N/A #N/A #N/A #N/A #N/A #N/A #N/A #N/A
5.00 5.45 SPT4 24 24 0 79 16 5 ### #N/A #N/A #N/A #N/A #N/A #N/A #N/A #N/A
6.00 6.30 UDS2 #N/A #N/A #N/A #N/A #N/A ### #N/A 1.85 1.59 16.6 #N/A #N/A #N/A #N/A #N/A
7.00 7.45 SPT5 28 26 #N/A #N/A #N/A #N/A ### #N/A #N/A #N/A 2.65 #N/A #N/A #N/A #N/A
8.00 8.45 SPT6 32 29 0 86 14 0 ### #N/A #N/A #N/A #N/A #N/A #N/A #N/A #N/A
9.00 9.45 SPT7 32 28 #N/A #N/A #N/A #N/A ### #N/A #N/A #N/A #N/A #N/A #N/A #N/A #N/A
10.00 10.45 S[PT8 34 29 11.00 #N/A #N/A #N/A #N/A ### #N/A #N/A #N/A #N/A #N/A #N/A #N/A #N/A
Soil Profile (BH-1)Shell & Auger19.9 m10-Jun-1511-Jun-15
Ash Pond Area Termination Depth : 20.36 m (RL 22.4 m)
RL 42.79 m
Spec
ific G
ravity
Medium dense to dense grey silty fine sand (SM ) - medium dense, 0.5 to 8.0 m
Grain Size Analysis
Non Plastic
SOIL DESCRIPTION
Medium dense brown sandy silt, low plastic (CL)
- dense, 8.0 to 11.0 m
Depth, m
Samp
le No
.
Symb
olSPT (1)
Ground Water Depth :
Ground Water Level :
403339.31 m E, 2805366.99 m NSurface Elevation :
Atterberg Limits Shear TestsDensity and MoistureRL 35.79 m
7.00 m
Depth
of St
rata,
(m)
(1) SPT is outside NABL scope.
Extension of Barauni Super Critical Coal Fired Thermal Power Station at Barauni, Bihar.M/s. STEAG Energy Services (India) Pvt. Ltd.
Plate 4 of 154Project No. 215081-I

Location : Boring Method :UTM Coordinates : Casing Depth :
Boring Start :Boring Finish :
From
To Field
Value
, Nf
Corre
cted V
alue,
N" Grav
el (%
)
Sand
(%)
Silt (
%)
Clay
(%)
Liquid
(%)
Plasti
c (%
)Pla
sticit
y Ind
ex
(%)
Bulk
Dens
ity
(gms/c
m3 )Dr
y Den
sity
(gms/c
m3 )Mo
isture
Con
tent
(%)
Type
of Te
stCo
nfinin
g Pr
essu
res,
(kg/cm
2)
Cohe
sion
Interc
ept, '
c' (kg
/cm2 )
Angle
of In
terna
l Fri
ction
,
(degre
es)
Soil Profile (BH-1)Shell & Auger19.9 m10-Jun-1511-Jun-15
Ash Pond Area Termination Depth : 20.36 m (RL 22.4 m)
RL 42.79 m
Spec
ific G
ravity
Grain Size Analysis
SOIL DESCRIPTION
Depth, m
Samp
le No
.
Symb
olSPT (1)
Ground Water Depth :
Ground Water Level :
403339.31 m E, 2805366.99 m NSurface Elevation :
Atterberg Limits Shear TestsDensity and MoistureRL 35.79 m
7.00 m
Depth
of St
rata,
(m)
11.00 11.45 SPT9 36 31 #N/A #N/A #N/A #N/A ### #N/A #N/A #N/A #N/A #N/A #N/A #N/A #N/A
12.00 12.45 SPT10 36 30 0 95 5 0 ### #N/A #N/A #N/A #N/A #N/A #N/A #N/A #N/A
13.00 13.45 SPT11 39 32 #N/A #N/A #N/A #N/A ### #N/A #N/A #N/A #N/A #N/A #N/A #N/A #N/A
14.00 14.45 SPT12 39 31 0 96 4 0 ### #N/A #N/A #N/A #N/A #N/A #N/A #N/A #N/A
15.00 15.00 SPT13 44 35 #N/A #N/A #N/A #N/A ### #N/A #N/A #N/A #N/A #N/A #N/A #N/A #N/A
16.00 16.45 SPT14 46 36 1 99 0 0 ### #N/A #N/A #N/A #N/A #N/A #N/A #N/A #N/A
17.00 17.45 SPT15 51 39 #N/A #N/A #N/A #N/A ### #N/A #N/A #N/A #N/A #N/A #N/A #N/A #N/A
18.00 18.45 SPT16 65 49 0 97 3 0 ### #N/A #N/A #N/A #N/A #N/A #N/A #N/A #N/A
19.00 19.41 SPT17 100/ 26cm
100/ 26cm #N/A #N/A #N/A #N/A ### #N/A #N/A #N/A #N/A #N/A #N/A #N/A #N/A
20.00 20.36 SPT18 100/ 21cm
100/ 21cm 20.36 0 98 2 0 ### #N/A #N/A #N/A #N/A #N/A #N/A #N/A #N/A
#N/A #N/A #N/A #N/A #N/A ### #N/A #N/A #N/A #N/A #N/A #N/A #N/A #N/A
#N/A #N/A #N/A #N/A #N/A ### #N/A #N/A #N/A #N/A #N/A #N/A #N/A #N/A
Dense to very dense grey fine sand (SP-SM)
- SP, 14.0 to 20.36 m
(1) SPT is outside NABL scope.
Extension of Barauni Super Critical Coal Fired Thermal Power Station at Barauni, Bihar.M/s. STEAG Energy Services (India) Pvt. Ltd.
Plate 5 of 154Project No. 215081-I

Location : Boring Method :UTM Coordinates : Casing Depth :
Boring Start :Boring Finish :
From
To Field
Value
, Nf
Corre
cted V
alue,
N" Grav
el (%
)
Sand
(%)
Silt (
%)
Clay
(%)
Liquid
(%)
Plasti
c (%
)Pla
sticit
y Ind
ex
(%)
Bulk
Dens
ity
(gms/c
m3 )Dr
y Den
sity
(gms/c
m3 )Mo
isture
Con
tent
(%)
Type
of Te
stCo
nfinin
g Pr
essu
res,
(kg/cm
2)
Cohe
sion
Interc
ept, '
c' (kg
/cm2 )
Angle
of In
terna
l Fri
ction
,
(degre
es)
0.00 0.50 DS1 #N/A 0.50 0 36 51 12 26.8 14.6 12.2 #N/A #N/A #N/A #N/A #N/A #N/A #N/A
0.50 1.00 DS2 #N/A #N/A #N/A #N/A #N/A ### #N/A #N/A #N/A #N/A #N/A #N/A #N/A #N/A
1.50 1.80 UDS1 #N/A 2.50 #N/A #N/A #N/A #N/A ### #N/A 1.85 1.59 16.1 #N/A DS 0.5 ,1, 1.5 0.0 32.3
2.50 2.95 SPT1 15 18 3.50 0 19 61 20 31.8 16.8 15.0 #N/A #N/A #N/A #N/A #N/A #N/A #N/A
3.50 3.95 SPT2 33 37 #N/A #N/A #N/A #N/A ### #N/A #N/A #N/A #N/A #N/A #N/A #N/A #N/A
4.50 4.80 UDS2 #N/A 0 80 16 4 ### #N/A 1.83 1.57 16.5 #N/A DS 0.5 ,1, 1.5 0.0 30.2
5.50 5.95 SPT3 21 21 #N/A #N/A #N/A #N/A ### #N/A #N/A #N/A #N/A #N/A #N/A #N/A #N/A
6.50 6.95 SPT4 24 22 #N/A #N/A #N/A #N/A ### #N/A #N/A #N/A #N/A #N/A #N/A #N/A #N/A
7.50 7.80 UDS3 #N/A 0 86 12 2 ### #N/A 1.86 1.60 16.0 #N/A DS 0.5 ,1, 1.5 0.0 36.2
8.50 8.95 SPT5 26 23 #N/A #N/A #N/A #N/A ### #N/A #N/A #N/A 2.62 #N/A #N/A #N/A #N/A
9.50 9.95 SPT6 28 24 #N/A #N/A #N/A #N/A ### #N/A #N/A #N/A #N/A #N/A #N/A #N/A #N/A
10.50 10.80 DS3 #N/A 10.80 #N/A #N/A #N/A #N/A ### #N/A #N/A #N/A #N/A #N/A #N/A #N/A #N/A
- dense, 8.0 to 11.0 m
Atterberg Limits
Soil Profile (BH-2)Shell & Auger19.5 m13-Jun-1515-Jun-15
Ground Water Depth :
Ground Water Level :Sy
mbol
SOIL DESCRIPTION
- dense, 3.5 to 5.5 m
Medium dense to dense brown silty fine sand (SM)
Medium dense brown sandy silt, low plastic (CL)
Medium dense grey silty fine sand (SM )
Grain Size AnalysisDepth, m
Samp
le No
.
Depth
of St
rata,
(m)SPT (1)
- medium dense, 5.5 to 11.0 m - grey, 5.5 to 11.0 m
Medium dense brown sandy silt, low plastic (CL)
Surface Elevation :
Termination Depth :Ash Pond Area403577.35 m E, 2806143.01 m N
20.95 m (RL 20.8 m)
RL 41.70 m
Shear TestsDensity and MoistureRL 34.60 m
7.10 m
Spec
ific G
ravity
(1) SPT is outside NABL scope.
Extension of Barauni Super Critical Coal Fired Thermal Power Station at Barauni, Bihar.M/s. STEAG Energy Services (India) Pvt. Ltd.
Plate 6 of 154Project No. 215081-I

Location : Boring Method :UTM Coordinates : Casing Depth :
Boring Start :Boring Finish :
From
To Field
Value
, Nf
Corre
cted V
alue,
N" Grav
el (%
)
Sand
(%)
Silt (
%)
Clay
(%)
Liquid
(%)
Plasti
c (%
)Pla
sticit
y Ind
ex
(%)
Bulk
Dens
ity
(gms/c
m3 )Dr
y Den
sity
(gms/c
m3 )Mo
isture
Con
tent
(%)
Type
of Te
stCo
nfinin
g Pr
essu
res,
(kg/cm
2)
Cohe
sion
Interc
ept, '
c' (kg
/cm2 )
Angle
of In
terna
l Fri
ction
,
(degre
es)
Atterberg Limits
Soil Profile (BH-2)Shell & Auger19.5 m13-Jun-1515-Jun-15
Ground Water Depth :
Ground Water Level :Sy
mbol
SOIL DESCRIPTION
Grain Size AnalysisDepth, m
Samp
le No
.
Depth
of St
rata,
(m)SPT (1)
Surface Elevation :
Termination Depth :Ash Pond Area403577.35 m E, 2806143.01 m N
20.95 m (RL 20.8 m)
RL 41.70 m
Shear TestsDensity and MoistureRL 34.60 m
7.10 m
Spec
ific G
ravity
10.80 11.25 SPT7 34 29 0 95 5 0 ### #N/A #N/A #N/A #N/A #N/A #N/A #N/A #N/A
11.50 11.95 SPT8 36 30 #N/A #N/A #N/A #N/A ### #N/A #N/A #N/A #N/A #N/A #N/A #N/A #N/A
12.00 12.95 SPT9 41 34 0 96 4 0 ### #N/A #N/A #N/A #N/A #N/A #N/A #N/A #N/A
13.50 13.95 SPT10 41 33 #N/A #N/A #N/A #N/A ### #N/A #N/A #N/A #N/A #N/A #N/A #N/A #N/A
14.50 14.95 SPT11 42 33 0 93 7 0 ### #N/A #N/A #N/A #N/A #N/A #N/A #N/A #N/A
15.50 15.95 SPT12 45 35 #N/A #N/A #N/A #N/A ### #N/A #N/A #N/A #N/A #N/A #N/A #N/A #N/A
16.50 16.95 SPT13 51 39 0 98 2 0 ### #N/A #N/A #N/A #N/A #N/A #N/A #N/A #N/A
17.50 17.95 SPT14 58 44 #N/A #N/A #N/A #N/A ### #N/A #N/A #N/A #N/A #N/A #N/A #N/A #N/A
18.50 18.95 SPT15 68 50 0 98 2 0 ### #N/A #N/A #N/A #N/A #N/A #N/A #N/A #N/A
19.50 19.95 SPT16 70 51 #N/A #N/A #N/A #N/A ### #N/A #N/A #N/A #N/A #N/A #N/A #N/A #N/A
20.50 20.95 SPT17 91 65 20.95 #N/A #N/A #N/A #N/A ### #N/A #N/A #N/A #N/A #N/A #N/A #N/A #N/A
#N/A #N/A #N/A #N/A #N/A #N/A #N/A ### #N/A #N/A #N/A #N/A #N/A #N/A #N/A #N/A
- SP, 16.5 to 20.95 m - very dense, 16.5 to 20.95 m
Dense to very dense grey fine sand (SP-SM) - dense, 11.0 to 16.5 m
- SP, 12.0 to 14.5 m
- SP-SM, 14.5 to 16.5 m
(1) SPT is outside NABL scope.
Extension of Barauni Super Critical Coal Fired Thermal Power Station at Barauni, Bihar.M/s. STEAG Energy Services (India) Pvt. Ltd.
Plate 7 of 154Project No. 215081-I

Location : Boring Method :UTM Coordinates : Casing Depth :
Boring Start :Boring Finish :
From
To Field
Value
, Nf
Corre
cted V
alue,
N" Grav
el (%
)
Sand
(%)
Silt (
%)
Clay
(%)
Liquid
(%)
Plasti
c (%
)Pla
sticit
y Ind
ex
(%)
Bulk
Dens
ity
(gms/c
m3 )Dr
y Den
sity
(gms/c
m3 )Mo
isture
Con
tent
(%)
Type
of Te
stCo
nfinin
g Pr
essu
res,
(kg/cm
2)
Cohe
sion
Interc
ept, '
c' (kg
/cm2 )
Angle
of In
terna
l Fri
ction
,
(degre
es)
0.00 0.50 DS1 #N/A 0.50 0 25 58 17 30.9 15.3 15.6 #N/A #N/A #N/A #N/A #N/A #N/A #N/A
0.50 1.00 DS2 #N/A #N/A #N/A #N/A #N/A ### #N/A #N/A #N/A #N/A #N/A #N/A #N/A #N/A
1.00 1.45 SPT1 10 14 0 61 36 3 #N/A #N/A #N/A #N/A #N/A #N/A #N/A
2.00 2.45 SPT2 13 17 0 84 16 0 ### #N/A #N/A #N/A #N/A #N/A #N/A #N/A #N/A
3.00 3.30 DS3 #N/A #N/A #N/A #N/A #N/A ### #N/A 1.83 1.59 15.4 #N/A #N/A #N/A #N/A #N/A
4.00 4.45 SPT3 21 23 #N/A #N/A #N/A #N/A ### #N/A #N/A #N/A #N/A #N/A #N/A #N/A #N/A
5.00 5.45 SPT4 25 25 0 81 19 0 ### #N/A #N/A #N/A #N/A #N/A #N/A #N/A #N/A
6.00 6.30 UDS1 #N/A 0 60 35 5 1.84 1.58 16.4 #N/A DS 0.5 ,1, 1.5 0.0 32.3
7.00 7.45 SPT5 14 13 8.00 #N/A #N/A #N/A #N/A ### #N/A #N/A #N/A 2.67 #N/A #N/A #N/A #N/A
8.00 8.45 SPT6 14 13 9.00 0 40 50 10 25.3 15.2 10.1 #N/A #N/A #N/A #N/A #N/A #N/A #N/A
9.00 9.30 UDS2 #N/A #N/A #N/A #N/A #N/A ### #N/A 1.85 1.58 17.0 #N/A DS 0.5 ,1, 1.5 0.0 32.4
10.00 10.45 SPT7 28 24 #N/A #N/A #N/A #N/A ### #N/A #N/A #N/A #N/A #N/A #N/A #N/A #N/A
Soil Profile (BH-3)Shell & Auger19.5 m18-Jun-1520-Jun-15
Ash Pond Area Termination Depth : 20.36 m (RL 21.3 m)
RL 41.70 m
Medium dense grey fine sand (SP-SM)
Spec
ific G
ravity
Medium dense to dense grey silty fine sand (SM ) - medium dense, 0.5 to 8.0 m
Grain Size Analysis
Non Plastic
Non Plastic
SOIL DESCRIPTION
Medium dense brown sandy silt, low plastic (CL)
- dense, 8.0 to 11.0 m
Depth, m
Samp
le No
.
Symb
olSPT (1)
Ground Water Depth :
Ground Water Level :
403748.78 m E, 2806652.14 m NSurface Elevation :
Atterberg Limits Shear TestsDensity and MoistureRL 34.70 m
7.00 m
Depth
of St
rata,
(m)
(1) SPT is outside NABL scope.
Extension of Barauni Super Critical Coal Fired Thermal Power Station at Barauni, Bihar.M/s. STEAG Energy Services (India) Pvt. Ltd.
Plate 8 of 154Project No. 215081-I

Location : Boring Method :UTM Coordinates : Casing Depth :
Boring Start :Boring Finish :
From
To Field
Value
, Nf
Corre
cted V
alue,
N" Grav
el (%
)
Sand
(%)
Silt (
%)
Clay
(%)
Liquid
(%)
Plasti
c (%
)Pla
sticit
y Ind
ex
(%)
Bulk
Dens
ity
(gms/c
m3 )Dr
y Den
sity
(gms/c
m3 )Mo
isture
Con
tent
(%)
Type
of Te
stCo
nfinin
g Pr
essu
res,
(kg/cm
2)
Cohe
sion
Interc
ept, '
c' (kg
/cm2 )
Angle
of In
terna
l Fri
ction
,
(degre
es)
Soil Profile (BH-3)Shell & Auger19.5 m18-Jun-1520-Jun-15
Ash Pond Area Termination Depth : 20.36 m (RL 21.3 m)
RL 41.70 m
Spec
ific G
ravity
Grain Size Analysis
SOIL DESCRIPTION
Depth, m
Samp
le No
.
Symb
olSPT (1)
Ground Water Depth :
Ground Water Level :
403748.78 m E, 2806652.14 m NSurface Elevation :
Atterberg Limits Shear TestsDensity and MoistureRL 34.70 m
7.00 m
Depth
of St
rata,
(m)
11.00 11.45 SPT8 29 25 #N/A #N/A #N/A #N/A ### #N/A #N/A #N/A #N/A #N/A #N/A #N/A #N/A
12.00 12.45 SPT9 35 29 0 95 5 0 ### #N/A #N/A #N/A #N/A #N/A #N/A #N/A #N/A
13.00 13.45 SPT10 42 34 14.00 #N/A #N/A #N/A #N/A ### #N/A #N/A #N/A #N/A #N/A #N/A #N/A #N/A
14.00 14.45 SPT11 42 34 0 82 18 0 ### #N/A #N/A #N/A #N/A #N/A #N/A #N/A #N/A
15.00 15.45 SPT12 46 36 16.00 #N/A #N/A #N/A #N/A ### #N/A #N/A #N/A #N/A #N/A #N/A #N/A #N/A
16.00 16.45 SPT13 51 39 0 99 1 0 ### #N/A #N/A #N/A #N/A #N/A #N/A #N/A #N/A
17.00 17.45 SPT14 54 41 #N/A #N/A #N/A #N/A ### #N/A #N/A #N/A #N/A #N/A #N/A #N/A #N/A
18.00 18.45 SPT15 66 49 0 99 1 0 ### #N/A #N/A #N/A #N/A #N/A #N/A #N/A #N/A
19.00 19.40 SPT16 100/ 25cm
100/ 25cm #N/A #N/A #N/A #N/A ### #N/A #N/A #N/A #N/A #N/A #N/A #N/A #N/A
20.00 20.36 SPT17 100/ 21cm
100/ 21cm 20.36 0 99 1 0 ### #N/A #N/A #N/A #N/A #N/A #N/A #N/A #N/A
#N/A #N/A #N/A #N/A #N/A #N/A #N/A ### #N/A #N/A #N/A #N/A #N/A #N/A #N/A #N/A
#N/A #N/A #N/A #N/A #N/A #N/A #N/A ### #N/A #N/A #N/A #N/A #N/A #N/A #N/A #N/A
Medium dense to dense grey fine sand (SP-SM)
Dense grey silty fine sand (SM)
Very dense grey fine sand (SP)
(1) SPT is outside NABL scope.
Extension of Barauni Super Critical Coal Fired Thermal Power Station at Barauni, Bihar.M/s. STEAG Energy Services (India) Pvt. Ltd.
Plate 9 of 154Project No. 215081-I

Location : Boring Method :UTM Coordinates : Casing Depth :
Boring Start :Boring Finish :
From
To Field
Value
, Nf
Corre
cted V
alue,
N" Grav
el (%
)
Sand
(%)
Silt (
%)
Clay
(%)
Liquid
(%)
Plasti
c (%
)Pla
sticit
y Ind
ex
(%)
Bulk
Dens
ity
(gms/c
m3 )Dr
y Den
sity
(gms/c
m3 )Mo
isture
Con
tent
(%)
Type
of Te
stCo
nfinin
g Pr
essu
res,
(kg/cm
2)
Cohe
sion
Interc
ept, '
c' (kg
/cm2 )
Angle
of In
terna
l Fri
ction
,
(degre
es)
0.00 0.50 DS1 #N/A #N/A #N/A #N/A #N/A 29.1 16.8 12.3 #N/A #N/A #N/A #N/A #N/A #N/A #N/A
0.50 1.00 DS2 #N/A 1.50 #N/A #N/A #N/A #N/A ### #N/A #N/A #N/A #N/A #N/A #N/A #N/A #N/A
1.50 1.80 UDS1 #N/A #N/A #N/A #N/A #N/A ### #N/A 1.83 1.59 15.4 #N/A DS 0.5 ,1, 1.5 0.0 30.8
2.50 2.95 SPT1 19 23 0 56 40 4 #N/A #N/A #N/A #N/A #N/A #N/A #N/A
3.50 3.95 SPT2 25 28 4.50 #N/A #N/A #N/A #N/A ### #N/A #N/A #N/A #N/A #N/A #N/A #N/A #N/A
4.50 4.80 UDS2 #N/A 5.50 0 4 68 27 34.0 17.9 16.1 1.86 1.60 15.8 #N/A #N/A #N/A #N/A #N/A
5.50 5.95 SPT3 27 26 #N/A #N/A #N/A #N/A ### #N/A #N/A #N/A 2.63 #N/A #N/A #N/A #N/A
6.50 6.95 SPT4 19 18 7.50 3 55 37 5 ### #N/A #N/A #N/A #N/A #N/A #N/A #N/A #N/A
7.50 7.80 UDS3 #N/A 0 92 8 0 ### #N/A 1.87 1.62 15.7 #N/A DS 0.5 ,1, 1.5 0.0 35.1
8.50 8.95 SPT5 36 32 0 89 11 0 ### #N/A #N/A #N/A #N/A #N/A #N/A #N/A #N/A
9.50 9.95 SPT6 36 32 #N/A #N/A #N/A #N/A ### #N/A #N/A #N/A #N/A #N/A #N/A #N/A #N/A
10.50 10.95 SPT7 39 33 11.00 #N/A #N/A #N/A #N/A ### #N/A #N/A #N/A #N/A #N/A #N/A #N/A #N/A
Atterberg Limits
Soil Profile (BH-4)Shell & Auger19.9 m21-Jun-1522-Jun-15
Ground Water Depth :
Ground Water Level :Sy
mbol
SOIL DESCRIPTION
Medium dense grey sandy silt, low plastic (CL)
Medium dense to dense grey silty fine sand (SM ) - medium dense, 0.5 to 8.0 m
Grain Size AnalysisDepth, m
Samp
le No
.
Depth
of St
rata,
(m)SPT (1)
- with traces of gravel, 6.5 to 7.5 m
Dense grey fine sand (SP-SM)
Medium dense brown silty fine sand (SM)
Medium dense brown sandy silt, low plastic (CL)
Surface Elevation :
Termination Depth :Ash Pond Area404203.43 m E, 2806545.85 m N
Shear TestsDensity and MoistureRL 34.70 m
Spec
ific G
ravity
Non Plastic
20.85 m (RL 20.9 m)
RL 41.72 m7.02 m
(1) SPT is outside NABL scope.
Extension of Barauni Super Critical Coal Fired Thermal Power Station at Barauni, Bihar.M/s. STEAG Energy Services (India) Pvt. Ltd.
Plate 10 of 154Project No. 215081-I
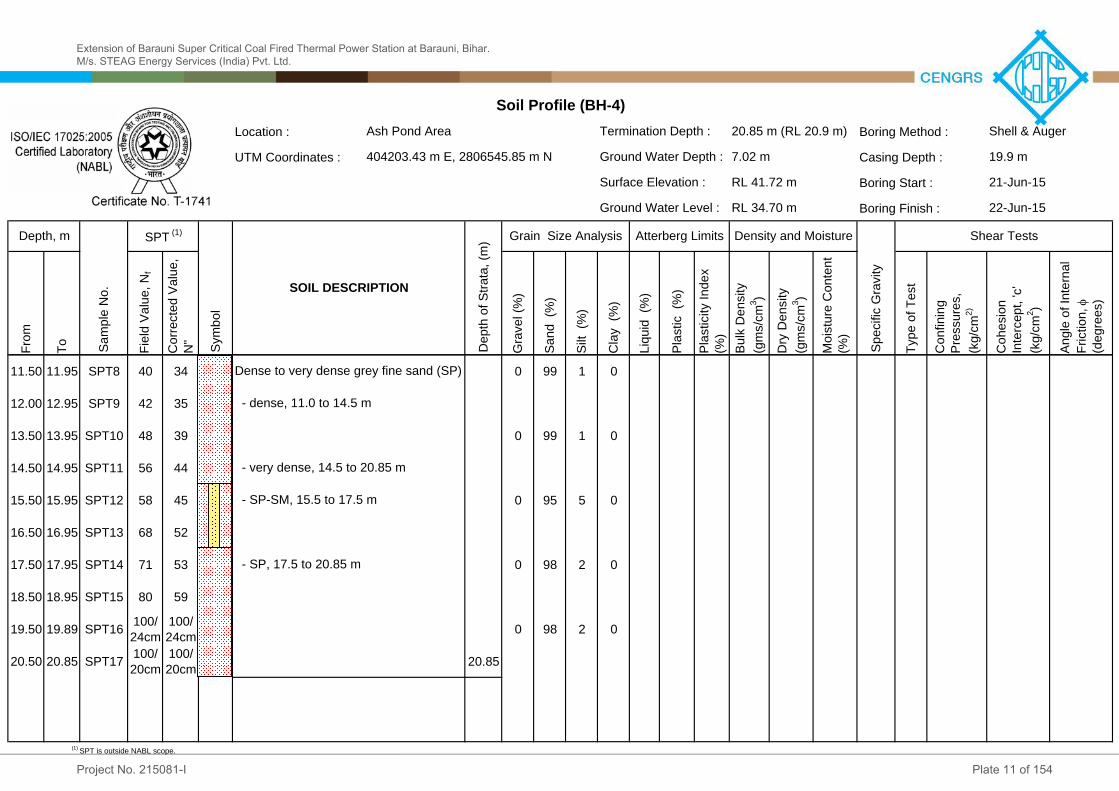
Location : Boring Method :UTM Coordinates : Casing Depth :
Boring Start :Boring Finish :
From
To Field
Value
, Nf
Corre
cted V
alue,
N" Grav
el (%
)
Sand
(%)
Silt (
%)
Clay
(%)
Liquid
(%)
Plasti
c (%
)Pla
sticit
y Ind
ex
(%)
Bulk
Dens
ity
(gms/c
m3 )Dr
y Den
sity
(gms/c
m3 )Mo
isture
Con
tent
(%)
Type
of Te
stCo
nfinin
g Pr
essu
res,
(kg/cm
2)
Cohe
sion
Interc
ept, '
c' (kg
/cm2 )
Angle
of In
terna
l Fri
ction
,
(degre
es)
Atterberg Limits
Soil Profile (BH-4)Shell & Auger19.9 m21-Jun-1522-Jun-15
Ground Water Depth :
Ground Water Level :Sy
mbol
SOIL DESCRIPTION
Grain Size AnalysisDepth, m
Samp
le No
.
Depth
of St
rata,
(m)SPT (1)
Surface Elevation :
Termination Depth :Ash Pond Area404203.43 m E, 2806545.85 m N
Shear TestsDensity and MoistureRL 34.70 m
Spec
ific G
ravity
20.85 m (RL 20.9 m)
RL 41.72 m7.02 m
11.50 11.95 SPT8 40 34 0 99 1 0 ### #N/A #N/A #N/A #N/A #N/A #N/A #N/A #N/A
12.00 12.95 SPT9 42 35 #N/A #N/A #N/A #N/A ### #N/A #N/A #N/A #N/A #N/A #N/A #N/A #N/A
13.50 13.95 SPT10 48 39 0 99 1 0 ### #N/A #N/A #N/A #N/A #N/A #N/A #N/A #N/A
14.50 14.95 SPT11 56 44 #N/A #N/A #N/A #N/A ### #N/A #N/A #N/A #N/A #N/A #N/A #N/A #N/A
15.50 15.95 SPT12 58 45 0 95 5 0 ### #N/A #N/A #N/A #N/A #N/A #N/A #N/A #N/A
16.50 16.95 SPT13 68 52 #N/A #N/A #N/A #N/A ### #N/A #N/A #N/A #N/A #N/A #N/A #N/A #N/A
17.50 17.95 SPT14 71 53 0 98 2 0 ### #N/A #N/A #N/A #N/A #N/A #N/A #N/A #N/A
18.50 18.95 SPT15 80 59 #N/A #N/A #N/A #N/A ### #N/A #N/A #N/A #N/A #N/A #N/A #N/A #N/A
19.50 19.89 SPT16 100/ 24cm
100/ 24cm 0 98 2 0 ### #N/A #N/A #N/A #N/A #N/A #N/A #N/A #N/A
20.50 20.85 SPT17 100/ 20cm
100/ 20cm 20.85 #N/A #N/A #N/A #N/A ### #N/A #N/A #N/A #N/A #N/A #N/A #N/A #N/A
#N/A #N/A #N/A #N/A #N/A #N/A #N/A ### #N/A #N/A #N/A #N/A #N/A #N/A #N/A #N/A
#N/A #N/A #N/A #N/A #N/A #N/A #N/A ### #N/A #N/A #N/A #N/A #N/A #N/A #N/A #N/A
- SP, 17.5 to 20.85 m
Dense to very dense grey fine sand (SP)
- dense, 11.0 to 14.5 m
- very dense, 14.5 to 20.85 m
- SP-SM, 15.5 to 17.5 m
(1) SPT is outside NABL scope.
Extension of Barauni Super Critical Coal Fired Thermal Power Station at Barauni, Bihar.M/s. STEAG Energy Services (India) Pvt. Ltd.
Plate 11 of 154Project No. 215081-I

Location : Boring Method :UTM Coordinates : Casing Depth : Survey Coordinates : Boring Start :Chainage : Boring Finish :
From
To Field
Value
, Nf
Corre
cted V
alue,
N" Grav
el (%
)
Sand
(%)
Silt (
%)
Clay
(%)
Liquid
(%)
Plasti
c (%
)Pla
sticit
y Ind
ex
(%)
Bulk
Dens
ity
(gms/c
m3 )Dr
y Den
sity
(gms/c
m3 )Mo
isture
Con
tent
(%)
Type
of Te
stCo
nfinin
g Pr
essu
res,
(kg/cm
2)
Cohe
sion
Interc
ept, '
c' (kg
/cm2 )
Angle
of In
terna
l Fri
ction
,
(degre
es)
0.00 0.50 DS1 #N/A #N/A #N/A #N/A #N/A 31.8 17.9 13.9 #N/A #N/A #N/A #N/A #N/A #N/A #N/A
0.50 1.00 DS2 #N/A 1.00 #N/A #N/A #N/A #N/A 32.1 17.4 14.8 #N/A #N/A #N/A #N/A #N/A #N/A #N/A
1.00 1.45 SPT1 17 24 0 62 35 3 #N/A #N/A #N/A #N/A #N/A #N/A #N/A
2.00 2.45 SPT2 19 24 #N/A #N/A #N/A #N/A ### #N/A #N/A #N/A #N/A #N/A #N/A #N/A #N/A
3.00 3.30 UDS1 #N/A #N/A #N/A #N/A #N/A ### #N/A 1.80 1.55 16.3 #N/A DS 0.5 ,1, 1.5 0.0 29.8
4.00 4.45 SPT3 20 22 #N/A #N/A #N/A #N/A ### #N/A #N/A #N/A #N/A #N/A #N/A #N/A #N/A
5.00 5.45 SPT4 24 24 #N/A #N/A #N/A #N/A ### #N/A #N/A #N/A 2.64 #N/A #N/A #N/A #N/A
6.00 6.30 UDS2 #N/A 7.00 #N/A #N/A #N/A #N/A ### #N/A 1.86 1.62 14.9 #N/A #N/A #N/A #N/A #N/A
7.00 7.45 SPT5 20 18 #N/A #N/A #N/A #N/A ### #N/A #N/A #N/A #N/A #N/A #N/A #N/A #N/A
8.00 8.45 SPT6 36 32 0 97 3 0 ### #N/A #N/A #N/A #N/A #N/A #N/A #N/A #N/A
9.00 9.30 UDS3 #N/A #N/A #N/A #N/A #N/A ### #N/A 1.86 1.62 14.8 #N/A DS 0.5 ,1, 1.5 0.0 31.1
10.00 10.45 SPT7 38 33 #N/A #N/A #N/A #N/A ### #N/A #N/A #N/A #N/A #N/A #N/A #N/A #N/A
Soil Profile (BH-5)Shell & Auger20.0 m23-Jun-1524-Jun-15
Ash Pond Area Termination Depth : 20.36 m (RL 21.3 m)
RL 41.70 m
- dense, 8.0 to 11.0 m
Spec
ific G
ravity
Medium dense to dense grey silty fine sand (SM ) - medium dense, 0.5 to 8.0 m
Grain Size Analysis
Non Plastic
SOIL DESCRIPTION
Medium dense to dense grey fine sand (SP)
Medium dense brown sandy silt, low plastic (CL)
- dense, 8.0 to 11.0 m
Depth, m
Samp
le No
.
Symb
olSPT (1)
Ground Water Depth :
Ground Water Level :
404597.72 m E, 2806647.28 m NSurface Elevation :
Atterberg Limits Shear TestsDensity and MoistureRL 34.70 m
7.00 m
Depth
of St
rata,
(m)
(1) SPT is outside NABL scope.
Extension of Barauni Super Critical Coal Fired Thermal Power Station at Barauni, Bihar.M/s. STEAG Energy Services (India) Pvt. Ltd.
Plate 12 of 154Project No. 215081-I

Location : Boring Method :UTM Coordinates : Casing Depth : Survey Coordinates : Boring Start :Chainage : Boring Finish :
From
To Field
Value
, Nf
Corre
cted V
alue,
N" Grav
el (%
)
Sand
(%)
Silt (
%)
Clay
(%)
Liquid
(%)
Plasti
c (%
)Pla
sticit
y Ind
ex
(%)
Bulk
Dens
ity
(gms/c
m3 )Dr
y Den
sity
(gms/c
m3 )Mo
isture
Con
tent
(%)
Type
of Te
stCo
nfinin
g Pr
essu
res,
(kg/cm
2)
Cohe
sion
Interc
ept, '
c' (kg
/cm2 )
Angle
of In
terna
l Fri
ction
,
(degre
es)
Soil Profile (BH-5)Shell & Auger20.0 m23-Jun-1524-Jun-15
Ash Pond Area Termination Depth : 20.36 m (RL 21.3 m)
RL 41.70 m
Spec
ific G
ravity
Grain Size Analysis
SOIL DESCRIPTION
Depth, m
Samp
le No
.
Symb
olSPT (1)
Ground Water Depth :
Ground Water Level :
404597.72 m E, 2806647.28 m NSurface Elevation :
Atterberg Limits Shear TestsDensity and MoistureRL 34.70 m
7.00 m
Depth
of St
rata,
(m)
11.00 11.45 SPT8 42 36 #N/A #N/A #N/A #N/A ### #N/A #N/A #N/A #N/A #N/A #N/A #N/A #N/A
12.00 12.45 SPT9 48 40 #N/A #N/A #N/A #N/A ### #N/A #N/A #N/A #N/A #N/A #N/A #N/A #N/A
13.00 13.45 SPT10 58 47 0 96 4 0 ### #N/A #N/A #N/A #N/A #N/A #N/A #N/A #N/A
14.00 14.45 SPT11 62 50 #N/A #N/A #N/A #N/A ### #N/A #N/A #N/A #N/A #N/A #N/A #N/A #N/A
15.00 15.45 SPT12 68 54 #N/A #N/A #N/A #N/A ### #N/A #N/A #N/A #N/A #N/A #N/A #N/A #N/A
16.00 16.45 SPT13 70 54 #N/A #N/A #N/A #N/A ### #N/A #N/A #N/A #N/A #N/A #N/A #N/A #N/A
17.00 17.45 SPT14 76 58 #N/A #N/A #N/A #N/A ### #N/A #N/A #N/A #N/A #N/A #N/A #N/A #N/A
18.00 18.45 SPT15 89 66 0 96 4 0 ### #N/A #N/A #N/A #N/A #N/A #N/A #N/A #N/A
19.00 19.40 SPT16 100/ 25cm
100/ 25cm #N/A #N/A #N/A #N/A ### #N/A #N/A #N/A #N/A #N/A #N/A #N/A #N/A
20.00 20.36 SPT17 100/ 21cm
100/ 21cm 20.36 #N/A #N/A #N/A #N/A ### #N/A #N/A #N/A #N/A #N/A #N/A #N/A #N/A
#N/A #N/A #N/A #N/A #N/A #N/A #N/A ### #N/A #N/A #N/A #N/A #N/A #N/A #N/A #N/A
#N/A #N/A #N/A #N/A #N/A #N/A #N/A ### #N/A #N/A #N/A #N/A #N/A #N/A #N/A #N/A
Dense to very dense grey fine sand (SP)
- dense, 11.0 to 13.0 m
- very dense, 13.0 to 20.36 m
(1) SPT is outside NABL scope.
Extension of Barauni Super Critical Coal Fired Thermal Power Station at Barauni, Bihar.M/s. STEAG Energy Services (India) Pvt. Ltd.
Plate 13 of 154Project No. 215081-I
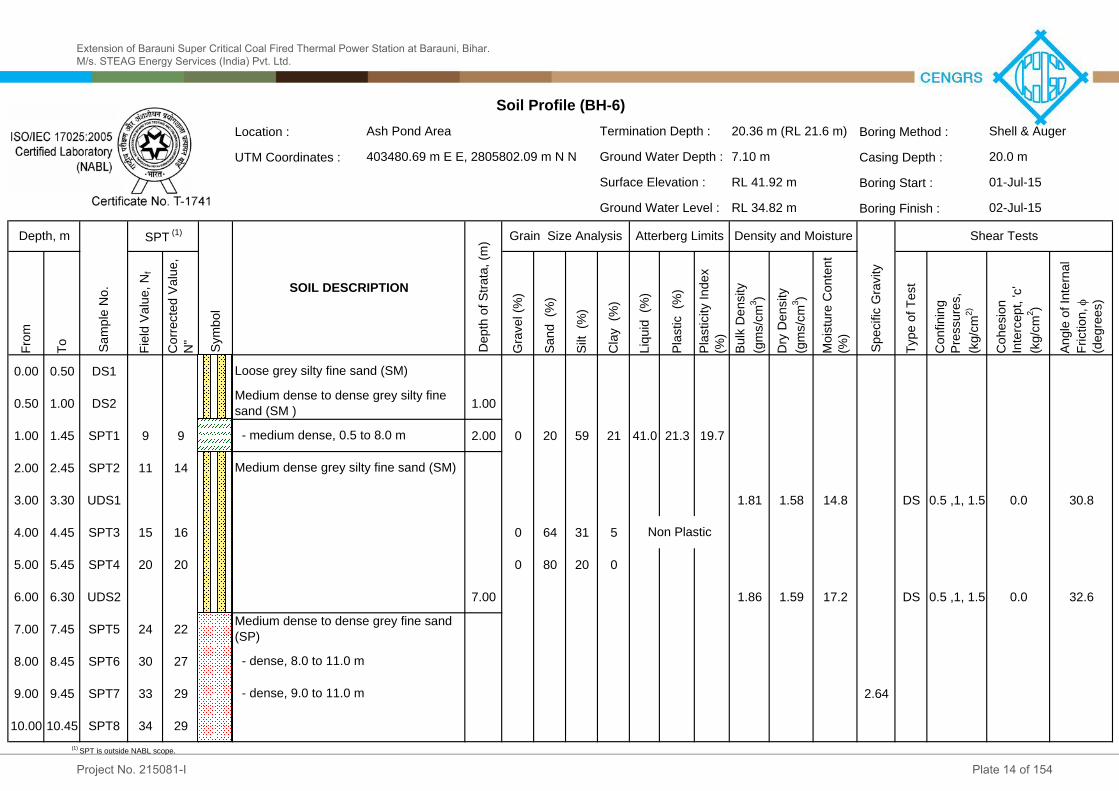
Location : Boring Method :UTM Coordinates : Casing Depth : Survey Coordinates : Boring Start :Chainage : Boring Finish :
From
To Field
Value
, Nf
Corre
cted V
alue,
N" Grav
el (%
)
Sand
(%)
Silt (
%)
Clay
(%)
Liquid
(%)
Plasti
c (%
)Pla
sticit
y Ind
ex
(%)
Bulk
Dens
ity
(gms/c
m3 )Dr
y Den
sity
(gms/c
m3 )Mo
isture
Con
tent
(%)
Type
of Te
stCo
nfinin
g Pr
essu
res,
(kg/cm
2)
Cohe
sion
Interc
ept, '
c' (kg
/cm2 )
Angle
of In
terna
l Fri
ction
,
(degre
es)
0.00 0.50 DS1 #N/A #N/A #N/A #N/A #N/A ### #N/A #N/A #N/A #N/A #N/A #N/A #N/A #N/A
0.50 1.00 DS2 #N/A 1.00 #N/A #N/A #N/A #N/A ### #N/A #N/A #N/A #N/A #N/A #N/A #N/A #N/A
1.00 1.45 SPT1 9 9 2.00 0 20 59 21 41.0 21.3 19.7 #N/A #N/A #N/A #N/A #N/A #N/A #N/A
2.00 2.45 SPT2 11 14 #N/A #N/A #N/A #N/A ### #N/A #N/A #N/A #N/A #N/A #N/A #N/A #N/A
3.00 3.30 UDS1 #N/A #N/A #N/A #N/A #N/A ### #N/A 1.81 1.58 14.8 #N/A DS 0.5 ,1, 1.5 0.0 30.8
4.00 4.45 SPT3 15 16 0 64 31 5 #N/A #N/A #N/A #N/A #N/A #N/A #N/A
5.00 5.45 SPT4 20 20 0 80 20 0 ### #N/A #N/A #N/A #N/A #N/A #N/A #N/A #N/A
6.00 6.30 UDS2 #N/A 7.00 #N/A #N/A #N/A #N/A ### #N/A 1.86 1.59 17.2 #N/A DS 0.5 ,1, 1.5 0.0 32.6
7.00 7.45 SPT5 24 22 #N/A #N/A #N/A #N/A ### #N/A #N/A #N/A #N/A #N/A #N/A #N/A #N/A
8.00 8.45 SPT6 30 27 #N/A #N/A #N/A #N/A ### #N/A #N/A #N/A #N/A #N/A #N/A #N/A #N/A
9.00 9.45 SPT7 33 29 #N/A #N/A #N/A #N/A ### #N/A #N/A #N/A 2.64 #N/A #N/A #N/A #N/A
10.00 10.45 SPT8 34 29 #N/A #N/A #N/A #N/A ### #N/A #N/A #N/A #N/A #N/A #N/A #N/A #N/A
Non Plastic
Depth, m
Soil Profile (BH-6)Shell & Auger20.0 m01-Jul-1502-Jul-15
Termination Depth :Sa
mple
No. SOIL DESCRIPTION
Medium dense grey silty fine sand (SM)
Medium dense to dense grey silty fine sand (SM )
Medium dense to dense grey fine sand (SP)
- dense, 9.0 to 11.0 m
SPT (1)
Loose grey silty fine sand (SM)
- medium dense, 0.5 to 8.0 m
Symb
ol
- dense, 8.0 to 11.0 m
Depth
of St
rata,
(m) Grain Size Analysis
Ash Pond Area403480.69 m E E, 2805802.09 m N N Ground Water Depth :
Ground Water Level :Surface Elevation :
Atterberg Limits
20.36 m (RL 21.6 m)
RL 41.92 m
Shear TestsDensity and MoistureRL 34.82 m
7.10 m
Spec
ific G
ravity
(1) SPT is outside NABL scope.
Extension of Barauni Super Critical Coal Fired Thermal Power Station at Barauni, Bihar.M/s. STEAG Energy Services (India) Pvt. Ltd.
Plate 14 of 154Project No. 215081-I

Location : Boring Method :UTM Coordinates : Casing Depth : Survey Coordinates : Boring Start :Chainage : Boring Finish :
From
To Field
Value
, Nf
Corre
cted V
alue,
N" Grav
el (%
)
Sand
(%)
Silt (
%)
Clay
(%)
Liquid
(%)
Plasti
c (%
)Pla
sticit
y Ind
ex
(%)
Bulk
Dens
ity
(gms/c
m3 )Dr
y Den
sity
(gms/c
m3 )Mo
isture
Con
tent
(%)
Type
of Te
stCo
nfinin
g Pr
essu
res,
(kg/cm
2)
Cohe
sion
Interc
ept, '
c' (kg
/cm2 )
Angle
of In
terna
l Fri
ction
,
(degre
es)
Depth, m
Soil Profile (BH-6)Shell & Auger20.0 m01-Jul-1502-Jul-15
Termination Depth :Sa
mple
No. SOIL DESCRIPTION
SPT (1)Sy
mbol
Depth
of St
rata,
(m) Grain Size Analysis
Ash Pond Area403480.69 m E E, 2805802.09 m N N Ground Water Depth :
Ground Water Level :Surface Elevation :
Atterberg Limits
20.36 m (RL 21.6 m)
RL 41.92 m
Shear TestsDensity and MoistureRL 34.82 m
7.10 m
Spec
ific G
ravity
11.00 11.45 SPT9 37 31 0 97 3 0 ### #N/A #N/A #N/A #N/A #N/A #N/A #N/A #N/A
12.00 12.45 SPT10 46 38 #N/A #N/A #N/A #N/A ### #N/A #N/A #N/A #N/A #N/A #N/A #N/A #N/A
13.00 13.45 SPT11 46 37 #N/A #N/A #N/A #N/A ### #N/A #N/A #N/A #N/A #N/A #N/A #N/A #N/A
14.00 14.45 SPT12 51 41 #N/A #N/A #N/A #N/A ### #N/A #N/A #N/A #N/A #N/A #N/A #N/A #N/A
15.00 15.45 SPT13 58 46 #N/A #N/A #N/A #N/A ### #N/A #N/A #N/A #N/A #N/A #N/A #N/A #N/A
16.00 16.45 SPT14 59 46 0 98 2 0 ### #N/A #N/A #N/A #N/A #N/A #N/A #N/A #N/A
17.00 17.45 SPT15 66 50 #N/A #N/A #N/A #N/A ### #N/A #N/A #N/A #N/A #N/A #N/A #N/A #N/A
18.00 18.45 SPT16 75 56 #N/A #N/A #N/A #N/A ### #N/A #N/A #N/A #N/A #N/A #N/A #N/A #N/A
19.00 19.41 SPT17 100/ 26cm
100/ 26cm 0 98 2 0 ### #N/A #N/A #N/A #N/A #N/A #N/A #N/A #N/A
20.00 20.36 SPT18 100/ 21cm
100/ 21cm 21.36 #N/A #N/A #N/A #N/A ### #N/A #N/A #N/A #N/A #N/A #N/A #N/A #N/A
#N/A #N/A #N/A #N/A #N/A #N/A #N/A ### #N/A #N/A #N/A #N/A #N/A #N/A #N/A #N/A
#N/A #N/A #N/A #N/A #N/A #N/A #N/A ### #N/A #N/A #N/A #N/A #N/A #N/A #N/A #N/A
Dense to very dense grey fine sand (SP)
- dense, 11.0 to 14.0 m
- very dense, 14.0 to 21.36 m
(1) SPT is outside NABL scope.
Extension of Barauni Super Critical Coal Fired Thermal Power Station at Barauni, Bihar.M/s. STEAG Energy Services (India) Pvt. Ltd.
Plate 15 of 154Project No. 215081-I

Location : Boring Method :UTM Coordinates : Casing Depth : Survey Coordinates : Boring Start :Chainage : Boring Finish :
From
To Field
Value
, Nf
Corre
cted V
alue,
N" Grav
el (%
)
Sand
(%)
Silt (
%)
Clay
(%)
Liquid
(%)
Plasti
c (%
)Pla
sticit
y Ind
ex
(%)
Bulk
Dens
ity
(gms/c
m3 )Dr
y Den
sity
(gms/c
m3 )Mo
isture
Con
tent
(%)
Type
of Te
stCo
nfinin
g Pr
essu
res,
(kg/cm
2)
Cohe
sion
Interc
ept, '
c' (kg
/cm2 )
Angle
of In
terna
l Fri
ction
,
(degre
es)
0.00 0.50 DS1 #N/A #N/A #N/A #N/A #N/A 28.3 16.8 11.5 #N/A #N/A #N/A #N/A #N/A #N/A #N/A
0.50 1.00 DS2 #N/A 1.00 #N/A #N/A #N/A #N/A 29.3 17.1 12.2 #N/A #N/A #N/A #N/A #N/A #N/A #N/A
1.50 1.80 UDS1 #N/A #N/A #N/A #N/A #N/A ### #N/A 1.83 1.55 18.1 #N/A DS 0.5 ,1, 1.5 0.0 28.3
2.50 2.95 SPT1 20 24 0 51 45 4 #N/A #N/A #N/A #N/A #N/A #N/A #N/A
3.50 3.95 SPT2 27 30 #N/A #N/A #N/A #N/A ### #N/A #N/A #N/A #N/A #N/A #N/A #N/A #N/A
4.50 4.80 UDS2 #N/A #N/A #N/A #N/A #N/A ### #N/A 1.82 1.58 15.2 #N/A #N/A #N/A #N/A #N/A
5.50 5.95 SPT3 30 29 0 62 35 3 #N/A #N/A #N/A #N/A #N/A #N/A #N/A
6.50 6.95 SPT4 31 29 0 64 34 2 ### #N/A #N/A #N/A #N/A #N/A #N/A #N/A #N/A
7.50 7.80 UDS3 #N/A 0 85 15 0 ### #N/A 1.84 1.60 14.9 #N/A DS 0.5 ,1, 1.5 0.0 31.5
8.50 8.95 SPT5 37 33 9.50 #N/A #N/A #N/A #N/A ### #N/A #N/A #N/A #N/A #N/A #N/A #N/A #N/A
9.50 9.95 SPT6 41 36 #N/A #N/A #N/A #N/A ### #N/A #N/A #N/A 2.65 #N/A #N/A #N/A #N/A
10.50 10.95 SPT7 42 36 11.00 0 89 11 0 ### #N/A #N/A #N/A #N/A #N/A #N/A #N/A #N/A
Soil Profile (BH-7)Shell & Auger20.0 m28-Jun-1530-Jun-15
Ash Pond Area Termination Depth : 20.85 m (RL 21.9 m)
RL 42.79 m
Dense grey fine sand (SP-SM)
Spec
ific G
ravity
- medium dense, 1.5 to 5.5 m
Medium dense to dense grey silty fine sand (SM ) - medium dense, 0.5 to 8.0 m
Grain Size Analysis
Non Plastic
SOIL DESCRIPTION
- dense, 5.5 to 11.0 m
Medium dense brown sandy silt, low plastic (CL)
- dense, 8.0 to 9.5 m
Depth, m
Samp
le No
.
Symb
olSPT (1)
Ground Water Depth :
Ground Water Level :
403506.46 m E E, 2805239.68 m N NSurface Elevation :
Atterberg Limits
Depth
of St
rata,
(m) Shear TestsDensity and Moisture
Non Plastic
7.10 m
RL 35.69 m
(1) SPT is outside NABL scope.
Extension of Barauni Super Critical Coal Fired Thermal Power Station at Barauni, Bihar.M/s. STEAG Energy Services (India) Pvt. Ltd.
Plate 16 of 154Project No. 215081-I

Location : Boring Method :UTM Coordinates : Casing Depth : Survey Coordinates : Boring Start :Chainage : Boring Finish :
From
To Field
Value
, Nf
Corre
cted V
alue,
N" Grav
el (%
)
Sand
(%)
Silt (
%)
Clay
(%)
Liquid
(%)
Plasti
c (%
)Pla
sticit
y Ind
ex
(%)
Bulk
Dens
ity
(gms/c
m3 )Dr
y Den
sity
(gms/c
m3 )Mo
isture
Con
tent
(%)
Type
of Te
stCo
nfinin
g Pr
essu
res,
(kg/cm
2)
Cohe
sion
Interc
ept, '
c' (kg
/cm2 )
Angle
of In
terna
l Fri
ction
,
(degre
es)
Soil Profile (BH-7)Shell & Auger20.0 m28-Jun-1530-Jun-15
Ash Pond Area Termination Depth : 20.85 m (RL 21.9 m)
RL 42.79 m
Spec
ific G
ravity
Grain Size Analysis
SOIL DESCRIPTION
Depth, m
Samp
le No
.
Symb
olSPT (1)
Ground Water Depth :
Ground Water Level :
403506.46 m E E, 2805239.68 m N NSurface Elevation :
Atterberg Limits
Depth
of St
rata,
(m) Shear TestsDensity and Moisture
7.10 m
RL 35.69 m
11.50 11.95 SPT8 47 39 #N/A #N/A #N/A #N/A ### #N/A #N/A #N/A #N/A #N/A #N/A #N/A #N/A
12.00 12.95 SPT9 48 39 13.50 0 65 33 2 #N/A #N/A #N/A #N/A #N/A #N/A #N/A
13.50 13.95 SPT10 51 41 #N/A #N/A #N/A #N/A ### #N/A #N/A #N/A #N/A #N/A #N/A #N/A #N/A
14.50 14.95 SPT11 56 44 #N/A #N/A #N/A #N/A ### #N/A #N/A #N/A #N/A #N/A #N/A #N/A #N/A
15.50 15.95 SPT12 66 51 #N/A #N/A #N/A #N/A ### #N/A #N/A #N/A #N/A #N/A #N/A #N/A #N/A
16.50 16.95 SPT13 68 52 #N/A #N/A #N/A #N/A ### #N/A #N/A #N/A #N/A #N/A #N/A #N/A #N/A
17.50 17.95 SPT14 75 56 #N/A #N/A #N/A #N/A ### #N/A #N/A #N/A #N/A #N/A #N/A #N/A #N/A
18.50 18.95 SPT15 100/ 25cm
100/ 25cm #N/A #N/A #N/A #N/A ### #N/A #N/A #N/A #N/A #N/A #N/A #N/A #N/A
19.50 19.89 SPT16 100/ 23cm
100/ 23cm 0 91 9 0 ### #N/A #N/A #N/A #N/A #N/A #N/A #N/A #N/A
20.50 20.85 SPT17 100/ 20cm
100/ 20cm 20.85 #N/A #N/A #N/A #N/A ### #N/A #N/A #N/A #N/A #N/A #N/A #N/A #N/A
#N/A #N/A #N/A #N/A #N/A #N/A #N/A ### #N/A #N/A #N/A #N/A #N/A #N/A #N/A #N/A
#N/A #N/A #N/A #N/A #N/A #N/A #N/A ### #N/A #N/A #N/A #N/A #N/A #N/A #N/A #N/A
Dense grey silty fine sand (SM)
Very dense grey fine sand (SP-SM)
Non Plastic
(1) SPT is outside NABL scope.
Extension of Barauni Super Critical Coal Fired Thermal Power Station at Barauni, Bihar.M/s. STEAG Energy Services (India) Pvt. Ltd.
Plate 17 of 154Project No. 215081-I

Location : Boring Method :UTM Coordinates : Casing Depth : Survey Coordinates : Boring Start :Chainage : Boring Finish :
From
To Field
Value
, Nf
Corre
cted V
alue,
N" Grav
el (%
)
Sand
(%)
Silt (
%)
Clay
(%)
Liquid
(%)
Plasti
c (%
)Pla
sticit
y Ind
ex
(%)
Bulk
Dens
ity
(gms/c
m3 )Dr
y Den
sity
(gms/c
m3 )Mo
isture
Con
tent
(%)
Type
of Te
stCo
nfinin
g Pr
essu
res,
(kg/cm
2)
Cohe
sion
Interc
ept, '
c' (kg
/cm2 )
Angle
of In
terna
l Fri
ction
,
(degre
es)
0.00 0.50 DS1 #N/A #N/A #N/A #N/A #N/A 27.3 15.4 11.9 #N/A #N/A #N/A #N/A #N/A #N/A #N/A
0.50 1.00 DS2 #N/A #N/A #N/A #N/A #N/A ### #N/A #N/A #N/A #N/A #N/A #N/A #N/A #N/A
1.00 1.45 SPT1 15 22 1.50 0 40 55 5 27.6 15.8 11.8 #N/A #N/A #N/A #N/A #N/A #N/A #N/A
2.00 2.45 SPT2 19 24 #N/A #N/A #N/A #N/A ### #N/A #N/A #N/A #N/A #N/A #N/A #N/A #N/A
3.00 3.30 UDS1 #N/A #N/A #N/A #N/A #N/A ### #N/A 1.85 1.56 18.5 #N/A DS 0.5 ,1, 1.5 0.0 28.3
4.00 4.45 SPT3 27 29 0 64 33 3 #N/A #N/A #N/A #N/A #N/A #N/A #N/A
5.00 5.45 SPT4 34 34 0 81 19 0 ### #N/A #N/A #N/A #N/A #N/A #N/A #N/A #N/A
6.00 6.30 UDS2 #N/A #N/A #N/A #N/A #N/A ### #N/A 1.82 1.61 13.3 #N/A DS 0.5 ,1, 1.5 0.0 33.7
7.00 7.45 SPT5 37 34 #N/A #N/A #N/A #N/A ### #N/A #N/A #N/A 2.64 #N/A #N/A #N/A #N/A
8.00 8.45 SPT6 28 25 #N/A #N/A #N/A #N/A ### #N/A #N/A #N/A #N/A #N/A #N/A #N/A #N/A
9.00 9.45 SPT7 40 35 #N/A #N/A #N/A #N/A ### #N/A #N/A #N/A #N/A #N/A #N/A #N/A #N/A
10.00 10.45 SPT8 42 36 11.00 #N/A #N/A #N/A #N/A ### #N/A #N/A #N/A #N/A #N/A #N/A #N/A #N/A
Soil Profile (BH-8)Shell & Auger20.0 m26-Jun-1528-Jun-15
Ash Pond Area Termination Depth : 20.35 m (RL 21.6 m)
RL 41.95 m
- dense, 9.0 to 11.0 m
Spec
ific G
ravity
- medium dense, 2.0 to 5.0 m
Medium dense to dense brown silty fine sand (SM)
Medium dense to dense grey silty fine sand (SM ) - medium dense, 0.5 to 8.0 m
Grain Size Analysis
Non Plastic
SOIL DESCRIPTION
- dense, 5.0 to 8.0 m
Medium dense brown sandy silt, low plastic (CL)
- dense, 8.0 to 11.0 m
Depth, m
Samp
le No
.
Symb
olSPT (1)
Ground Water Depth :
Ground Water Level :
404586.77 m E, 2805103.37 m NSurface Elevation :
Atterberg Limits Shear TestsDensity and MoistureRL 34.83 m
7.12 m
Depth
of St
rata,
(m)
(1) SPT is outside NABL scope.
Extension of Barauni Super Critical Coal Fired Thermal Power Station at Barauni, Bihar.M/s. STEAG Energy Services (India) Pvt. Ltd.
Plate 18 of 154Project No. 215081-I

Location : Boring Method :UTM Coordinates : Casing Depth : Survey Coordinates : Boring Start :Chainage : Boring Finish :
From
To Field
Value
, Nf
Corre
cted V
alue,
N" Grav
el (%
)
Sand
(%)
Silt (
%)
Clay
(%)
Liquid
(%)
Plasti
c (%
)Pla
sticit
y Ind
ex
(%)
Bulk
Dens
ity
(gms/c
m3 )Dr
y Den
sity
(gms/c
m3 )Mo
isture
Con
tent
(%)
Type
of Te
stCo
nfinin
g Pr
essu
res,
(kg/cm
2)
Cohe
sion
Interc
ept, '
c' (kg
/cm2 )
Angle
of In
terna
l Fri
ction
,
(degre
es)
Soil Profile (BH-8)Shell & Auger20.0 m26-Jun-1528-Jun-15
Ash Pond Area Termination Depth : 20.35 m (RL 21.6 m)
RL 41.95 m
Spec
ific G
ravity
Grain Size Analysis
SOIL DESCRIPTION
Depth, m
Samp
le No
.
Symb
olSPT (1)
Ground Water Depth :
Ground Water Level :
404586.77 m E, 2805103.37 m NSurface Elevation :
Atterberg Limits Shear TestsDensity and MoistureRL 34.83 m
7.12 m
Depth
of St
rata,
(m)
11.00 11.45 SPT9 45 38 12.00 0 90 10 0 ### #N/A #N/A #N/A #N/A #N/A #N/A #N/A #N/A
12.00 12.45 SPT10 56 46 #N/A #N/A #N/A #N/A ### #N/A #N/A #N/A #N/A #N/A #N/A #N/A #N/A
13.00 13.45 SPT11 58 47 #N/A #N/A #N/A #N/A ### #N/A #N/A #N/A #N/A #N/A #N/A #N/A #N/A
14.00 14.45 SPT12 59 47 #N/A #N/A #N/A #N/A ### #N/A #N/A #N/A #N/A #N/A #N/A #N/A #N/A
15.00 15.45 SPT13 66 52 #N/A #N/A #N/A #N/A ### #N/A #N/A #N/A #N/A #N/A #N/A #N/A #N/A
16.00 16.45 SPT14 70 54 #N/A #N/A #N/A #N/A ### #N/A #N/A #N/A #N/A #N/A #N/A #N/A #N/A
17.00 17.45 SPT15 78 59 #N/A #N/A #N/A #N/A ### #N/A #N/A #N/A #N/A #N/A #N/A #N/A #N/A
18.00 18.41 SPT16 100/ 26cm
100/ 26cm 0 79 21 0 ### #N/A #N/A #N/A #N/A #N/A #N/A #N/A #N/A
19.00 19.38 SPT17 100/ 23cm
100/ 23cm #N/A #N/A #N/A #N/A ### #N/A #N/A #N/A #N/A #N/A #N/A #N/A #N/A
20.00 20.35 SPT18 100/ 20cm
100/ 20cm 20.35 #N/A #N/A #N/A #N/A ### #N/A #N/A #N/A #N/A #N/A #N/A #N/A #N/A
#N/A #N/A #N/A #N/A #N/A #N/A #N/A ### #N/A #N/A #N/A #N/A #N/A #N/A #N/A #N/A
#N/A #N/A #N/A #N/A #N/A #N/A #N/A ### #N/A #N/A #N/A #N/A #N/A #N/A #N/A #N/A
Dense brown fine sand (SP-SM)
Very dense brown silty fine sand (SM)
(1) SPT is outside NABL scope.
Extension of Barauni Super Critical Coal Fired Thermal Power Station at Barauni, Bihar.M/s. STEAG Energy Services (India) Pvt. Ltd.
Plate 19 of 154Project No. 215081-I

SYMBOL
Summary of Borehole ProfilesLocation : Ash Pond Area
L E G E N DDESCRIPTION
Silty fine sand (SM)Fine sand (SP-SM)Sandy silt (CL)Fine sand (SP)Clayey silt (CI)Water table
BH-7RL: 42.79m
20.85 m
20
30
27
3741
75
42
N-Value
31
4851566668
100/25cm100/23cm
47
100/20cm
1.0
9.511.0
13.5
BH-4RL: 41.72m
20.85 m
19
27
25
3636
71
39
N-Value
19
4248565868
80100/24cm
40
100/20cm
1.5
4.55.5
11.0
15.5
17.5
7.5
44
40
36
32
28
24
Redu
ced
Leve
l, m
20
BH-3RL: 41.70m
20.36m
13
2521
14
2829
66
35
N-Value
14
10
4242465154
100/25cm100/21cm
0.5
8.0
2.0
9.0
14.0
16.0
0.5
BH-1RL: 42.79m
20.36m
16
2422
32
3432
36
65
36
N-Value
28
14
11.0
3939444651
100/26cm100/21cm
14.0
BH-5RL: 41.70m
20.36m
19
2420
36
3842
89
48
N-Value
20
17
7.0
5862687076
100/25cm100/21cm
2.0 2.0
BH-6RL: 41.92m
20.36m
11
2015
30
3433
37
75
46
N-Value
24
9
7.0
4651585966
100/26cm100/21cm
1.019
3427
28
4245
100/26cm
56
37
15
5859667078
40
BH-8RL: 41.95m
20.35m
N-Value
100/23cm100/20cm
1.5
11.012.0
16
BH-2RL: 41.70m
20.95m
15
21
33
2628
58
34
N-Value
24
4141424551
6870
36
91
0.5
10.812.0
14.5
16.5
2.53.5
Extension of Barauni Super Critical Coal Fired Thermal Power Station at Barauni, Bihar.M/s. STEAG Energy Services (India) Pvt. Ltd.
Plate 20 of 154Project No. 215081-I

Symbol
Ash Pond Area
Location42.7941.7041.7041.7241.7041.92BH-6
BH-5
BH-2BH-1
BH-4BH-3
Field SPT Values vs. Reduced Level
Standard Penetration Test
Borehole Number
IS : 2131-1981, RA-2007
Reduced Level, mBorehole Details
18
20
22
24
26
28
30
32
34
36
38
40
420 10 20 30 40 50 60 70 80 90 100
Field SPT Value (N)
Redu
ced L
evel,
m
100/26cm100/25cm100/24cm
100/25cm100/26cm
Extension of Barauni Super Critical Coal Fired Thermal Power Station at Barauni, Bihar.M/s. STEAG Energy Services (India) Pvt. Ltd.
Plate 21 of 154Project No. 215081-I

Symbol
41.72BH-5 41.70BH-6 41.92
Reduced Level, m LocationBH-1 42.79
Ash Pond AreaBH-2 41.70BH-3 41.70BH-4
Corrected SPT Values vs. Reduced Level
Standard Penetration Test IS : 2131-1981, RA-2007
Borehole DetailsBorehole Number
18
20
22
24
26
28
30
32
34
36
38
40
420 10 20 30 40 50 60 70 80
Corrected SPT Value (N")
Redu
ced L
evel,
m
Extension of Barauni Super Critical Coal Fired Thermal Power Station at Barauni, Bihar.M/s. STEAG Energy Services (India) Pvt. Ltd.
Plate 22 of 154Project No. 215081-I

Symbol
Reduced Level, m
Ash Pond Area
Location42.7941.95
Borehole Details
Standard Penetration Test IS : 2131-1981, RA-2007
Borehole Number
BH-8BH-7
Field SPT Values vs. Reduced Level
18
20
22
24
26
28
30
32
34
36
38
40
420 10 20 30 40 50 60 70 80 90 100
Field SPT Value (N)
Redu
ced L
evel,
m
100/25cm100/26cm
Extension of Barauni Super Critical Coal Fired Thermal Power Station at Barauni, Bihar.M/s. STEAG Energy Services (India) Pvt. Ltd.
Plate 23 of 154Project No. 215081-I

Symbol
Borehole Number Reduced Level, m LocationBH-7 42.79 Ash Pond AreaBH-8 41.95
Borehole Details
Standard Penetration Test IS : 2131-1981, RA-2007
Corrected SPT Values vs. Reduced Level
18
20
22
24
26
28
30
32
34
36
38
40
420 10 20 30 40 50 60 70 80
Corrected SPT Value (N")
Redu
ced L
evel,
m
Extension of Barauni Super Critical Coal Fired Thermal Power Station at Barauni, Bihar.M/s. STEAG Energy Services (India) Pvt. Ltd.
Plate 24 of 154Project No. 215081-I

Sl. No.
Time in Minutes
Water Level in Intake
Pipe,cm
Head, cm
Sl. No.
Time in Minutes
Water Level in Intake
Pipe,cm
Head, cm
1 0.0 0.0 2352 1.0 1.0 2343 2.0 2.0 2334 3.0 3.0 2325 4.0 4.0 2316 5.0 5.0 2307 7.0 7.0 2288 9.0 9.0 2269 11.0 11.0 224
10 13.0 13.0 22211 15.0 15.0 22012 20.0 20.0 21513 25.0 25.0 21014 30.0 30.0 20515 35.0 35.0 200
k = Coefficient of Permeability =
Where:L = 50.0 cm d = 15.0 cm
2L/d = 6.67 R = 7.5 cmh1/ho = 0.86 t1 = 30 minutesh2/ho = 0.84 t2 = 35.6 minutesh1/h2 = 1.025
7.8E-05 cm/secDetermination of Coefficient of Permeability (FPT-1)
Depth of Water Table :
Field Permeability Test No.: FPT-1By Falling Head Method
IS: 5529-Part-1-1985, RA-2009
Borehole No. : Location :
Reduced Level (RL) : UTM Coordinates :
N/A403339.31 m E, 2805366.99 m N
Soil Classification :
Depth of Borehole : Depth of bottom of casing below EGL :
Diameter of Intake Pipe : Length of Test Section :
2.0 m1.50 m
Silty fine sand
Height of Casing above GL : Hydraulic Head at Start of test :
15.0 cm50.0 cm7.0 m0.60 m235 cm
Test Details
k =
BH : 1Ash Pond Area
Dia of Intake Pipe: 15 cm
1.5 m
Test
Secti
on: 5
0 cm
EGL
0.6 m
2 m
d2
8L(t2 t1)ln
2Ld
lnh1
h2
Calculations based on semilog plot of Head Ratio vs. Time, as per IS:5529 (Part-I)
Extension of Barauni Super Critical Coal Fired Thermal Power Station at Barauni, Bihar.M/s. STEAG Energy Services (India) Pvt. Ltd.
Plate 25 of 154Project No. 215081-I
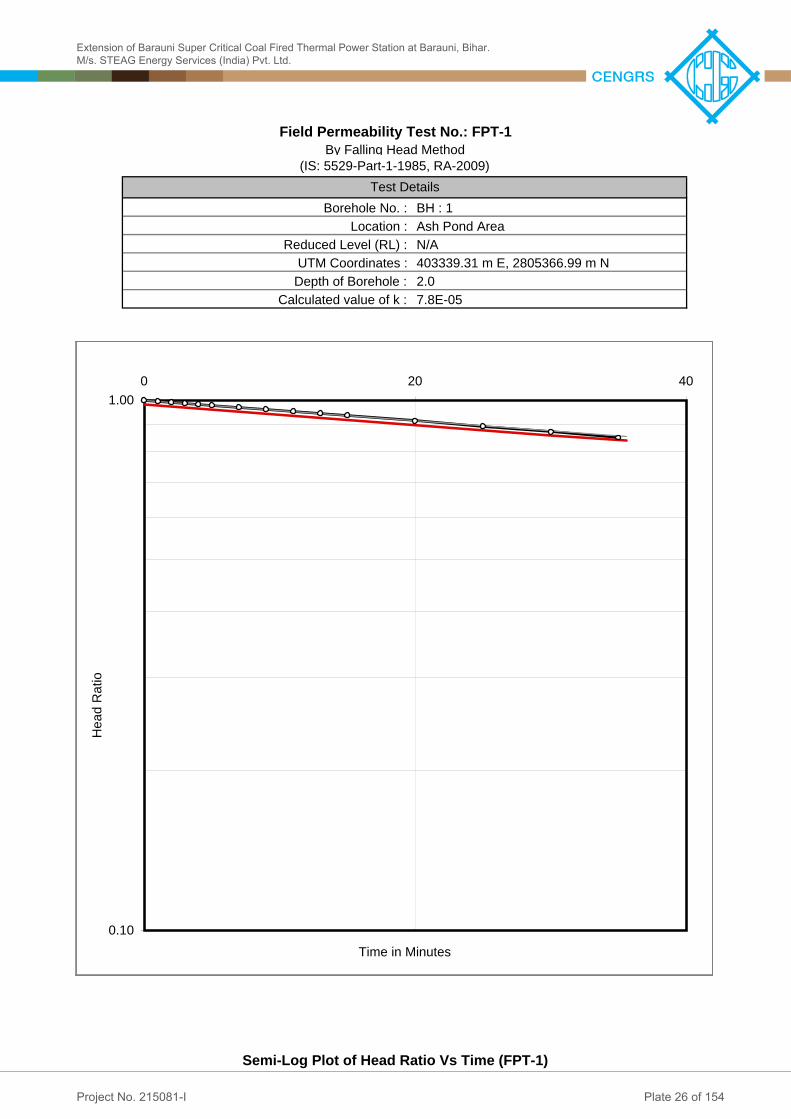
Semi-Log Plot of Head Ratio Vs Time (FPT-1)
Test Details
Depth of Borehole : Calculated value of k :
2.0
By Falling Head MethodField Permeability Test No.: FPT-1
(IS: 5529-Part-1-1985, RA-2009)
7.8E-05
Reduced Level (RL) : UTM Coordinates :
N/A403339.31 m E, 2805366.99 m N
Borehole No. : Location :
BH : 1Ash Pond Area
0.10
1.000 20 40
Time in Minutes
Head
Rati
o
Extension of Barauni Super Critical Coal Fired Thermal Power Station at Barauni, Bihar.M/s. STEAG Energy Services (India) Pvt. Ltd.
Plate 26 of 154Project No. 215081-I

Sl. No.
Time in Minutes
Water Level in Intake
Pipe,cm
Head, cm
Sl. No.
Time in Minutes
Water Level in Intake
Pipe,cm
Head, cm
1 0.0 0.0 406 19 55.0 232.0 1742 1.0 20.0 386 20 60.0 240.0 1663 2.0 33.0 373 21 65.0 247.0 1594 3.0 44.0 362 22 70.0 254.0 1525 4.0 53.0 353 23 75.0 259.0 1476 5.0 64.0 342 24 80.0 265.0 1417 7.0 73.0 333 25 85.0 270.0 1368 9.0 90.0 316 26 90.0 274.0 1329 11.0 91.0 315 27 95.0 278.0 128
10 13.0 110.0 296 28 100.0 282.0 12411 15.0 119.0 287 29 105.0 286.0 12012 20.0 145.0 26113 25.0 163.0 24314 30.0 175.0 23115 35.0 190.0 21616 40.0 203.0 20317 45.0 216.0 19018 50.0 225.0 181
k = Coefficient of Permeability =
Where:L = 50.0 cm d = 15.0 cm
2L/d = 6.67 R = 7.5 cmh1/ho = 0.46 t1 = 30 minutesh2/ho = 0.30 t2 = 106 minutesh1/h2 = 1.539
1.0E-04 cm/secDetermination of Coefficient of Permeability (FPT-2)
Depth of Water Table :
Field Permeability Test No.: FPT-2By Falling Head Method
IS: 5529-Part-1-1985, RA-2009
Borehole No. : Location :
Reduced Level (RL) : UTM Coordinates :
N/A403339.31 m E, 2805366.99 m N
Soil Classification :
Depth of Borehole : Depth of bottom of casing below EGL :
Diameter of Intake Pipe : Length of Test Section :
4.0 m3.50 m
Silty fine sand
Height of Casing above GL : Hydraulic Head at Start of test :
15.0 cm50.0 cm7.0 m0.31 m406 cm
Test Details
k =
BH : 1Ash Pond Area
Dia of Intake Pipe: 15 cm
3.5 m
Test
Secti
on: 5
0 cm
EGL
0.31 m
4 m
d2
8L(t2 t1)ln
2Ld
lnh1
h2
Calculations based on semilog plot of Head Ratio vs. Time, as per IS:5529 (Part-I)
Extension of Barauni Super Critical Coal Fired Thermal Power Station at Barauni, Bihar.M/s. STEAG Energy Services (India) Pvt. Ltd.
Plate 27 of 154Project No. 215081-I

Semi-Log Plot of Head Ratio Vs Time (FPT-2)
Test Details
Depth of Borehole : Calculated value of k :
4.0
By Falling Head MethodField Permeability Test No.: FPT-2
(IS: 5529-Part-1-1985, RA-2009)
1.0E-04
Reduced Level (RL) : UTM Coordinates :
N/A403339.31 m E, 2805366.99 m N
Borehole No. : Location :
BH : 1Ash Pond Area
0.10
1.000 20 40 60 80 100 120
Time in Minutes
Head
Rati
o
Extension of Barauni Super Critical Coal Fired Thermal Power Station at Barauni, Bihar.M/s. STEAG Energy Services (India) Pvt. Ltd.
Plate 28 of 154Project No. 215081-I

Sl. No.
Time in Minutes
Water Level in Intake
Pipe,cm
Head, cm
Sl. No.
Time in Minutes
Water Level in Intake
Pipe,cm
Head, cm
1 0.0 0.0 600 19 31.0 433.0 1672 1.0 65.0 535 20 36.0 447.0 1533 2.0 118.0 482 21 41.0 458.0 1424 3.0 155.0 445 22 46.0 466.0 1345 4.0 185.0 4156 5.0 220.0 3807 6.0 245.0 3558 7.0 270.0 3309 8.0 285.0 315
10 9.0 300.0 30011 10.0 308.0 29212 11.0 318.0 28213 13.0 336.0 26414 15.0 353.0 24715 17.0 364.0 23616 19.0 380.0 22017 21.0 393.0 20718 26.0 415.0 185
k = Coefficient of Permeability =
Where:L = 50.0 cm d = 15.0 cm
2L/d = 6.67 R = 7.5 cmh1/ho = 0.28 t1 = 30 minutesh2/ho = 0.17 t2 = 61.4 minutesh1/h2 = 1.592
2.6E-04 cm/sec
Determination of Coefficient of Permeability (FPT-3)
Depth of Water Table :
Field Permeability Test No.: FPT-3By Falling Head Method
IS: 5529-Part-1-1985, RA-2009
Borehole No. : Location :
Reduced Level (RL) : UTM Coordinates :
N/A403339.31 m E, 2805366.99 m N
Soil Classification :
Depth of Borehole : Depth of bottom of casing below EGL :
Diameter of Intake Pipe : Length of Test Section :
6.0 m5.50 m
Silty fine sand
Height of Casing above GL : Hydraulic Head at Start of test :
15.0 cm50.0 cm7.0 m0.25 m600 cm
Test Details
k =
BH : 1Ash Pond Area
Dia of Intake Pipe: 15 cm
5.5 m
Test
Secti
on: 5
0 cm
EGL
0.25 m
6 m
d2
8L(t2 t1)ln
2Ld
lnh1
h2
Calculations based on semilog plot of Head Ratio vs. Time, as per IS:5529 (Part-I)
Extension of Barauni Super Critical Coal Fired Thermal Power Station at Barauni, Bihar.M/s. STEAG Energy Services (India) Pvt. Ltd.
Plate 29 of 154Project No. 215081-I
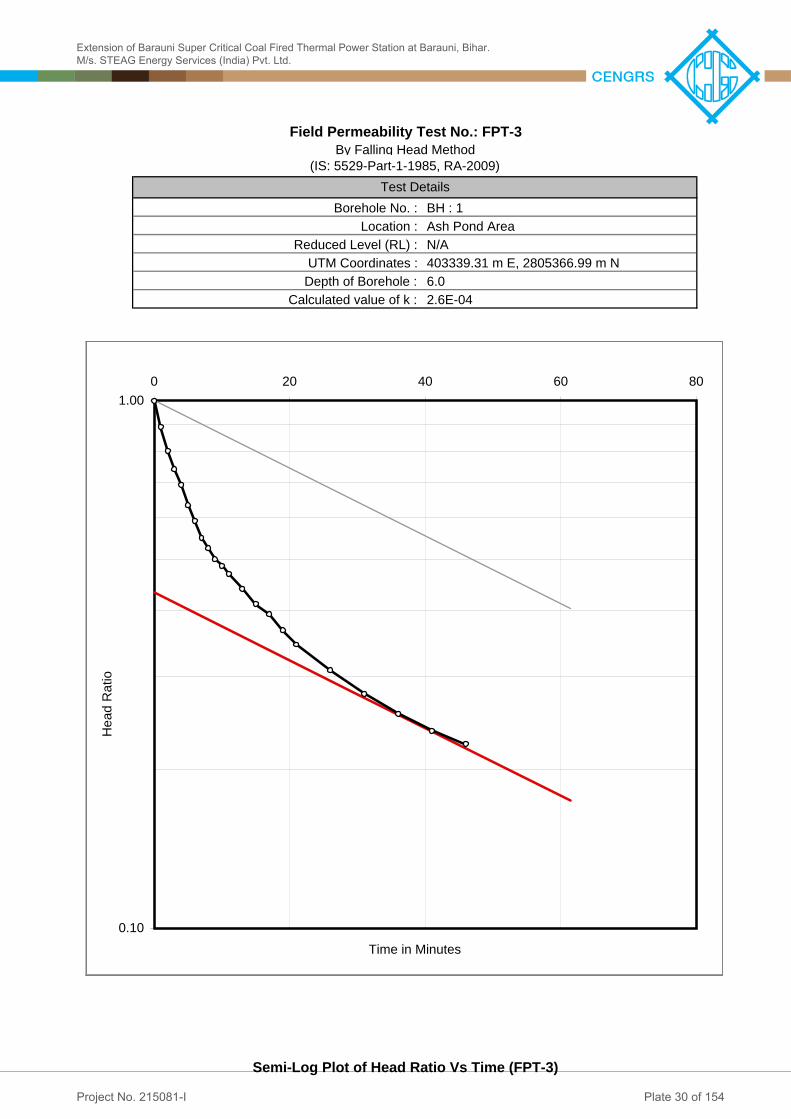
Semi-Log Plot of Head Ratio Vs Time (FPT-3)
Test Details
Depth of Borehole : Calculated value of k :
6.0
By Falling Head MethodField Permeability Test No.: FPT-3
(IS: 5529-Part-1-1985, RA-2009)
2.6E-04
Reduced Level (RL) : UTM Coordinates :
N/A403339.31 m E, 2805366.99 m N
Borehole No. : Location :
BH : 1Ash Pond Area
0.10
1.000 20 40 60 80
Time in Minutes
Head
Rati
o
Extension of Barauni Super Critical Coal Fired Thermal Power Station at Barauni, Bihar.M/s. STEAG Energy Services (India) Pvt. Ltd.
Plate 30 of 154Project No. 215081-I

Sl. No.
Time in Minutes
Water Level in Intake
Pipe,cm
Head, cm
Sl. No.
Time in Minutes
Water Level in Intake
Pipe,cm
Head, cm
1 0.0 0.0 187 19 40.0 160.0 272 1.0 30.0 157 20 45.0 164.0 233 2.0 52.0 135 21 50.0 167.0 204 3.0 65.0 122 22 55.0 169.0 185 4.0 75.0 112 23 60.0 171.0 166 6.0 87.0 1007 8.0 99.0 888 10.0 107.0 809 12.0 115.0 72
10 14.0 122.0 6511 16.0 128.0 5912 18.0 133.0 5413 20.0 138.0 4914 22.0 142.0 4515 24.0 145.0 4216 26.0 148.0 3917 30.0 152.0 3518 35.0 157.0 30
k = Coefficient of Permeability =
Where:L = 50.0 cm d = 15.0 cm
2L/d = 6.67 R = 7.5 cmh1/ho = 0.18 t1 = 30 minutesh2/ho = 0.07 t2 = 68.1 minutesh1/h2 = 2.683
4.6E-04 cm/secDetermination of Coefficient of Permeability (FPT-4)
Depth of Water Table :
Field Permeability Test No.: FPT-4By Falling Head Method
IS: 5529-Part-1-1985, RA-2009
Borehole No. : Location :
Reduced Level (RL) : UTM Coordinates :
N/A403577.35 m E, 2806143.01 m N
Soil Classification :
Depth of Borehole : Depth of bottom of casing below EGL :
Diameter of Intake Pipe : Length of Test Section :
2.0 m1.50 m
Silty fine sand
Height of Casing above GL : Hydraulic Head at Start of test :
15.0 cm50.0 cm7.1 m0.12 m187 cm
Test Details
k =
BH : 2Ash Pond Area
Dia of Intake Pipe: 15 cm
1.5 m
Test
Secti
on: 5
0 cm
EGL
0.12 m
2 m
d2
8L(t2 t1)ln
2Ld
lnh1
h2
Calculations based on semilog plot of Head Ratio vs. Time, as per IS:5529 (Part-I)
Extension of Barauni Super Critical Coal Fired Thermal Power Station at Barauni, Bihar.M/s. STEAG Energy Services (India) Pvt. Ltd.
Plate 31 of 154Project No. 215081-I
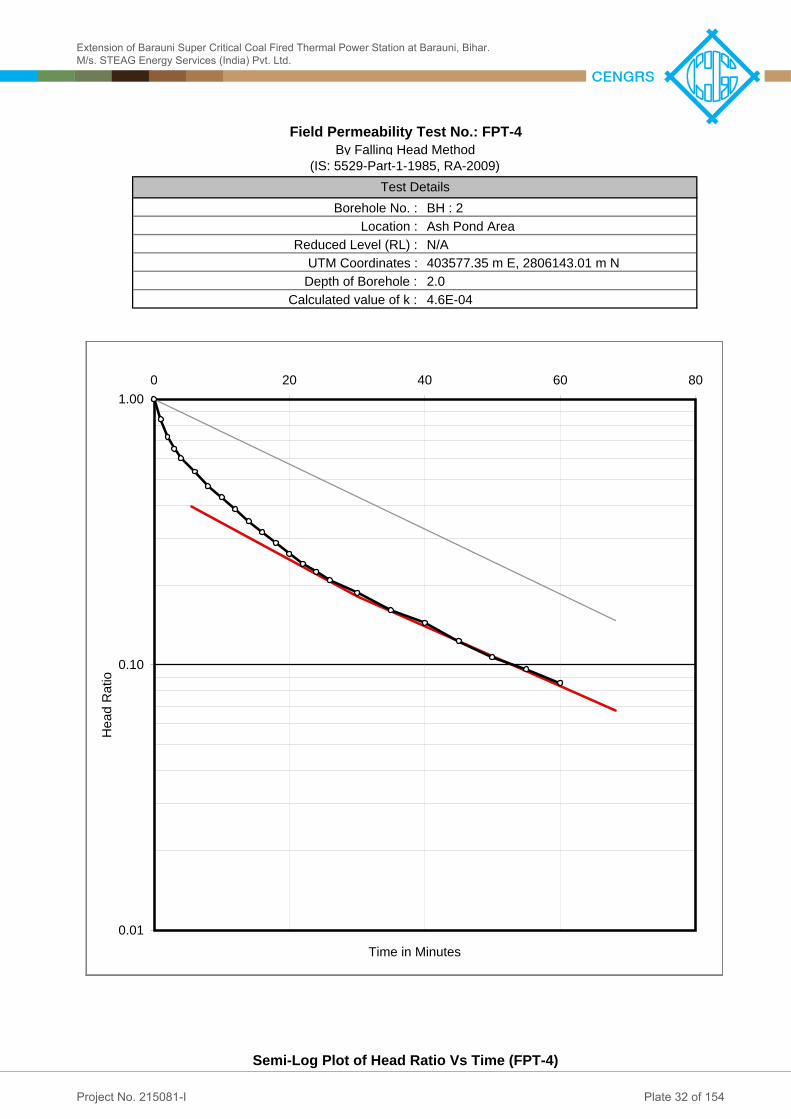
Semi-Log Plot of Head Ratio Vs Time (FPT-4)
Test Details
Depth of Borehole : Calculated value of k :
2.0
By Falling Head MethodField Permeability Test No.: FPT-4
(IS: 5529-Part-1-1985, RA-2009)
4.6E-04
Reduced Level (RL) : UTM Coordinates :
N/A403577.35 m E, 2806143.01 m N
Borehole No. : Location :
BH : 2Ash Pond Area
0.01
0.10
1.000 20 40 60 80
Time in Minutes
Head
Rati
o
Extension of Barauni Super Critical Coal Fired Thermal Power Station at Barauni, Bihar.M/s. STEAG Energy Services (India) Pvt. Ltd.
Plate 32 of 154Project No. 215081-I

Sl. No.
Time in Minutes
Water Level in Intake
Pipe,cm
Head, cm
Sl. No.
Time in Minutes
Water Level in Intake
Pipe,cm
Head, cm
1 0.0 0.0 391 19 29.0 140.0 2512 1.0 29.0 362 20 31.0 145.0 2463 2.0 35.0 356 21 33.0 149.0 2424 3.0 44.0 347 22 35.0 154.0 2375 4.0 51.0 340 23 40.0 166.0 2256 5.0 57.0 334 24 45.0 175.0 2167 6.0 62.0 329 25 50.0 185.0 2068 7.0 70.0 321 26 55.0 195.0 1969 9.0 78.0 313 27 60.0 206.0 185
10 11.0 86.0 305 28 65.0 215.0 17611 13.0 93.0 298 29 70.0 222.0 16912 15.0 100.0 291 30 75.0 228.0 16313 17.0 106.0 285 31 80.0 232.0 15914 19.0 112.0 27915 21.0 117.0 27416 23.0 124.0 26717 25.0 130.0 26118 27.0 136.0 255
k = Coefficient of Permeability =
Where:L = 50.0 cm d = 15.0 cm
2L/d = 6.67 R = 7.5 cmh1/ho = 0.46 t1 = 61.2 minutesh2/ho = 0.33 t2 = 110.4 minutesh1/h2 = 1.399
1.2E-04 cm/secDetermination of Coefficient of Permeability (FPT-5)
Depth of Water Table :
Field Permeability Test No.: FPT-5By Falling Head Method
IS: 5529-Part-1-1985, RA-2009
Borehole No. : Location :
Reduced Level (RL) : UTM Coordinates :
N/A403577.35 m E, 2806143.01 m N
Soil Classification :
Depth of Borehole : Depth of bottom of casing below EGL :
Diameter of Intake Pipe : Length of Test Section :
4.0 m3.50 m
Silty fine sand
Height of Casing above GL : Hydraulic Head at Start of test :
15.0 cm50.0 cm7.1 m0.16 m391 cm
Test Details
k =
BH : 2Ash Pond Area
Dia of Intake Pipe: 15 cm
3.5 m
Test
Secti
on: 5
0 cm
EGL
0.16 m
4 m
d2
8L(t2 t1)ln
2Ld
lnh1
h2
Calculations based on semilog plot of Head Ratio vs. Time, as per IS:5529 (Part-I)
Extension of Barauni Super Critical Coal Fired Thermal Power Station at Barauni, Bihar.M/s. STEAG Energy Services (India) Pvt. Ltd.
Plate 33 of 154Project No. 215081-I

Semi-Log Plot of Head Ratio Vs Time (FPT-5)
Test Details
Depth of Borehole : Calculated value of k :
4.0
By Falling Head MethodField Permeability Test No.: FPT-5
(IS: 5529-Part-1-1985, RA-2009)
1.2E-04
Reduced Level (RL) : UTM Coordinates :
N/A403577.35 m E, 2806143.01 m N
Borehole No. : Location :
BH : 2Ash Pond Area
0.10
1.000 20 40 60 80 100 120
Time in Minutes
Head
Rati
o
Extension of Barauni Super Critical Coal Fired Thermal Power Station at Barauni, Bihar.M/s. STEAG Energy Services (India) Pvt. Ltd.
Plate 34 of 154Project No. 215081-I

Sl. No.
Time in Minutes
Water Level in Intake
Pipe,cm
Head, cm
Sl. No.
Time in Minutes
Water Level in Intake
Pipe,cm
Head, cm
1 0.0 0.0 658 19 53.0 454.0 2042 1.0 100.0 558 20 63.0 454.0 2043 2.0 151.0 507 21 73.0 454.0 2044 3.0 180.0 4785 4.0 205.0 4536 5.0 230.0 4287 7.0 274.0 3848 9.0 309.0 3499 11.0 324.0 334
10 13.0 337.0 32111 15.0 355.0 30312 17.0 368.0 29013 19.0 379.0 27914 21.0 388.0 27015 23.0 395.0 26316 29.0 418.0 24017 33.0 430.0 22818 43.0 449.0 209
k = Coefficient of Permeability =
Where:L = 50.0 cm d = 15.0 cm
2L/d = 6.67 R = 7.5 cmh1/ho = 0.32 t1 = 30 minutesh2/ho = 0.31 t2 = 73.6 minutesh1/h2 = 1.030
1.2E-05 cm/secDetermination of Coefficient of Permeability (FPT-6)
Depth of Water Table :
Field Permeability Test No.: FPT-6By Falling Head Method
IS: 5529-Part-1-1985, RA-2009
Borehole No. : Location :
Reduced Level (RL) : UTM Coordinates :
N/A403577.35 m E, 2806143.01 m N
Soil Classification :
Depth of Borehole : Depth of bottom of casing below EGL :
Diameter of Intake Pipe : Length of Test Section :
6.0 m5.50 m
Silty fine sand
Height of Casing above GL : Hydraulic Head at Start of test :
15.0 cm50.0 cm7.1 m0.83 m658 cm
Test Details
k =
BH : 2Ash Pond Area
Dia of Intake Pipe: 15 cm
5.5 m
Test
Secti
on: 5
0 cm
EGL
0.83 m
6 m
d2
8L(t2 t1)ln
2Ld
lnh1
h2
Calculations based on semilog plot of Head Ratio vs. Time, as per IS:5529 (Part-I)
Extension of Barauni Super Critical Coal Fired Thermal Power Station at Barauni, Bihar.M/s. STEAG Energy Services (India) Pvt. Ltd.
Plate 35 of 154Project No. 215081-I

Semi-Log Plot of Head Ratio Vs Time (FPT-6)
Test Details
Depth of Borehole : Calculated value of k :
6.0
By Falling Head MethodField Permeability Test No.: FPT-6
(IS: 5529-Part-1-1985, RA-2009)
1.2E-05
Reduced Level (RL) : UTM Coordinates :
N/A403577.35 m E, 2806143.01 m N
Borehole No. : Location :
BH : 2Ash Pond Area
0.10
1.000 20 40 60 80
Time in Minutes
Head
Rati
o
Extension of Barauni Super Critical Coal Fired Thermal Power Station at Barauni, Bihar.M/s. STEAG Energy Services (India) Pvt. Ltd.
Plate 36 of 154Project No. 215081-I

8.0 m = 800 cm800 cm
15 cm710.0 cm
92 cm802.0 cm
Time, min Q(litre)
Discharge, Q
litre/min)
Qaverage
litre/min
Borehole Radius (r), mm
Differential Head (H),
mC k, cm/s
0 92.0 0.0001 92.4 40.02 92.7 30.04 93.3 30.06 93.8 25.08 94.1 15.010 94.4 15.015 95.3 18.020 96.3 20.0
Equation used for calculationWhere:
Q=Discharge,(litre/min) H=Differential Head,(m)
Silty fine sandDifferential Head :
Effective Height of water in Tank :
Depth of Borehole : Depth of bottom of casing below EGL :
Diameter of Intake Pipe :
r=radius of casing,(mm)
Determination of Coefficient of Permeability (FPT-7)
Soil Classification :
Field Permeability Test No. : FPT-7By Constant Head Method
IS: 5529-Part-1-1985, RA-2009
Borehole No. : Location :
Test DetailsBH-2Ash Pond Area
Depth of Water Table :
403577.35 m E, 2806143.01 m NUTM Coordinates :
4E-03 8.6E-0317.0 75 8.0
HQCk *
rC
5.51
EGL
Head of Water in Tank
Water Meter
Valve
710
cm
92cm
Water TankWater Tank
Extension of Barauni Super Critical Coal Fired Thermal Power Station at Barauni, Bihar.M/s. STEAG Energy Services (India) Pvt. Ltd.
Plate 37 of 154Project No. 215081-I

10 m = 1000 cm1000.0 cm
15 cm710.0 cm
92 cm802.0 cm
Time, min Q(litre)
Discharge, Q
litre/min)
Qaverage
litre/min
Borehole Radius (r), mm
Differential Head (H),
mC k, cm/s
0 110.0 0.0001 110.4 40.02 110.7 30.04 111.2 25.06 111.7 25.08 112.3 30.010 112.9 30.015 114.4 30.020 115.8 28.0
Equation used for calculationWhere:
Q=Discharge,(litre/min) H=Differential Head,(m)
4E-03 1.5E-0229.5 75 8.0
Ash Pond Area
Depth of Water Table :
403577.35 m E, 2806143.01 m NUTM Coordinates :
Soil Classification :
Field Permeability Test No. : FPT-8By Constant Head Method
IS: 5529-Part-1-1985, RA-2009
Borehole No. : Location :
Test DetailsBH-2
Determination of Coefficient of Permeability (FPT-8)
r=radius of casing,(mm)
Effective Height of water in Tank :
Depth of Borehole : Depth of bottom of casing below EGL :
Diameter of Intake Pipe :
Differential Head : Silty fine sand
HQCk *
rC
5.51
EGL
Head of Water in Tank
Water Meter
Valve
710
cm
92cm
Water TankWater Tank
Extension of Barauni Super Critical Coal Fired Thermal Power Station at Barauni, Bihar.M/s. STEAG Energy Services (India) Pvt. Ltd.
Plate 38 of 154Project No. 215081-I

12 m = 1200 cm1200.0 cm
15 cm710.0 cm
92 cm802.0 cm
Time, min Q(litre)
Discharge, Q
litre/min)
Qaverage
litre/min
Borehole Radius (r), mm
Differential Head (H),
mC k, cm/s
0 118.0 0.0001 118.4 35.02 118.7 35.04 119.5 40.06 120.2 35.08 121.0 40.010 121.7 35.015 123.5 36.020 125.3 36.025 127.0 34.030 128.7 34.0
Equation used for calculationWhere:
Q=Discharge,(litre/min) H=Differential Head,(m)
1.8E-028.0 4E-03
Fine sandDifferential Head :
Effective Height of water in Tank :
Depth of Borehole : Depth of bottom of casing below EGL :
Diameter of Intake Pipe :
r=radius of casing,(mm)
75
Determination of Coefficient of Permeability (FPT-9)
36.1
Soil Classification :
Field Permeability Test No. : FPT-9By Constant Head Method
IS: 5529-Part-1-1985, RA-2009
Borehole No. : Location :
Test DetailsBH-2Ash Pond Area
Depth of Water Table :
403577.35 m E, 2806143.01 m NUTM Coordinates :
HQCk *
rC
5.51
EGL
Head of Water in Tank
Water Meter
Valve
710
cm
92cm
Water TankWater Tank
Extension of Barauni Super Critical Coal Fired Thermal Power Station at Barauni, Bihar.M/s. STEAG Energy Services (India) Pvt. Ltd.
Plate 39 of 154Project No. 215081-I

14 m = 1400 cm1400.0 cm
15 cm710.0 cm
92 cm802.0 cm
Time, min Q(litre)
Discharge, Q
litre/min)
Qaverage
litre/min
Borehole Radius (r), mm
Differential Head (H),
mC k, cm/s
0 129.4 0.0001 129.8 40.02 130.3 50.04 131.1 40.06 132.2 55.08 133.0 40.010 133.8 40.0
Equation used for calculationWhere:
Q=Discharge,(litre/min) H=Differential Head,(m)
45.0 75 8.0 4E-03
Ash Pond Area
Depth of Water Table :
403577.35 m E, 2806143.01 m NUTM Coordinates :
Soil Classification :
Field Permeability Test No. : FPT-10By Constant Head Method
IS: 5529-Part-1-1985, RA-2009
Borehole No. : Location :
Test DetailsBH-2
Determination of Coefficient of Permeability (FPT-10)
r=radius of casing,(mm)
Effective Height of water in Tank :
Depth of Borehole : Depth of bottom of casing below EGL :
Diameter of Intake Pipe :
Differential Head :
2.3E-02
Fine sand
HQCk *
rC
5.51
EGL
Head of Water in Tank
Water Meter
Valve
710
cm
92cm
Water TankWater Tank
Extension of Barauni Super Critical Coal Fired Thermal Power Station at Barauni, Bihar.M/s. STEAG Energy Services (India) Pvt. Ltd.
Plate 40 of 154Project No. 215081-I

16 m = 1600 cm1600 cm
15 cm710.0 cm
92 cm802.0 cm
Time, min Q(litre)
Discharge, Q
litre/min)
Qaverage
litre/min
Borehole Radius (r), mm
Differential Head (H),
mC k, cm/s
0 134.0 0.0001 134.4 40.02 134.8 40.04 135.4 30.06 136.1 35.08 136.8 35.010 137.5 35.015 139.3 36.0
Equation used for calculationWhere:
Q=Discharge,(litre/min) H=Differential Head,(m)
1.8E-02
Fine sandDifferential Head :
Effective Height of water in Tank :
Depth of Borehole : Depth of bottom of casing below EGL :
Diameter of Intake Pipe :
r=radius of casing,(mm)
Determination of Coefficient of Permeability (FPT-11)
Soil Classification :
Field Permeability Test No. : FPT-11By Constant Head Method
IS: 5529-Part-1-1985, RA-2009
Borehole No. : Location :
Test DetailsBH-2Ash Pond Area
Depth of Water Table :
403577.35 m E, 2806143.01 m NUTM Coordinates :
35.3 75 8.0 4E-03
HQCk *
rC
5.51
EGL
Head of Water in Tank
Water Meter
Valve
710
cm
92cm
Water TankWater Tank
Extension of Barauni Super Critical Coal Fired Thermal Power Station at Barauni, Bihar.M/s. STEAG Energy Services (India) Pvt. Ltd.
Plate 41 of 154Project No. 215081-I

18 m = 1800 cm1800 cm
15 cm710.0 cm
92 cm802.0 cm
Time, min Q(litre)
Discharge, Q
litre/min)
Qaverage
litre/min
Borehole Radius (r), mm
Differential Head (H),
mC k, cm/s
0 139.4 0.0001 139.7 30.02 139.9 20.04 140.5 30.06 141.0 25.08 141.4 20.010 141.9 25.015 143.0 22.020 144.2 24.0
Equation used for calculationWhere:
Q=Discharge,(litre/min) H=Differential Head,(m)
8.07523.2
Ash Pond Area
Depth of Water Table :
403577.35 m E, 2806143.01 m NUTM Coordinates :
Soil Classification :
Effective Height of water in Tank :
Depth of Borehole :
IS: 5529-Part-1-1985, RA-2009
Borehole No. : Location :
Test DetailsBH-2
Determination of Coefficient of Permeability (FPT-12)
r=radius of casing,(mm)
Differential Head :
Field Permeability Test No. : FPT-12By Constant Head Method
Depth of bottom of casing below EGL : Diameter of Intake Pipe :
Fine sand
4E-03 1.2E-02
HQCk *
rC
5.51
EGL
Head of Water in Tank
Water Meter
Valve
710
cm
92cm
Water TankWater Tank
Extension of Barauni Super Critical Coal Fired Thermal Power Station at Barauni, Bihar.M/s. STEAG Energy Services (India) Pvt. Ltd.
Plate 42 of 154Project No. 215081-I

20 m = 2000 cm2000 cm
15 cm710.0 cm
92 cm802.0 cm
Time, min Q(litre)
Discharge, Q
litre/min)
Qaverage
litre/min
Borehole Radius (r), mm
Differential Head (H),
mC k, cm/s
0 144.6 0.0001 144.8 20.02 145.0 20.04 145.4 20.06 145.8 20.08 146.1 15.010 146.5 20.015 147.6 22.020 148.5 18.0
Equation used for calculationWhere:
Q=Discharge,(litre/min) H=Differential Head,(m)
Fine sand
4E-03 9.6E-03
Depth of bottom of casing below EGL : Diameter of Intake Pipe :
Differential Head :
Field Permeability Test No. : FPT-13By Constant Head Method
r=radius of casing,(mm)
Determination of Coefficient of Permeability (FPT-13)
IS: 5529-Part-1-1985, RA-2009
Borehole No. : Location :
Test DetailsBH-2
8.07519.0
Ash Pond Area
Depth of Water Table :
403577.35 m E, 2806143.01 m NUTM Coordinates :
Soil Classification :
Effective Height of water in Tank :
Depth of Borehole :
HQCk *
rC
5.51
EGL
Head of Water in Tank
Water Meter
Valve
710
cm
92cm
Water TankWater Tank
Extension of Barauni Super Critical Coal Fired Thermal Power Station at Barauni, Bihar.M/s. STEAG Energy Services (India) Pvt. Ltd.
Plate 43 of 154Project No. 215081-I

Sl. No.
Time in Minutes
Water Level in Intake
Pipe,cm
Head, cm
Sl. No.
Time in Minutes
Water Level in Intake
Pipe,cm
Head, cm
1 0.0 0.0 1852 0.3 16.0 1693 1.0 20.0 1654 2.0 44.0 1415 4.0 68.0 1176 6.0 86.0 997 8.0 94.0 918 10.0 103.0 829 15.0 117.0 68
10 20.0 129.0 5611 25.0 136.0 4912 30.0 141.0 4413 40.0 149.0 36
k = Coefficient of Permeability =
Where:L = 50.0 cm d = 15.0 cm
2L/d = 6.67 R = 7.5 cmh1/ho = 0.21 t1 = 35.2 minutesh2/ho = 0.15 t2 = 55.9 minutesh1/h2 = 1.443
3.2E-04 cm/secDetermination of Coefficient of Permeability (FPT-14)
Depth of Water Table :
Field Permeability Test No.: FPT-14By Falling Head Method
IS: 5529-Part-1-1985, RA-2009
Borehole No. : Location :
Reduced Level (RL) : UTM Coordinates :
N/A403748.78 m E, 2806652.14 m N
Soil Classification :
Depth of Borehole : Depth of bottom of casing below EGL :
Diameter of Intake Pipe : Length of Test Section :
2.0 m1.50 m
Silty fine sand
Height of Casing above GL : Hydraulic Head at Start of test :
15.0 cm50.0 cm7.0 m0.10 m185 cm
Test Details
k =
BH : 3Ash Pond Area
Dia of Intake Pipe: 15 cm
1.5 m
Test
Secti
on: 5
0 cm
EGL
0.1 m
2 m
d2
8L(t2 t1)ln
2Ld
lnh1
h2
Calculations based on semilog plot of Head Ratio vs. Time, as per IS:5529 (Part-I)
Extension of Barauni Super Critical Coal Fired Thermal Power Station at Barauni, Bihar.M/s. STEAG Energy Services (India) Pvt. Ltd.
Plate 44 of 154Project No. 215081-I

Semi-Log Plot of Head Ratio Vs Time (FPT-14)
Test Details
Depth of Borehole : Calculated value of k :
2.0
By Falling Head MethodField Permeability Test No.: FPT-14
(IS: 5529-Part-1-1985, RA-2009)
3.2E-04
Reduced Level (RL) : UTM Coordinates :
N/A403748.78 m E, 2806652.14 m N
Borehole No. : Location :
BH : 3Ash Pond Area
0.10
1.000 20 40 60
Time in Minutes
Head
Rati
o
Extension of Barauni Super Critical Coal Fired Thermal Power Station at Barauni, Bihar.M/s. STEAG Energy Services (India) Pvt. Ltd.
Plate 45 of 154Project No. 215081-I

Sl. No.
Time in Minutes
Water Level in Intake
Pipe,cm
Head, cm
Sl. No.
Time in Minutes
Water Level in Intake
Pipe,cm
Head, cm
1 0.0 0.0 4352 1.0 79.0 3563 2.0 130.0 3054 4.0 158.0 2775 6.0 185.0 2506 8.0 212.0 2237 10.0 230.0 2058 15.0 260.0 1759 20.0 281.0 154
10 25.0 300.0 13511 30.0 320.0 11512 40.0 345.0 9013 50.0 360.0 75
k = Coefficient of Permeability =
Where:L = 50.0 cm d = 15.0 cm
2L/d = 6.67 R = 7.5 cmh1/ho = 0.44 t1 = 11 minutesh2/ho = 0.12 t2 = 59.4 minutesh1/h2 = 3.548
4.7E-04 cm/secDetermination of Coefficient of Permeability (FPT-15)
Depth of Water Table :
Field Permeability Test No.: FPT-15By Falling Head Method
IS: 5529-Part-1-1985, RA-2009
Borehole No. : Location :
Reduced Level (RL) : UTM Coordinates :
N/A403748.78 m E, 2806652.14 m N
Soil Classification :
Depth of Borehole : Depth of bottom of casing below EGL :
Diameter of Intake Pipe : Length of Test Section :
4.0 m3.50 m
Silty fine sand
Height of Casing above GL : Hydraulic Head at Start of test :
15.0 cm50.0 cm7.0 m0.60 m435 cm
Test Details
k =
BH : 3Ash Pond Area
Dia of Intake Pipe: 15 cm
3.5 m
Test
Secti
on: 5
0 cm
EGL
0.6 m
4 m
d2
8L(t2 t1)ln
2Ld
lnh1
h2
Calculations based on semilog plot of Head Ratio vs. Time, as per IS:5529 (Part-I)
Extension of Barauni Super Critical Coal Fired Thermal Power Station at Barauni, Bihar.M/s. STEAG Energy Services (India) Pvt. Ltd.
Plate 46 of 154Project No. 215081-I

Semi-Log Plot of Head Ratio Vs Time (FPT-15)
Test Details
Depth of Borehole : Calculated value of k :
4.0
By Falling Head MethodField Permeability Test No.: FPT-15
(IS: 5529-Part-1-1985, RA-2009)
4.7E-04
Reduced Level (RL) : UTM Coordinates :
N/A403748.78 m E, 2806652.14 m N
Borehole No. : Location :
BH : 3Ash Pond Area
0.10
1.000 20 40 60 80
Time in Minutes
Head
Rati
o
Extension of Barauni Super Critical Coal Fired Thermal Power Station at Barauni, Bihar.M/s. STEAG Energy Services (India) Pvt. Ltd.
Plate 47 of 154Project No. 215081-I
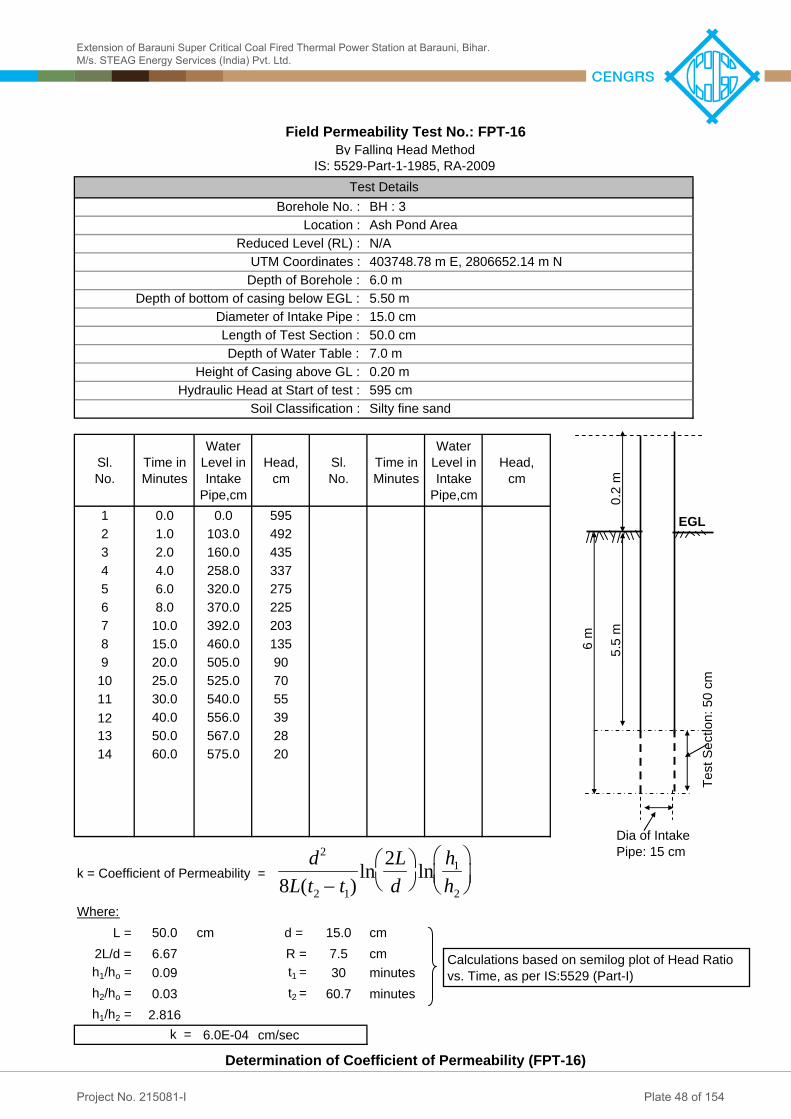
Sl. No.
Time in Minutes
Water Level in Intake
Pipe,cm
Head, cm
Sl. No.
Time in Minutes
Water Level in Intake
Pipe,cm
Head, cm
1 0.0 0.0 5952 1.0 103.0 4923 2.0 160.0 4354 4.0 258.0 3375 6.0 320.0 2756 8.0 370.0 2257 10.0 392.0 2038 15.0 460.0 1359 20.0 505.0 90
10 25.0 525.0 7011 30.0 540.0 5512 40.0 556.0 3913 50.0 567.0 2814 60.0 575.0 20
k = Coefficient of Permeability =
Where:L = 50.0 cm d = 15.0 cm
2L/d = 6.67 R = 7.5 cmh1/ho = 0.09 t1 = 30 minutesh2/ho = 0.03 t2 = 60.7 minutesh1/h2 = 2.816
6.0E-04 cm/secDetermination of Coefficient of Permeability (FPT-16)
Depth of Water Table :
Field Permeability Test No.: FPT-16By Falling Head Method
IS: 5529-Part-1-1985, RA-2009
Borehole No. : Location :
Reduced Level (RL) : UTM Coordinates :
N/A403748.78 m E, 2806652.14 m N
Soil Classification :
Depth of Borehole : Depth of bottom of casing below EGL :
Diameter of Intake Pipe : Length of Test Section :
6.0 m5.50 m
Silty fine sand
Height of Casing above GL : Hydraulic Head at Start of test :
15.0 cm50.0 cm7.0 m0.20 m595 cm
Test Details
k =
BH : 3Ash Pond Area
Dia of Intake Pipe: 15 cm
5.5 m
Test
Secti
on: 5
0 cm
EGL
0.2 m
6 m
d2
8L(t2 t1)ln
2Ld
lnh1
h2
Calculations based on semilog plot of Head Ratio vs. Time, as per IS:5529 (Part-I)
Extension of Barauni Super Critical Coal Fired Thermal Power Station at Barauni, Bihar.M/s. STEAG Energy Services (India) Pvt. Ltd.
Plate 48 of 154Project No. 215081-I

Semi-Log Plot of Head Ratio Vs Time (FPT-16)
Test Details
Depth of Borehole : Calculated value of k :
6.0
By Falling Head MethodField Permeability Test No.: FPT-16
(IS: 5529-Part-1-1985, RA-2009)
6.0E-04
Reduced Level (RL) : UTM Coordinates :
N/A403748.78 m E, 2806652.14 m N
Borehole No. : Location :
BH : 3Ash Pond Area
0.01
0.10
1.000 20 40 60 80
Time in Minutes
Head
Rati
o
Extension of Barauni Super Critical Coal Fired Thermal Power Station at Barauni, Bihar.M/s. STEAG Energy Services (India) Pvt. Ltd.
Plate 49 of 154Project No. 215081-I

8.0 m = 800 cm800 cm
15 cm7.0 cm92 cm
99.0 cmSilty fine sand
Time, min Q(litre)
Discharge, Q
litre/min)
Qaverage
litre/min
Borehole Radius (r), mm
Differential Head (H),
mC k, cm/s
0 149.0 0.0001 149.4 40.02 149.7 30.04 150.5 40.06 151.5 50.08 152.6 55.010 153.2 30.015 154.4 24.020 155.8 28.0
Equation used for calculationWhere:
Q=Discharge,(litre/min) H=Differential Head,(m)
4E-031.07527.3
Ash Pond Area
Depth of Water Table :
403748.78 m E, 2806652.14 m NUTM Coordinates :
Soil Classification :
Field Permeability Test No. : FPT-17By Constant Head Method
IS: 5529-Part-1-1985, RA-2009
Borehole No. : Location :
Test DetailsBH-3
Determination of Coefficient of Permeability (FPT-17)
r=radius of casing,(mm)
Effective Height of water in Tank :
Depth of Borehole : Depth of bottom of casing below EGL :
Diameter of Intake Pipe :
Differential Head :
1.1E-01
HQCk *
rC
5.51
EGL
Head of Water in Tank
Water Meter
Valve
7.0cm
92cm
Water TankWater Tank
Extension of Barauni Super Critical Coal Fired Thermal Power Station at Barauni, Bihar.M/s. STEAG Energy Services (India) Pvt. Ltd.
Plate 50 of 154Project No. 215081-I

10.0 m = 1000 cm1000 cm
15 cm7.0 cm92 cm
99.0 cm
Time, min Q(litre)
Discharge, Q
litre/min)
Qaverage
litre/min
Borehole Radius (r), mm
Differential Head (H),
mC k, cm/s
0 155.2 0.0001 155.3 10.02 155.4 10.04 155.5 5.06 155.6 5.08 155.6 1.010 155.7 4.015 155.9 3.020 156.0 3.0
Equation used for calculationWhere:
Q=Discharge,(litre/min) H=Differential Head,(m)
1.3E-02
Fine sand
4E-031.0
Diameter of Intake Pipe :
Differential Head :
r=radius of casing,(mm)
Determination of Coefficient of Permeability (FPT-18)
Field Permeability Test No. : FPT-18By Constant Head Method
IS: 5529-Part-1-1985, RA-2009
Borehole No. : Location :
Test DetailsBH-3
753.2
Ash Pond Area
Depth of Water Table :
403748.78 m E, 2806652.14 m NUTM Coordinates :
Soil Classification :
Effective Height of water in Tank :
Depth of Borehole : Depth of bottom of casing below EGL :
HQCk *
rC
5.51
EGL
Head of Water in Tank
Water Meter
Valve
7.0cm
92cm
Water TankWater Tank
Extension of Barauni Super Critical Coal Fired Thermal Power Station at Barauni, Bihar.M/s. STEAG Energy Services (India) Pvt. Ltd.
Plate 51 of 154Project No. 215081-I

12.0 m = 1200 cm1200 cm
15 cm7.0 cm92 cm
99.0 cm
Time, min Q(litre)
Discharge, Q
litre/min)
Qaverage
litre/min
Borehole Radius (r), mm
Differential Head (H),
mC k, cm/s
0 157.0 0.0001 157.2 20.02 157.4 20.04 157.6 10.06 158.1 25.08 158.4 15.010 158.8 20.015 159.5 14.020 160.3 16.0
Equation used for calculationWhere:
Q=Discharge,(litre/min) H=Differential Head,(m)
Ash Pond Area
Depth of Water Table :
403748.78 m E, 2806652.14 m NUTM Coordinates :
Soil Classification :
Field Permeability Test No. : FPT-19By Constant Head Method
IS: 5529-Part-1-1985, RA-2009
Borehole No. : Location :
Test DetailsBH-3
Determination of Coefficient of Permeability (FPT-19)
r=radius of casing,(mm)
Effective Height of water in Tank :
Depth of Borehole : Depth of bottom of casing below EGL :
Diameter of Intake Pipe :
Fine sandDifferential Head :
16.3 75 1.0 6.6E-024E-03
HQCk *
rC
5.51
EGL
Head of Water in Tank
Water Meter
Valve
7.0cm
92cm
Water TankWater Tank
Extension of Barauni Super Critical Coal Fired Thermal Power Station at Barauni, Bihar.M/s. STEAG Energy Services (India) Pvt. Ltd.
Plate 52 of 154Project No. 215081-I

14.0 m = 1400 cm1400 cm
15 cm7.0 cm92 cm
99.0 cmSilty fine sand
Time, min Q(litre)
Discharge, Q
litre/min)
Qaverage
litre/min
Borehole Radius (r), mm
Differential Head (H),
mC k, cm/s
0 160.5 0.0001 160.8 30.02 161.0 20.04 161.3 15.06 161.6 15.08 162.0 20.010 162.3 15.015 163.2 18.020 164.0 16.0
Equation used for calculationWhere:
Q=Discharge,(litre/min) H=Differential Head,(m)
6.7E-02
Differential Head : Effective Height of water in Tank :
Depth of Borehole : Depth of bottom of casing below EGL :
Diameter of Intake Pipe :
r=radius of casing,(mm)
Determination of Coefficient of Permeability (FPT-20)
Soil Classification :
Field Permeability Test No. : FPT-20By Constant Head Method
IS: 5529-Part-1-1985, RA-2009
Borehole No. : Location :
Test DetailsBH-3Ash Pond Area
Depth of Water Table :
403748.78 m E, 2806652.14 m NUTM Coordinates :
4E-031.07516.3
HQCk *
rC
5.51
EGL
Head of Water in Tank
Water Meter
Valve
7.0cm
92cm
Water TankWater Tank
Extension of Barauni Super Critical Coal Fired Thermal Power Station at Barauni, Bihar.M/s. STEAG Energy Services (India) Pvt. Ltd.
Plate 53 of 154Project No. 215081-I

16.00 m = 1600 cm1600 cm
15 cm7.0 cm92 cm
99.0 cmFine sand
Time, min Q(litre)
Discharge, Q
litre/min)
Qaverage
litre/min
Borehole Radius (r), mm
Differential Head (H),
mC k, cm/s
0 165.0 0.0001 165.2 20.02 165.4 20.04 165.7 15.06 166.0 15.08 166.3 15.010 166.5 10.015 167.1 12.020 167.8 14.0
Equation used for calculationWhere:
Q=Discharge,(litre/min) H=Differential Head,(m)
Ash Pond Area
Depth of Water Table :
403748.78 m E, 2806652.14 m NUTM Coordinates :
Soil Classification :
Field Permeability Test No. : FPT-21By Constant Head Method
IS: 5529-Part-1-1985, RA-2009
Borehole No. : Location :
Test DetailsBH-3
Determination of Coefficient of Permeability (FPT-21)
r=radius of casing,(mm)
Effective Height of water in Tank :
Depth of Borehole : Depth of bottom of casing below EGL :
Diameter of Intake Pipe :
Differential Head :
13.5 5.5E-024E-031.075
HQCk *
rC
5.51
EGL
Head of Water in Tank
Water Meter
Valve
7.0cm
92cm
Water TankWater Tank
Extension of Barauni Super Critical Coal Fired Thermal Power Station at Barauni, Bihar.M/s. STEAG Energy Services (India) Pvt. Ltd.
Plate 54 of 154Project No. 215081-I

18.00 m = 1800 cm1800 cm
15 cm7.0 cm92 cm
99.0 cmFine sand
Time, min Q(litre)
Discharge, Q
litre/min)
Qaverage
litre/min
Borehole Radius (r), mm
Differential Head (H),
mC k, cm/s
0 168.0 0.0001 168.2 20.02 168.3 10.04 168.6 15.06 168.9 15.08 169.1 10.010 169.4 15.015 170.0 12.020 170.7 14.0
Equation used for calculationWhere:
Q=Discharge,(litre/min) H=Differential Head,(m)
Differential Head : Effective Height of water in Tank :
Depth of Borehole : Depth of bottom of casing below EGL :
Diameter of Intake Pipe :
r=radius of casing,(mm)
Determination of Coefficient of Permeability (FPT-22)
Soil Classification :
Field Permeability Test No. : FPT-22By Constant Head Method
IS: 5529-Part-1-1985, RA-2009
Borehole No. : Location :
Test DetailsBH-3Ash Pond Area
Depth of Water Table :
403748.78 m E, 2806652.14 m NUTM Coordinates :
13.0 5.3E-024E-031.075
HQCk *
rC
5.51
EGL
Head of Water in Tank
Water Meter
Valve
7.0cm
92cm
Water TankWater Tank
Extension of Barauni Super Critical Coal Fired Thermal Power Station at Barauni, Bihar.M/s. STEAG Energy Services (India) Pvt. Ltd.
Plate 55 of 154Project No. 215081-I

20.00 m = 2000 cm2000 cm
15 cm7.0 cm92 cm
99.0 cmFine sand
Time, min Q(litre)
Discharge, Q
litre/min)
Qaverage
litre/min
Borehole Radius (r), mm
Differential Head (H),
mC k, cm/s
0 171.0 0.0001 171.2 20.02 171.3 10.04 171.5 10.06 171.8 15.08 172.1 15.010 172.4 15.015 173.1 14.020 173.7 12.0
Equation used for calculationWhere:
Q=Discharge,(litre/min) H=Differential Head,(m)
Ash Pond Area
Depth of Water Table :
403748.78 m E, 2806652.14 m NUTM Coordinates :
Soil Classification :
Field Permeability Test No. : FPT-23By Constant Head Method
IS: 5529-Part-1-1985, RA-2009
Borehole No. : Location :
Test DetailsBH-3
Determination of Coefficient of Permeability (FPT-23)
r=radius of casing,(mm)
Effective Height of water in Tank :
Depth of Borehole : Depth of bottom of casing below EGL :
Diameter of Intake Pipe :
Differential Head :
13.0 75 5.3E-024E-031.0
HQCk *
rC
5.51
EGL
Head of Water in Tank
Water Meter
Valve
7.0cm
92cm
Water TankWater Tank
Extension of Barauni Super Critical Coal Fired Thermal Power Station at Barauni, Bihar.M/s. STEAG Energy Services (India) Pvt. Ltd.
Plate 56 of 154Project No. 215081-I

Sl. No.
Time in Minutes
Water Level in Intake
Pipe,cm
Head, cm
Sl. No.
Time in Minutes
Water Level in Intake
Pipe,cm
Head, cm
1 0.0 0.0 1902 1.0 22.0 1683 2.0 39.0 1514 4.0 54.0 1365 6.0 68.0 1226 8.0 85.0 1057 10.0 101.0 898 15.0 130.0 609 20.0 147.0 43
10 25.0 160.0 3011 30.0 170.0 2012 40.0 180.0 1013 50.0 184.0 6
k = Coefficient of Permeability =
Where:L = 50.0 cm d = 15.0 cm
2L/d = 6.67 R = 7.5 cmh1/ho = 0.10 t1 = 30 minutesh2/ho = 0.01 t2 = 64.5 minutesh1/h2 = 9.236
1.1E-03 cm/secDetermination of Coefficient of Permeability (FPT-24)
Depth of Water Table :
Field Permeability Test No.: FPT-24By Falling Head Method
IS: 5529-Part-1-1985, RA-2009
Borehole No. : Location :
Reduced Level (RL) : UTM Coordinates :
N/A404203.43 m E, 2806545.85 m N
Soil Classification :
Depth of Borehole : Depth of bottom of casing below EGL :
Diameter of Intake Pipe : Length of Test Section :
2.0 m1.50 m
Silty fine sand
Height of Casing above GL : Hydraulic Head at Start of test :
15.0 cm50.0 cm7.0 m0.15 m190 cm
Test Details
k =
BH : 4Ash Pond Area
Dia of Intake Pipe: 15 cm
1.5 m
Test
Secti
on: 5
0 cm
EGL
0.15 m
2 m
d2
8L(t2 t1)ln
2Ld
lnh1
h2
Calculations based on semilog plot of Head Ratio vs. Time, as per IS:5529 (Part-I)
Extension of Barauni Super Critical Coal Fired Thermal Power Station at Barauni, Bihar.M/s. STEAG Energy Services (India) Pvt. Ltd.
Plate 57 of 154Project No. 215081-I
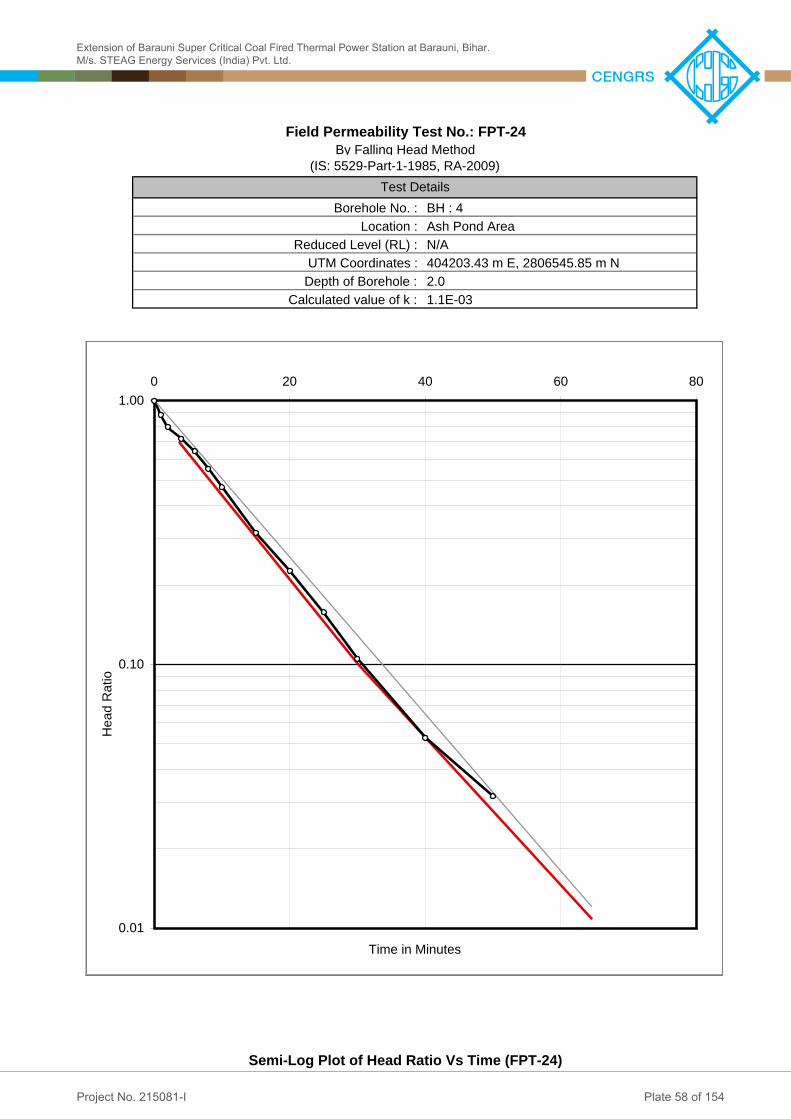
Semi-Log Plot of Head Ratio Vs Time (FPT-24)
Test Details
Depth of Borehole : Calculated value of k :
2.0
By Falling Head MethodField Permeability Test No.: FPT-24
(IS: 5529-Part-1-1985, RA-2009)
1.1E-03
Reduced Level (RL) : UTM Coordinates :
N/A404203.43 m E, 2806545.85 m N
Borehole No. : Location :
BH : 4Ash Pond Area
0.01
0.10
1.000 20 40 60 80
Time in Minutes
Head
Rati
o
Extension of Barauni Super Critical Coal Fired Thermal Power Station at Barauni, Bihar.M/s. STEAG Energy Services (India) Pvt. Ltd.
Plate 58 of 154Project No. 215081-I

Sl. No.
Time in Minutes
Water Level in Intake
Pipe,cm
Head, cm
Sl. No.
Time in Minutes
Water Level in Intake
Pipe,cm
Head, cm
1 0.0 0.0 3872 1.0 82.0 3053 2.0 140.0 2474 4.0 170.0 2175 6.0 192.0 1956 8.0 215.0 1727 10.0 237.0 1508 15.0 270.0 1179 20.0 294.0 93
10 25.0 308.0 7911 30.0 318.0 6912 40.0 335.0 5213 50.0 396.0 -9
k = Coefficient of Permeability =
Where:L = 50.0 cm d = 15.0 cm
2L/d = 6.67 R = 7.5 cmh1/ho = 0.17 t1 = 30.8 minutesh2/ho = 0.10 t2 = 50.2 minutesh1/h2 = 1.662
4.7E-04 cm/secDetermination of Coefficient of Permeability (FPT-25)
Depth of Water Table :
Field Permeability Test No.: FPT-25By Falling Head Method
IS: 5529-Part-1-1985, RA-2009
Borehole No. : Location :
Reduced Level (RL) : UTM Coordinates :
N/A404203.43 m E, 2806545.85 m N
Soil Classification :
Depth of Borehole : Depth of bottom of casing below EGL :
Diameter of Intake Pipe : Length of Test Section :
4.0 m3.50 m
Silty fine sand
Height of Casing above GL : Hydraulic Head at Start of test :
15.0 cm50.0 cm7.0 m0.12 m387 cm
Test Details
k =
BH : 4Ash Pond Area
Dia of Intake Pipe: 15 cm
3.5 m
Test
Secti
on: 5
0 cm
EGL
0.12 m
4 m
d2
8L(t2 t1)ln
2Ld
lnh1
h2
Calculations based on semilog plot of Head Ratio vs. Time, as per IS:5529 (Part-I)
Extension of Barauni Super Critical Coal Fired Thermal Power Station at Barauni, Bihar.M/s. STEAG Energy Services (India) Pvt. Ltd.
Plate 59 of 154Project No. 215081-I

Semi-Log Plot of Head Ratio Vs Time (FPT-25)
Test Details
Depth of Borehole : Calculated value of k :
4.0
By Falling Head MethodField Permeability Test No.: FPT-25
(IS: 5529-Part-1-1985, RA-2009)
4.7E-04
Reduced Level (RL) : UTM Coordinates :
N/A404203.43 m E, 2806545.85 m N
Borehole No. : Location :
BH : 4Ash Pond Area
0.10
1.000 20 40 60
Time in Minutes
Head
Rati
o
Extension of Barauni Super Critical Coal Fired Thermal Power Station at Barauni, Bihar.M/s. STEAG Energy Services (India) Pvt. Ltd.
Plate 60 of 154Project No. 215081-I

Sl. No.
Time in Minutes
Water Level in Intake
Pipe,cm
Head, cm
Sl. No.
Time in Minutes
Water Level in Intake
Pipe,cm
Head, cm
1 0.0 0.0 6552 1.0 115.0 5403 2.0 170.0 4854 4.0 257.0 3985 6.0 327.0 3286 8.0 388.0 2677 10.0 418.0 2378 15.0 470.0 1859 20.0 515.0 140
10 25.0 536.0 11911 30.0 552.0 10312 40.0 568.0 8713 50.0 579.0 7614 60.0 588.0 67
k = Coefficient of Permeability =
Where:L = 50.0 cm d = 15.0 cm
2L/d = 6.67 R = 7.5 cmh1/ho = 0.10 t1 = 59.9 minutesh2/ho = 0.08 t2 = 85.3 minutesh1/h2 = 1.283
1.7E-04 cm/secDetermination of Coefficient of Permeability (FPT-26)
Depth of Water Table :
Field Permeability Test No.: FPT-26By Falling Head Method
IS: 5529-Part-1-1985, RA-2009
Borehole No. : Location :
Reduced Level (RL) : UTM Coordinates :
N/A404203.43 m E, 2806545.85 m N
Soil Classification :
Depth of Borehole : Depth of bottom of casing below EGL :
Diameter of Intake Pipe : Length of Test Section :
6.0 m5.50 m
Silty fine sand
Height of Casing above GL : Hydraulic Head at Start of test :
15.0 cm50.0 cm7.0 m0.80 m655 cm
Test Details
k =
BH : 4Ash Pond Area
Dia of Intake Pipe: 15 cm
5.5 m
Test
Secti
on: 5
0 cm
EGL
0.8 m
6 m
d2
8L(t2 t1)ln
2Ld
lnh1
h2
Calculations based on semilog plot of Head Ratio vs. Time, as per IS:5529 (Part-I)
Extension of Barauni Super Critical Coal Fired Thermal Power Station at Barauni, Bihar.M/s. STEAG Energy Services (India) Pvt. Ltd.
Plate 61 of 154Project No. 215081-I

Semi-Log Plot of Head Ratio Vs Time (FPT-26)
Test Details
Depth of Borehole : Calculated value of k :
6.0
By Falling Head MethodField Permeability Test No.: FPT-26
(IS: 5529-Part-1-1985, RA-2009)
1.7E-04
Reduced Level (RL) : UTM Coordinates :
N/A404203.43 m E, 2806545.85 m N
Borehole No. : Location :
BH : 4Ash Pond Area
0.01
0.10
1.000 20 40 60 80 100
Time in Minutes
Head
Rati
o
Extension of Barauni Super Critical Coal Fired Thermal Power Station at Barauni, Bihar.M/s. STEAG Energy Services (India) Pvt. Ltd.
Plate 62 of 154Project No. 215081-I

8.00 m = 800 cm800 cm
15 cm7.0 cm92 cm
99.0 cmFine sand
Time, min Q(litre)
Discharge, Q
litre/min)
Qaverage
litre/min
Borehole Radius (r), mm
Differential Head (H),
mC k, cm/s
0 174.0 0.0001 174.4 40.02 174.7 30.04 175.6 45.06 176.4 40.08 176.9 25.010 177.5 30.015 178.9 28.020 180.1 24.0
Equation used for calculationWhere:
Q=Discharge,(litre/min) H=Differential Head,(m)
1.1E-01
Differential Head : Effective Height of water in Tank :
Depth of Borehole : Depth of bottom of casing below EGL :
Diameter of Intake Pipe :
r=radius of casing,(mm)
Determination of Coefficient of Permeability (FPT-27)
Soil Classification :
Field Permeability Test No. : FPT-27By Constant Head Method
IS: 5529-Part-1-1985, RA-2009
Borehole No. : Location :
Test DetailsBH-4Ash Pond Area
Depth of Water Table :
404203.43 m E, 2806545.85 m NUTM Coordinates :
26.7 75 1.0 4E-03
HQCk *
rC
5.51
EGL
Head of Water in Tank
Water Meter
Valve
7.0cm
92cm
Water TankWater Tank
Extension of Barauni Super Critical Coal Fired Thermal Power Station at Barauni, Bihar.M/s. STEAG Energy Services (India) Pvt. Ltd.
Plate 63 of 154Project No. 215081-I

10.0 m = 1000 cm1000 cm
15 cm7.0 cm92 cm
99.0 cmFine sand
Time, min Q(litre)
Discharge, Q
litre/min)
Qaverage
litre/min
Borehole Radius (r), mm
Differential Head (H),
mC k, cm/s
0 190.0 0.0001 190.2 20.02 190.4 20.04 190.7 15.06 191.1 20.08 191.6 25.010 192.0 20.015 193.1 22.020 194.2 22.0
Equation used for calculationWhere:
Q=Discharge,(litre/min) H=Differential Head,(m)
4E-031.07521.3
Ash Pond Area
Depth of Water Table :
404203.43 m E, 2806545.85 m NUTM Coordinates :
Soil Classification :
Field Permeability Test No. : FPT-28By Constant Head Method
IS: 5529-Part-1-1985, RA-2009
Borehole No. : Location :
Test DetailsBH-4
Determination of Coefficient of Permeability (FPT-28)
r=radius of casing,(mm)
Effective Height of water in Tank :
Depth of Borehole : Depth of bottom of casing below EGL :
Diameter of Intake Pipe :
Differential Head :
8.7E-02
HQCk *
rC
5.51
EGL
Head of Water in Tank
Water Meter
Valve
7.0cm
92cm
Water TankWater Tank
Extension of Barauni Super Critical Coal Fired Thermal Power Station at Barauni, Bihar.M/s. STEAG Energy Services (India) Pvt. Ltd.
Plate 64 of 154Project No. 215081-I

12.0 m = 1200 cm1200 cm
15 cm7.0 cm92 cm
99.0 cmFine sand
Time, min Q(litre)
Discharge, Q
litre/min)
Qaverage
litre/min
Borehole Radius (r), mm
Differential Head (H),
mC k, cm/s
0 195.0 0.0001 195.2 20.02 195.4 20.04 195.7 15.06 196.0 15.08 196.4 20.010 196.7 15.015 197.4 14.020 198.2 16.0
Equation used for calculationWhere:
Q=Discharge,(litre/min) H=Differential Head,(m)
6.1E-02
Differential Head : Effective Height of water in Tank :
Depth of Borehole : Depth of bottom of casing below EGL :
Diameter of Intake Pipe :
r=radius of casing,(mm)
Determination of Coefficient of Permeability (FPT-29)
Soil Classification :
Field Permeability Test No. : FPT-29By Constant Head Method
IS: 5529-Part-1-1985, RA-2009
Borehole No. : Location :
Test DetailsBH-4Ash Pond Area
Depth of Water Table :
404203.43 m E, 2806545.85 m NUTM Coordinates :
4E-031.07515.0
HQCk *
rC
5.51
EGL
Head of Water in Tank
Water Meter
Valve
7.0cm
92cm
Water TankWater Tank
Extension of Barauni Super Critical Coal Fired Thermal Power Station at Barauni, Bihar.M/s. STEAG Energy Services (India) Pvt. Ltd.
Plate 65 of 154Project No. 215081-I

14.0 m = 1400 cm1400 cm
15 cm7.0 cm92 cm
99.0 cmFine sand
Time, min Q(litre)
Discharge, Q
litre/min)
Qaverage
litre/min
Borehole Radius (r), mm
Differential Head (H),
mC k, cm/s
0 199.0 0.0001 199.2 20.02 199.4 20.04 199.9 25.06 200.3 20.08 200.8 25.010 201.3 25.015 202.5 24.020 203.9 28.0
Equation used for calculationWhere:
Q=Discharge,(litre/min) H=Differential Head,(m)
4E-031.07525.5
Ash Pond Area
Depth of Water Table :
404203.43 m E, 2806545.85 m NUTM Coordinates :
Soil Classification :
Field Permeability Test No. : FPT-30By Constant Head Method
IS: 5529-Part-1-1985, RA-2009
Borehole No. : Location :
Test DetailsBH-4
Determination of Coefficient of Permeability (FPT-30)
r=radius of casing,(mm)
Effective Height of water in Tank :
Depth of Borehole : Depth of bottom of casing below EGL :
Diameter of Intake Pipe :
1.0E-01
Differential Head :
HQCk *
rC
5.51
EGL
Head of Water in Tank
Water Meter
Valve
7.0cm
92cm
Water TankWater Tank
Extension of Barauni Super Critical Coal Fired Thermal Power Station at Barauni, Bihar.M/s. STEAG Energy Services (India) Pvt. Ltd.
Plate 66 of 154Project No. 215081-I

16.0 m = 1600 cm1600 cm
15 cm7.0 cm92 cm
99.0 cmFine sand
Time, min Q(litre)
Discharge, Q
litre/min)
Qaverage
litre/min
Borehole Radius (r), mm
Differential Head (H),
mC k, cm/s
0 204.0 0.0001 204.4 40.02 204.7 30.04 205.0 15.06 205.2 10.08 205.7 25.010 206.0 15.015 206.9 18.020 207.7 16.0
Equation used for calculationWhere:
Q=Discharge,(litre/min) H=Differential Head,(m)
6.7E-02
Differential Head : Effective Height of water in Tank :
Depth of Borehole : Depth of bottom of casing below EGL :
Diameter of Intake Pipe :
r=radius of casing,(mm)
Determination of Coefficient of Permeability (FPT-31)
Soil Classification :
Field Permeability Test No. : FPT-31By Constant Head Method
IS: 5529-Part-1-1985, RA-2009
Borehole No. : Location :
Test DetailsBH-4Ash Pond Area
Depth of Water Table :
404203.43 m E, 2806545.85 m NUTM Coordinates :
4E-031.07516.3
HQCk *
rC
5.51
EGL
Head of Water in Tank
Water Meter
Valve
7.0cm
92cm
Water TankWater Tank
Extension of Barauni Super Critical Coal Fired Thermal Power Station at Barauni, Bihar.M/s. STEAG Energy Services (India) Pvt. Ltd.
Plate 67 of 154Project No. 215081-I

18.0 m = 1800 cm1800 cm
15 cm7.0 cm92 cm
99.0 cmFine sand
Time, min Q(litre)
Discharge, Q
litre/min)
Qaverage
litre/min
Borehole Radius (r), mm
Differential Head (H),
mC k, cm/s
0 208.0 0.0001 208.2 20.02 208.4 20.04 208.7 15.06 209.0 15.08 209.4 20.010 209.8 20.015 210.7 18.020 211.5 16.0
Equation used for calculationWhere:
Q=Discharge,(litre/min) H=Differential Head,(m)
Ash Pond Area
Depth of Water Table :
404203.43 m E, 2806545.85 m NUTM Coordinates :
Soil Classification :
Field Permeability Test No. : FPT-32By Constant Head Method
IS: 5529-Part-1-1985, RA-2009
Borehole No. : Location :
Test DetailsBH-4
Determination of Coefficient of Permeability (FPT-32)
r=radius of casing,(mm)
Effective Height of water in Tank :
Depth of Borehole : Depth of bottom of casing below EGL :
Diameter of Intake Pipe :
Differential Head :
17.3 7.1E-024E-031.075
HQCk *
rC
5.51
EGL
Head of Water in Tank
Water Meter
Valve
7.0cm
92cm
Water TankWater Tank
Extension of Barauni Super Critical Coal Fired Thermal Power Station at Barauni, Bihar.M/s. STEAG Energy Services (India) Pvt. Ltd.
Plate 68 of 154Project No. 215081-I

20.0 m = 2000 cm2000 cm
15 cm7.0 cm92 cm
99.0 cmFine sand
Time, min Q(litre)
Discharge, Q
litre/min)
Qaverage
litre/min
Borehole Radius (r), mm
Differential Head (H),
mC k, cm/s
0 212.0 0.0001 212.2 20.02 212.3 10.04 212.6 15.06 212.9 15.08 213.1 10.010 213.3 10.015 213.9 12.020 214.4 10.0
Equation used for calculationWhere:
Q=Discharge,(litre/min) H=Differential Head,(m)
4.8E-02
Differential Head : Effective Height of water in Tank :
Depth of Borehole : Depth of bottom of casing below EGL :
Diameter of Intake Pipe :
r=radius of casing,(mm)
Determination of Coefficient of Permeability (FPT-33)
Soil Classification :
Field Permeability Test No. : FPT-33By Constant Head Method
IS: 5529-Part-1-1985, RA-2009
Borehole No. : Location :
Test DetailsBH-4Ash Pond Area
Depth of Water Table :
404203.43 m E, 2806545.85 m NUTM Coordinates :
4E-031.07511.7
HQCk *
rC
5.51
EGL
Head of Water in Tank
Water Meter
Valve
7.0cm
92cm
Water TankWater Tank
Extension of Barauni Super Critical Coal Fired Thermal Power Station at Barauni, Bihar.M/s. STEAG Energy Services (India) Pvt. Ltd.
Plate 69 of 154Project No. 215081-I

Sl. No.
Time in Minutes
Water Level in Intake
Pipe,cm
Head, cm
Sl. No.
Time in Minutes
Water Level in Intake
Pipe,cm
Head, cm
1 0.0 0.0 2552 1.0 26.0 2293 2.0 42.0 2134 4.0 78.0 1775 6.0 91.0 1646 8.0 109.0 1467 10.0 126.0 1298 15.0 150.0 1059 20.0 170.0 85
10 25.0 181.0 7411 30.0 190.0 6512 40.0 199.0 56
k = Coefficient of Permeability =
Where:L = 50.0 cm d = 15.0 cm
2L/d = 6.67 R = 7.5 cmh1/ho = 0.25 t1 = 30 minutesh2/ho = 0.22 t2 = 39.6 minutesh1/h2 = 1.143
2.5E-04 cm/secDetermination of Coefficient of Permeability (FPT-34)
Depth of Water Table :
Field Permeability Test No.: FPT-34By Falling Head Method
IS: 5529-Part-1-1985, RA-2009
Borehole No. : Location :
Reduced Level (RL) : UTM Coordinates :
N/A404597.72 m E, 2806647.28 m N
Soil Classification :
Depth of Borehole : Depth of bottom of casing below EGL :
Diameter of Intake Pipe : Length of Test Section :
2.0 m1.50 m
Silty fine sand
Height of Casing above GL : Hydraulic Head at Start of test :
15.0 cm50.0 cm7.0 m0.80 m255 cm
Test Details
k =
BH : 5Ash Pond Area
Dia of Intake Pipe: 15 cm
1.5 m
Test
Secti
on: 5
0 cm
EGL
0.8 m
2 m
d2
8L(t2 t1)ln
2Ld
lnh1
h2
Calculations based on semilog plot of Head Ratio vs. Time, as per IS:5529 (Part-I)
Extension of Barauni Super Critical Coal Fired Thermal Power Station at Barauni, Bihar.M/s. STEAG Energy Services (India) Pvt. Ltd.
Plate 70 of 154Project No. 215081-I

Semi-Log Plot of Head Ratio Vs Time (FPT-34)
Test Details
Depth of Borehole : Calculated value of k :
2.0
By Falling Head MethodField Permeability Test No.: FPT-34
(IS: 5529-Part-1-1985, RA-2009)
2.5E-04
Reduced Level (RL) : UTM Coordinates :
N/A404597.72 m E, 2806647.28 m N
Borehole No. : Location :
BH : 5Ash Pond Area
0.10
1.000 20 40 60
Time in Minutes
Head
Rati
o
Extension of Barauni Super Critical Coal Fired Thermal Power Station at Barauni, Bihar.M/s. STEAG Energy Services (India) Pvt. Ltd.
Plate 71 of 154Project No. 215081-I

Sl. No.
Time in Minutes
Water Level in Intake
Pipe,cm
Head, cm
Sl. No.
Time in Minutes
Water Level in Intake
Pipe,cm
Head, cm
1 0.0 0.0 3882 1.0 90.0 2983 2.0 139.0 2494 4.0 178.0 2105 6.0 196.0 1926 8.0 218.0 1707 10.0 236.0 1528 15.0 275.0 1139 20.0 302.0 86
10 25.0 320.0 6811 30.0 334.0 54
k = Coefficient of Permeability =
Where:L = 50.0 cm d = 15.0 cm
2L/d = 6.67 R = 7.5 cmh1/ho = 0.14 t1 = 30 minutesh2/ho = 0.05 t2 = 53.2 minutesh1/h2 = 2.940
8.3E-04 cm/secDetermination of Coefficient of Permeability (FPT-35)
Depth of Water Table :
Field Permeability Test No.: FPT-35By Falling Head Method
IS: 5529-Part-1-1985, RA-2009
Borehole No. : Location :
Reduced Level (RL) : UTM Coordinates :
N/A404597.72 m E, 2806647.28 m N
Soil Classification :
Depth of Borehole : Depth of bottom of casing below EGL :
Diameter of Intake Pipe : Length of Test Section :
4.0 m3.50 m
Silty fine sand
Height of Casing above GL : Hydraulic Head at Start of test :
15.0 cm50.0 cm7.0 m0.13 m388 cm
Test Details
k =
BH : 5Ash Pond Area
Dia of Intake Pipe: 15 cm
3.5 m
Test
Secti
on: 5
0 cm
EGL
0.13 m
4 m
d2
8L(t2 t1)ln
2Ld
lnh1
h2
Calculations based on semilog plot of Head Ratio vs. Time, as per IS:5529 (Part-I)
Extension of Barauni Super Critical Coal Fired Thermal Power Station at Barauni, Bihar.M/s. STEAG Energy Services (India) Pvt. Ltd.
Plate 72 of 154Project No. 215081-I

Semi-Log Plot of Head Ratio Vs Time (FPT-35)
Test Details
Depth of Borehole : Calculated value of k :
4.0
By Falling Head MethodField Permeability Test No.: FPT-35
(IS: 5529-Part-1-1985, RA-2009)
8.3E-04
Reduced Level (RL) : UTM Coordinates :
N/A404597.72 m E, 2806647.28 m N
Borehole No. : Location :
BH : 5Ash Pond Area
0.01
0.10
1.000 20 40 60
Time in Minutes
Head
Rati
o
Extension of Barauni Super Critical Coal Fired Thermal Power Station at Barauni, Bihar.M/s. STEAG Energy Services (India) Pvt. Ltd.
Plate 73 of 154Project No. 215081-I

Sl. No.
Time in Minutes
Water Level in Intake
Pipe,cm
Head, cm
Sl. No.
Time in Minutes
Water Level in Intake
Pipe,cm
Head, cm
1 0.0 0.0 6552 1.0 135.0 5203 2.0 180.0 4754 4.0 260.0 3955 6.0 333.0 3226 8.0 389.0 2667 10.0 441.0 2148 15.0 488.0 1679 20.0 519.0 136
10 25.0 544.0 11111 30.0 556.0 9912 40.0 572.0 8313 50.0 582.0 7314 60.0 591.0 64
k = Coefficient of Permeability =
Where:L = 50.0 cm d = 15.0 cm
2L/d = 6.67 R = 7.5 cmh1/ho = 0.15 t1 = 30 minutesh2/ho = 0.09 t2 = 62.5 minutesh1/h2 = 1.667
2.8E-04 cm/secDetermination of Coefficient of Permeability (FPT-36)
Depth of Water Table :
Field Permeability Test No.: FPT-36By Falling Head Method
IS: 5529-Part-1-1985, RA-2009
Borehole No. : Location :
Reduced Level (RL) : UTM Coordinates :
N/A404597.72 m E, 2806647.28 m N
Soil Classification :
Depth of Borehole : Depth of bottom of casing below EGL :
Diameter of Intake Pipe : Length of Test Section :
6.0 m5.50 m
Silty fine sand
Height of Casing above GL : Hydraulic Head at Start of test :
15.0 cm50.0 cm7.0 m0.80 m655 cm
Test Details
k =
BH : 5Ash Pond Area
Dia of Intake Pipe: 15 cm
5.5 m
Test
Secti
on: 5
0 cm
EGL
0.8 m
6 m
d2
8L(t2 t1)ln
2Ld
lnh1
h2
Calculations based on semilog plot of Head Ratio vs. Time, as per IS:5529 (Part-I)
Extension of Barauni Super Critical Coal Fired Thermal Power Station at Barauni, Bihar.M/s. STEAG Energy Services (India) Pvt. Ltd.
Plate 74 of 154Project No. 215081-I

Semi-Log Plot of Head Ratio Vs Time (FPT-36)
Test Details
Depth of Borehole : Calculated value of k :
6.0
By Falling Head MethodField Permeability Test No.: FPT-36
(IS: 5529-Part-1-1985, RA-2009)
2.8E-04
Reduced Level (RL) : UTM Coordinates :
N/A404597.72 m E, 2806647.28 m N
Borehole No. : Location :
BH : 5Ash Pond Area
0.01
0.10
1.000 20 40 60 80
Time in Minutes
Head
Rati
o
Extension of Barauni Super Critical Coal Fired Thermal Power Station at Barauni, Bihar.M/s. STEAG Energy Services (India) Pvt. Ltd.
Plate 75 of 154Project No. 215081-I

8.00 m = 800 cm800 cm
15 cm7.0 cm92 cm
99.0 cmFine sand
Time, min Q(litre)
Discharge, Q
litre/min)
Qaverage
litre/min
Borehole Radius (r), mm
Differential Head (H),
mC k, cm/s
0 215.0 0.0001 215.4 40.02 215.8 40.04 216.4 30.06 216.9 25.08 217.5 30.010 218.1 30.015 219.8 34.020 221.4 32.0
Equation used for calculationWhere:
Q=Discharge,(litre/min) H=Differential Head,(m)
Ash Pond Area
Depth of Water Table :
404597.72 m E, 2806647.28 m NUTM Coordinates :
Soil Classification :
Field Permeability Test No. : FPT-37By Constant Head Method
IS: 5529-Part-1-1985, RA-2009
Borehole No. : Location :
Test DetailsBH-5
Determination of Coefficient of Permeability (FPT-37)
r=radius of casing,(mm)
Effective Height of water in Tank :
Depth of Borehole : Depth of bottom of casing below EGL :
Diameter of Intake Pipe :
1.2E-01
Differential Head :
30.2 75 1.0 4E-03
HQCk *
rC
5.51
EGL
Head of Water in Tank
Water Meter
Valve
7.0cm
92cm
Water TankWater Tank
Extension of Barauni Super Critical Coal Fired Thermal Power Station at Barauni, Bihar.M/s. STEAG Energy Services (India) Pvt. Ltd.
Plate 76 of 154Project No. 215081-I

10.00 m = 1000 cm1000 cm
15 cm7.0 cm92 cm
99.0 cmFine sand
Time, min Q(litre)
Discharge, Q
litre/min)
Qaverage
litre/min
Borehole Radius (r), mm
Differential Head (H),
mC k, cm/s
0 222.0 0.0001 222.2 20.02 222.5 30.04 223.0 25.06 223.4 20.08 223.8 20.010 224.3 25.015 225.4 22.020 226.5 22.0
Equation used for calculationWhere:
Q=Discharge,(litre/min) H=Differential Head,(m)
8.9E-02
Differential Head : Effective Height of water in Tank :
Depth of Borehole : Depth of bottom of casing below EGL :
Diameter of Intake Pipe :
r=radius of casing,(mm)
Determination of Coefficient of Permeability (FPT-38)
Soil Classification :
Field Permeability Test No. : FPT-38By Constant Head Method
IS: 5529-Part-1-1985, RA-2009
Borehole No. : Location :
Test DetailsBH-5Ash Pond Area
Depth of Water Table :
404597.72 m E, 2806647.28 m NUTM Coordinates :
21.8 75 1.0 4E-03
HQCk *
rC
5.51
EGL
Head of Water in Tank
Water Meter
Valve
7.0cm
92cm
Water TankWater Tank
Extension of Barauni Super Critical Coal Fired Thermal Power Station at Barauni, Bihar.M/s. STEAG Energy Services (India) Pvt. Ltd.
Plate 77 of 154Project No. 215081-I

12.00 m = 1200 cm1200 cm
15 cm7.0 cm92 cm
99.0 cmFine sand
Time, min Q(litre)
Discharge, Q
litre/min)
Qaverage
litre/min
Borehole Radius (r), mm
Differential Head (H),
mC k, cm/s
0 227.0 0.0001 227.2 20.02 227.4 20.04 227.7 15.06 228.0 15.08 228.2 10.010 228.5 15.015 229.1 12.020 229.7 12.0
Equation used for calculationWhere:
Q=Discharge,(litre/min) H=Differential Head,(m)
Ash Pond Area
Depth of Water Table :
404597.72 m E, 2806647.28 m NUTM Coordinates :
Soil Classification :
Field Permeability Test No. : FPT-39By Constant Head Method
IS: 5529-Part-1-1985, RA-2009
Borehole No. : Location :
Test DetailsBH-5
Determination of Coefficient of Permeability (FPT-39)
r=radius of casing,(mm)
Effective Height of water in Tank :
Depth of Borehole : Depth of bottom of casing below EGL :
Diameter of Intake Pipe :
5.3E-02
Differential Head :
13.0 75 1.0 4E-03
HQCk *
rC
5.51
EGL
Head of Water in Tank
Water Meter
Valve
7.0cm
92cm
Water TankWater Tank
Extension of Barauni Super Critical Coal Fired Thermal Power Station at Barauni, Bihar.M/s. STEAG Energy Services (India) Pvt. Ltd.
Plate 78 of 154Project No. 215081-I

14.00 m = 1400 cm1400 cm
15 cm7.0 cm92 cm
99.0 cmFine sand
Time, min Q(litre)
Discharge, Q
litre/min)
Qaverage
litre/min
Borehole Radius (r), mm
Differential Head (H),
mC k, cm/s
0 230.0 0.0001 230.4 40.02 230.7 30.04 231.4 35.06 232.0 30.08 232.6 30.010 233.3 35.015 234.9 32.020 236.5 32.0
Equation used for calculationWhere:
Q=Discharge,(litre/min) H=Differential Head,(m)
1.3E-01
Differential Head : Effective Height of water in Tank :
Depth of Borehole : Depth of bottom of casing below EGL :
Diameter of Intake Pipe :
r=radius of casing,(mm)
Determination of Coefficient of Permeability (FPT-40)
Soil Classification :
Field Permeability Test No. : FPT-40By Constant Head Method
IS: 5529-Part-1-1985, RA-2009
Borehole No. : Location :
Test DetailsBH-5Ash Pond Area
Depth of Water Table :
404597.72 m E, 2806647.28 m NUTM Coordinates :
31.8 75 1.0 4E-03
HQCk *
rC
5.51
EGL
Head of Water in Tank
Water Meter
Valve
7.0cm
92cm
Water TankWater Tank
Extension of Barauni Super Critical Coal Fired Thermal Power Station at Barauni, Bihar.M/s. STEAG Energy Services (India) Pvt. Ltd.
Plate 79 of 154Project No. 215081-I

16.00 m = 1600 cm1600 cm
15 cm7.0 cm92 cm
99.0 cmFine sand
Time, min Q(litre)
Discharge, Q
litre/min)
Qaverage
litre/min
Borehole Radius (r), mm
Differential Head (H),
mC k, cm/s
0 237.0 0.0001 237.4 40.02 237.7 30.04 238.4 35.06 238.8 20.08 239.3 25.010 239.7 20.015 240.6 18.020 241.6 20.0
Equation used for calculationWhere:
Q=Discharge,(litre/min) H=Differential Head,(m)
8.4E-02
Differential Head : Effective Height of water in Tank :
Depth of Borehole : Depth of bottom of casing below EGL :
Diameter of Intake Pipe :
r=radius of casing,(mm)
Determination of Coefficient of Permeability (FPT-41)
Soil Classification :
Field Permeability Test No. : FPT-41By Constant Head Method
IS: 5529-Part-1-1985, RA-2009
Borehole No. : Location :
Test DetailsBH-5Ash Pond Area
Depth of Water Table :
404597.72 m E, 2806647.28 m NUTM Coordinates :
20.6 75 1.0 4E-03
HQCk *
rC
5.51
EGL
Head of Water in Tank
Water Meter
Valve
7.0cm
92cm
Water TankWater Tank
Extension of Barauni Super Critical Coal Fired Thermal Power Station at Barauni, Bihar.M/s. STEAG Energy Services (India) Pvt. Ltd.
Plate 80 of 154Project No. 215081-I

18.00 m = 1800 cm1800 cm
15 cm7.0 cm92 cm
99.0 cmFine sand
Time, min Q(litre)
Discharge, Q
litre/min)
Qaverage
litre/min
Borehole Radius (r), mm
Differential Head (H),
mC k, cm/s
0 242.0 0.0001 242.3 30.02 242.5 20.04 242.9 20.06 243.2 15.08 243.6 20.010 243.9 15.015 244.6 14.020 245.2 12.0
Equation used for calculationWhere:
Q=Discharge,(litre/min) H=Differential Head,(m)
Ash Pond Area
Depth of Water Table :
404597.72 m E, 2806647.28 m NUTM Coordinates :
Soil Classification :
Field Permeability Test No. : FPT-42By Constant Head Method
IS: 5529-Part-1-1985, RA-2009
Borehole No. : Location :
Test DetailsBH-5
Determination of Coefficient of Permeability (FPT-42)
r=radius of casing,(mm)
Effective Height of water in Tank :
Depth of Borehole : Depth of bottom of casing below EGL :
Diameter of Intake Pipe :
6.8E-02
Differential Head :
16.6 75 1.0 4E-03
HQCk *
rC
5.51
EGL
Head of Water in Tank
Water Meter
Valve
7.0cm
92cm
Water TankWater Tank
Extension of Barauni Super Critical Coal Fired Thermal Power Station at Barauni, Bihar.M/s. STEAG Energy Services (India) Pvt. Ltd.
Plate 81 of 154Project No. 215081-I

20.00 m = 2000 cm2000 cm
15 cm7.0 cm92 cm
99.0 cmFine sand
Time, min Q(litre)
Discharge, Q
litre/min)
Qaverage
litre/min
Borehole Radius (r), mm
Differential Head (H),
mC k, cm/s
0 245.4 0.0001 245.6 20.02 245.7 10.04 246.0 15.06 246.3 15.08 246.5 10.010 246.7 10.015 247.3 12.020 247.8 10.0
Equation used for calculationWhere:
Q=Discharge,(litre/min) H=Differential Head,(m)
4.8E-02
Differential Head : Effective Height of water in Tank :
Depth of Borehole : Depth of bottom of casing below EGL :
Diameter of Intake Pipe :
r=radius of casing,(mm)
Determination of Coefficient of Permeability (FPT-43)
Soil Classification :
Field Permeability Test No. : FPT-43By Constant Head Method
IS: 5529-Part-1-1985, RA-2009
Borehole No. : Location :
Test DetailsBH-5Ash Pond Area
Depth of Water Table :
404597.72 m E, 2806647.28 m NUTM Coordinates :
11.7 75 1.0 4E-03
HQCk *
rC
5.51
EGL
Head of Water in Tank
Water Meter
Valve
7.0cm
92cm
Water TankWater Tank
Extension of Barauni Super Critical Coal Fired Thermal Power Station at Barauni, Bihar.M/s. STEAG Energy Services (India) Pvt. Ltd.
Plate 82 of 154Project No. 215081-I

Sl. No.
Time in Minutes
Water Level in Intake
Pipe,cm
Head, cm
Sl. No.
Time in Minutes
Water Level in Intake
Pipe,cm
Head, cm
1 0.0 0.0 1912 1.0 17.0 1743 2.0 20.0 1714 4.0 23.0 1685 6.0 27.0 1646 8.0 30.0 1617 10.0 34.0 1578 15.0 44.0 1479 20.0 58.0 133
10 25.0 70.0 12111 30.0 81.0 11012 40.0 96.0 9513 50.0 108.0 83
k = Coefficient of Permeability =
Where:L = 50.0 cm d = 15.0 cm
2L/d = 6.67 R = 7.5 cmh1/ho = 0.58 t1 = 30 minutesh2/ho = 0.43 t2 = 49.7 minutesh1/h2 = 1.351
2.7E-04 cm/secDetermination of Coefficient of Permeability (FPT-44)
Depth of Water Table :
Field Permeability Test No.: FPT-44By Falling Head Method
IS: 5529-Part-1-1985, RA-2009
Borehole No. : Location :
Reduced Level (RL) : Co-ordinates :
N/A403480.69 m E, 2805802.09 m N
Soil Classification :
Depth of Borehole : Depth of bottom of casing below EGL :
Diameter of Intake Pipe : Length of Test Section :
2.0 m1.50 m
Clayey silt
Height of Casing above GL : Hydraulic Head at Start of test :
15.0 cm50.0 cm7.1 m0.16 m191 cm
Test Details
k =
BH : 6Ash Pond Area
Dia of Intake Pipe: 15 cm
1.5 m
Test
Secti
on: 5
0 cm
EGL
0.16 m
2 m
d2
8L(t2 t1)ln
2Ld
lnh1
h2
Calculations based on semilog plot of Head Ratio vs. Time, as per IS:5529 (Part-I)
Extension of Barauni Super Critical Coal Fired Thermal Power Station at Barauni, Bihar.M/s. STEAG Energy Services (India) Pvt. Ltd.
Plate 83 of 154Project No. 215081-I

Semi-Log Plot of Head Ratio Vs Time (FPT-44)
Test Details
Depth of Borehole : Calculated value of k :
2.0
By Falling Head MethodField Permeability Test No.: FPT-44
(IS: 5529-Part-1-1985, RA-2009)
2.7E-04
Reduced Level (RL) : Co-ordinates :
N/A403480.69 m E, 2805802.09 m N
Borehole No. : Location :
BH : 6Ash Pond Area
0.10
1.000 20 40 60
Time in Minutes
Head
Rati
o
Extension of Barauni Super Critical Coal Fired Thermal Power Station at Barauni, Bihar.M/s. STEAG Energy Services (India) Pvt. Ltd.
Plate 84 of 154Project No. 215081-I

Sl. No.
Time in Minutes
Water Level in Intake
Pipe,cm
Head, cm
Sl. No.
Time in Minutes
Water Level in Intake
Pipe,cm
Head, cm
1 0.0 0.0 4252 1.0 34.0 3913 2.0 58.0 3674 4.0 106.0 3195 6.0 152.0 2736 8.0 162.0 2637 10.0 170.0 2558 15.0 193.0 2329 20.0 220.0 205
10 25.0 241.0 18411 30.0 260.0 16512 40.0 291.0 13413 50.0 314.0 11114 60.0 332.0 93
k = Coefficient of Permeability =
Where:L = 50.0 cm d = 15.0 cm
2L/d = 6.67 R = 7.5 cmh1/ho = 0.39 t1 = 30 minutesh2/ho = 0.21 t2 = 60 minutesh1/h2 = 1.843
3.6E-04 cm/secDetermination of Coefficient of Permeability (FPT-45)
Depth of Water Table :
Field Permeability Test No.: FPT-45By Falling Head Method
IS: 5529-Part-1-1985, RA-2009
Borehole No. : Location :
Reduced Level (RL) : Co-ordinates :
N/A403480.69 m E, 2805802.09 m N
Soil Classification :
Depth of Borehole : Depth of bottom of casing below EGL :
Diameter of Intake Pipe : Length of Test Section :
4.0 m3.50 m
Silty fine sand
Height of Casing above GL : Hydraulic Head at Start of test :
15.0 cm50.0 cm7.1 m0.50 m425 cm
Test Details
k =
BH : 6Ash Pond Area
Dia of Intake Pipe: 15 cm
3.5 m
Test
Secti
on: 5
0 cm
EGL
0.5 m
4 m
d2
8L(t2 t1)ln
2Ld
lnh1
h2
Calculations based on semilog plot of Head Ratio vs. Time, as per IS:5529 (Part-I)
Extension of Barauni Super Critical Coal Fired Thermal Power Station at Barauni, Bihar.M/s. STEAG Energy Services (India) Pvt. Ltd.
Plate 85 of 154Project No. 215081-I
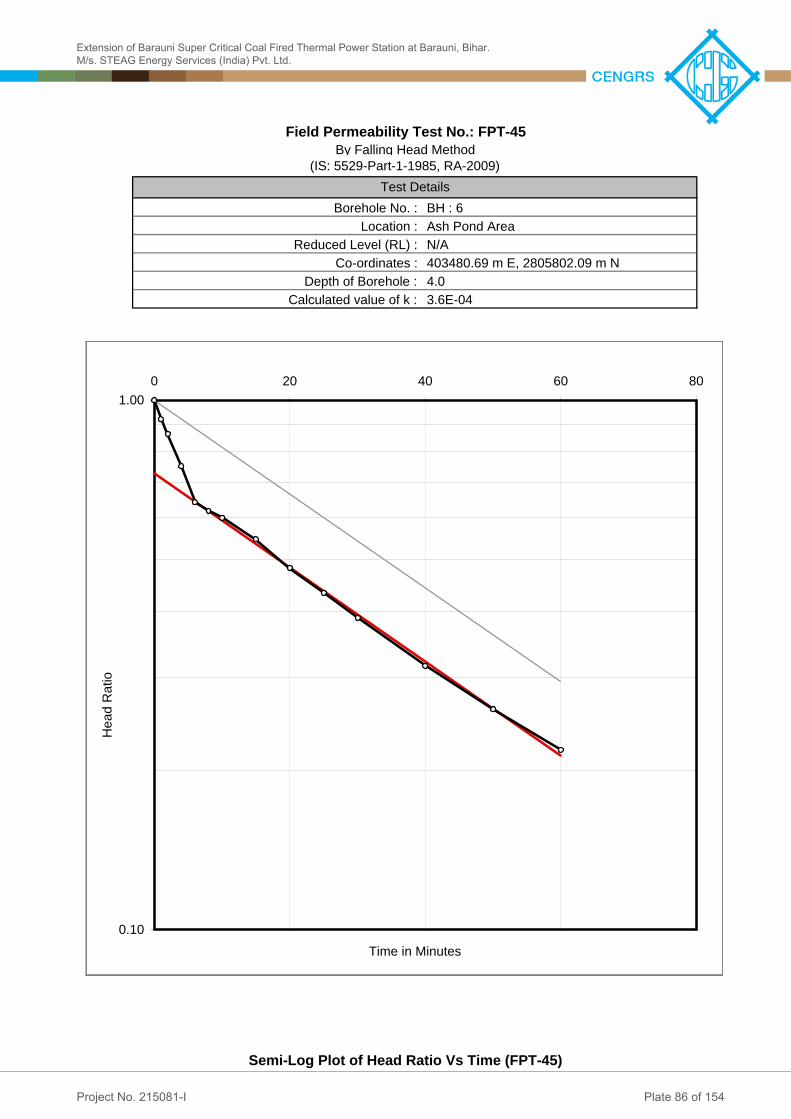
Semi-Log Plot of Head Ratio Vs Time (FPT-45)
Test Details
Depth of Borehole : Calculated value of k :
4.0
By Falling Head MethodField Permeability Test No.: FPT-45
(IS: 5529-Part-1-1985, RA-2009)
3.6E-04
Reduced Level (RL) : Co-ordinates :
N/A403480.69 m E, 2805802.09 m N
Borehole No. : Location :
BH : 6Ash Pond Area
0.10
1.000 20 40 60 80
Time in Minutes
Head
Rati
o
Extension of Barauni Super Critical Coal Fired Thermal Power Station at Barauni, Bihar.M/s. STEAG Energy Services (India) Pvt. Ltd.
Plate 86 of 154Project No. 215081-I

Sl. No.
Time in Minutes
Water Level in Intake
Pipe,cm
Head, cm
Sl. No.
Time in Minutes
Water Level in Intake
Pipe,cm
Head, cm
1 0.0 0.0 5932 1.0 65.0 5283 2.0 90.0 5034 4.0 175.0 4185 6.0 245.0 3486 8.0 290.0 3037 10.0 350.0 2438 15.0 420.0 1739 20.0 470.0 123
10 25.0 505.0 8811 30.0 530.0 6312 40.0 550.0 4313 50.0 560.0 33
k = Coefficient of Permeability =
Where:L = 50.0 cm d = 15.0 cm
2L/d = 6.67 R = 7.5 cmh1/ho = 0.09 t1 = 32.3 minutesh2/ho = 0.12 t2 = 28.3 minutesh1/h2 = 0.787
1.1E-03 cm/secDetermination of Coefficient of Permeability (FPT-46)
Depth of Water Table :
Field Permeability Test No.: FPT-46By Falling Head Method
IS: 5529-Part-1-1985, RA-2009
Borehole No. : Location :
Reduced Level (RL) : Co-ordinates :
N/A403480.69 m E, 2805802.09 m N
Soil Classification :
Depth of Borehole : Depth of bottom of casing below EGL :
Diameter of Intake Pipe : Length of Test Section :
6.0 m5.50 m
Silty fine sand
Height of Casing above GL : Hydraulic Head at Start of test :
15.0 cm50.0 cm7.1 m0.18 m593 cm
Test Details
k =
BH : 6Ash Pond Area
Dia of Intake Pipe: 15 cm
5.5 m
Test
Secti
on: 5
0 cm
EGL
0.18 m
6 m
d2
8L(t2 t1)ln
2Ld
lnh1
h2
Calculations based on semilog plot of Head Ratio vs. Time, as per IS:5529 (Part-I)
Extension of Barauni Super Critical Coal Fired Thermal Power Station at Barauni, Bihar.M/s. STEAG Energy Services (India) Pvt. Ltd.
Plate 87 of 154Project No. 215081-I

Semi-Log Plot of Head Ratio Vs Time (FPT-46)
Test Details
Depth of Borehole : Calculated value of k :
6.0
By Falling Head MethodField Permeability Test No.: FPT-46
(IS: 5529-Part-1-1985, RA-2009)
1.1E-03
Reduced Level (RL) : Co-ordinates :
N/A403480.69 m E, 2805802.09 m N
Borehole No. : Location :
BH : 6Ash Pond Area
0.01
0.10
1.000 20 40 60
Time in Minutes
Head
Rati
o
Extension of Barauni Super Critical Coal Fired Thermal Power Station at Barauni, Bihar.M/s. STEAG Energy Services (India) Pvt. Ltd.
Plate 88 of 154Project No. 215081-I

8.00 m = 800 cm800 cm
15 cm7.1 cm92 cm
99.1 cmFine sand
Time, min Q(litre)
Discharge, Q
litre/min)
Qaverage
litre/min
Borehole Radius (r), mm
Differential Head (H),
mC k, cm/s
0 298.0 0.0001 298.3 30.02 298.5 20.04 298.9 20.06 299.2 15.08 299.5 15.010 299.8 15.015 300.6 16.020 301.4 16.0
Equation used for calculationWhere:
Q=Discharge,(litre/min) H=Differential Head,(m)
15.4 75.0 1.0
Diameter of Intake Pipe :
Differential Head :
6.3E-024E-03
Depth of Water Table :
r=radius of casing,(mm)
Determination of Coefficient of Permeability (FPT-47)
Field Permeability Test No. : FPT-47By Constant Head Method
IS: 5529-Part-1-1985, RA-2009
Borehole No. : Location :
Test DetailsBH-6Ash Pond Area403480.69 m E, 2805802.09 m NUTM Coordinates :
Soil Classification :
Effective Height of water in Tank :
Depth of Borehole : Depth of bottom of casing below EGL :
HQCk *
rC
5.51
EGL
Head of Water in Tank
Water Meter
Valve
7.1cm
92cm Water
TankWater Tank
Extension of Barauni Super Critical Coal Fired Thermal Power Station at Barauni, Bihar.M/s. STEAG Energy Services (India) Pvt. Ltd.
Plate 89 of 154Project No. 215081-I

10.00 m = 1000 cm1000 cm
15 cm7.1 cm92 cm
99.1 cmFine sand
Time, min Q(litre)
Discharge, Q
litre/min)
Qaverage
litre/min
Borehole Radius (r), mm
Differential Head (H),
mC k, cm/s
0 301.4 0.0001 301.6 20.02 301.7 10.04 301.8 5.06 301.9 5.08 302.0 5.010 302.1 5.015 302.4 6.020 302.7 6.0
Equation used for calculationWhere:
Q=Discharge,(litre/min) H=Differential Head,(m)
4E-031.0755.3
Ash Pond Area
Depth of Water Table :
403480.69 m E, 2805802.09 m NUTM Coordinates :
Soil Classification :
Field Permeability Test No. : FPT-48By Constant Head Method
IS: 5529-Part-1-1985, RA-2009
Borehole No. : Location :
Test DetailsBH-6
Determination of Coefficient of Permeability (FPT-48)
r=radius of casing,(mm)
Effective Height of water in Tank :
Depth of Borehole : Depth of bottom of casing below EGL :
Diameter of Intake Pipe :
2.2E-02
Differential Head :
HQCk *
rC
5.51
EGL
Head of Water in Tank
Water Meter
Valve
7.1cm
92cm
Water TankWater Tank
Extension of Barauni Super Critical Coal Fired Thermal Power Station at Barauni, Bihar.M/s. STEAG Energy Services (India) Pvt. Ltd.
Plate 90 of 154Project No. 215081-I
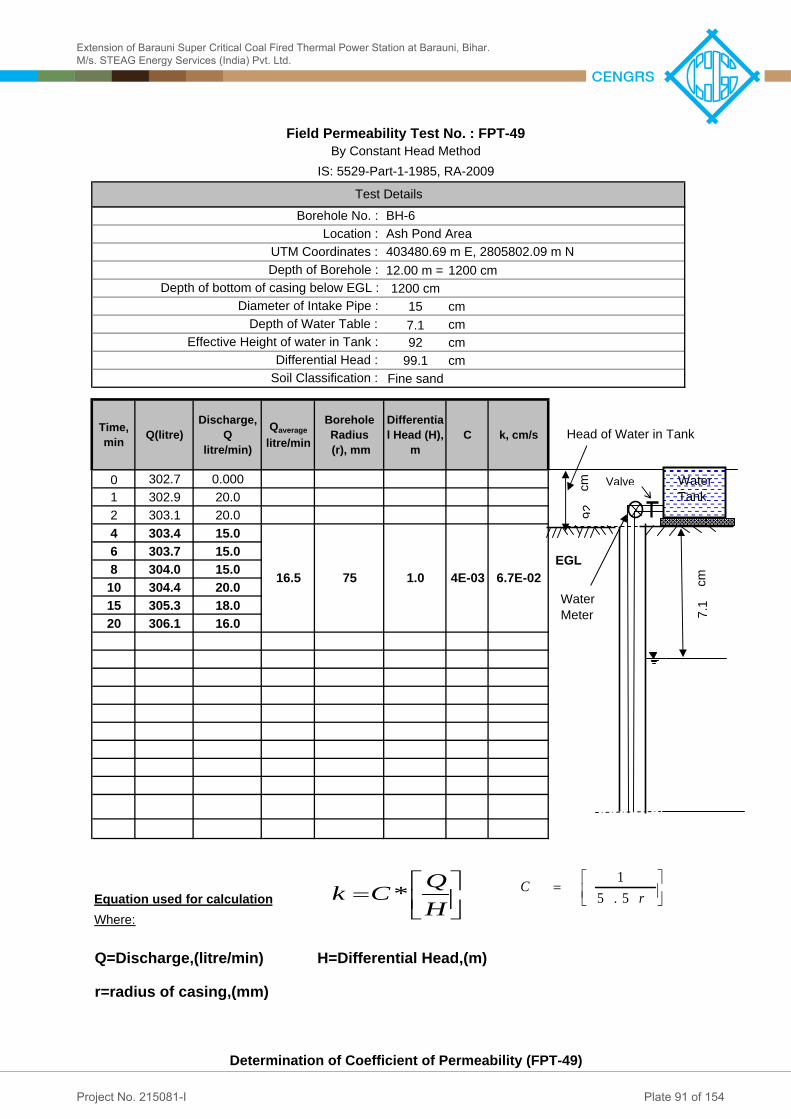
12.00 m = 1200 cm1200 cm
15 cm7.1 cm92 cm
99.1 cmFine sand
Time, min Q(litre)
Discharge, Q
litre/min)
Qaverage
litre/min
Borehole Radius (r), mm
Differential Head (H),
mC k, cm/s
0 302.7 0.0001 302.9 20.02 303.1 20.04 303.4 15.06 303.7 15.08 304.0 15.010 304.4 20.015 305.3 18.020 306.1 16.0
Equation used for calculationWhere:
Q=Discharge,(litre/min) H=Differential Head,(m)
16.5 75 1.0 4E-03 6.7E-02
Differential Head : Effective Height of water in Tank :
Depth of Borehole : Depth of bottom of casing below EGL :
Diameter of Intake Pipe :
r=radius of casing,(mm)
Determination of Coefficient of Permeability (FPT-49)
Soil Classification :
Field Permeability Test No. : FPT-49By Constant Head Method
IS: 5529-Part-1-1985, RA-2009
Borehole No. : Location :
Test DetailsBH-6Ash Pond Area
Depth of Water Table :
403480.69 m E, 2805802.09 m NUTM Coordinates :
HQCk *
rC
5.51
EGL
Head of Water in Tank
Water Meter
Valve
7.1cm
92cm
Water TankWater Tank
Extension of Barauni Super Critical Coal Fired Thermal Power Station at Barauni, Bihar.M/s. STEAG Energy Services (India) Pvt. Ltd.
Plate 91 of 154Project No. 215081-I

14.00 m = 1400 cm1400 cm
15 cm7.1 cm92 cm
99.1 cmFine sand
Time, min Q(litre)
Discharge, Q
litre/min)
Qaverage
litre/min
Borehole Radius (r), mm
Differential Head (H),
mC k, cm/s
0 306.1 0.0001 306.3 20.02 306.4 10.04 306.6 10.06 306.8 10.08 306.9 5.010 307.1 10.015 307.5 8.020 307.9 8.0
Equation used for calculationWhere:
Q=Discharge,(litre/min) H=Differential Head,(m)
4E-031.0758.7
Ash Pond Area
Depth of Water Table :
403480.69 m E, 2805802.09 m NUTM Coordinates :
Soil Classification :
Field Permeability Test No. : FPT-50By Constant Head Method
IS: 5529-Part-1-1985, RA-2009
Borehole No. : Location :
Test DetailsBH-6
Determination of Coefficient of Permeability (FPT-50)
r=radius of casing,(mm)
Effective Height of water in Tank :
Depth of Borehole : Depth of bottom of casing below EGL :
Diameter of Intake Pipe :
3.6E-02
Differential Head :
HQCk *
rC
5.51
EGL
Head of Water in Tank
Water Meter
Valve
7.1cm
92cm
Water TankWater Tank
Extension of Barauni Super Critical Coal Fired Thermal Power Station at Barauni, Bihar.M/s. STEAG Energy Services (India) Pvt. Ltd.
Plate 92 of 154Project No. 215081-I

16.00 m = 1600 cm1600 cm
15 cm7.1 cm92 cm
99.1 cmFine sand
Time, min Q(litre)
Discharge, Q
litre/min)
Qaverage
litre/min
Borehole Radius (r), mm
Differential Head (H),
mC k, cm/s
0 308.0 0.0001 308.2 20.02 308.3 10.04 308.5 10.06 308.7 10.08 308.8 5.010 308.9 5.015 309.2 6.020 309.6 8.0
Equation used for calculationWhere:
Q=Discharge,(litre/min) H=Differential Head,(m)
4E-031.0757.7
Ash Pond Area
Depth of Water Table :
403480.69 m E, 2805802.09 m NUTM Coordinates :
Soil Classification :
Field Permeability Test No. : FPT-51By Constant Head Method
IS: 5529-Part-1-1985, RA-2009
Borehole No. : Location :
Test DetailsBH-6
Determination of Coefficient of Permeability (FPT-51)
r=radius of casing,(mm)
Effective Height of water in Tank :
Depth of Borehole : Depth of bottom of casing below EGL :
Diameter of Intake Pipe :
3.1E-02
Differential Head :
HQCk *
rC
5.51
EGL
Head of Water in Tank
Water Meter
Valve
7.1cm
92cm
Water TankWater Tank
Extension of Barauni Super Critical Coal Fired Thermal Power Station at Barauni, Bihar.M/s. STEAG Energy Services (India) Pvt. Ltd.
Plate 93 of 154Project No. 215081-I

18.00 m = 1800 cm1800 cm
15 cm7.1 cm92 cm
99.1 cmFine sand
Time, min Q(litre)
Discharge, Q
litre/min)
Qaverage
litre/min
Borehole Radius (r), mm
Differential Head (H),
mC k, cm/s
0 309.6 0.0001 309.8 20.02 309.9 10.04 310.1 10.06 310.2 5.08 310.3 5.010 310.4 5.015 310.7 6.020 310.9 4.0
Equation used for calculationWhere:
Q=Discharge,(litre/min) H=Differential Head,(m)
6.4 75 1.0 4E-03 2.6E-02
Differential Head : Effective Height of water in Tank :
Depth of Borehole : Depth of bottom of casing below EGL :
Diameter of Intake Pipe :
r=radius of casing,(mm)
Determination of Coefficient of Permeability (FPT-52)
Soil Classification :
Field Permeability Test No. : FPT-52By Constant Head Method
IS: 5529-Part-1-1985, RA-2009
Borehole No. : Location :
Test DetailsBH-6Ash Pond Area
Depth of Water Table :
403480.69 m E, 2805802.09 m NUTM Coordinates :
HQCk *
rC
5.51
EGL
Head of Water in Tank
Water Meter
Valve
7.1cm
92cm
Water TankWater Tank
Extension of Barauni Super Critical Coal Fired Thermal Power Station at Barauni, Bihar.M/s. STEAG Energy Services (India) Pvt. Ltd.
Plate 94 of 154Project No. 215081-I

20.00 m = 2000 cm2000 cm
15 cm7.1 cm92 cm
99.1 cmFine sand
Time, min Q(litre)
Discharge, Q
litre/min)
Qaverage
litre/min
Borehole Radius (r), mm
Differential Head (H),
mC k, cm/s
0 311.0 0.0001 311.2 20.02 311.3 10.04 311.5 10.06 311.7 10.08 311.8 5.010 311.9 5.015 312.3 8.020 312.7 8.0
Equation used for calculationWhere:
Q=Discharge,(litre/min) H=Differential Head,(m)
8.0 75 1.0 4E-03
Ash Pond Area
Depth of Water Table :
403480.69 m E, 2805802.09 m NUTM Coordinates :
Soil Classification :
Field Permeability Test No. : FPT-53By Constant Head Method
IS: 5529-Part-1-1985, RA-2009
Borehole No. : Location :
Test DetailsBH-6
Determination of Coefficient of Permeability (FPT-53)
r=radius of casing,(mm)
Effective Height of water in Tank :
Depth of Borehole : Depth of bottom of casing below EGL :
Diameter of Intake Pipe :
Differential Head :
3.3E-02
HQCk *
rC
5.51
EGL
Head of Water in Tank
Water Meter
Valve
7.1cm
92cm
Water TankWater Tank
Extension of Barauni Super Critical Coal Fired Thermal Power Station at Barauni, Bihar.M/s. STEAG Energy Services (India) Pvt. Ltd.
Plate 95 of 154Project No. 215081-I

Sl. No.
Time in Minutes
Water Level in Intake
Pipe,cm
Head, cm
Sl. No.
Time in Minutes
Water Level in Intake
Pipe,cm
Head, cm
1 0.0 0.0 1902 1.0 26.0 1643 2.0 42.0 1484 4.0 62.0 1285 6.0 74.0 1166 8.0 83.0 1077 10.0 92.0 988 15.0 108.0 829 20.0 119.0 71
10 25.0 128.0 6211 30.0 136.0 5412 40.0 147.0 4313 50.0 156.0 3414 60.0 163.0 27
k = Coefficient of Permeability =
Where:L = 50.0 cm d = 15.0 cm
2L/d = 6.67 R = 7.5 cmh1/ho = 0.28 t1 = 30 minutesh2/ho = 0.09 t2 = 78.1 minutesh1/h2 = 3.088
4.2E-04 cm/secDetermination of Coefficient of Permeability (FPT-54)
Depth of Water Table :
Field Permeability Test No.: FPT-54By Falling Head Method
IS: 5529-Part-1-1985, RA-2009
Borehole No. : Location :
Reduced Level (RL) : UTM Coordinates :
N/A403506.00 m E, 2805239.00 m N
Soil Classification :
Depth of Borehole : Depth of bottom of casing below EGL :
Diameter of Intake Pipe : Length of Test Section :
2.0 m1.50 m
Silty fine sand
Height of Casing above GL : Hydraulic Head at Start of test :
15.0 cm50.0 cm7.1 m0.15 m190 cm
Test Details
k =
BH : 7Ash Pond Area
Dia of Intake Pipe: 15 cm
1.5 m
Test
Secti
on: 5
0 cm
EGL
0.15 m
2 m
d2
8L(t2 t1)ln
2Ld
lnh1
h2
Calculations based on semilog plot of Head Ratio vs. Time, as per IS:5529 (Part-I)
Extension of Barauni Super Critical Coal Fired Thermal Power Station at Barauni, Bihar.M/s. STEAG Energy Services (India) Pvt. Ltd.
Plate 96 of 154Project No. 215081-I

Semi-Log Plot of Head Ratio Vs Time (FPT-54)
Test Details
Depth of Borehole : Calculated value of k :
2.0
By Falling Head MethodField Permeability Test No.: FPT-54
(IS: 5529-Part-1-1985, RA-2009)
4.2E-04
Reduced Level (RL) : UTM Coordinates :
N/A403506.00 m E, 2805239.00 m N
Borehole No. : Location :
BH : 7Ash Pond Area
0.01
0.10
1.000 20 40 60 80 100
Time in Minutes
Head
Rati
o
Extension of Barauni Super Critical Coal Fired Thermal Power Station at Barauni, Bihar.M/s. STEAG Energy Services (India) Pvt. Ltd.
Plate 97 of 154Project No. 215081-I
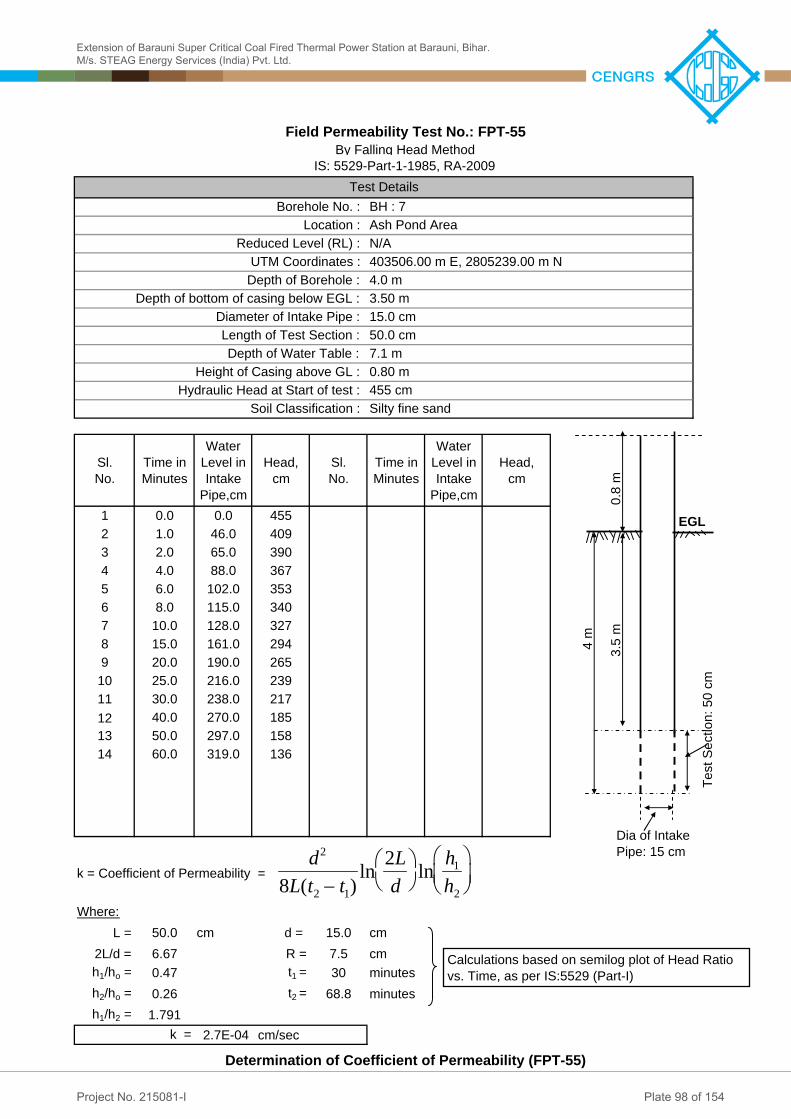
Sl. No.
Time in Minutes
Water Level in Intake
Pipe,cm
Head, cm
Sl. No.
Time in Minutes
Water Level in Intake
Pipe,cm
Head, cm
1 0.0 0.0 4552 1.0 46.0 4093 2.0 65.0 3904 4.0 88.0 3675 6.0 102.0 3536 8.0 115.0 3407 10.0 128.0 3278 15.0 161.0 2949 20.0 190.0 265
10 25.0 216.0 23911 30.0 238.0 21712 40.0 270.0 18513 50.0 297.0 15814 60.0 319.0 136
k = Coefficient of Permeability =
Where:L = 50.0 cm d = 15.0 cm
2L/d = 6.67 R = 7.5 cmh1/ho = 0.47 t1 = 30 minutesh2/ho = 0.26 t2 = 68.8 minutesh1/h2 = 1.791
2.7E-04 cm/secDetermination of Coefficient of Permeability (FPT-55)
Depth of Water Table :
Field Permeability Test No.: FPT-55By Falling Head Method
IS: 5529-Part-1-1985, RA-2009
Borehole No. : Location :
Reduced Level (RL) : UTM Coordinates :
N/A403506.00 m E, 2805239.00 m N
Soil Classification :
Depth of Borehole : Depth of bottom of casing below EGL :
Diameter of Intake Pipe : Length of Test Section :
4.0 m3.50 m
Silty fine sand
Height of Casing above GL : Hydraulic Head at Start of test :
15.0 cm50.0 cm7.1 m0.80 m455 cm
Test Details
k =
BH : 7Ash Pond Area
Dia of Intake Pipe: 15 cm
3.5 m
Test
Secti
on: 5
0 cm
EGL
0.8 m
4 m
d2
8L(t2 t1)ln
2Ld
lnh1
h2
Calculations based on semilog plot of Head Ratio vs. Time, as per IS:5529 (Part-I)
Extension of Barauni Super Critical Coal Fired Thermal Power Station at Barauni, Bihar.M/s. STEAG Energy Services (India) Pvt. Ltd.
Plate 98 of 154Project No. 215081-I

Semi-Log Plot of Head Ratio Vs Time (FPT-55)
Test Details
Depth of Borehole : Calculated value of k :
4.0
By Falling Head MethodField Permeability Test No.: FPT-55
(IS: 5529-Part-1-1985, RA-2009)
2.7E-04
Reduced Level (RL) : UTM Coordinates :
N/A403506.00 m E, 2805239.00 m N
Borehole No. : Location :
BH : 7Ash Pond Area
0.10
1.000 20 40 60 80
Time in Minutes
Head
Rati
o
Extension of Barauni Super Critical Coal Fired Thermal Power Station at Barauni, Bihar.M/s. STEAG Energy Services (India) Pvt. Ltd.
Plate 99 of 154Project No. 215081-I

Sl. No.
Time in Minutes
Water Level in Intake
Pipe,cm
Head, cm
Sl. No.
Time in Minutes
Water Level in Intake
Pipe,cm
Head, cm
1 0.0 0.0 5912 1.0 78.0 5133 2.0 130.0 4614 4.0 205.0 3865 6.0 275.0 3166 8.0 315.0 2767 10.0 351.0 2408 15.0 404.0 1879 20.0 441.0 150
10 25.0 476.0 11511 30.0 499.0 9212 40.0 530.0 6113 50.0 551.0 40
k = Coefficient of Permeability =
Where:L = 50.0 cm d = 15.0 cm
2L/d = 6.67 R = 7.5 cmh1/ho = 0.15 t1 = 30 minutesh2/ho = 0.05 t2 = 55.5 minutesh1/h2 = 2.920
7.5E-04 cm/secDetermination of Coefficient of Permeability (FPT-56)
Depth of Water Table :
Field Permeability Test No.: FPT-56By Falling Head Method
IS: 5529-Part-1-1985, RA-2009
Borehole No. : Location :
Reduced Level (RL) : UTM Coordinates :
N/A403506.00 m E, 2805239.00 m N
Soil Classification :
Depth of Borehole : Depth of bottom of casing below EGL :
Diameter of Intake Pipe : Length of Test Section :
6.0 m5.50 m
Silty fine sand
Height of Casing above GL : Hydraulic Head at Start of test :
15.0 cm50.0 cm7.1 m0.16 m591 cm
Test Details
k =
BH : 7Ash Pond Area
Dia of Intake Pipe: 15 cm
5.5 m
Test
Secti
on: 5
0 cm
EGL
0.16 m
6 m
d2
8L(t2 t1)ln
2Ld
lnh1
h2
Calculations based on semilog plot of Head Ratio vs. Time, as per IS:5529 (Part-I)
Extension of Barauni Super Critical Coal Fired Thermal Power Station at Barauni, Bihar.M/s. STEAG Energy Services (India) Pvt. Ltd.
Plate 100 of 154Project No. 215081-I

Semi-Log Plot of Head Ratio Vs Time (FPT-56)
Test Details
Depth of Borehole : Calculated value of k :
6.0
By Falling Head MethodField Permeability Test No.: FPT-56
(IS: 5529-Part-1-1985, RA-2009)
7.5E-04
Reduced Level (RL) : UTM Coordinates :
N/A403506.00 m E, 2805239.00 m N
Borehole No. : Location :
BH : 7Ash Pond Area
0.01
0.10
1.000 20 40 60
Time in Minutes
Head
Rati
o
Extension of Barauni Super Critical Coal Fired Thermal Power Station at Barauni, Bihar.M/s. STEAG Energy Services (India) Pvt. Ltd.
Plate 101 of 154Project No. 215081-I

8.00 m = 800 cm800 cm
15 cm7.1 cm92 cm
99.1 cmSilty fine sand
Time, min Q(litre)
Discharge, Q
litre/min)
Qaverage
litre/min
Borehole Radius (r), mm
Differential Head (H),
mC k, cm/s
0 279.0 0.0001 279.3 30.02 279.5 20.04 279.9 20.06 280.3 20.08 280.6 15.0 z10 280.9 15.015 281.8 18.020 282.6 16.0
Equation used for calculationWhere:
Q=Discharge,(litre/min) H=Differential Head,(m)
4E-031.07516.0
Ash Pond Area
Depth of Water Table :
403506.00 m E, 2805239.00 m NUTM Coordinates :
Soil Classification :
Field Permeability Test No. : FPT-57By Constant Head Method
IS: 5529-Part-1-1985, RA-2009
Borehole No. : Location :
Test DetailsBH-7
Determination of Coefficient of Permeability (FPT-57)
r=radius of casing,(mm)
Effective Height of water in Tank :
Depth of Borehole : Depth of bottom of casing below EGL :
Diameter of Intake Pipe :
Differential Head :
6.5E-02
HQCk *
rC
5.51
EGL
Head of Water in Tank
Water Meter
Valve
7.1cm
92cm
Water TankWater Tank
Extension of Barauni Super Critical Coal Fired Thermal Power Station at Barauni, Bihar.M/s. STEAG Energy Services (India) Pvt. Ltd.
Plate 102 of 154Project No. 215081-I

10.00 m = 1000 cm1000 cm
15 cm7.1 cm92 cm
99.1 cmFine sand
Time, min Q(litre)
Discharge, Q
litre/min)
Qaverage
litre/min
Borehole Radius (r), mm
Differential Head (H),
mC k, cm/s
0 282.6 0.0001 282.8 20.02 282.9 10.04 283.1 10.06 283.3 10.08 283.4 5.010 283.5 5.015 283.8 6.020 284.2 8.0
Equation used for calculationWhere:
Q=Discharge,(litre/min) H=Differential Head,(m)
2.6E-02
Differential Head : Effective Height of water in Tank :
Depth of Borehole : Depth of bottom of casing below EGL :
Diameter of Intake Pipe :
r=radius of casing,(mm)
Determination of Coefficient of Permeability (FPT-58)
Soil Classification :
Field Permeability Test No. : FPT-58By Constant Head Method
IS: 5529-Part-1-1985, RA-2009
Borehole No. : Location :
Test DetailsBH-7Ash Pond Area
Depth of Water Table :
403506.00 m E, 2805239.00 m NUTM Coordinates :
4E-031.0756.3
HQCk *
rC
5.51
EGL
Head of Water in Tank
Water Meter
Valve
7.1cm
92cm
Water TankWater Tank
Extension of Barauni Super Critical Coal Fired Thermal Power Station at Barauni, Bihar.M/s. STEAG Energy Services (India) Pvt. Ltd.
Plate 103 of 154Project No. 215081-I

12.00 m = 1200 cm1200 cm
15 cm7.1 cm92 cm
99.1 cmSilty fine sand
Time, min Q(litre)
Discharge, Q
litre/min)
Qaverage
litre/min
Borehole Radius (r), mm
Differential Head (H),
mC k, cm/s
0 284.3 0.0001 284.6 30.02 284.9 30.04 285.4 25.06 285.9 25.08 286.3 20.010 286.7 20.015 287.6 18.020 288.6 20.0
Equation used for calculationWhere:
Q=Discharge,(litre/min) H=Differential Head,(m)
4E-031.07519.3
Ash Pond Area
Depth of Water Table :
403506.00 m E, 2805239.00 m NUTM Coordinates :
Soil Classification :
Field Permeability Test No. : FPT-59By Constant Head Method
IS: 5529-Part-1-1985, RA-2009
Borehole No. : Location :
Test DetailsBH-7
Determination of Coefficient of Permeability (FPT-59)
r=radius of casing,(mm)
Effective Height of water in Tank :
Depth of Borehole : Depth of bottom of casing below EGL :
Diameter of Intake Pipe :
Differential Head :
7.9E-02
HQCk *
rC
5.51
EGL
Head of Water in Tank
Water Meter
Valve
7.1cm
92cm
Water TankWater Tank
Extension of Barauni Super Critical Coal Fired Thermal Power Station at Barauni, Bihar.M/s. STEAG Energy Services (India) Pvt. Ltd.
Plate 104 of 154Project No. 215081-I

14.00 m = 1400 cm1400 cm
15 cm7.1 cm92 cm
99.1 cmFine sand
Time, min Q(litre)
Discharge, Q
litre/min)
Qaverage
litre/min
Borehole Radius (r), mm
Differential Head (H),
mC k, cm/s
0 288.6 0.0001 288.8 20.02 289.0 20.04 289.3 15.06 289.6 15.08 289.9 15.010 290.1 10.015 290.7 12.020 291.2 10.0
Equation used for calculationWhere:
Q=Discharge,(litre/min) H=Differential Head,(m)
4.3E-02
Differential Head : Effective Height of water in Tank :
Depth of Borehole : Depth of bottom of casing below EGL :
Diameter of Intake Pipe :
r=radius of casing,(mm)
Determination of Coefficient of Permeability (FPT-60)
Soil Classification :
Field Permeability Test No. : FPT-60By Constant Head Method
IS: 5529-Part-1-1985, RA-2009
Borehole No. : Location :
Test DetailsBH-7Ash Pond Area
Depth of Water Table :
403506.00 m E, 2805239.00 m NUTM Coordinates :
4E-031.07510.7
HQCk *
rC
5.51
EGL
Head of Water in Tank
Water Meter
Valve
7.1cm
92cm
Water TankWater Tank
Extension of Barauni Super Critical Coal Fired Thermal Power Station at Barauni, Bihar.M/s. STEAG Energy Services (India) Pvt. Ltd.
Plate 105 of 154Project No. 215081-I

16.00 m = 1600 cm1600 cm
15 cm7.1 cm92 cm
99.1 cmFine sand
Time, min Q(litre)
Discharge, Q
litre/min)
Qaverage
litre/min
Borehole Radius (r), mm
Differential Head (H),
mC k, cm/s
0 291.2 0.0001 291.4 20.02 291.6 20.04 291.9 15.06 292.1 10.08 292.4 15.010 292.6 10.015 293.1 10.020 293.7 12.0
Equation used for calculationWhere:
Q=Discharge,(litre/min) H=Differential Head,(m)
4E-031.07511.4
Ash Pond Area
Depth of Water Table :
403506.00 m E, 2805239.00 m NUTM Coordinates :
Soil Classification :
Field Permeability Test No. : FPT-61By Constant Head Method
IS: 5529-Part-1-1985, RA-2009
Borehole No. : Location :
Test DetailsBH-7
Determination of Coefficient of Permeability (FPT-61)
r=radius of casing,(mm)
Effective Height of water in Tank :
Depth of Borehole : Depth of bottom of casing below EGL :
Diameter of Intake Pipe :
4.6E-02
Differential Head :
HQCk *
rC
5.51
EGL
Head of Water in Tank
Water Meter
Valve
7.1cm
92cm
Water TankWater Tank
Extension of Barauni Super Critical Coal Fired Thermal Power Station at Barauni, Bihar.M/s. STEAG Energy Services (India) Pvt. Ltd.
Plate 106 of 154Project No. 215081-I

18.00 m = 1800 cm1800 cm
15 cm7.1 cm92 cm
99.1 cmFine sand
Time, min Q(litre)
Discharge, Q
litre/min)
Qaverage
litre/min
Borehole Radius (r), mm
Differential Head (H),
mC k, cm/s
0 293.7 0.0001 293.9 20.02 294.0 10.04 294.2 10.06 294.4 10.08 294.7 15.010 294.9 10.015 295.5 12.020 296.0 10.0
Equation used for calculationWhere:
Q=Discharge,(litre/min) H=Differential Head,(m)
Differential Head : Effective Height of water in Tank :
Depth of Borehole : Depth of bottom of casing below EGL :
Diameter of Intake Pipe :
r=radius of casing,(mm)
Determination of Coefficient of Permeability (FPT-62)
Soil Classification :
Field Permeability Test No. : FPT-62By Constant Head Method
IS: 5529-Part-1-1985, RA-2009
Borehole No. : Location :
Test DetailsBH-7Ash Pond Area
Depth of Water Table :
403506.00 m E, 2805239.00 m NUTM Coordinates :
11.0 4.5E-024E-031.075
HQCk *
rC
5.51
EGL
Head of Water in Tank
Water Meter
Valve
7.1cm
92cm
Water TankWater Tank
Extension of Barauni Super Critical Coal Fired Thermal Power Station at Barauni, Bihar.M/s. STEAG Energy Services (India) Pvt. Ltd.
Plate 107 of 154Project No. 215081-I

20.00 m = 2000 cm2000 cm
15 cm7.1 cm92 cm
99.1 cmFine sand
Time, min Q(litre)
Discharge, Q
litre/min)
Qaverage
litre/min
Borehole Radius (r), mm
Differential Head (H),
mC k, cm/s
0 296.0 0.0001 296.1 10.02 296.2 10.04 296.4 10.06 296.7 15.08 296.9 10.010 297.1 10.015 297.5 8.020 297.9 8.0
Equation used for calculationWhere:
Q=Discharge,(litre/min) H=Differential Head,(m)
4E-031.07510.2
Ash Pond Area
Depth of Water Table :
403506.00 m E, 2805239.00 m NUTM Coordinates :
Soil Classification :
Field Permeability Test No. : FPT-63By Constant Head Method
IS: 5529-Part-1-1985, RA-2009
Borehole No. : Location :
Test DetailsBH-7
Determination of Coefficient of Permeability (FPT-63)
r=radius of casing,(mm)
Effective Height of water in Tank :
Depth of Borehole : Depth of bottom of casing below EGL :
Diameter of Intake Pipe :
Differential Head :
4.2E-02
HQCk *
rC
5.51
EGL
Head of Water in Tank
Water Meter
Valve
7.1cm
92cm
Water TankWater Tank
Extension of Barauni Super Critical Coal Fired Thermal Power Station at Barauni, Bihar.M/s. STEAG Energy Services (India) Pvt. Ltd.
Plate 108 of 154Project No. 215081-I

Sl. No.
Time in Minutes
Water Level in Intake
Pipe,cm
Head, cm
Sl. No.
Time in Minutes
Water Level in Intake
Pipe,cm
Head, cm
1 0.0 0.0 1952 1.0 32.0 1633 2.0 57.0 1384 4.0 82.0 1135 6.0 101.0 946 8.0 120.0 757 10.0 135.0 608 15.0 156.0 399 20.0 169.0 26
10 25.0 174.0 2111 30.0 178.0 1712 40.0 199.0 -413 50.0
k = Coefficient of Permeability =
Where:L = 50.0 cm d = 15.0 cm
2L/d = 6.67 R = 7.5 cmh1/ho = 0.05 t1 = 45.1 minutesh2/ho = 0.03 t2 = 53.5 minutesh1/h2 = 1.366
6.6E-04 cm/secDetermination of Coefficient of Permeability (FPT-64)
Depth of Water Table :
Field Permeability Test No.: FPT-64By Falling Head Method
IS: 5529-Part-1-1985, RA-2009
Borehole No. : Location :
Reduced Level (RL) : UTM Coordinates :
N/A404586.77 m E, 2805103.37 m N
Soil Classification :
Depth of Borehole : Depth of bottom of casing below EGL :
Diameter of Intake Pipe : Length of Test Section :
2.0 m1.50 m
Silty fine sand
Height of Casing above GL : Hydraulic Head at Start of test :
15.0 cm50.0 cm7.0 m0.20 m195 cm
Test Details
k =
BH : 8Ash Pond Area
Dia of Intake Pipe: 15 cm
1.5 m
Test
Secti
on: 5
0 cm
EGL
0.2 m
2 m
d2
8L(t2 t1)ln
2Ld
lnh1
h2
Calculations based on semilog plot of Head Ratio vs. Time, as per IS:5529 (Part-I)
Extension of Barauni Super Critical Coal Fired Thermal Power Station at Barauni, Bihar.M/s. STEAG Energy Services (India) Pvt. Ltd.
Plate 109 of 154Project No. 215081-I

Semi-Log Plot of Head Ratio Vs Time (FPT-64)
Test Details
Depth of Borehole : Calculated value of k :
2.0
By Falling Head MethodField Permeability Test No.: FPT-64
(IS: 5529-Part-1-1985, RA-2009)
6.6E-04
Reduced Level (RL) : UTM Coordinates :
N/A404586.77 m E, 2805103.37 m N
Borehole No. : Location :
BH : 8Ash Pond Area
0.01
0.10
1.000 20 40 60
Time in Minutes
Head
Rati
o
Extension of Barauni Super Critical Coal Fired Thermal Power Station at Barauni, Bihar.M/s. STEAG Energy Services (India) Pvt. Ltd.
Plate 110 of 154Project No. 215081-I

Sl. No.
Time in Minutes
Water Level in Intake
Pipe,cm
Head, cm
Sl. No.
Time in Minutes
Water Level in Intake
Pipe,cm
Head, cm
1 0.0 0.0 4002 1.0 41.0 3593 2.0 69.0 3314 4.0 102.0 2985 6.0 140.0 2606 8.0 171.0 2297 10.0 198.0 2028 15.0 234.0 1669 20.0 262.0 138
10 25.0 288.0 11211 30.0 310.0 9012 40.0 334.0 6613 50.0 347.0 53
k = Coefficient of Permeability =
Where:L = 50.0 cm d = 15.0 cm
2L/d = 6.67 R = 7.5 cmh1/ho = 0.20 t1 = 30 minutesh2/ho = 0.04 t2 = 98.6 minutesh1/h2 = 4.753
4.0E-04 cm/secDetermination of Coefficient of Permeability (FPT-65)
Depth of Water Table :
Field Permeability Test No.: FPT-65By Falling Head Method
IS: 5529-Part-1-1985, RA-2009
Borehole No. : Location :
Reduced Level (RL) : UTM Coordinates :
N/A404586.77 m E, 2805103.37 m N
Soil Classification :
Depth of Borehole : Depth of bottom of casing below EGL :
Diameter of Intake Pipe : Length of Test Section :
4.0 m3.50 m
Silty fine sand
Height of Casing above GL : Hydraulic Head at Start of test :
15.0 cm50.0 cm7.0 m0.25 m400 cm
Test Details
k =
BH : 8Ash Pond Area
Dia of Intake Pipe: 15 cm
3.5 m
Test
Secti
on: 5
0 cm
EGL
0.25 m
4 m
d2
8L(t2 t1)ln
2Ld
lnh1
h2
Calculations based on semilog plot of Head Ratio vs. Time, as per IS:5529 (Part-I)
Extension of Barauni Super Critical Coal Fired Thermal Power Station at Barauni, Bihar.M/s. STEAG Energy Services (India) Pvt. Ltd.
Plate 111 of 154Project No. 215081-I

Semi-Log Plot of Head Ratio Vs Time (FPT-65)
Test Details
Depth of Borehole : Calculated value of k :
4.0
By Falling Head MethodField Permeability Test No.: FPT-65
(IS: 5529-Part-1-1985, RA-2009)
4.0E-04
Reduced Level (RL) : UTM Coordinates :
N/A404586.77 m E, 2805103.37 m N
Borehole No. : Location :
BH : 8Ash Pond Area
0.01
0.10
1.000 20 40 60 80 100 120
Time in Minutes
Head
Rati
o
Extension of Barauni Super Critical Coal Fired Thermal Power Station at Barauni, Bihar.M/s. STEAG Energy Services (India) Pvt. Ltd.
Plate 112 of 154Project No. 215081-I

Sl. No.
Time in Minutes
Water Level in Intake
Pipe,cm
Head, cm
Sl. No.
Time in Minutes
Water Level in Intake
Pipe,cm
Head, cm
1 0.0 0.0 5952 1.0 35.0 5603 2.0 60.0 5354 4.0 120.0 4755 6.0 170.0 4256 8.0 250.0 3457 10.0 300.0 2958 15.0 380.0 2159 20.0 440.0 155
10 25.0 480.0 11511 30.0 515.0 8012 40.0 550.0 4513 50.0 570.0 25
k = Coefficient of Permeability =
Where:L = 50.0 cm d = 15.0 cm
2L/d = 6.67 R = 7.5 cmh1/ho = 0.11 t1 = 32.3 minutesh2/ho = 0.05 t2 = 46.9 minutesh1/h2 = 2.352
1.0E-03 cm/secDetermination of Coefficient of Permeability (FPT-66)
Depth of Water Table :
Field Permeability Test No.: FPT-66By Falling Head Method
IS: 5529-Part-1-1985, RA-2009
Borehole No. : Location :
Reduced Level (RL) : UTM Coordinates :
N/A404586.77 m E, 2805103.37 m N
Soil Classification :
Depth of Borehole : Depth of bottom of casing below EGL :
Diameter of Intake Pipe : Length of Test Section :
6.0 m5.50 m
Silty fine sand
Height of Casing above GL : Hydraulic Head at Start of test :
15.0 cm50.0 cm7.0 m0.20 m595 cm
Test Details
k =
BH : 8Ash Pond Area
Dia of Intake Pipe: 15 cm
5.5 m
Test
Secti
on: 5
0 cm
EGL
0.2 m
6 m
d2
8L(t2 t1)ln
2Ld
lnh1
h2
Calculations based on semilog plot of Head Ratio vs. Time, as per IS:5529 (Part-I)
Extension of Barauni Super Critical Coal Fired Thermal Power Station at Barauni, Bihar.M/s. STEAG Energy Services (India) Pvt. Ltd.
Plate 113 of 154Project No. 215081-I
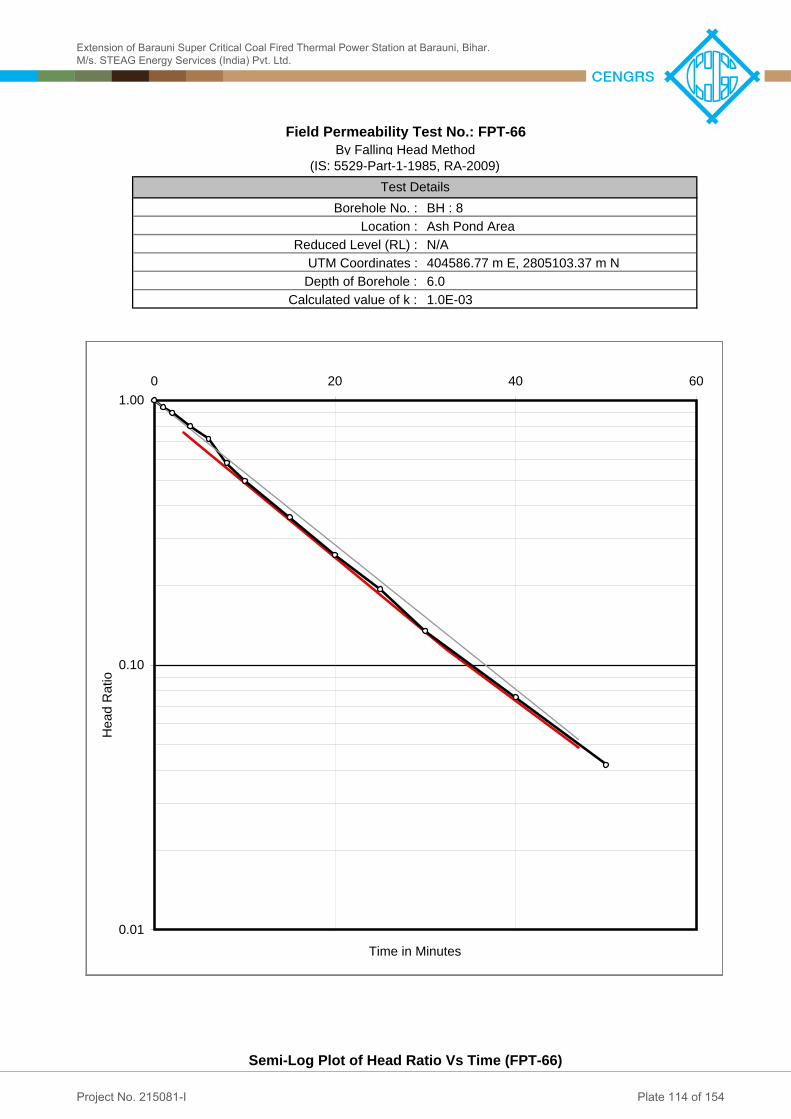
Semi-Log Plot of Head Ratio Vs Time (FPT-66)
Test Details
Depth of Borehole : Calculated value of k :
6.0
By Falling Head MethodField Permeability Test No.: FPT-66
(IS: 5529-Part-1-1985, RA-2009)
1.0E-03
Reduced Level (RL) : UTM Coordinates :
N/A404586.77 m E, 2805103.37 m N
Borehole No. : Location :
BH : 8Ash Pond Area
0.01
0.10
1.000 20 40 60
Time in Minutes
Head
Rati
o
Extension of Barauni Super Critical Coal Fired Thermal Power Station at Barauni, Bihar.M/s. STEAG Energy Services (India) Pvt. Ltd.
Plate 114 of 154Project No. 215081-I

8.00 m = 800 cm800 cm
15 cm7.1 cm92 cm
99.1 cmSilty fine sand
Time, min Q(litre)
Discharge, Q
litre/min)
Qaverage
litre/min
Borehole Radius (r), mm
Differential Head (H),
mC k, cm/s
0 249.0 0.0001 249.4 40.02 249.8 40.04 250.5 35.06 251.1 30.08 251.8 35.010 252.2 20.015 252.7 10.020 253.7 20.0
Equation used for calculationWhere:
Q=Discharge,(litre/min) H=Differential Head,(m)
9.4E-02
Differential Head : Effective Height of water in Tank :
Depth of Borehole : Depth of bottom of casing below EGL :
Diameter of Intake Pipe :
r=radius of casing,(mm)
Determination of Coefficient of Permeability (FPT-67)
Soil Classification :
Field Permeability Test No. : FPT-67By Constant Head Method
IS: 5529-Part-1-1985, RA-2009
Borehole No. : Location :
Test DetailsBH-8Ash Pond Area
Depth of Water Table :
404586.77 m E, 2805103.37 m NUTM Coordinates :
4E-031.07523.0
HQCk *
rC
5.51
EGL
Head of Water in Tank
Water Meter
Valve
7.1cm
92cm
Water TankWater Tank
Extension of Barauni Super Critical Coal Fired Thermal Power Station at Barauni, Bihar.M/s. STEAG Energy Services (India) Pvt. Ltd.
Plate 115 of 154Project No. 215081-I

10.00 m = 1000 cm1000 cm
15 cm7.1 cm92 cm
99.1 cmSilty fine sand
Time, min Q(litre)
Discharge, Q
litre/min)
Qaverage
litre/min
Borehole Radius (r), mm
Differential Head (H),
mC k, cm/s
0 254.0 0.0001 254.3 30.02 254.5 20.04 254.9 20.06 255.3 20.08 255.8 25.010 256.1 15.015 257.1 20.020 258.0 18.0
Equation used for calculationWhere:
Q=Discharge,(litre/min) H=Differential Head,(m)
4E-031.07520.0
Ash Pond Area
Depth of Water Table :
404586.77 m E, 2805103.37 m NUTM Coordinates :
Soil Classification :
Field Permeability Test No. : FPT-68By Constant Head Method
IS: 5529-Part-1-1985, RA-2009
Borehole No. : Location :
Test DetailsBH-8
Determination of Coefficient of Permeability (FPT-68)
r=radius of casing,(mm)
Effective Height of water in Tank :
Depth of Borehole : Depth of bottom of casing below EGL :
Diameter of Intake Pipe :
Differential Head :
8.2E-02
HQCk *
rC
5.51
EGL
Head of Water in Tank
Water Meter
Valve
7.1cm
92cm
Water TankWater Tank
Extension of Barauni Super Critical Coal Fired Thermal Power Station at Barauni, Bihar.M/s. STEAG Energy Services (India) Pvt. Ltd.
Plate 116 of 154Project No. 215081-I

12.00 m = 1200 cm1200 cm
15 cm7.1 cm92 cm
99.1 cmSilty fine sand
Time, min Q(litre)
Discharge, Q
litre/min)
Qaverage
litre/min
Borehole Radius (r), mm
Differential Head (H),
mC k, cm/s
0 258.0 0.0001 258.4 40.02 258.9 50.04 259.3 20.06 259.9 30.08 260.4 25.010 260.9 25.015 262.5 32.020 263.9 28.0
Equation used for calculationWhere:
Q=Discharge,(litre/min) H=Differential Head,(m)
1.1E-01
Differential Head : Effective Height of water in Tank :
Depth of Borehole : Depth of bottom of casing below EGL :
Diameter of Intake Pipe :
r=radius of casing,(mm)
Determination of Coefficient of Permeability (FPT-69)
Soil Classification :
Field Permeability Test No. : FPT-69By Constant Head Method
IS: 5529-Part-1-1985, RA-2009
Borehole No. : Location :
Test DetailsBH-8Ash Pond Area
Depth of Water Table :
404586.77 m E, 2805103.37 m NUTM Coordinates :
27.5 75 1.0 4E-03
HQCk *
rC
5.51
EGL
Head of Water in Tank
Water Meter
Valve
7.1cm
92cm
Water TankWater Tank
Extension of Barauni Super Critical Coal Fired Thermal Power Station at Barauni, Bihar.M/s. STEAG Energy Services (India) Pvt. Ltd.
Plate 117 of 154Project No. 215081-I

14.00 m = 1400 cm1400 cm
15 cm7.1 cm92 cm
99.1 cmSilty fine sand
Time, min Q(litre)
Discharge, Q
litre/min)
Qaverage
litre/min
Borehole Radius (r), mm
Differential Head (H),
mC k, cm/s
0 264.0 0.0001 264.4 40.02 264.8 40.04 265.4 30.06 266.1 35.08 266.7 30.010 267.1 20.015 268.1 20.020 269.2 22.0
Equation used for calculationWhere:
Q=Discharge,(litre/min) H=Differential Head,(m)
4E-031.07520.7
Ash Pond Area
Depth of Water Table :
404586.77 m E, 2805103.37 m NUTM Coordinates :
Soil Classification :
Field Permeability Test No. : FPT-70By Constant Head Method
IS: 5529-Part-1-1985, RA-2009
Borehole No. : Location :
Test DetailsBH-8
Determination of Coefficient of Permeability (FPT-70)
r=radius of casing,(mm)
Effective Height of water in Tank :
Depth of Borehole : Depth of bottom of casing below EGL :
Diameter of Intake Pipe :
Differential Head :
8.4E-02
HQCk *
rC
5.51
EGL
Head of Water in Tank
Water Meter
Valve
7.1cm
92cm
Water TankWater Tank
Extension of Barauni Super Critical Coal Fired Thermal Power Station at Barauni, Bihar.M/s. STEAG Energy Services (India) Pvt. Ltd.
Plate 118 of 154Project No. 215081-I

16.00 m = 1600 cm1600 cm
15 cm7.1 cm92 cm
99.1 cmSilty fine sand
Time, min Q(litre)
Discharge, Q
litre/min)
Qaverage
litre/min
Borehole Radius (r), mm
Differential Head (H),
mC k, cm/s
0 269.2 0.0001 269.5 30.02 269.7 20.04 270.2 25.06 270.6 20.08 270.9 15.010 271.3 20.015 272.2 18.020 273.0 16.0
Equation used for calculationWhere:
Q=Discharge,(litre/min) H=Differential Head,(m)
7.3E-02
Differential Head : Effective Height of water in Tank :
Depth of Borehole : Depth of bottom of casing below EGL :
Diameter of Intake Pipe :
r=radius of casing,(mm)
Determination of Coefficient of Permeability (FPT-71)
Soil Classification :
Field Permeability Test No. : FPT-71By Constant Head Method
IS: 5529-Part-1-1985, RA-2009
Borehole No. : Location :
Test DetailsBH-8Ash Pond Area
Depth of Water Table :
404586.77 m E, 2805103.37 m NUTM Coordinates :
4E-031.07518.0
HQCk *
rC
5.51
EGL
Head of Water in Tank
Water Meter
Valve
7.1cm
92cm
Water TankWater Tank
Extension of Barauni Super Critical Coal Fired Thermal Power Station at Barauni, Bihar.M/s. STEAG Energy Services (India) Pvt. Ltd.
Plate 119 of 154Project No. 215081-I

18.00 m = 1800 cm1800 cm
15 cm7.1 cm92 cm
99.1 cmSilty fine sand
Time, min Q(litre)
Discharge, Q
litre/min)
Qaverage
litre/min
Borehole Radius (r), mm
Differential Head (H),
mC k, cm/s
0 273.0 0.0001 273.2 20.02 273.4 20.04 273.7 15.06 274.1 20.08 274.4 15.010 274.7 15.015 275.4 14.020 276.1 14.0
Equation used for calculationWhere:
Q=Discharge,(litre/min) H=Differential Head,(m)
4E-031.07514.5
Ash Pond Area
Depth of Water Table :
404586.77 m E, 2805103.37 m NUTM Coordinates :
Soil Classification :
Field Permeability Test No. : FPT-72By Constant Head Method
IS: 5529-Part-1-1985, RA-2009
Borehole No. : Location :
Test DetailsBH-8
Determination of Coefficient of Permeability (FPT-72)
r=radius of casing,(mm)
Effective Height of water in Tank :
Depth of Borehole : Depth of bottom of casing below EGL :
Diameter of Intake Pipe :
5.9E-02
Differential Head :
HQCk *
rC
5.51
EGL
Head of Water in Tank
Water Meter
Valve
7.1cm
92cm
Water TankWater Tank
Extension of Barauni Super Critical Coal Fired Thermal Power Station at Barauni, Bihar.M/s. STEAG Energy Services (India) Pvt. Ltd.
Plate 120 of 154Project No. 215081-I

20.00 m = 2000 cm2000 cm
15 cm7.1 cm92 cm
99.1 cmSilty fine sand
Time, min Q(litre)
Discharge, Q
litre/min)
Qaverage
litre/min
Borehole Radius (r), mm
Differential Head (H),
mC k, cm/s
0 276.2 0.0001 276.4 20.02 276.5 10.04 276.8 15.06 277.1 15.08 277.3 10.010 277.5 10.015 278.1 12.020 278.6 10.0
Equation used for calculationWhere:
Q=Discharge,(litre/min) H=Differential Head,(m)
4.3E-02
Differential Head : Effective Height of water in Tank :
Depth of Borehole : Depth of bottom of casing below EGL :
Diameter of Intake Pipe :
r=radius of casing,(mm)
Determination of Coefficient of Permeability (FPT-73)
Soil Classification :
Field Permeability Test No. : FPT-73By Constant Head Method
IS: 5529-Part-1-1985, RA-2009
Borehole No. : Location :
Test DetailsBH-8Ash Pond Area
Depth of Water Table :
404586.77 m E, 2805103.37 m NUTM Coordinates :
4E-031.07510.5
HQCk *
rC
5.51
EGL
Head of Water in Tank
Water Meter
Valve
7.1cm
92cm
Water TankWater Tank
Extension of Barauni Super Critical Coal Fired Thermal Power Station at Barauni, Bihar.M/s. STEAG Energy Services (India) Pvt. Ltd.
Plate 121 of 154Project No. 215081-I

Borehole Number
Sample Depth, m
% Gravel
% Sand % Silt %
Clay D60 D50 D30 D10 Cu Cc
BH-1 0.00 0 17 62 20 0.021 0.016 0.005
BH-1 1.00 0 62 35 3 0.186 0.160 0.062 0.026 7.2 0.79
BH-1 2.00 0 83 17 0 0.205 0.170 0.122
BH-1 4.00 0 78 17 5 0.133 0.130 0.087 0.014 9.5 4.06
BH-1 5.00 0 79 16 5 0.157 0.150 0.093 0.015 10.5 3.67
Sample Details
Sample Description
Sandy silt (CL)
IS : 2720 (Part 4) - 1985, RA-2010Grain Size Analysis
Test Results
Silty fine sand (SM)
Silty fine sand (SM)
Silty fine sand (SM)
Silty fine sand (SM)
Grain Size Distribution Curve
0
10
20
30
40
50
60
70
80
90
100
0.001 0.010 0.100 1.000 10.000Particle Size, mm
% Fin
er by
Weig
ht
Borehole No: 1 , Depth: 0 mBorehole No: 1 , Depth: 1 mBorehole No: 1 , Depth: 2 mBorehole No: 1 , Depth: 4 mBorehole No: 1 , Depth: 5 m
GRAVELCOARSEFINE MEDIUM S A N DS I L TCLAY
Hydrometer Analysis Sieve Analysis
Extension of Barauni Super Critical Coal Fired Thermal Power Station at Barauni, Bihar.M/s. STEAG Energy Services (India) Pvt. Ltd.
Plate 122 of 154Project No. 215081-I

Borehole Number
Sample Depth, m
% Gravel
% Sand % Silt %
Clay D60 D50 D30 D10 Cu Cc
BH-1 8.00 0 86 14 0 0.201 0.170 0.121
BH-1 12.00 0 95 5 0 0.265 0.230 0.186 0.109 2.4 1.20
BH-1 14.00 0 96 4 0 0.293 0.250 0.203 0.129 2.3 1.09
BH-1 16.00 1 99 0 0 0.287 0.250 0.207 0.153 1.9 0.98
Sample Details
Sample Description
Silty fine sand (SM)
IS : 2720 (Part 4) - 1985, RA-2010Grain Size Analysis
Test Results
Fine sand (SP-SM)
Fine sand (SP)
Fine sand (SP)
Grain Size Distribution Curve
0
10
20
30
40
50
60
70
80
90
100
0.001 0.010 0.100 1.000 10.000Particle Size, mm
% Fin
er by
Weig
ht
Borehole No: 1 , Depth: 8 m
Borehole No: 1 , Depth: 12 m
Borehole No: 1 , Depth: 14 m
Borehole No: 1 , Depth: 16 m
GRAVELCOARSEFINE MEDIUM S A N DS I L TCLAY
Hydrometer Analysis Sieve Analysis
Extension of Barauni Super Critical Coal Fired Thermal Power Station at Barauni, Bihar.M/s. STEAG Energy Services (India) Pvt. Ltd.
Plate 123 of 154Project No. 215081-I
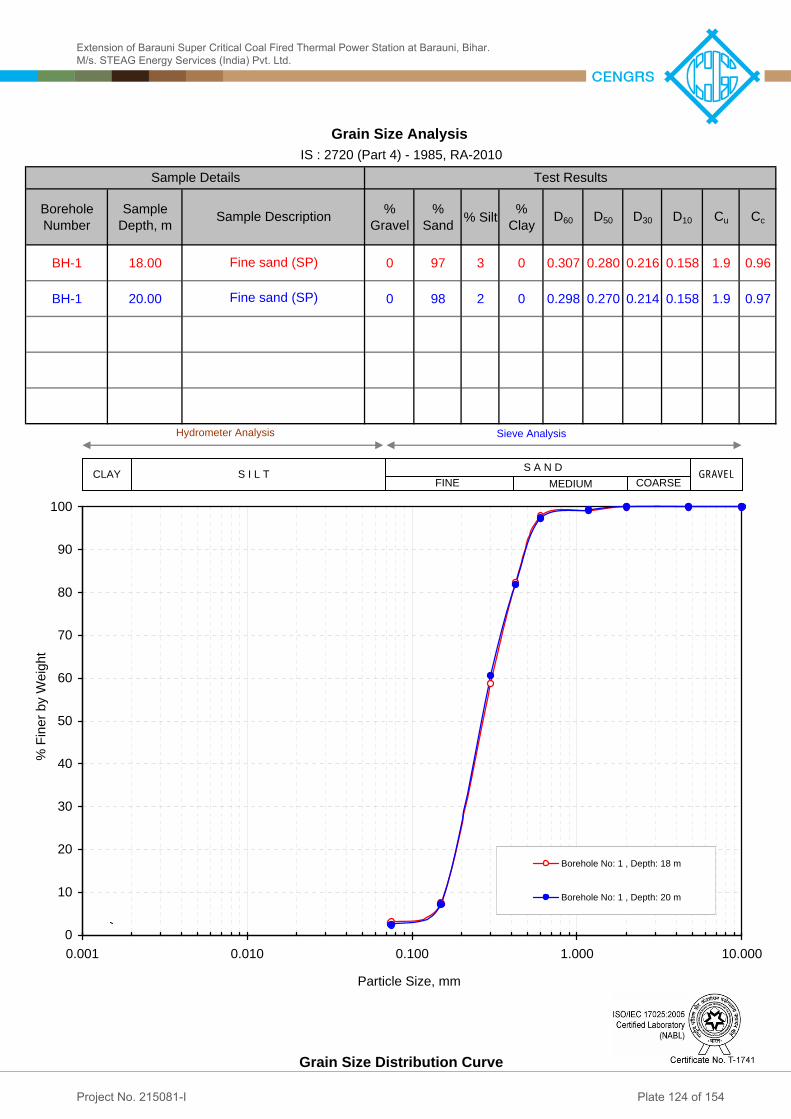
Borehole Number
Sample Depth, m
% Gravel
% Sand % Silt %
Clay D60 D50 D30 D10 Cu Cc
BH-1 18.00 0 97 3 0 0.307 0.280 0.216 0.158 1.9 0.96
BH-1 20.00 0 98 2 0 0.298 0.270 0.214 0.158 1.9 0.97
Sample Details
Sample Description
Fine sand (SP)
IS : 2720 (Part 4) - 1985, RA-2010Grain Size Analysis
Test Results
Fine sand (SP)
Grain Size Distribution Curve
0
10
20
30
40
50
60
70
80
90
100
0.001 0.010 0.100 1.000 10.000Particle Size, mm
% Fin
er by
Weig
ht
Borehole No: 1 , Depth: 18 m
Borehole No: 1 , Depth: 20 m
GRAVELCOARSEFINE MEDIUM S A N DS I L TCLAY
Hydrometer Analysis Sieve Analysis
Extension of Barauni Super Critical Coal Fired Thermal Power Station at Barauni, Bihar.M/s. STEAG Energy Services (India) Pvt. Ltd.
Plate 124 of 154Project No. 215081-I

Borehole Number
Sample Depth, m
% Gravel
% Sand % Silt %
Clay D60 D50 D30 D10 Cu Cc
BH-2 0.00 0 36 51 12 0.065 0.034 0.011
BH-2 2.50 0 19 61 20 0.022 0.015 0.005
BH-2 4.50 0 80 16 4 0.188 0.160 0.102 0.017 11.1 3.26
BH-2 7.50 0 86 12 2 0.204 0.170 0.125
BH-2 10.80 0 95 5 0 0.228 0.200 0.170 0.101 2.3 1.25
Grain Size Distribution Curve
Fine sand (SP-SM)
Silty fine sand (SM)
Sandy silt (CL)
Silty fine sand (SM)
IS : 2720 (Part 4) - 1985, RA-2010Grain Size Analysis
Test ResultsSample Details
Sample Description
Sandy silt (CL)
0
10
20
30
40
50
60
70
80
90
100
0.001 0.010 0.100 1.000 10.000Particle Size, mm
% Fin
er by
Weig
ht
Borehole No: 2 , Depth: 0 mBorehole No: 2 , Depth: 2.5 mBorehole No: 2 , Depth: 4.5 mBorehole No: 2 , Depth: 7.5 mBorehole No: 2 , Depth: 10.8 m
GRAVELCOARSEFINE MEDIUM S A N DS I L TCLAY
Hydrometer Analysis Sieve Analysis
Extension of Barauni Super Critical Coal Fired Thermal Power Station at Barauni, Bihar.M/s. STEAG Energy Services (India) Pvt. Ltd.
Plate 125 of 154Project No. 215081-I

Borehole Number
Sample Depth, m
% Gravel
% Sand % Silt %
Clay D60 D50 D30 D10 Cu Cc
BH-2 12.00 0 96 4 0 0.235 0.220 0.182 0.129 1.8 1.09
BH-2 14.50 0 93 7 0 0.297 0.270 0.205 0.119 2.5 1.19
BH-2 16.50 0 98 2 0 0.246 0.220 0.186 0.138 1.8 1.02
BH-2 18.50 0 98 2 0 0.233 0.210 0.179 0.125 1.9 1.10
Sample Details
Sample Description
Fine sand (SP)
IS : 2720 (Part 4) - 1985, RA-2010Grain Size Analysis
Test Results
Fine sand (SP-SM)
Fine sand (SP)
Fine sand (SP)
Grain Size Distribution Curve
0
10
20
30
40
50
60
70
80
90
100
0.001 0.010 0.100 1.000 10.000Particle Size, mm
% Fin
er by
Weig
ht
Borehole No: 2 , Depth: 12 m
Borehole No: 2 , Depth: 14.5 m
Borehole No: 2 , Depth: 16.5 m
Borehole No: 2 , Depth: 18.5 m
GRAVELCOARSEFINE MEDIUM S A N DS I L TCLAY
Hydrometer Analysis Sieve Analysis
Extension of Barauni Super Critical Coal Fired Thermal Power Station at Barauni, Bihar.M/s. STEAG Energy Services (India) Pvt. Ltd.
Plate 126 of 154Project No. 215081-I

Borehole Number
Sample Depth, m
% Gravel
% Sand % Silt %
Clay D60 D50 D30 D10 Cu Cc
BH-3 0.00 0 25 58 17 0.038 0.022 0.008
BH-3 1.00 0 61 36 3 0.205 0.160 0.056 0.016 12.8 0.96
BH-3 2.00 0 84 16 0 0.136 0.120 0.095
BH-3 5.00 0 81 19 0 0.158 0.140 0.096
BH-3 6.00 0 60 35 5 0.205 0.160 0.020 0.004 51.3 0.49
Sample Details
Sample Description
Sandy silt (CL)
IS : 2720 (Part 4) - 1985, RA-2010Grain Size Analysis
Test Results
Silty fine sand (SM)
Silty fine sand (SM)
Silty fine sand (SM)
Silty fine sand (SM)
Grain Size Distribution Curve
0
10
20
30
40
50
60
70
80
90
100
0.001 0.010 0.100 1.000 10.000Particle Size, mm
% Fin
er by
Weig
ht
Borehole No: 3 , Depth: 0 mBorehole No: 3 , Depth: 1 mBorehole No: 3 , Depth: 2 mBorehole No: 3 , Depth: 5 mBorehole No: 3 , Depth: 6 m
GRAVELCOARSEFINE MEDIUM S A N DS I L TCLAY
Hydrometer Analysis Sieve Analysis
Extension of Barauni Super Critical Coal Fired Thermal Power Station at Barauni, Bihar.M/s. STEAG Energy Services (India) Pvt. Ltd.
Plate 127 of 154Project No. 215081-I

Borehole Number
Sample Depth, m
% Gravel
% Sand % Silt %
Clay D60 D50 D30 D10 Cu Cc
BH-3 8.00 0 40 50 10 0.076 0.055 0.023 0.002 38.0 3.48
BH-3 12.00 0 95 5 0 0.241 0.220 0.171 0.100 2.4 1.21
BH-3 14.00 0 82 18 0 0.182 0.150 0.103
BH-3 16.00 0 99 1 0 0.361 0.320 0.243 0.166 2.2 0.99
Sample Details
Sample Description
Sandy silt (CL)
IS : 2720 (Part 4) - 1985, RA-2010Grain Size Analysis
Test Results
Fine sand (SP-SM)
Silty fine sand (SM)
Fine sand (SP)
Grain Size Distribution Curve
0
10
20
30
40
50
60
70
80
90
100
0.001 0.010 0.100 1.000 10.000Particle Size, mm
% Fin
er by
Weig
ht
Borehole No: 3 , Depth: 8 m
Borehole No: 3 , Depth: 12 m
Borehole No: 3 , Depth: 14 m
Borehole No: 3 , Depth: 16 m
GRAVELCOARSEFINE MEDIUM S A N DS I L TCLAY
Hydrometer Analysis Sieve Analysis
Extension of Barauni Super Critical Coal Fired Thermal Power Station at Barauni, Bihar.M/s. STEAG Energy Services (India) Pvt. Ltd.
Plate 128 of 154Project No. 215081-I

Borehole Number
Sample Depth, m
% Gravel
% Sand % Silt %
Clay D60 D50 D30 D10 Cu Cc
BH-3 18.00 0 99 1 0 0.354 0.310 0.242 0.170 2.1 0.97
BH-3 20.00 0 99 1 0 0.386 0.340 0.257 0.180 2.1 0.95
Sample Details
Sample Description
Fine sand (SP)
IS : 2720 (Part 4) - 1985, RA-2010Grain Size Analysis
Test Results
Fine sand (SP)
Grain Size Distribution Curve
0
10
20
30
40
50
60
70
80
90
100
0.001 0.010 0.100 1.000 10.000Particle Size, mm
% Fin
er by
Weig
ht
Borehole No: 3 , Depth: 18 m
Borehole No: 3 , Depth: 20 m
GRAVELCOARSEFINE MEDIUM S A N DS I L TCLAY
Hydrometer Analysis Sieve Analysis
Extension of Barauni Super Critical Coal Fired Thermal Power Station at Barauni, Bihar.M/s. STEAG Energy Services (India) Pvt. Ltd.
Plate 129 of 154Project No. 215081-I

Borehole Number
Sample Depth, m
% Gravel
% Sand % Silt %
Clay D60 D50 D30 D10 Cu Cc
BH-4 2.50 0 56 40 4 0.102 0.085 0.050 0.016 6.4 1.53
BH-4 4.50 0 4 68 27 0.016 0.012 0.003
BH-4 6.50 3 55 37 5 0.198 0.150 0.053
BH-4 7.50 0 92 8 0 0.211 0.180 0.139 0.082 2.6 1.12
BH-4 8.50 0 89 11 0 0.240 0.210 0.179
Sample Details
Sample Description
Silty fine sand (SM)
IS : 2720 (Part 4) - 1985, RA-2010Grain Size Analysis
Test Results
Sandy silt (CL)
Silty fine sand (SM)
Fine sand (SP-SM)
Fine sand (SP-SM)
Grain Size Distribution Curve
0
10
20
30
40
50
60
70
80
90
100
0.001 0.010 0.100 1.000 10.000Particle Size, mm
% Fin
er by
Weig
ht
Borehole No: 4 , Depth: 2.5 mBorehole No: 4 , Depth: 4.5 mBorehole No: 4 , Depth: 6.5 mBorehole No: 4 , Depth: 7.5 mBorehole No: 4 , Depth: 8.5 m
GRAVELCOARSEFINE MEDIUM S A N DS I L TCLAY
Hydrometer Analysis Sieve Analysis
Extension of Barauni Super Critical Coal Fired Thermal Power Station at Barauni, Bihar.M/s. STEAG Energy Services (India) Pvt. Ltd.
Plate 130 of 154Project No. 215081-I
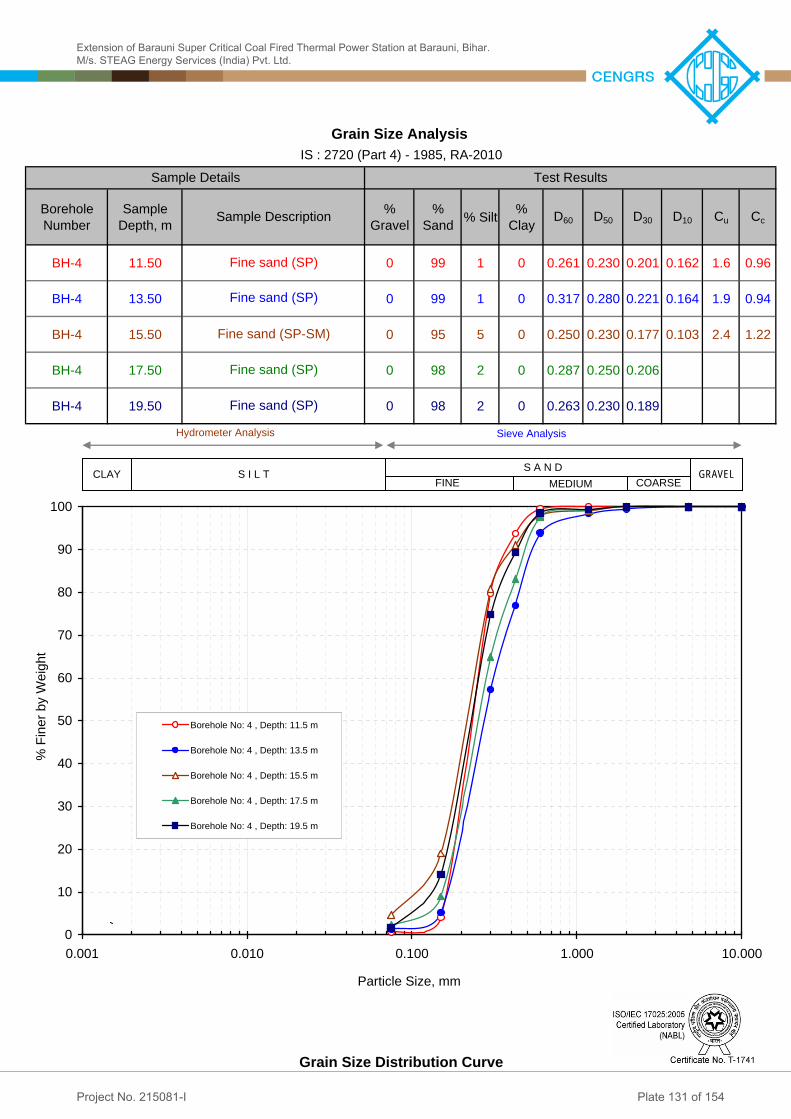
Borehole Number
Sample Depth, m
% Gravel
% Sand % Silt %
Clay D60 D50 D30 D10 Cu Cc
BH-4 11.50 0 99 1 0 0.261 0.230 0.201 0.162 1.6 0.96
BH-4 13.50 0 99 1 0 0.317 0.280 0.221 0.164 1.9 0.94
BH-4 15.50 0 95 5 0 0.250 0.230 0.177 0.103 2.4 1.22
BH-4 17.50 0 98 2 0 0.287 0.250 0.206
BH-4 19.50 0 98 2 0 0.263 0.230 0.189
Sample Details
Sample Description
Fine sand (SP)
IS : 2720 (Part 4) - 1985, RA-2010Grain Size Analysis
Test Results
Fine sand (SP)
Fine sand (SP-SM)
Fine sand (SP)
Fine sand (SP)
Grain Size Distribution Curve
0
10
20
30
40
50
60
70
80
90
100
0.001 0.010 0.100 1.000 10.000Particle Size, mm
% Fin
er by
Weig
ht
Borehole No: 4 , Depth: 11.5 m
Borehole No: 4 , Depth: 13.5 m
Borehole No: 4 , Depth: 15.5 m
Borehole No: 4 , Depth: 17.5 m
Borehole No: 4 , Depth: 19.5 m
GRAVELCOARSEFINE MEDIUM S A N DS I L TCLAY
Hydrometer Analysis Sieve Analysis
Extension of Barauni Super Critical Coal Fired Thermal Power Station at Barauni, Bihar.M/s. STEAG Energy Services (India) Pvt. Ltd.
Plate 131 of 154Project No. 215081-I
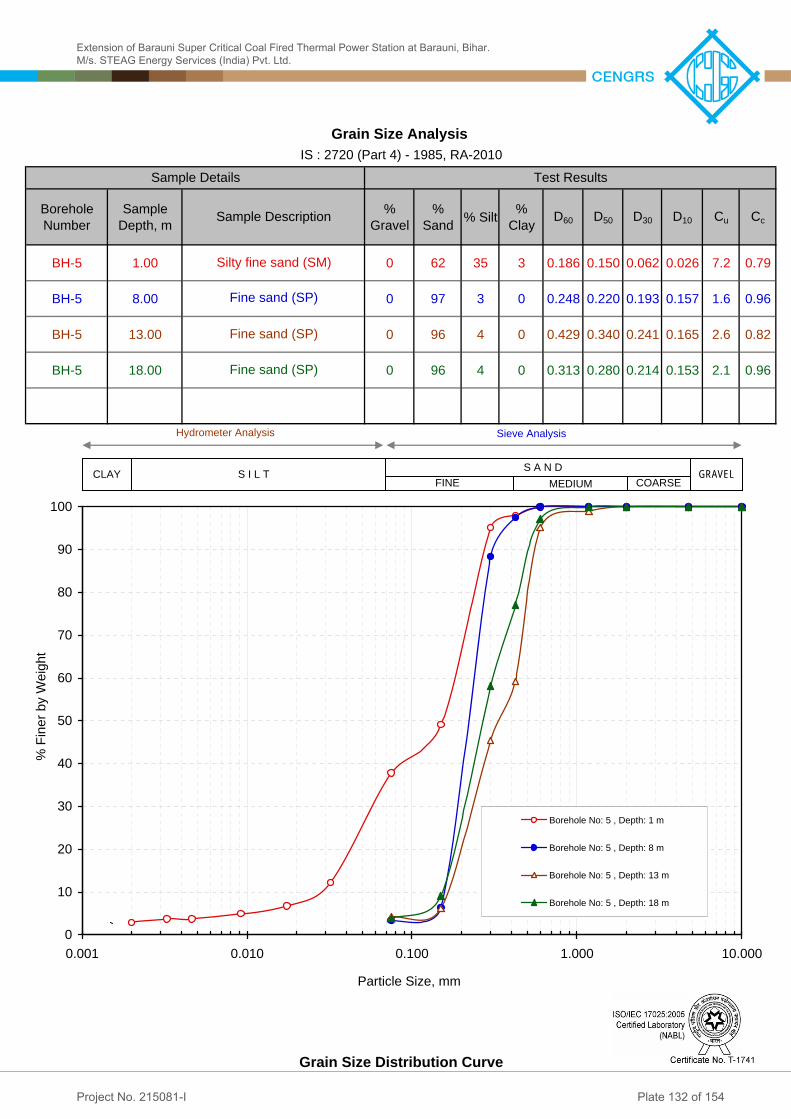
Borehole Number
Sample Depth, m
% Gravel
% Sand % Silt %
Clay D60 D50 D30 D10 Cu Cc
BH-5 1.00 0 62 35 3 0.186 0.150 0.062 0.026 7.2 0.79
BH-5 8.00 0 97 3 0 0.248 0.220 0.193 0.157 1.6 0.96
BH-5 13.00 0 96 4 0 0.429 0.340 0.241 0.165 2.6 0.82
BH-5 18.00 0 96 4 0 0.313 0.280 0.214 0.153 2.1 0.96
Grain Size Distribution Curve
Fine sand (SP)
Fine sand (SP)
Fine sand (SP)
IS : 2720 (Part 4) - 1985, RA-2010Grain Size Analysis
Test ResultsSample Details
Sample Description
Silty fine sand (SM)
0
10
20
30
40
50
60
70
80
90
100
0.001 0.010 0.100 1.000 10.000Particle Size, mm
% Fin
er by
Weig
ht
Borehole No: 5 , Depth: 1 m
Borehole No: 5 , Depth: 8 m
Borehole No: 5 , Depth: 13 m
Borehole No: 5 , Depth: 18 m
GRAVELCOARSEFINE MEDIUM S A N DS I L TCLAY
Hydrometer Analysis Sieve Analysis
Extension of Barauni Super Critical Coal Fired Thermal Power Station at Barauni, Bihar.M/s. STEAG Energy Services (India) Pvt. Ltd.
Plate 132 of 154Project No. 215081-I

Borehole Number
Sample Depth, m
% Gravel
% Sand % Silt %
Clay D60 D50 D30 D10 Cu Cc
BH-6 1.00 0 20 59 21 0.011 0.009 0.004
BH-6 4.00 0 64 31 5 0.218 0.170 0.025 0.004 54.5 0.72
BH-6 5.00 0 80 20 0 0.203 0.180
BH-6 11.00 0 97 3 0 0.247 0.220 0.188
Grain Size Distribution Curve
Fine sand (SP)
Silty fine sand (SM)
Silty fine sand (SM)
IS : 2720 (Part 4) - 1985, RA-2010Grain Size Analysis
Test ResultsSample Details
Sample Description
Clayey silt (CI)
0
10
20
30
40
50
60
70
80
90
100
0.001 0.010 0.100 1.000 10.000Particle Size, mm
% Fin
er by
Weig
ht
Borehole No: 6 , Depth: 1 m
Borehole No: 6 , Depth: 4 m
Borehole No: 6 , Depth: 5 m
Borehole No: 6 , Depth: 11 m
GRAVELCOARSEFINE MEDIUM S A N DS I L TCLAY
Hydrometer Analysis Sieve Analysis
Extension of Barauni Super Critical Coal Fired Thermal Power Station at Barauni, Bihar.M/s. STEAG Energy Services (India) Pvt. Ltd.
Plate 133 of 154Project No. 215081-I

Borehole Number
Sample Depth, m
% Gravel
% Sand % Silt %
Clay D60 D50 D30 D10 Cu Cc
BH-6 16.00 0 98 2 0 0.237 0.210 0.177 0.115 2.1 1.15
BH-6 19.00 0 98 2 0 0.251 0.230 0.191 0.151 1.7 0.96
Grain Size Distribution Curve
Fine sand (SP)
IS : 2720 (Part 4) - 1985, RA-2010Grain Size Analysis
Test ResultsSample Details
Sample Description
Fine sand (SP)
0
10
20
30
40
50
60
70
80
90
100
0.001 0.010 0.100 1.000 10.000Particle Size, mm
% Fin
er by
Weig
ht
Borehole No: 6 , Depth: 16 m
Borehole No: 6 , Depth: 19 m
GRAVELCOARSEFINE MEDIUM S A N DS I L TCLAY
Hydrometer Analysis Sieve Analysis
Extension of Barauni Super Critical Coal Fired Thermal Power Station at Barauni, Bihar.M/s. STEAG Energy Services (India) Pvt. Ltd.
Plate 134 of 154Project No. 215081-I

Borehole Number
Sample Depth, m
% Gravel
% Sand % Silt %
Clay D60 D50 D30 D10 Cu Cc
BH-7 2.50 0 51 45 4 0.113 0.075 0.049 0.014 8.1 1.52
BH-7 5.50 0 62 35 3 0.186 0.150 0.062 0.026 7.2 0.79
BH-7 6.50 0 64 34 2 0.203 0.185 0.065 0.030 6.8 0.69
BH-7 7.50 0 85 15 0 0.237 0.220 0.172
BH-7 10.50 0 89 11 0 0.241 0.222 0.176
Grain Size Distribution Curve
Fine sand (SP-SM)
Silty fine sand (SM)
Silty fine sand (SM)
Silty fine sand (SM)
IS : 2720 (Part 4) - 1985, RA-2010Grain Size Analysis
Test ResultsSample Details
Sample Description
Silty fine sand (SM)
0
10
20
30
40
50
60
70
80
90
100
0.001 0.010 0.100 1.000 10.000Particle Size, mm
% Fin
er by
Weig
ht
Borehole No: 7 , Depth: 2.5 mBorehole No: 7 , Depth: 5.5 mBorehole No: 7 , Depth: 6.5 mBorehole No: 7 , Depth: 7.5 mBorehole No: 7 , Depth: 10.5 m
GRAVELCOARSEFINE MEDIUM S A N DS I L TCLAY
Hydrometer Analysis Sieve Analysis
Extension of Barauni Super Critical Coal Fired Thermal Power Station at Barauni, Bihar.M/s. STEAG Energy Services (India) Pvt. Ltd.
Plate 135 of 154Project No. 215081-I

Borehole Number
Sample Depth, m
% Gravel
% Sand % Silt %
Clay D60 D50 D30 D10 Cu Cc
BH-7 12.00 0 65 33 2 0.190 0.160 0.064 0.024 7.9 0.90
BH-7 19.50 0 91 9 0 0.242 0.230 0.180
Grain Size Distribution Curve
Fine sand (SP-SM)
IS : 2720 (Part 4) - 1985, RA-2010Grain Size Analysis
Test ResultsSample Details
Sample Description
Silty fine sand (SM)
0
10
20
30
40
50
60
70
80
90
100
0.001 0.010 0.100 1.000 10.000Particle Size, mm
% Fin
er by
Weig
ht
Borehole No: 7 , Depth: 12 m
Borehole No: 7 , Depth: 19.5 m
GRAVELCOARSEFINE MEDIUM S A N DS I L TCLAY
Hydrometer Analysis Sieve Analysis
Extension of Barauni Super Critical Coal Fired Thermal Power Station at Barauni, Bihar.M/s. STEAG Energy Services (India) Pvt. Ltd.
Plate 136 of 154Project No. 215081-I

Borehole Number
Sample Depth, m
% Gravel
% Sand % Silt %
Clay D60 D50 D30 D10 Cu Cc
BH-8 1.00 0 40 55 5 0.076 0.055 0.031 0.008 9.5 1.58
BH-8 4.00 0 64 33 3 0.190 0.160 0.065 0.028 6.8 0.79
BH-8 5.00 0 81 19 0 0.221 0.190 0.159
BH-8 11.00 0 90 10 0 0.223 0.190 0.163 0.077 2.9 1.55
BH-8 18.00 0 79 21 0 0.157 0.140 0.093
Grain Size Distribution Curve
Silty fine sand (SM)
Fine sand (SP-SM)
Silty fine sand (SM)
Silty fine sand (SM)
IS : 2720 (Part 4) - 1985, RA-2010Grain Size Analysis
Test ResultsSample Details
Sample Description
Sandy silt (CL)
0
10
20
30
40
50
60
70
80
90
100
0.001 0.010 0.100 1.000 10.000Particle Size, mm
% Fin
er by
Weig
ht
Borehole No: 8 , Depth: 1 mBorehole No: 8 , Depth: 4 mBorehole No: 8 , Depth: 5 mBorehole No: 8 , Depth: 11 mBorehole No: 8 , Depth: 18 m
GRAVELCOARSEFINE MEDIUM S A N DS I L TCLAY
Hydrometer Analysis Sieve Analysis
Extension of Barauni Super Critical Coal Fired Thermal Power Station at Barauni, Bihar.M/s. STEAG Energy Services (India) Pvt. Ltd.
Plate 137 of 154Project No. 215081-I

0.00 kg/cm2
32.1 degrees
Mohr-Coulomb Failure Envelope
IS : 2720 (Part-13)-1986, RA-2010
Sample Description: Silty fine sandSample Depth: 3 m
Saturated
Angle of Internal Friction, :
Cohesion Intercept, c :
Sample No.: UDS1Borehole No.: BH-1
Type of Sample:
Samp
le De
tails
Drained Direct Shear Test
Moisture Content (%):Dry Density of Soil (g/cm3):
Test
Resu
lts
Remoulded1.57
y = 0.6272xR2 = 0.9893
0.0
0.5
1.0
1.5
2.0
2.5
0.0 0.5 1.0 1.5 2.0 2.5Normal Stress sff, kg/cm2
Shea
r Stre
ss t ff,
kg/cm
2
Extension of Barauni Super Critical Coal Fired Thermal Power Station at Barauni, Bihar.M/s. STEAG Energy Services (India) Pvt. Ltd.
Plate 138 of 154Project No. 215081-I

0.00 kg/cm2
32.3 degrees
Mohr-Coulomb Failure Envelope
IS : 2720 (Part-13)-1986, RA-2010
Sample Description: Silty fine sandSample Depth: 1.5 m
Saturated
Angle of Internal Friction, :
Cohesion Intercept, c :
Sample No.: UDS1Borehole No.: BH-2
Type of Sample:
Samp
le De
tails
Drained Direct Shear Test
Moisture Content (%):Dry Density of Soil (g/cm3):
Test
Resu
lts
Remoulded1.59
y = 0.6326xR2 = 0.9987
0.0
0.5
1.0
1.5
2.0
2.5
0.0 0.5 1.0 1.5 2.0 2.5Normal Stress sff, kg/cm2
Shea
r Stre
ss t ff,
kg/cm
2
Extension of Barauni Super Critical Coal Fired Thermal Power Station at Barauni, Bihar.M/s. STEAG Energy Services (India) Pvt. Ltd.
Plate 139 of 154Project No. 215081-I

0.00 kg/cm2
30.2 degrees
Mohr-Coulomb Failure Envelope
IS : 2720 (Part-13)-1986, RA-2010
Sample Description: Silty fine sandSample Depth: 4.5 m
Saturated
Angle of Internal Friction, :
Cohesion Intercept, c :
Sample No.: UDS2Borehole No.: BH-2
Type of Sample:
Samp
le De
tails
Drained Direct Shear Test
Moisture Content (%):Dry Density of Soil (g/cm3):
Test
Resu
lts
Remoulded1.57
y = 0.5831xR2 = 0.9996
0.0
0.5
1.0
1.5
2.0
2.5
0.0 0.5 1.0 1.5 2.0 2.5Normal Stress sff, kg/cm2
Shea
r Stre
ss t ff,
kg/cm
2
Extension of Barauni Super Critical Coal Fired Thermal Power Station at Barauni, Bihar.M/s. STEAG Energy Services (India) Pvt. Ltd.
Plate 140 of 154Project No. 215081-I

0.00 kg/cm2
36.2 degrees
Mohr-Coulomb Failure Envelope
IS : 2720 (Part-13)-1986, RA-2010
Sample Description: Silty fine sandSample Depth: 7.5 m
Saturated
Angle of Internal Friction, :
Cohesion Intercept, c :
Sample No.: UDS3Borehole No.: BH-2
Type of Sample:
Samp
le De
tails
Drained Direct Shear Test
Moisture Content (%):Dry Density of Soil (g/cm3):
Test
Resu
lts
Remoulded1.60
y = 0.7323xR2 = 0.9988
0.0
0.5
1.0
1.5
2.0
2.5
0.0 0.5 1.0 1.5 2.0 2.5Normal Stress sff, kg/cm2
Shea
r Stre
ss t ff,
kg/cm
2
Extension of Barauni Super Critical Coal Fired Thermal Power Station at Barauni, Bihar.M/s. STEAG Energy Services (India) Pvt. Ltd.
Plate 141 of 154Project No. 215081-I

0.00 kg/cm2
32.3 degrees
Mohr-Coulomb Failure Envelope
IS : 2720 (Part-13)-1986, RA-2010
Sample Description: Silty fine sandSample Depth: 6 m
Saturated
Angle of Internal Friction, :
Cohesion Intercept, c :
Sample No.: UDS1Borehole No.: BH-3
Type of Sample:
Samp
le De
tails
Drained Direct Shear Test
Moisture Content (%):Dry Density of Soil (g/cm3):
Test
Resu
lts
Remoulded1.58
y = 0.6325xR2 = 0.9908
0.0
0.5
1.0
1.5
2.0
2.5
0.0 0.5 1.0 1.5 2.0 2.5Normal Stress sff, kg/cm2
Shea
r Stre
ss t ff,
kg/cm
2
Extension of Barauni Super Critical Coal Fired Thermal Power Station at Barauni, Bihar.M/s. STEAG Energy Services (India) Pvt. Ltd.
Plate 142 of 154Project No. 215081-I

0.00 kg/cm2
32.4 degrees
Mohr-Coulomb Failure Envelope
IS : 2720 (Part-13)-1986, RA-2010
Sample Description: Fine sandSample Depth: 9 m
Saturated
Angle of Internal Friction, :
Cohesion Intercept, c :
Sample No.: UDS2Borehole No.: BH-3
Type of Sample:
Samp
le De
tails
Drained Direct Shear Test
Moisture Content (%):Dry Density of Soil (g/cm3):
Test
Resu
lts
Remoulded1.58
y = 0.6347xR2 = 0.9945
0.0
0.5
1.0
1.5
2.0
2.5
0.0 0.5 1.0 1.5 2.0 2.5Normal Stress sff, kg/cm2
Shea
r Stre
ss t ff,
kg/cm
2
Extension of Barauni Super Critical Coal Fired Thermal Power Station at Barauni, Bihar.M/s. STEAG Energy Services (India) Pvt. Ltd.
Plate 143 of 154Project No. 215081-I
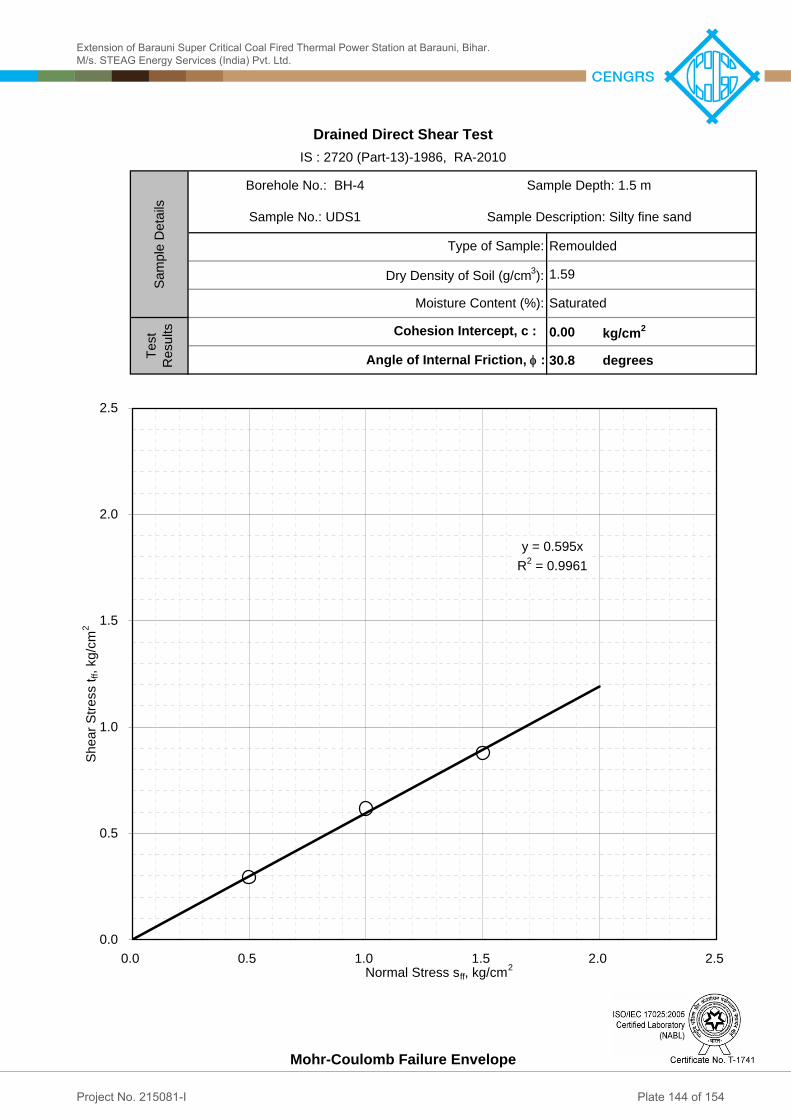
0.00 kg/cm2
30.8 degrees
Mohr-Coulomb Failure Envelope
IS : 2720 (Part-13)-1986, RA-2010
Sample Description: Silty fine sandSample Depth: 1.5 m
Saturated
Angle of Internal Friction, :
Cohesion Intercept, c :
Sample No.: UDS1Borehole No.: BH-4
Type of Sample:
Samp
le De
tails
Drained Direct Shear Test
Moisture Content (%):Dry Density of Soil (g/cm3):
Test
Resu
lts
Remoulded1.59
y = 0.595xR2 = 0.9961
0.0
0.5
1.0
1.5
2.0
2.5
0.0 0.5 1.0 1.5 2.0 2.5Normal Stress sff, kg/cm2
Shea
r Stre
ss t ff,
kg/cm
2
Extension of Barauni Super Critical Coal Fired Thermal Power Station at Barauni, Bihar.M/s. STEAG Energy Services (India) Pvt. Ltd.
Plate 144 of 154Project No. 215081-I

0.00 kg/cm2
35.1 degrees
Mohr-Coulomb Failure Envelope
IS : 2720 (Part-13)-1986, RA-2010
Sample Description: Fine sandSample Depth: 7.5 m
Saturated
Angle of Internal Friction, :
Cohesion Intercept, c :
Sample No.: UDS3Borehole No.: BH-4
Type of Sample:
Samp
le De
tails
Drained Direct Shear Test
Moisture Content (%):Dry Density of Soil (g/cm3):
Test
Resu
lts
Remoulded1.62
y = 0.7025xR2 = 0.9959
0.0
0.5
1.0
1.5
2.0
2.5
0.0 0.5 1.0 1.5 2.0 2.5Normal Stress sff, kg/cm2
Shea
r Stre
ss t ff,
kg/cm
2
Extension of Barauni Super Critical Coal Fired Thermal Power Station at Barauni, Bihar.M/s. STEAG Energy Services (India) Pvt. Ltd.
Plate 145 of 154Project No. 215081-I

0.00 kg/cm2
29.8 degrees
Mohr-Coulomb Failure Envelope
IS : 2720 (Part-13)-1986, RA-2010
Sample Description: Silty fine sandSample Depth: 3 m
Saturated
Angle of Internal Friction, :
Cohesion Intercept, c :
Sample No.: UDS1Borehole No.: BH-5
Type of Sample:
Samp
le De
tails
Drained Direct Shear Test
Moisture Content (%):Dry Density of Soil (g/cm3):
Test
Resu
lts
Remoulded1.55
y = 0.5729xR2 = 0.9804
0.0
0.5
1.0
1.5
2.0
0.0 0.5 1.0 1.5 2.0 2.5Normal Stress sff, kg/cm2
Shea
r Stre
ss t ff,
kg/cm
2
Extension of Barauni Super Critical Coal Fired Thermal Power Station at Barauni, Bihar.M/s. STEAG Energy Services (India) Pvt. Ltd.
Plate 146 of 154Project No. 215081-I

0.00 kg/cm2
31.1 degrees
Mohr-Coulomb Failure Envelope
IS : 2720 (Part-13)-1986, RA-2010
Sample Description: Fine sandSample Depth: 9 m
Saturated
Angle of Internal Friction, :
Cohesion Intercept, c :
Sample No.: UDS-3Borehole No.: BH-5
Type of Sample:
Samp
le De
tails
Drained Direct Shear Test
Moisture Content (%):Dry Density of Soil (g/cm3):
Test
Resu
lts
Remoulded1.62
y = 0.6023xR2 = 0.9955
0.0
0.5
1.0
1.5
2.0
2.5
0.0 0.5 1.0 1.5 2.0 2.5Normal Stress sff, kg/cm2
Shea
r Stre
ss t ff,
kg/cm
2
Extension of Barauni Super Critical Coal Fired Thermal Power Station at Barauni, Bihar.M/s. STEAG Energy Services (India) Pvt. Ltd.
Plate 147 of 154Project No. 215081-I

0.00 kg/cm2
30.8 degrees
Mohr-Coulomb Failure Envelope
IS : 2720 (Part-13)-1986, RA-2010
Sample Description: Silty fine sandSample Depth: 3 m
Saturated
Angle of Internal Friction, :
Cohesion Intercept, c :
Sample No.: UDS1Borehole No.: BH-6
Type of Sample:
Samp
le De
tails
Drained Direct Shear Test
Moisture Content (%):Dry Density of Soil (g/cm3):
Test
Resu
lts
Remoulded1.58
y = 0.5959xR2 = 0.9996
0.0
0.5
1.0
1.5
2.0
2.5
0.0 0.5 1.0 1.5 2.0 2.5Normal Stress sff, kg/cm2
Shea
r Stre
ss t ff,
kg/cm
2
Extension of Barauni Super Critical Coal Fired Thermal Power Station at Barauni, Bihar.M/s. STEAG Energy Services (India) Pvt. Ltd.
Plate 148 of 154Project No. 215081-I

0.00 kg/cm2
32.6 degrees
Mohr-Coulomb Failure Envelope
IS : 2720 (Part-13)-1986, RA-2010
Sample Description: Silty fine sandSample Depth: 6 m
Saturated
Angle of Internal Friction, :
Cohesion Intercept, c :
Sample No.: UDS-2Borehole No.: BH-6
Type of Sample:
Samp
le De
tails
Drained Direct Shear Test
Moisture Content (%):Dry Density of Soil (g/cm3):
Test
Resu
lts
Remoulded1.59
y = 0.64xR2 = 0.9959
0.0
0.5
1.0
1.5
2.0
2.5
0.0 0.5 1.0 1.5 2.0 2.5Normal Stress sff, kg/cm2
Shea
r Stre
ss t ff,
kg/cm
2
Extension of Barauni Super Critical Coal Fired Thermal Power Station at Barauni, Bihar.M/s. STEAG Energy Services (India) Pvt. Ltd.
Plate 149 of 154Project No. 215081-I

0.00 kg/cm2
28.3 degrees
Mohr-Coulomb Failure Envelope
IS : 2720 (Part-13)-1986, RA-2010
Sample Description: Silty fine sandSample Depth: 1.5 m
Saturated
Angle of Internal Friction, :
Cohesion Intercept, c :
Sample No.: UDS-1Borehole No.: BH-7
Type of Sample:
Samp
le De
tails
Drained Direct Shear Test
Moisture Content (%):Dry Density of Soil (g/cm3):
Test
Resu
lts
Remoulded1.55
y = 0.5391xR2 = 0.9997
0.0
0.5
1.0
1.5
2.0
2.5
0.0 0.5 1.0 1.5 2.0 2.5Normal Stress sff, kg/cm2
Shea
r Stre
ss t ff,
kg/cm
2
Extension of Barauni Super Critical Coal Fired Thermal Power Station at Barauni, Bihar.M/s. STEAG Energy Services (India) Pvt. Ltd.
Plate 150 of 154Project No. 215081-I

0.00 kg/cm2
31.5 degrees
Mohr-Coulomb Failure Envelope
IS : 2720 (Part-13)-1986, RA-2010
Sample Description: Silty fine sandSample Depth: 7.5 m
Saturated
Angle of Internal Friction, :
Cohesion Intercept, c :
Sample No.: UDS-3Borehole No.: BH-7
Type of Sample:
Samp
le De
tails
Drained Direct Shear Test
Moisture Content (%):Dry Density of Soil (g/cm3):
Test
Resu
lts
Remoulded1.60
y = 0.6135xR2 = 0.9885
0.0
0.5
1.0
1.5
2.0
2.5
0.0 0.5 1.0 1.5 2.0 2.5Normal Stress sff, kg/cm2
Shea
r Stre
ss t ff,
kg/cm
2
Extension of Barauni Super Critical Coal Fired Thermal Power Station at Barauni, Bihar.M/s. STEAG Energy Services (India) Pvt. Ltd.
Plate 151 of 154Project No. 215081-I

0.00 kg/cm2
28.3 degrees
Mohr-Coulomb Failure Envelope
IS : 2720 (Part-13)-1986, RA-2010
Sample Description: Silty fine sandSample Depth: 3 m
Saturated
Angle of Internal Friction, :
Cohesion Intercept, c :
Sample No.: UDS-2Borehole No.: BH-8
Type of Sample:
Samp
le De
tails
Drained Direct Shear Test
Moisture Content (%):Dry Density of Soil (g/cm3):
Test
Resu
lts
Remoulded1.56
y = 0.5374xR2 = 0.997
0.0
0.5
1.0
1.5
2.0
2.5
0.0 0.5 1.0 1.5 2.0 2.5Normal Stress sff, kg/cm2
Shea
r Stre
ss t ff,
kg/cm
2
Extension of Barauni Super Critical Coal Fired Thermal Power Station at Barauni, Bihar.M/s. STEAG Energy Services (India) Pvt. Ltd.
Plate 152 of 154Project No. 215081-I

0.00 kg/cm2
33.7 degrees
Mohr-Coulomb Failure Envelope
IS : 2720 (Part-13)-1986, RA-2010
Sample Description: Silty fine sandSample Depth: 6 m
Saturated
Angle of Internal Friction, :
Cohesion Intercept, c :
Sample No.: UDS-3Borehole No.: BH-8
Type of Sample:
Samp
le De
tails
Drained Direct Shear Test
Moisture Content (%):Dry Density of Soil (g/cm3):
Test
Resu
lts
Remoulded1.61
y = 0.6664xR2 = 0.9956
0.0
0.5
1.0
1.5
2.0
2.5
0.0 0.5 1.0 1.5 2.0 2.5Normal Stress sff, kg/cm2
Shea
r Stre
ss t ff,
kg/cm
2
Extension of Barauni Super Critical Coal Fired Thermal Power Station at Barauni, Bihar.M/s. STEAG Energy Services (India) Pvt. Ltd.
Plate 153 of 154Project No. 215081-I
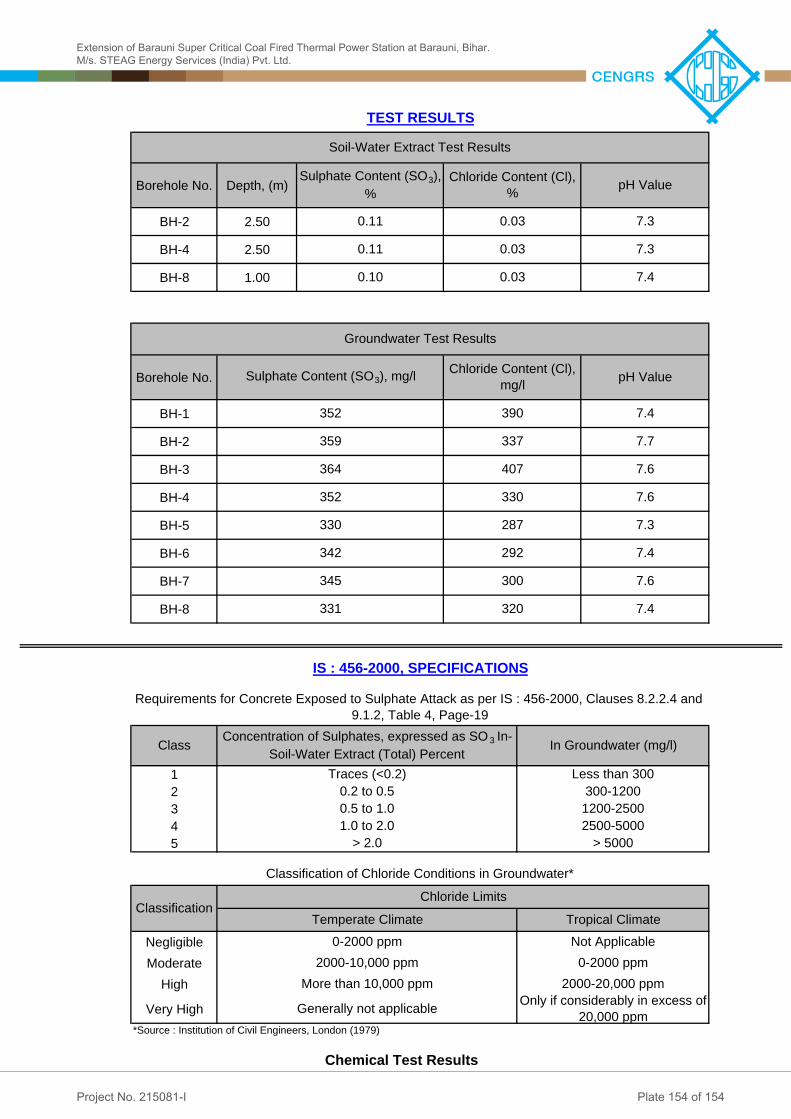
Borehole No. Depth, (m)
BH-2 2.50BH-4 2.50BH-8 1.00
Borehole No.
BH-1BH-2BH-3BH-4BH-5BH-6BH-7BH-8
12345
NegligibleModerate
HighVery High
7.6330 287 7.3
Chloride Content (Cl), mg/l390 7.4
342 292 7.4
407 7.6352 330
pH Value
7.3
> 2.0
Sulphate Content (SO3), %
Chloride Content (Cl), %
0.11 0.030.030.11 7.3
In Groundwater (mg/l)
331 320 7.4
Soil-Water Extract Test Results
*Source : Institution of Civil Engineers, London (1979)
Not Applicable
0.2 to 0.5
0-2000 ppm
364
0-2000 ppm
0.5 to 1.0
Generally not applicableMore than 10,000 ppm
2000-10,000 ppm
Tropical Climate
> 5000
Temperate ClimateChloride Limits
Requirements for Concrete Exposed to Sulphate Attack as per IS : 456-2000, Clauses 8.2.2.4 and 9.1.2, Table 4, Page-19
Concentration of Sulphates, expressed as SO 3 In-Soil-Water Extract (Total) Percent
Traces (<0.2)Class
Only if considerably in excess of 20,000 ppm
Classification
359
2000-20,000 ppm
300-1200Less than 300
Classification of Chloride Conditions in Groundwater*
1.0 to 2.01200-25002500-5000
345 300 7.6
Groundwater Test Results
Sulphate Content (SO3), mg/l
352
pH Value
TEST RESULTS
IS : 456-2000, SPECIFICATIONS
Chemical Test Results
337 7.7
0.10 0.03 7.4
Extension of Barauni Super Critical Coal Fired Thermal Power Station at Barauni, Bihar.M/s. STEAG Energy Services (India) Pvt. Ltd.
Plate 154 of 154Project No. 215081-I

APPENDIX-A
TYPICAL CALCULATIONS
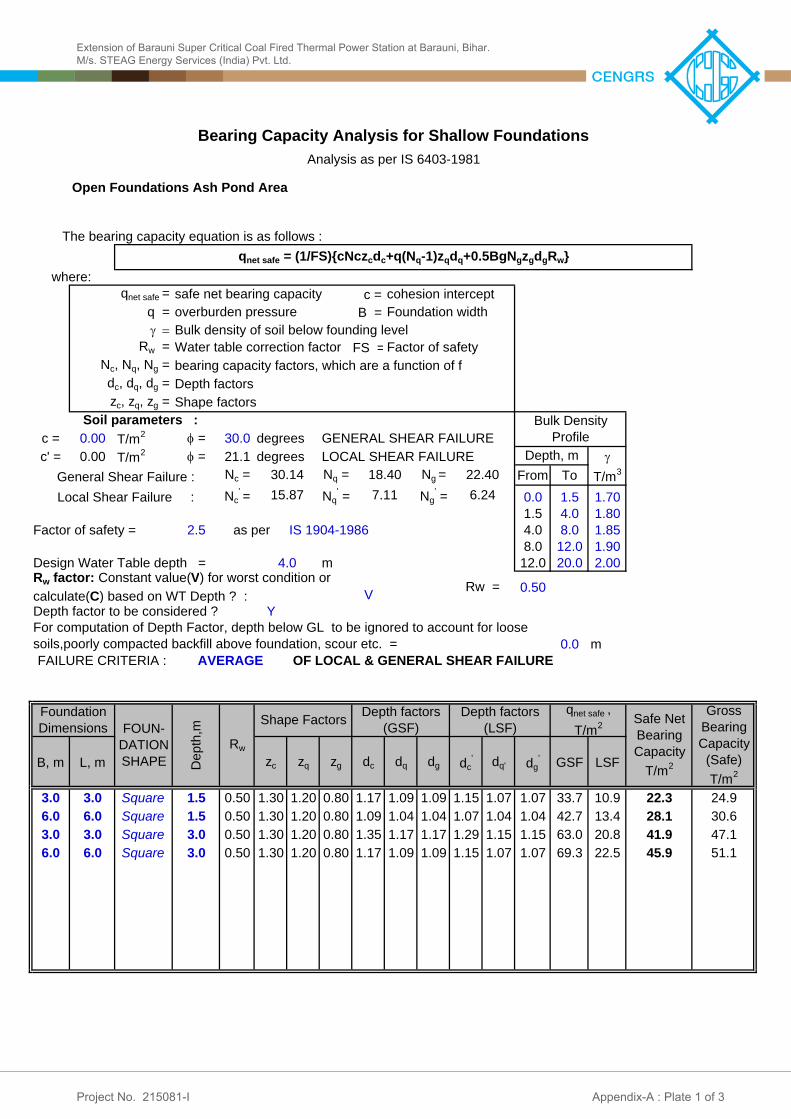
c =B =
FS =
c = 0.00 T/m2 = 30.0c' = 0.00 T/m2 = 21.1
Nc = Nq = Ng = From To T/m3
Nc' = Nq
' = Ng' = 0.0 1.5 1.70
1.5 4.0 1.802.5 4.0 8.0 1.85
8.0 12.0 1.9012.0 20.0 2.00
V 0.50Y
0.0
B, m L, m zc zq zg dc dq dg dc' dq' dg
' GSF LSF
3.0 3.0 Square 1.5 0.50 1.30 1.20 0.80 1.17 1.09 1.09 1.15 1.07 1.07 33.7 10.96.0 6.0 Square 1.5 0.50 1.30 1.20 0.80 1.09 1.04 1.04 1.07 1.04 1.04 42.7 13.43.0 3.0 Square 3.0 0.50 1.30 1.20 0.80 1.35 1.17 1.17 1.29 1.15 1.15 63.0 20.86.0 6.0 Square 3.0 0.50 1.30 1.20 0.80 1.17 1.09 1.09 1.15 1.07 1.07 69.3 22.5
Bulk density of soil below founding level
safe net bearing capacity
GENERAL SHEAR FAILURE
Water table correction factor
Soil parameters :Shape factors
Nc, Nq, Ng =
qnet safe =overburden pressure
cohesion interceptFoundation width
Bearing Capacity Analysis for Shallow FoundationsAnalysis as per IS 6403-1981
Factor of safety
degrees
Open Foundations Ash Pond Area
q =
The bearing capacity equation is as follows :
where:
zc, zq, zg =
Rw =
30.14General Shear Failure :degrees
22.4018.40
AVERAGE
41.9
28.1
Safe Net Bearing Capacity
T/m2
Shape Factors Depth factors
(GSF)FOUN-DATION SHAPE
qnet safe , T/m2
Depth factors (LSF)
15.87
For computation of Depth Factor, depth below GL to be ignored to account for loose soils,poorly compacted backfill above foundation, scour etc. =
6.24Local Shear Failure :
Rw factor: Constant value(V) for worst condition or calculate(C) based on WT Depth ? :Depth factor to be considered ?
Factor of safety =
Rw =
4.0
Foundation Dimensions
22.3
Rw
45.9
OF LOCAL & GENERAL SHEAR FAILURE
as per IS 1904-1986
m
Design Water Table depth =
51.1
dc, dq, dg = bearing capacity factors, which are a function of fDepth factors
Depth, mLOCAL SHEAR FAILURE
Bulk Density Profile
47.1
Depth
,m
qnet safe = (1/FS){cNczcdc+q(Nq-1)zqdq+0.5BgNgzgdgRw}
Gross Bearing Capacity
(Safe) T/m2
24.930.6
m
7.11
FAILURE CRITERIA :
Appendix-A : Plate 1 of 3Project No. 215081-I
Extension of Barauni Super Critical Coal Fired Thermal Power Station at Barauni, Bihar. M/s. STEAG Energy Services (India) Pvt. Ltd.

V 0.5Y
0.0
Foun
datio
n Wi
dth,m
Foun
datio
n Le
ngth,
m
Foun
datio
n De
pth,m
Shape
Desig
n N-V
alue
Desig
n Net
Beari
ng
Pres
sure,
T/m2 Settlemen
t @ 1kg/cm2
(as read off from graph),
Rw
Fox's
Dep
th Fa
ctor, d
f
Rigidi
ty Fa
ctor,
d r
Comp
uted
Settle
ment,
mm
3.0 3.0 1.5 Square 18.0 9.0 15.9 0.50 0.85 1.0 24.36.0 6.0 1.5 Square 18.0 9.0 17.5 0.50 0.94 0.8 23.63.0 3.0 3.0 Square 22.0 13.0 12.6 0.50 0.73 1.0 23.86.0 6.0 3.0 Square 22.0 13.0 13.8 0.50 0.85 0.8 24.4
mDepth to be ignored in Depth Factor Computation for loose soils, poorly compacted backfill, scour, etc.
R w factor : Calculate (C) based on water table depth or Fixed Value(V) for worst condition :
4.0
Rw factor for design :
Design Water Table Depth :
Fox's Depth Factor to be considered ?
m
Settlement Analysis for Shallow Foundation Based on N- ValuesAnalysis as per IS:8009 (Part 1)-1976, Clause 9.1.4
Open Foundations Ash Pond Area
Appendix-A : Plate 2 of 3Project No. 215081-I
Extension of Barauni Super Critical Coal Fired Thermal Power Station at Barauni, Bihar. M/s. STEAG Energy Services (India) Pvt. Ltd.

where B = B' = B/2 L' = L/2 =q = E =df = dr =I =
0.30 N
From To1 0.0 1.52 1.5 4.03 4.0 8.04 8.0 12.05 12.0 20.0
Y
0.0 m
3.0 3.0 1.5 9.0 1.00 0.85 1.00 10.00 0.507 1753 12.16.0 6.0 1.5 9.0 0.80 0.94 1.00 10.00 0.507 1951 19.13.0 3.0 3.0 13.0 1.00 0.73 1.00 10.00 0.507 1933 13.56.0 6.0 3.0 13.0 0.80 0.85 1.00 10.00 0.507 2035 24.0
Silty fine sand
Poisson's Ratio
Influence factor at corner of rectangular loaded area(B' x L'),
Silty fine sand
Rigidity factor
1200
Settlement at centre of footing of size B x L = 4 x Settlement at corner of area B' x L'
Modulus of Elasticity
Analysis as per IS : 8009 Part 1 - 1976, Clause 9.2
No consolidation settlement - analysis valid for granular soils,weathered rocks, hard clays & cohesive soils above water table
ELASTIC / IMMEDIATE SETTLEMENT
Open Foundations Ash Pond Area
Silty fine sand
q B' (1 - 2) I
Poisson's Ratio :
Layer No.
Depth,m
E
computed from theory of elasticity using Steinbrenner's factors
df dr
Foundation Analysis & Design by J.E.Bowles
Applied Bearing Pressure
Sandy siltSoil Classification Modulus of
Elasticity,T/m2
650
Foundation width
Fox's Depth factor
Settlement Analysis for Shallow FoundationsElastic Settlement Computed From Theory of Elasticity
N = H/B' Influence Factor
Applied Bearing Press. T/m2
Rigidity Factor, dr
Fox's Depth Factor
Depth to be ignored in Depth Factor Computation for loose soils, poorly compacted backfill, scour etc. =
Embed-ment
Depth (D), m
M = L'/B'
Fox's Depth Factor to be considered ?
Founda-tion Width
(B), m
Founda-tion
Length (L), m
Elastic Settle-
ment mm
E(weigh-ted ave.)
T/m2
2800
1000Silty fine sand
Total settlement computed as equal to elastic/immediate settlement.
fifth edition (1996)
Si =
Reference :
Is Rigid Layer met ?
1600
Appendix-A : Plate 3 of 3Project No. 215081-I
Extension of Barauni Super Critical Coal Fired Thermal Power Station at Barauni, Bihar. M/s. STEAG Energy Services (India) Pvt. Ltd.

GEOTECHNICAL INVESTIGATION REPORT (VOLUME-2)
FOR
POWER HOUSE AREA
RELATED TO
THE PREPARATORY SURVEY FOR
CONSTRUCTION OF
BARAUNI SUPER CRITICAL COAL FIRED
THERMAL POWER STATION
(UNIT#10)
OF
BIHAR STATE POWER GENERATION COMPANY LTD.
CONSULTANT
STEAG Energy Services India Pvt. Ltd. (Formerly Evonik Energy Services India Ltd.)
(A wholly owned subsidiary of Steag Energy Services GmbH, Germany) A-29, Sector-16, NOIDA-201301, India

Page 2 of 20
TABLE OF CONTENTS
Sheet No.
1.0 INTRODUCTION 3 1.1 Project Description 3 1.2 Purposes of Study 4 1.3 Report Format 4 1.4 Scope of Geotechnical Investigations covered in this Report (Powerhouse Area) 5
2.0 FIELD INVESTIGATIONS 5 2.1 Soil Boring 5 2.2 Groundwater 6
3.0 LABORATORY TESTS 6 4.0 GENERAL SITE CONDITIONS 6
4.1 Site Details 6 4.2 Regional Geology 7 4.3 Site Stratigraphy 7 4.4 Groundwater 8
5.0 LIQUEFACTION SUSCEPTIBILITY ASSESSMENT 8 5.1 Detailed Liquefaction Analysis as per NCEER Approach 8 5.1.1 Introduction 8 5.1.2 Calculation of Cyclic Stress Ratio (CSR) 8 5.1.3 Calculation of Cyclic Resistance Ratio (CRR) based on SPT Values 9 5.2 Results of Detailed Liquefaction Studies 10
6.0 CONCEPT OF FOUNDATION ANALYSIS 10 6.1 Open Foundation 10 6.2 Definition of Gross and Net Bearing Pressure 11 6.3 RCC Bored Cast in-situ Piles 12
7.0 FOUNDATION ANALYSIS AND RECOMMENDATIONS 13 7.1 General 13 7.2 Foundation Type and Depth 13 7.3 Design Parameters 14 7.4 Recommended Net Allowable Bearing Pressures 14 7.5 Pile Foundations 15 7.6 Ground Improvement by Excavation and Replacement 16 7.7 Ground Improvement by Rammed Stone Columns 17 7.8 Definition of Gross and Net Bearing Pressure 18
8.0 FOUNDATION CONSTRUCTION CONSIDERATION 18 8.1 Excavation 18 8.2 Foundation Level Preparation 18 8.3 Pile Construction 18 8.4 Pile Testing Program 19 8.5 Chemical Attack 19
9.0 RECOMMENDATIONS FOR FURTHER INVESTIGATION 20 10.0 VARIABILITY IN SUB-SURFACE CONDITIONS 20

Page 3 of 20
LIST OF ILLUSTRATIONS
Caption Plate Layout Plan 1 Satellite Image of Site and Test Locations 2 Engineering Description of Soils 3 Uncertainty in Laboratory Measurements 4 Soil Profiles 5 to 28 Summary of Borehole Profiles 29 Standard Penetration Test Results 30 & 31 Grain Size Analysis 32 to 55 Shear Test Results 56 to 67 Chemical Test Results 68
Appendix A: Liquefaction Susceptibility Assessment Appendix B: Typical Calculations Appendix C: Site Photographs
-------------------------------------------------------
DEFINITION OF ACRONYMS USL United Spirit Limited UTM Universal Transverse Mercator coordinates system NABL National Accreditation Board for Testing and Calibration Laboratories ISO International Standards Organization BIS Bureau of Indian Standards EGL Existing Ground Level NGL Natural Ground Level RL Reduced Level SPT Standard Penetration Test NCEER National Center for Earthquake Engineering Research UUT Unconsolidated undrained triaxial shear test DS Consolidated drained direct shear test BIS REFERENCES
Compendium of Indian Standard on Soil Engineering (Part-2, Field Testing of Soils for Civil Engineering Purposes), SP36 (Part-2:1988)-RA 2006
Compendium of Indian Standard on Soil Engineering (Part-1, Laboratory Testing of Soils for Civil
Engineering Purposes), SP36 (Part-1:1987)-RA 2006 1.0 INTRODUCTION
1.1 Project Description
Page 4 of 20
Japan International Cooperation Agency (JICA) has appointed Kyushu Electric Power Co. Inc. as a consultant, to conduct the preparatory survey for construction of the Barauni Super Critical Coal Fired Thermal Power Station. Kyushu Electric Power Co. Inc. has appointed M/s. STEAG Energy Services (India) Pvt. Ltd for the preparatory survey work for the project.
This report volume (Volume-II) presents field and laboratory test results along with our
geotechnical recommendations for the Power House area. An accompanying volume (Volume-I) presents results of the geotechnical investigation for the Ash Pond area. Volume-III presents all data and recommendations for the Raw Water Intake area.
1.2 Purposes of Study
The overall purposes of this study are to investigate the stratigraphy at the site, and to develop preliminary geotechnical recommendations for design and construction of foundations for the Ash Pond, Powerhouse and Raw Water Intake Areas.
To accomplish these purposes, the study was conducted in the following phases: (i) drilling 8 boreholes to 20m depth in the Ash Pond area, in order to evaluate the stratigraphy,
and to collect soil and groundwater samples for laboratory testing; (ii) performing seventy three (73) field permeability tests in the Ash Pond area at eight (8) borehole
locations to assess the in-situ coefficient of permeability of the strata; (iii) drilling 6 boreholes to 40 m depth in the Power House area in order to evaluate the
stratigraphy, and to collect soil and groundwater samples for laboratory testing;
(iv) drilling 3 boreholes to 20m depth at the Raw Water Intake location in order to evaluate the stratigraphy, and to collect soil and groundwater samples for laboratory testing;
(v) testing selected soil and groundwater samples in the laboratory to determine pertinent index and
engineering properties; and
(vi) analyzing all field and laboratory data to develop geotechnical recommendations for foundations.
The scope of work presented in this report volume (Volume-II) consists of 6 boreholes to 40m
depth for the power plant facilities. The boreholes have been done at widely spaced locations for DPR purpose. The data and
recommendations in this report in this report may please be taken as preliminary for initial planning purpose only. A detailed investigation should be performed at site for all the facilities of the power plant to develop final geotechnical recommendations.
1.3 Report Format
This report is presented in three volumes. The scope of work included in each volume is as
described below:
Report Volume Proposed Structures Scope of Work
Volume-I Ash Pond Eight (8) Boreholes Seventy three (73) field permeability tests
Volume-II Powerhouse Six (6) Boreholes Volume-III Raw Water Intake Three (3) Boreholes

Page 5 of 20
This volume, designated as Volume-II, includes field and laboratory data together with our engineering recommendations for the proposed Powerhouse area.
The initial sections of this volume of the report present brief descriptions of the field procedures
together with a list of various laboratory tests conducted. General site conditions, including geology and stratigraphy along the cross bridge alignment, are then presented. This is followed by our foundation analysis and recommendations.
Plates of soil profiles and various laboratory tests follow the report text. The illustrations section
includes a site plan, graphical plots of various field and laboratory test results, summary of borehole profiles, sectional profiles and other related sketches.
1.4 Scope of Geotechnical Investigations covered in this Report (Powerhouse Area)
Details of boreholes drilled on site are as follows:
UTM Coordinates(1), m Sr. No. Structure Borehole
Designation Easting Northing Existing Ground Level(1) (RL), m
Borehole Termination Depth,
m 1 Coal Silo BH-P-1 402227 2809110 45.5 40.32 2 Chimney BH-P-2 401627 2808823 45.5 40.34 3 Boiler BH-P-3 401549 2808592 45.5 40.33 4 Generator BH-P-4 401536 2808557 45.5 40.34
5 Generator Transformer BH-P-5 401506 2808528 45.5 40.33
6 Raw water storage tank BH-P-6 401514 2808315 45.5 40.30
• A layout plan illustrating the various test locations covered in this report volume are presented on
Plate 1. • The test locations were given to us on the ground by the client representatives at site. The locations
were marked were marked on Google earth and a satellite image illustrating the approximate test locations (as given to us) is presented on Plate 2.
2.0 FIELD INVESTIGATIONS
2.1 Soil Boring The borings were progressed using a shell and auger to the specified depth. The diameter of
the borehole was 150 mm. Casing was used for advancing boring below water table at all borehole locations. The work was in general accordance with IS: 1892-1979.
Standard Penetration Tests (SPT) were conducted in the boreholes at 1.0 m depth interval. The
test was conducted by connecting a split spoon sampler to ‘A’ rods and driving it by 45 cm using a 63.5 kg hammer falling freely from a height of 75 cm. The tests were conducted in accordance with IS: 2131-1981.
The number of blows for each 15 cm of penetration of the split spoon sampler was recorded.
The blows required to penetrate the initial 15 cm of the split spoon for seating the sampler is ignored due to the possible presence of loose materials or cuttings from the drilling operation. Where refusal (N>100) to further penetration of the split spoon sampler is encountered in the first 15 cm seating penetration

Page 6 of 20
itself, SPT test could not be completed and "Ref" is indicated in the bore logs, along with the penetration achieved. The ‘N’ values are presented on the soil profile for each borehole.
Disturbed samples were collected from the split spoon after conducting SPT. The samples were preserved in transparent polythene bags. Undisturbed samples were collected by attaching 75 mm diameter thin walled `Shelby’ tubes and driving the sampler using a 63.5 kg hammer in accordance with IS: 2132-1986. The tubes were sealed with wax at both ends. All samples were transported to our NABL accredited laboratory at Noida for further examination and testing.
2.2 Groundwater
Groundwater level was measured in the boreholes after drilling and sampling was completed.
The measured water levels are recorded on the individual soil profiles. 3.0 LABORATORY TESTS
The laboratory testing has been carried out in our NABL accredited laboratory. The quality
procedures in our laboratory conform to ISO/IEC-17025-2005.
Laboratory tests were conducted on selected soil and groundwater samples, to determine their physical and engineering properties. The testing procedures were in accordance with current applicable IS specifications. The following tests were conducted on selected soil and groundwater samples recovered from the boreholes:
Name of Test IS Code No.
Bulk Density IS : 2386 (Part-3)-1963 Natural moisture content IS : 2720 (Part-2)-1973, RA-2010 Grain size analysis IS : 2720 (Part-4)-1985, RA-2010 Specific gravity IS : 2720 (Part-3)-1980, RA-2007 Liquid and plastic limits IS : 2720 (Part-5)-1985, RA-2010 Unconfined compression test IS : 2720 (Part-10)-1991, RA-2010 Unconsolidated undrained triaxial shear test IS : 2720 (Part-11)-1993, RA-2007 Consolidated drained direct shear test IS : 2720 (Part-13)-1986, RA-2010
pH value IS : 2720 (Part 26)-1987, RA-2007 Total soluble sulphates IS : 2720 (Part-27)-1977, RA-2010 Chemical analysis of soil* Total soluble chlorides IS : 3025 (Part-32)-1988, RA-2009 pH value IS : 3025 (Part-11)-1983, RA-2006 Total soluble sulphates IS : 3025 (Part-24)-1986, RA-2009 Chemical analysis of
water* Total soluble chlorides IS : 3025 (Part-32)-1988, RA-2009
* Outside NABL Scope Engineering terms used to describe soils are explained on Plate 3. A note on our NABL
accreditation together with the uncertainty in laboratory measurements is presented on Plate 4. 4.0 GENERAL SITE CONDITIONS
4.1 Site Details
The site located in Barauni district, Bihar. Rajendra pul railway Station is located about 2.5 k m west of the site. Fly ash is present all over the site. The site is fairly leveled and ground level is RL 45.5 m.

Page 7 of 20
4.2 Regional Geology
The deposits in the project area belong to the Indo-Gangetic alluvium (1). The alluvial tract is of
the nature of a synclinal basin formed concomitantly with the elevation of the Himalaya to its North. The Indo-Gangetic depression was formed in the later stages of Himalayan Orogseny when the
Indian shield under-thrust the Asian continent. The well-consolidated crust of the shield became engulfed under the light, soft, moist sediments. As the northward drift of India continued, the more consolidated and metamorphosed older strata and the granitic magmas intrusive into them slid southwards, impelled partly by gravity and partly by compressive force.
The Pleistocene and recent deposits covering the Indo-Gangetic Basin are upto 1,000 m thick.
They are composed of gravels, sands and clays with remains of animals and plants. The older alluvium (called Bhangar) is rather dark colored and generally rich in concretions and
nodules of impure calcium carbonate (kankar). It is of Middle to Upper Pleistocene age. The Newer alluvium (called Khadar) is light colored and poor in calcareous matter. It contains
lenticular beds of sand and gravel and peat beds. It merges by insensible gradations into the recent or deltaic alluvia and should be assigned an Upper Pleistocene to Recent age.
4.3 Site Stratigraphy
A surficial fill of flyash is underlain by sandy silt / clayey silty to about 5-7.5 m depth. Silty sand /
fine sand is then encountered to the final explored depth of 40 m. The stratigraphy at site may be divided into three (3) generalized strata as described below:
Stratum – I (Loose to medium dense fly ash): A loose surficial fill of flyash is present all over the site to about 4.0-4.5 m depth (RL 41.5 -41.0 m). SPT values in the flyash range from 6 to 10 indicating loose to medium dense conditions. In this stratum, bulk density values range from 1.37 g/cm3 to 1.48 g/cm3 and moisture content values range from 30 % to 35 %. In this stratum, liquid limit values range from 24 % to 36 and plasticity index values range from 11 % to 15 %. Stratum – II (Loose sandy silt / firm clayey silt): Below Stratum-I, loose sandy silt / firm clayey silt is encountered to about 5.0-7.5 m depth (RL 40.5-38.0). However, at the Chimney location (P-2), sandy silt / clayey silt layer extends to about 12.0 m depth (RL 33.5 m). SPT values in this stratum range from 5 to 9. In stratum-II, bulk density values range from 1.85 g/cm3 to 1.93 g/cm3 and moisture content values range from 21 % to 26 %. In this stratum, liquid limit values range from 28 % to 46 and plasticity index values range from 13 % to 24 %. Stratum – III (medium dense to very dense silty fine sand / fine sand): Stratum-III consists of medium dense to very dense silty fine sand / fine sand to the maximum explored depth of 40 m (RL 5.5 m). SPT values in this stratum range from 20 to 66 to about 19-23 m depth (RL 26.5-22.5 m). Below this, refusal (N >100) is encountered. In this stratum, bulk density values range from 1.37 g/cm3 to 1.85 g/cm3 and moisture content values range from 19 % to 23 %.
(1) Krishnan, M.S. (1982), “Geology of India and Burma”, CBS Publishers & Distributors, Delhi, Sixth
Edition.
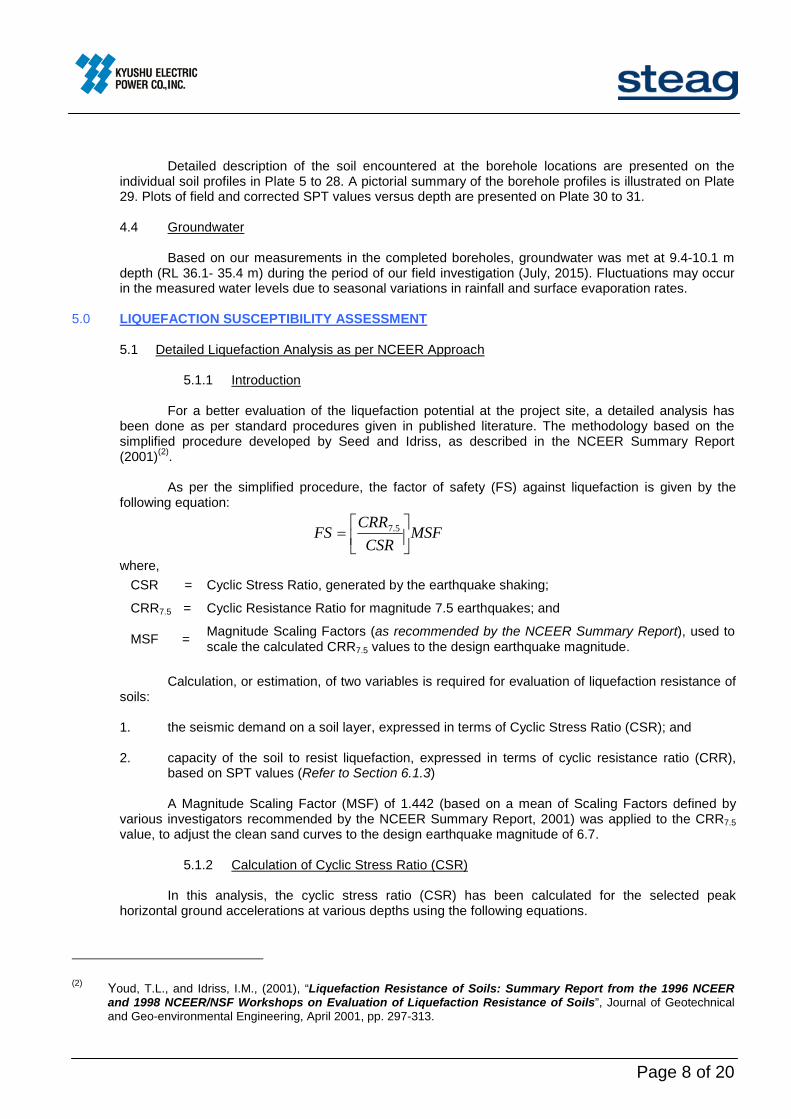
Page 8 of 20
Detailed description of the soil encountered at the borehole locations are presented on the
individual soil profiles in Plate 5 to 28. A pictorial summary of the borehole profiles is illustrated on Plate 29. Plots of field and corrected SPT values versus depth are presented on Plate 30 to 31.
4.4 Groundwater
Based on our measurements in the completed boreholes, groundwater was met at 9.4-10.1 m depth (RL 36.1- 35.4 m) during the period of our field investigation (July, 2015). Fluctuations may occur in the measured water levels due to seasonal variations in rainfall and surface evaporation rates.
5.0 LIQUEFACTION SUSCEPTIBILITY ASSESSMENT
5.1 Detailed Liquefaction Analysis as per NCEER Approach
5.1.1 Introduction
For a better evaluation of the liquefaction potential at the project site, a detailed analysis has been done as per standard procedures given in published literature. The methodology based on the simplified procedure developed by Seed and Idriss, as described in the NCEER Summary Report (2001)(2).
As per the simplified procedure, the factor of safety (FS) against liquefaction is given by the
following equation: MSF
CSRCRR
FS ⎥⎦⎤
⎢⎣⎡= 5.7
where, CSR = Cyclic Stress Ratio, generated by the earthquake shaking; CRR7.5 = Cyclic Resistance Ratio for magnitude 7.5 earthquakes; and MSF = Magnitude Scaling Factors (as recommended by the NCEER Summary Report), used to
scale the calculated CRR7.5 values to the design earthquake magnitude. Calculation, or estimation, of two variables is required for evaluation of liquefaction resistance of
soils: 1. the seismic demand on a soil layer, expressed in terms of Cyclic Stress Ratio (CSR); and 2. capacity of the soil to resist liquefaction, expressed in terms of cyclic resistance ratio (CRR),
based on SPT values (Refer to Section 6.1.3)
A Magnitude Scaling Factor (MSF) of 1.442 (based on a mean of Scaling Factors defined by various investigators recommended by the NCEER Summary Report, 2001) was applied to the CRR7.5 value, to adjust the clean sand curves to the design earthquake magnitude of 6.7.
5.1.2 Calculation of Cyclic Stress Ratio (CSR)
In this analysis, the cyclic stress ratio (CSR) has been calculated for the selected peak
horizontal ground accelerations at various depths using the following equations.
(2) Youd, T.L., and Idriss, I.M., (2001), “Liquefaction Resistance of Soils: Summary Report from the 1996 NCEER
and 1998 NCEER/NSF Workshops on Evaluation of Liquefaction Resistance of Soils”, Journal of Geotechnical and Geo-environmental Engineering, April 2001, pp. 297-313.
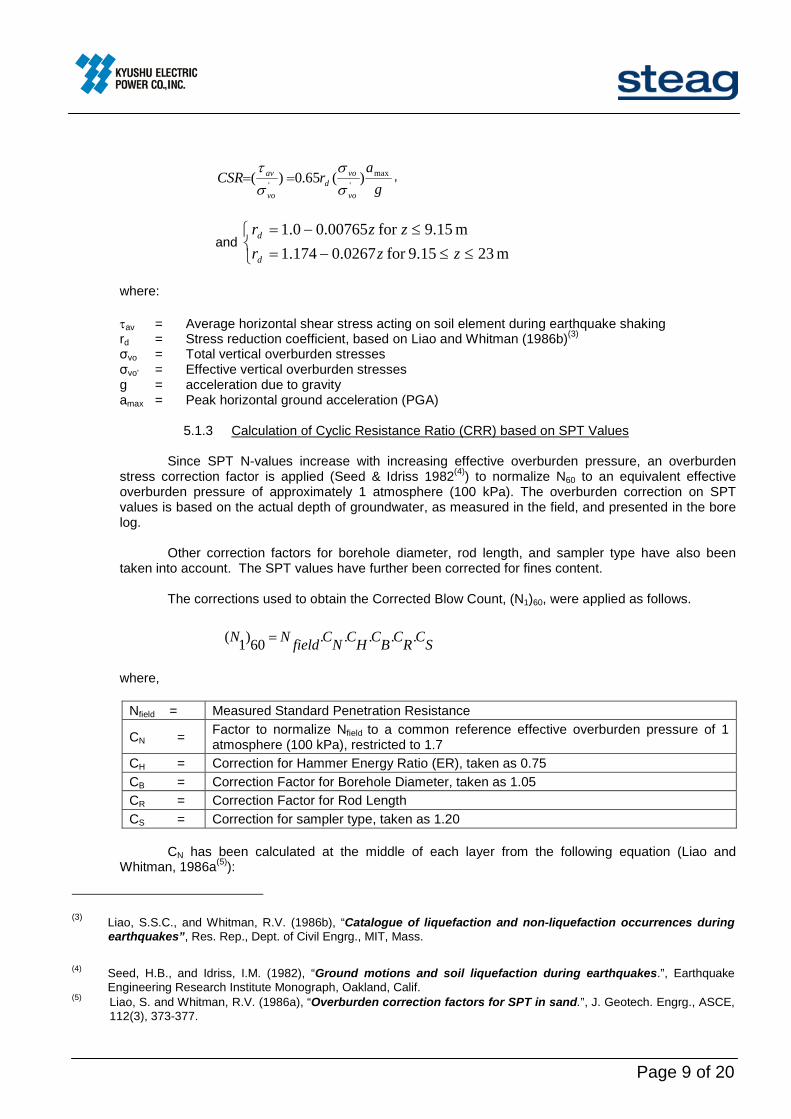
Page 9 of 20
ga
rCSRvo
vod
vo
av max'' )(65.0)(
σσ
στ
== ,
and ⎩⎨⎧
≤≤−=≤−=
m 239.15for 0267.0174.1m 15.9for 00765.00.1zzr
zzr
d
d
where: τav
= Average horizontal shear stress acting on soil element during earthquake shaking rd = Stress reduction coefficient, based on Liao and Whitman (1986b)(3)
σvo = Total vertical overburden stresses σvo’ = Effective vertical overburden stresses g = acceleration due to gravity amax = Peak horizontal ground acceleration (PGA)
5.1.3 Calculation of Cyclic Resistance Ratio (CRR) based on SPT Values Since SPT N-values increase with increasing effective overburden pressure, an overburden
stress correction factor is applied (Seed & Idriss 1982(4)) to normalize N60 to an equivalent effective overburden pressure of approximately 1 atmosphere (100 kPa). The overburden correction on SPT values is based on the actual depth of groundwater, as measured in the field, and presented in the bore log.
Other correction factors for borehole diameter, rod length, and sampler type have also been
taken into account. The SPT values have further been corrected for fines content. The corrections used to obtain the Corrected Blow Count, (N1)60, were applied as follows.
(N1)60 = N field.CN .CH .CB.CR.CS
where,
Nfield = Measured Standard Penetration Resistance CN = Factor to normalize Nfield to a common reference effective overburden pressure of 1
atmosphere (100 kPa), restricted to 1.7 CH = Correction for Hammer Energy Ratio (ER), taken as 0.75 CB = Correction Factor for Borehole Diameter, taken as 1.05 CR = Correction Factor for Rod Length CS = Correction for sampler type, taken as 1.20
CN has been calculated at the middle of each layer from the following equation (Liao and
Whitman, 1986a(5)): (3) Liao, S.S.C., and Whitman, R.V. (1986b), “Catalogue of liquefaction and non-liquefaction occurrences during
earthquakes”, Res. Rep., Dept. of Civil Engrg., MIT, Mass. (4) Seed, H.B., and Idriss, I.M. (1982), “Ground motions and soil liquefaction during earthquakes.”, Earthquake
Engineering Research Institute Monograph, Oakland, Calif. (5) Liao, S. and Whitman, R.V. (1986a), “Overburden correction factors for SPT in sand.”, J. Geotech. Engrg., ASCE,
112(3), 373-377.

Page 10 of 20
5.0
' ⎟⎟⎠
⎞⎜⎜⎝
⎛=
vo
oN
PCσ
≤ 1.7
Where,
Po = Reference effective overburden pressure of 1 atmosphere (100 kPa); σvo’ = Effective overburden pressure at middle of layer at the time of drilling
The corrected (N1)60 value thus obtained was further corrected for the influence of fines content
(FC %). The clean-sand base curve for determination of CRR based on corrected SPT N-values, (N1)60, has been estimated by the following equation (Rauch, 19986):
5.2 Results of Detailed Liquefaction Studies
For the liquefaction analysis, the design earthquake magnitude has been taken as 6.7 on the Ritchter scale for Zone IV. The peak ground acceleration has been considered as equal to 0.24g. The results of the analysis are presented below:
Sr. No. Structure Borehole No. Liquefaction Potential Susceptibility
1 Coal silo P1 No Liquefaction potential 2 Chimney P2 No Liquefaction potential 3 Boiler P3 Liquefaction potential between 10.0 to 13.5 m depth 4 Generator P4 No Liquefaction potential 5 Generator Transformer P5 No Liquefaction potential 6 Raw water storage tank P6 No Liquefaction potential
According to Fig.1 of IS: 1893 (Part1)-2002, RA-2005 showing seismic zones the proposed site falls on earthquake Zone-IV. Therefore design should be done considering the earthquake parameters for Zone-IV.
6.0 CONCEPT OF FOUNDATION ANALYSIS
6.1 Open Foundation Bearing capacity analysis for open foundations has been done in general accordance with IS:
6403-1981. The bearing capacity equation used is as follows: qnet safe = 1 [cNcζc dc+ q(Nq-1) ζqdq+ 0.5 Bϒ Nγζγ dϒ Rw]
F Where: qnet safe = safe net bearing capacity of soil based on the shear failure criterion. q = overburden pressure Rw = water table correction factor, F = Factor of safety, taken as equal to 2.5 in accordance with IS:1904-1986. ζc,ζq,ζγ = Shape factors. For Strip footings, ζc = ζq = ζγ = 1 For Square footing, ζc = 1.3, ζq = 1.2, ζγ = 0.6
(6) Rauch, A. F. (1998). Personal Communication. (as cited in Youd, T. L., Idriss, I. M., Andrus, R. D., Arango, I., Castro,
G., Christian, J. T., Dobry, R., Finn, W. D. L., Harder, L. F., Hynes, M. E., Ishihara, K., Koester, J. P., Liao, S. S. C., Marcuson, W. F., Martin, G. R., Mitchell, J.K., Moriwaki, Y., Power, M. S., Robertson, P. K., Seed, R. B., and Stokoe, K. H. (2001). Liquefaction Resistance of Soils: Summary Report from the 1996 NCEER and 1998
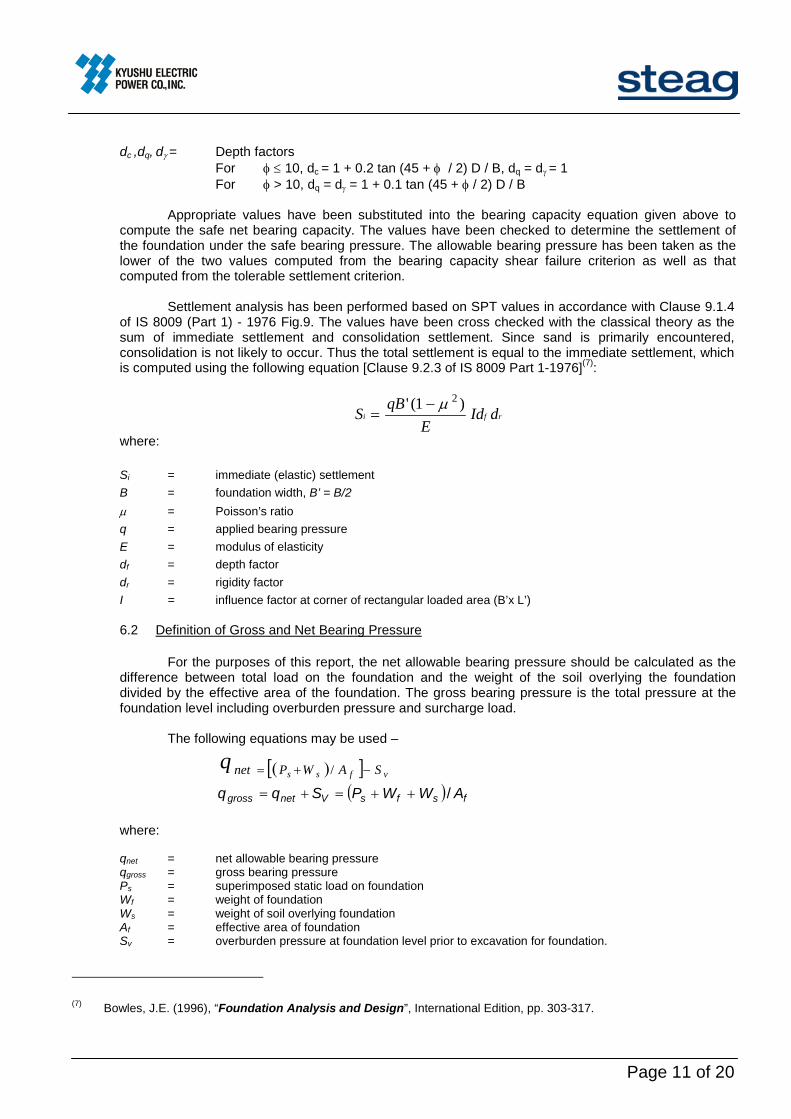
Page 11 of 20
dc ,dq, dγ = Depth factors For φ ≤ 10, dc = 1 + 0.2 tan (45 + φ / 2) D / B, dq = dγ = 1 For φ > 10, dq = dγ = 1 + 0.1 tan (45 + φ / 2) D / B
Appropriate values have been substituted into the bearing capacity equation given above to
compute the safe net bearing capacity. The values have been checked to determine the settlement of the foundation under the safe bearing pressure. The allowable bearing pressure has been taken as the lower of the two values computed from the bearing capacity shear failure criterion as well as that computed from the tolerable settlement criterion.
Settlement analysis has been performed based on SPT values in accordance with Clause 9.1.4
of IS 8009 (Part 1) - 1976 Fig.9. The values have been cross checked with the classical theory as the sum of immediate settlement and consolidation settlement. Since sand is primarily encountered, consolidation is not likely to occur. Thus the total settlement is equal to the immediate settlement, which is computed using the following equation [Clause 9.2.3 of IS 8009 Part 1-1976](7):
Si =
qB ' (1 − μ 2 )E
Idf dr where: Si = immediate (elastic) settlement B = foundation width, B’ = B/2
μ = Poisson’s ratio q = applied bearing pressure E = modulus of elasticity df = depth factor dr = rigidity factor I = influence factor at corner of rectangular loaded area (B’x L’) 6.2 Definition of Gross and Net Bearing Pressure
For the purposes of this report, the net allowable bearing pressure should be calculated as the
difference between total load on the foundation and the weight of the soil overlying the foundation divided by the effective area of the foundation. The gross bearing pressure is the total pressure at the foundation level including overburden pressure and surcharge load.
The following equations may be used –
( )[ ] vfss SAWPnetq −+= / ( ) fsfsVnetgross AWWPSqq /++=+=
where: qnet = net allowable bearing pressure qgross = gross bearing pressure
Ps = superimposed static load on foundation Wf = weight of foundation Ws = weight of soil overlying foundation Af = effective area of foundation Sv = overburden pressure at foundation level prior to excavation for foundation.
(7) Bowles, J.E. (1996), “Foundation Analysis and Design”, International Edition, pp. 303-317.

Page 12 of 20
31 )(
12fLLIEyQ
+=
It may please be noted that safe bearing pressures recommended in this report refer to “net
values”. Where filling is done, it should be treated as a surcharge over the foundation. Typical calculations are attached at the end of this report.
6.3 RCC Bored Cast in-situ Piles The axial capacity for bored piles have been computed as per IS 2911 (Part-I/Section-2) - 2010 based on static analysis using c-φ values as interpreted from the site stratigraphy, SPT values and laboratory test results.
[ ] pqpcp
n
i
isiii
pu
n
i
issult
ADNNqNcLAkpc
AqLAfQ
γγδα 21)tan(
1
1
+++⎥⎦
⎤⎢⎣
⎡+=
+⎥⎦
⎤⎢⎣
⎡=
∑
∑
=
=
where: Qult = ultimate pile capacity fs = unit skin friction α = adhesion factor ci = cohesion intercept in ith layer pi = overburden pressure at centre of ith layer k = coefficient of lateral earth pressure δi = angle of friction between soil and pile (taken as equal to φi) for the ith layer As = surface area of pile per m length Li = length of pile section in ith layer cp = cohesion intercept in bearing strata qu = unit end bearing qp = overburden pressure in bearing strata Nc,Nq = bearing capacity factors, which are a function of φ in the bearing strata Ap = pile cross sectional area A factor of safety of 2.5 has been used on the ultimate pile capacity as per IS 1904-1986 in order to obtain the safe pile capacities.
The overburden pressure is assumed to become constant below depth of 15 times pile diameters. The uplift / pullout resistance has been computed from the static formula by ignoring the end bearing component and adding the effective weight of the pile to the skin friction component. A factor of safety of 3.0 has been applied to the ultimate pile pullout resistance to obtain the safe pullout capacity. The lateral load carrying capacity of fixed head pile has been computed based on IS: 2911 (Part-I) Section-2 2010 using the following equation: where:
Q = lateral load E = the Young’s modulus of pile material I = moment of inertia of pile cross section.

Page 13 of 20
Lf = depth of fixity L1 = length of pile section below cut-off-level that may not contribute significantly to lateral
resistance (in loose/weak soils) y = horizontal deflection
7.0 FOUNDATION ANALYSIS AND RECOMMENDATIONS
7.1 General
A suitable foundation for any structure should have an adequate factor of safety against exceeding the bearing capacity of the supporting soils. Also the vertical movements due to compression of the soils should be within tolerable limits for the structure. We consider that foundations designed in accordance with the recommendations herein will satisfy these criteria. 7.2 Foundation Type and Depth
As described in Section 4.3, loose to medium dense surficial fill (Fly ash) is present all over the site. It extends from ground surface to about 4.0-4.5 m depth (RL 41.5 -41.0 m). Open Foundation is not feasible in Filled up stratum.
Structure Borehole No. Foundation Type Remarks Raft Foundation
Coal silo BH-P-1 RCC Bored Cast In-situ Piles
• Fill is met to 4.0 m depth. • Open and raft foundations are feasible at 5.0 m depth. • Alternatively RCC bored piles with cut off level at 1.5~2.0
m depth may be provided
Chimney BH-P-2 RCC Bored Cast
In-situ Piles • Fill is met to 4.0 m depth and low SPT values to about 11 m depth.
• Open and raft Foundation are not feasible. • RCC bored piles with cut off level at 1.5~2.0 m depth
may be provided
Boiler BH-P-3 RCC Bored Cast
In-situ Piles • Fill is met to 4.5 m depth and liquefy to about 13.5 m depth.
• Open and raft Foundation are not feasible. • RCC bored piles with cut off level at 1.5~2.0 m depth
may be provided
Generator BH-P-4 RCC Bored Cast In-
situ Piles • Fill is met to 4.5 m depth and low SPT values to about
8.5 m depth. • Open and raft foundations are not feasible. • RCC bored piles with cut off level at 1.5~2.0 m depth
may be provided
Generator Transform
er BH-P-5
RCC Bored Cast In-situ Piles
• Fill is met to 4.0 m depth and low SPT values to about 7.0 m depth.
• Open and raft foundations are not feasible. • RCC bored piles with cut off level at 1.5~2.0 m depth
may be provided Open Foundation Raw water
storage tank
BH-P-6 RCC Bored Cast In-situ Piles
• Fill is met to 4.5 m depth and low SPT values to about 6.0 m depth.
• Open and raft foundations are feasible at 6.5 m depth. • Alternatively RCC bored piles with cut off level at
1.5~2.0 m depth may be provided Our recommended values of net allowable bearing pressure are presented in Section 7.4.
Recommended safe pile capacities are presented in Section 7.5. Lightly loaded foundations for pipe rack, small buildings, etc. may bear on the flyash after
improving the ground to densify the loose flyash. Alternative methods of ground improvement suitable for the minor facilities include the following:

Page 14 of 20
1. Excavation and compaction in layers (See Section 7.6), or 2. Rammed Stone Columns (See Section 7.7).
Plate load tests should be done to confirm the safe bearing capacity of the improved soils. The current investigation is intended to give a generalized assessment of the stratigraphy and
the expected foundation system. The recommendations in this report may please be treated as preliminary and applicable for structures in the vicinity of the borehole locations.
We suggest that a detailed geotechnical study be carried out on site for a better assessment of
the strata conditions at the structure locations.
7.3 Design Parameters
The final design parameters as selected by us are based on the field and laboratory test results, as well as our engineering judgment; keeping in view the limited data and expected strata variations. In some cases, where the laboratory values may be inordinately high/low, we have selected design parameters based on the SPT values as well as the general strata characteristics across the site.
Depth , m Structure
From To Soil Classification Design N-
Value γ,T/m3 c, T/m2 φ, degrees
0.0 4.0 Fill (Fly ash) 6 1.40 4.0 12.0 Sandy silt / Clayey silt 9 1.65 6.5 4 5.0 15.0 Fine sand 20 1.75 0 30
15.0 20.0 Fine sand 35 1.85 0 31 20.0 30.0 Fine sand 65 1.95 0 32
Coal Silo, Chimney,
Generator, Generator
Transformer Raw water
storage tank
30.0 40.0 Fine sand 100 2.00 0 33 0.0 4.5 Flyash 6 1.40 4.5 7.5 Sandy silt 7 1.65 6.5 4 7.5 13.0 Fine sand - liquefiable 14 1.75 0 30
13.0 20.0 Fine sand 35 1.85 0 31 20.0 30.0 Fine sand 65 1.95 0 32
Boiler
30.0 40.0 Fine sand 100 2.00 0 33
where:
N = Design SPT values γ = bulk density C = cohesion intercept φ = angle internal friction
7.4 Recommended Net Allowable Bearing Pressures The following table presents our preliminary suggested net allowable bearing pressures for open
and raft foundations at the Coal Silo and Raw Water Storage Tank:

Page 15 of 20
Recommended Net Allowable Bearing Pressure, T/m2 Isolated Footing Raft Foundations
Structure Depth,
m
Total
Se
ttleme
nt = 1
2.5 m
m
Total
Se
ttleme
nt
= 25 m
m
Total
Se
ttleme
nt = 4
0 mm
Total
Se
ttleme
nt
= 25 m
m
Total
Se
ttleme
nt = 4
0 mm
Total
Se
ttleme
nt
= 75 m
m
Suggested Modulus of Subgrade
Reaction, kN/m3
5.0 5.2 10.3 16.5 10.9 17.5 32.8 4200 Coal Silo 6.0 7.5 15.0 24.0 15.6 25.0 46.9 6105 6.5 5.8 11.6 18.5 12.2 19.5 36.6 4700 Raw water
storage tank 7.5 8.1 16.3 26.0 16.6 26.5 49.7 6500 The above values include a bearing capacity safety factor of 2.5. The appropriate values of net
bearing pressure may be selected as per the permissible settlement criterion. Net bearing pressures for foundations of intermediate widths and at intermediate depths may be interpolated linearly between the values given above. Fill placed above EGL should be treated as surcharge load.
In order to restrict the influence of adjacent footings on each other, the lateral edge-to-edge
spacing between the foundations should at least be equal to “0.8B” where ”B” is the width of the larger footing.
The suggested modulus of sub grade reaction (k) has been computed based on empirical
relationships as given in published literature(8), and is applicable for minimum 2-6 m size square footing at the center of the loaded area.
7.5 Pile Foundations
RCC bored cast-in-situ piles may be used to support structural loads. The following table
presents our preliminary estimate of safe load carrying capacities for 550-600mm diameter bored piles with cut-off-level at about 2 m depth (RL 43.5 m).
Recommended Safe Load Carrying
Capacities, Tonnes Structure Pile
Diameter, mm
Pile Length below cut-off-
level, m RL of Pile
Tip Compression Pullout Lateral 18 25.5 71 35 20 23.5 86 41 22 21.5 95 47 24 19.5 104 53
550
26 17.5 114 60
9.0
18 25.5 85 40 20 23.5 102 47 22 21.5 113 55 24 19.5 124 62
Coal Silo Chimney, Generator, Generator
Transformer, Raw water
storage tank 600
26 17.5 135 69
9.8
(8) Bowles, J.E. (1996), "Foundation Analysis and Design Fifth Edition", The McGraw-Hill Companies Inc., pp. 503

Page 16 of 20
Recommended Safe Load Carrying Capacities, Tonnes Structure
Pile Diameter,
mm Pile Length
below cut-off-level, m
RL of Pile Tip Compression Pullout Lateral
18 25.5 61 28 20 23.5 75 35 22 21.5 85 41 24 19.5 95 47
550
26 17.5 105 54
9.0
18 25.5 74 33 20 23.5 92 41 22 21.5 103 48 24 19.5 115 56
Boiler
600
26 17.5 126 63
9.8
The following points are highlighted with reference to the above capacities:
1. The above values are based on IS: 2911(Part-1): Section 2-2010 and include safety factor of
2.5 for compression and 3.0 for uplift. 2. Safe pile capacities for piles of intermediate lengths may be interpolated linearly between the
values given above.
3. The lateral capacities are for fixed head pile with horizontal deflection of 5 mm at the pile head.
4. It should be ensured that the bottom of the pile bore is cleaned properly before casting the pile. This is important because the soil particles tend to settle down at the bottom of the pile bore, which may cause reduction in pile capacities.
5. The capacities given above may be taken as a guideline for initial design. Final pile capacities
should be confirmed by conducting initial pile load tests as per IS: 2911 (Part 4) – 1985, RA-2010. Also, routine load tests should be conducted on sufficient working piles to ensure that the piles are safe for the design loads.
6. We recommend that pile integrity tests (PIT)(9) be carried out on all working piles installed on
site, in order to assess the quality of the pile construction. The PIT results may be used as a guideline to select the appropriate piles for routine load tests. In addition consideration may be given to conducting a few high strain dynamic pile load tests (HSDLT) as a quality assurance measure.
7.6 Ground Improvement by Excavation and Replacement For lightly loaded foundation not exceeding 1 m width, we recommend as follows:
(9) Sanjay Gupta, Ravi Sundaram and Sorabh Gupta (2008), “Pile Integrity Testing for Monitoring Pile
Construction”, Proceedings, National Symposium on Geoenvironment, Geohazards, Geosynthetics and Ground Improvement-Experiences and Practices (4G) Indian Geotechnical Society (Delhi Chapter) pp 173-178.

Page 17 of 20
1. Lightly loaded foundations not exceeding 1 m width may bear at 1.0 m depth on compacted
structural fill. 2. Excavate to 2.0 m depth. 3. Place the flyash back in layers not exceeding 15 cm thickness and compact each layer. 4. The flaysh should be placed and compacted at moisture content of ±1 percent and should be
compacted to at least 95 percent of the maximum dry density as determined by the standard proctor test (IS: 2720 Part VII).
5. A 300 mm thick gravel pad (63 mm down stones mixed with 40-20 mm size stones, blinded with flyash).
6. Foundations not exceeding 1 m width bearing on the compacted gravel pad may be designed for a net allowable bearing pressure of 5 T/m2. This value includes a bearing capacity safety factor of 2.5. Total settlement of foundations designed for this bearing pressure is expected to be less than 40 mm.
7. Plate load test should be performed on the improved ground to confirm the safe bearing capacity.
7.7 Ground Improvement by Rammed Stone Columns To improve the bearing capacity of the flyash, and minimize the total and differential settlements
under the anticipated loads; we suggest the use of rammed stone columns. The technique of improving the engineering properties of soil by provision of gravel piles / rammed stone columns is a cost effective system (10).
In this scheme, 63 mm down, graded, stone aggregate mixed with 40 mm and 20 mm stones
are placed and compacted in boreholes drilled to the desired depth. The borehole is filled with the stones to a height of about 1 m above the bottom of the hole and is rammed using a heavy rammer (600-1000 kg weight) till a set is obtained. Ramming is done on the gravel layer. The process is repeated till the gravel pile / stone column is constructed up to the desired depth.
The granular pile should be constructed by placing the stone aggregate in the pile with
adequate ramming. The granular piles may be constructed in a triangular grid pattern, covering the entire area of the foundations. In order to ensure peripheral restrainment, at least two rows of stone column / granular piles should be provided outside the loaded areas. On top of the piles, a 50 cm thick gravel pad may be placed. Foundations may be constructed on top of this gravel pad.
The stone columns should extend to about 10 m depth below EGL. We suggest use of 400-500 mm diameter rammed stone columns spaced 1.5-2.0 m apart. The spacing may be optimized as per the required safe bearing capacity. Foundation on the improved ground may bear at 1.5-2.0 m depth. We expect that the net allowable bearing pressure of the ground after improvement may be about 12-15 T/m2 for a permissible settlement of 40 mm. However, the same must be confirmed on site by constructing trial stone columns and load testing them on site.
We suggest the trial stone column be installed at site and load tested in order to assess the safe bearing capacity and developed field expectance criterion. The spacing between the stone columns may be optimized based on an acceptance criterion to be developed on site.
Load tests on single stone column and group of three stone columns on trial stone columns installed at different spacing may be used to select the suitable spacing to achieve the desired bearing
(10) Ravi Sundaram and Sanjay Gupta (1996), “Gravel Piles: Construction and Field Testing”, Proceedings, Seminar on
Piles, Indian Geotechnical Society Delhi Chapter, pp 72-81.

Page 18 of 20
capacity. The size of the test plate shall be decided based on the stone column diameter and spacing between the stone columns. Boreholes / cone penetration tests should be done in between the stone column / granular piles to assess the extent of ground improvement achieved on site.
Open foundations / raft foundations may be adopted on the improved ground, after verifying the
effectiveness of the ground improvement method used on site. 7.8 Definition of Gross and Net Bearing Pressure
For the purposes of this report, the net allowable bearing pressure should be calculated as the
difference between total load on the foundation and the weight of the soil overlying the foundation divided by the effective area of the foundation. The gross bearing pressure is the total pressure at the foundation level including overburden pressure and surcharge load.
The following equations may be used –
qnet = [(Ps + Wf +Ws) / Af] - Sv qgross = qnet + Sv = (Ps + Wf + Ws) / Af
where: qnet = net allowable bearing pressure qgross = gross bearing pressure
Ps = superimposed static load on foundation Wf = weight of foundation Ws = weight of soil overlying foundation Af = effective area of foundation Sv = overburden pressure at foundation level prior to excavation for foundation.
It may please be noted that safe bearing pressures recommended in this report refer to “net
values”. Where filling is done, it should be treated as a surcharge over the foundation.
8.0 FOUNDATION CONSTRUCTION CONSIDERATION
8.1 Excavation Temporary open cut excavations to about 6.5-7.0 m depth for foundation construction may be
cut using side slopes of 1-vertical on 0.8 to 1.0 horizontal. If excessive sloughing or caving is observed, the slopes may be flattened further to ensure stability. A horizontal berm, at least 1.5 m wide, should be provided at 2.5-3.0 m depth interval for stability purpose.
The engineer should monitor the excavation of slopes. In case excessive sloughing or caving
occurs, the slope may be flattened further to ensure stability.
8.2 Foundation Level Preparation All loose soils should be removed and the exposed foundation bearing surface should be
watered and compacted properly using rammers / rollers. The surface should then be protected from disturbances due to construction activities so that the foundations may bear on the natural undisturbed ground. We recommend the placement of a 75 to 100 mm thick “blinding layer” of lean concrete to facilitate placement of reinforcing steel and to protect the soils from disturbance.
In case mechanical means like excavators are deployed for excavations, the excavations should
be carried out up to 0.5 m above the proposed level. The last 0.5 m depth of excavation should be carried out manually, so that the founding soils are not disturbed / loosened.
8.3 Pile Construction

Page 19 of 20
For construction of piles, properly mixed drilling mud should be used to control the caving of the borehole during drilling and concreting. The concrete used for the pile construction use of tremie concreting is recommended so as to ensure that the groundwater does not mix with the fresh concrete. It should be coherent, with a minimum cement content of 400 kg/m3. It should have a slump of about 150 to 180 mm.
The piling activity should ensure minimum disturbance to the soil around the pile shaft. The
piling works should be executed by a specialist agency with sufficient experience in such works.
8.4 Pile Testing Program
A program of initial and routine static pile load tests under compression, pullout and lateral loading condition should be drawn up and sufficient number of piles should be load tested in accordance with IS: 2911 (Part-IV)-1985 in order to ensure that the safe load on the pile is either equal to or greater than the working load on the piles.
We suggest that low-strain pile integrity testing (PIT) be conducted on all the working piles as a
quality control measure. The integrity test results should be used as a basis for selecting the working / routine piles to be load-tested.
In addition to static pile load tests, we recommend that high strain dynamic pile load tests
(HSDLT)11 (preferably using 8-channel PDA equipment) be carried out on some of the test piles to quickly assess the safe pile capacity and pile integrity. HSDLT can effectively supplement static load test and may result in substantial savings in the time and cost of foundation testing.
8.5 Chemical Attack
Results of chemical test on selected soil and water samples are presented on Plate 68. The
results indicate that the soils contain 0.10-0.11 percent sulphates and 0.04-0.06 percent chlorides. The groundwater contains 331- 355 mg / litre of sulphates and 112-192 mg / litre of chlorides. The pH value of soil is 7.4-8.0 and that of groundwater is 7.2-7.5 indicating nearly neutral condition.
IS: 456-2000 recommends that precautions should be taken against chemical degradation of
concrete if
sulphates content of the soils exceeds 0.2 percent, or groundwater contains more than 300 mg /litre of sulphates (SO3).
Comparing the test results with these specified limits, the sulphate content of the groundwater is
higher than the specified limit. Groundwater is encountered at about 9.4-10.1 m and is likely to influence foundation concrete. Therefore, strata at the site may be treated in Class-2 category as described on IS: 456-2000.
The strata at the site may be treated in Class 2 category as described on IS: 456-2000. In our
opinion, groundwater is marginally aggressive to the foundation concrete. We recommend the following measures to limit the potential for chemical attack:
(1) Piles should contain at least 400 kg/m3 cement. The cement content in concrete for open
foundations and pile caps should be at least 330 kg/cm3. (2) Water cement ratio in foundation concrete should not exceed 0.50.
11) ASTM D4945 - 08 Standard Test Method for High-Strain Dynamic Testing of Piles

Page 20 of 20
(3) A clear concrete cover over the reinforcement steel of at least 50 mm should be provided for all foundations.
(4) Concrete for open foundations and pile caps should be densified adequately using a vibrator so
as to form a dense impervious mass.
9.0 RECOMMENDATIONS FOR FURTHER INVESTIGATION
The current study is a preliminary investigation for DPR purpose. The boreholes drilled on site were widely spaced. The current investigation is intended to give a generalized assessment of the stratigraphy and the expected foundation system. The recommendations in this report may please be treated as preliminary and applicable for structures in the vicinity of the borehole locations.
We suggest that a detailed geotechnical study be carried out on site once the layout plan is
finalized, for a better assessment of the strata conditions at the structure locations. Such an investigation may include the following:
1. Boreholes: Sufficient boreholes should be drilled for each structure to assess the stratigraphy
and soil conditions. 2. Static Cone Penetration Tests: The cone penetration test provides a continuous profile of
cone tip resistance versus depth. The data may be used for foundation analysis in conjunction with the borehole data.
3. Pressuremeter Test: The test provides superior data for foundation analysis that can be used
to economize the foundation design.
4. Cross-hole Seismic Test: The test should be conducted in areas of dynamic loads for evaluating the primary and shear wave velocities, dynamic Young’s modulus, shear modulus, etc.
5. Electrical Resistivity Tests: The test provides useful data for design of the electrical grounding
system.
6. Field and Laboratory CBR Tests: The results may be used for design of the internal roads of the plant.
10.0 VARIABILITY IN SUB-SURFACE CONDITIONS
Subsurface conditions encountered during construction may vary somewhat from the conditions encountered during the site investigation. In case significant variations are encountered during construction, we request to be notified so that our engineers may review the recommendations in this report in light of these variations.

Plan of Field InvestigationsLocation: Power House Area
BH‐P1
BH‐P2
BH‐P3
BH‐P4
BH‐P5
BH‐P6
SYMBOL TYPE OF TEST
Borehole (BH)
L E G E N D
Extension of Barauni Super Critical Coal Fired Thermal Power Station at Barauni, Bihar. M/s. STEAG Energy Services (India) Pvt. Ltd.
Project No. 215081-II Plate 1 of 69

Satellite image taken from Google Earth ®
Location: Power House Area
Test Locations marked as per GPS coordinates taken on site using hand-held Garmin ® deviceAccuracy of hand-held GPS device generally ranges from 4-6m, and varies depending on the availability of satellite connection at the site
Satellite Image of Site and Test Locations
N
Extension of Barauni Super Critical Coal Fired Thermal Power Station at Barauni, Bihar. M/s. STEAG Energy Services (India) Pvt. Ltd.
Project No. 215081-II Plate 2 of 69

SPT (N) Value
SPT (N) Value
0 to 2
2 to 4
4 to 8
8 to 15
15 to 30
> 30
Degree of Expansion
Low
Medium
High
Very High
35 - 50
20 - 35
Liquid Limit
< 15
15 -30
< 12
12 - 23
< 50
50 -100
100 - 200
> 200
30 - 60
Engineering Description of Soils
> 60
23 - 32
> 3270 - 90
50 - 70
Free Swell Percent
Degree of Expansion of Fine Grained Soils
> 2.0
Plasticity Index
Density Descriptor
Plasticity Chart
Static Cone Tip Resistance kg/sq.cm
Density Condition of Granular Soils
Degree of Severity
0.5 to 1.0
Hard
< 0.1
1.0 to 2.0
0.1 to 0.25
0.25 to 0.5
Shrinkage Index
Very Stiff
Stiff
Severe
Critical
Marginal
Non-critical
Plasticity of Clay
Plasticity Liquid Limit
Low Plastic
Medium Plastic
High Plastic
< 35
35 to 50
> 50
Consistency of Cohesive Soils
Firm/Medium
Soft
Consistency Cohesion Intercept, kg/sq.cm
Very SoftVery Loose
Loose
Medium Dense
Dense
Very dense
0 to 4
4 to 10
10 to 30
30 to 50
> 50
< 20
20 to 40
40 to 120
120 to 200
> 200
Extension of Barauni Super Critical Coal Fired Thermal Power Station at Barauni, Bihar. M/s. STEAG Energy Services (India) Pvt. Ltd.
Project No. 215081-II Plate 3 of 69

NABL Accredited Laboratory Our laboratory is accredited to National Accreditation Board for Testing and Calibration Laboratories (NABL), New Delhi. The quality procedures in our laboratory conform to the International Standard ISO/IEC: 17025-2005. The accreditation assures our clients of work quality in conformance with international norms and practices. It authorizes us to use the NABL logo on test results. To maintain the necessary level of quality and reliability in all measurements on a continual basis, we indulge in the following:
Use of calibrated equipment, regular maintenance and good housekeeping are a part of our work culture.
Inter-laboratory comparison, proficiency testing and replicate testing, continuing education - ensure uniform quality of results.
Internal Audit of quality procedures is done by our qualified ISO 17025 auditors to maintain the requisite standards. NABL conducts external audit.
Uncertainty Every measurement entails an uncertainty. It is well known that no measuring instrument can determine the true value of any measurement. The cumulative effect of factors such as sensitivity of equipment, accuracy in calibration, human factors and environmental conditions will determine the overall uncertainty in the parameter determined from these measurements. As a part of our commitment to our clients, we have worked out the uncertainty in the parameters reported by our laboratory. Although this does not form a part of our contract agreement, we present below our statistical estimate of uncertainty of various parameters based on our most recent evaluation (Feb., 2015).
Test / Parameter Uncertainty* Test / Parameter Uncertainty*
Moisture Content 0.13 % Free Swell Index, % 2.0 %
Bulk & Dry Density 0.0015 g/cc Swell Pressure 0.43 % Specific Gravity 0.014 cc1 0.0003
Liquid Limit 0.27 % cc2 0.003 Plastic Limit 0.19 % mv 0.0003 cm2/kg
Shrinkage Limit 0.30 %
Consolidation
pc 0.15 kg/cm2 Unconfined
Compression c 0.079 kg/cm2 CD Direct Shear Test 0.29
c 0.42 % Coarse grained soils 0.6% of particle size
UU Triaxial Test 0.2 %
Soil Gradation Fine grained
soils 0.5% of particle size
MDD 0.03 g/cc Coefficient of Permeability 1.3 % of value Std/Mod Proctor Compaction OMC 0.13 % Crushing
Strength 0.80 % of value
Laboratory CBR 0.57% Rock Point Load
Strength Index 0.04 % of value
* at 95 percent confidence level for coverage factor of 2
Uncertainty in Laboratory Measurements
Extension of Barauni Super Critical Coal Fired Thermal Power Station at Barauni, Bihar. M/s. STEAG Energy Services (India) Pvt. Ltd.
Project No. 215081-II Plate 4 of 69

Location : Boring Method :UTM Coordinates : Casing Depth :
Boring Start :Boring Finish :
From
To Field
Value
, Nf
Corre
cted V
alue,
N" Grav
el (%
)
Sand
(%)
Silt (
%)
Clay
(%)
Liquid
(%)
Plasti
c (%
)Pla
sticit
y Ind
ex
(%)
Bulk
Dens
ity
(gms/c
m3 )Dr
y Den
sity
(gms/c
m3 )Mo
isture
Con
tent
(%)
Type
of Te
stCo
nfinin
g Pr
essu
res,
(kg/cm
2)
Cohe
sion
Interc
ept, '
c' (kg
/cm2 )
Angle
of In
terna
l Fri
ction
,
(degre
es)
0.00 0.50 DS1 #N/A #N/A #N/A #N/A #N/A ### #N/A #N/A #N/A #N/A #N/A #N/A #N/A #N/A
0.50 1.00 DS2 #N/A 0 21 51 28 24.6 18.5 6.0 #N/A #N/A #N/A #N/A #N/A #N/A
1.00 1.45 SPT1 12 17 #N/A #N/A #N/A #N/A ### #N/A #N/A #N/A #N/A #N/A #N/A #N/A #N/A
2.00 2.45 SPT2 17 22 0 45 48 7 ### #N/A #N/A #N/A #N/A #N/A #N/A #N/A #N/A
3.00 3.30 UDS1 #N/A 4.00 #N/A #N/A #N/A #N/A ### #N/A 1.40 1.06 32.0 DS 0.5 ,1, 1.5 0.0 38.9
4.00 4.45 SPT3 17 18 5.00 0 12 81 7 30.9 #N/A #N/A #N/A #N/A #N/A #N/A #N/A
5.00 5.45 SPT4 12 12 #N/A #N/A #N/A #N/A ### #N/A #N/A #N/A #N/A #N/A #N/A #N/A #N/A
6.00 6.30 UDS2 #N/A 0 84 16 0 ### #N/A 1.85 1.48 25.0 DS 0.5 ,1, 1.5 0.0 30.3
7.00 7.45 SPT5 23 21 #N/A #N/A #N/A #N/A ### #N/A #N/A #N/A 2.65 #N/A #N/A #N/A #N/A
8.00 8.45 SPT6 27 23 0 81 19 0 ### #N/A #N/A #N/A #N/A #N/A #N/A #N/A #N/A
9.00 9.45 SPT7 30 25 10.00 #N/A #N/A #N/A #N/A ### #N/A #N/A #N/A #N/A #N/A #N/A #N/A #N/A
10.00 10.45 SPT8 33 27 0 93 7 0 ### #N/A #N/A #N/A #N/A #N/A #N/A #N/A #N/A
40.32 m (RL 5.2 m)
RL 45.50 m
Shear TestsDensity and Moisture35.9 m
9.60 mTermination Depth :
Depth
of St
rata,
(m)
Coal Silo #4 Site402227.78 m E, 2809110.21 m N
Non Plastic
Medium dense grey silty fine sand (SM)
Ground Water Depth :
Ground Water Level :Grain Size Analysis Atterberg Limits
Surface Elevation :
Symb
olDepth, m
Samp
le No
. SOIL DESCRIPTION
SPT (1)
FILL: Flyash
Dense grey fine sand (SP-SM)
Spec
ific G
ravity
Medium dense grey sandy silt, low plastic (CL)
Soil Profile (BH-P-1)Shell & Auger39.0 m13-Jul-1514-Jul-15
(1) SPT is outside NABL scope.
Extension of Barauni Super Critical Coal Fired Thermal Power Station at Barauni, Bihar. M/s. STEAG Energy Services (India) Pvt. Ltd.
Project No. 215081-II Plate 5 of 69

Location : Boring Method :UTM Coordinates : Casing Depth :
Boring Start :Boring Finish :
From
To Field
Value
, Nf
Corre
cted V
alue,
N" Grav
el (%
)
Sand
(%)
Silt (
%)
Clay
(%)
Liquid
(%)
Plasti
c (%
)Pla
sticit
y Ind
ex
(%)
Bulk
Dens
ity
(gms/c
m3 )Dr
y Den
sity
(gms/c
m3 )Mo
isture
Con
tent
(%)
Type
of Te
stCo
nfinin
g Pr
essu
res,
(kg/cm
2)
Cohe
sion
Interc
ept, '
c' (kg
/cm2 )
Angle
of In
terna
l Fri
ction
,
(degre
es)
40.32 m (RL 5.2 m)
RL 45.50 m
Shear TestsDensity and Moisture35.9 m
9.60 mTermination Depth :
Depth
of St
rata,
(m)
Coal Silo #4 Site402227.78 m E, 2809110.21 m N Ground Water Depth :
Ground Water Level :Grain Size Analysis Atterberg Limits
Surface Elevation :
Symb
olDepth, m
Samp
le No
. SOIL DESCRIPTION
SPT (1)
Spec
ific G
ravity
Soil Profile (BH-P-1)Shell & Auger39.0 m13-Jul-1514-Jul-15
11.00 11.45 SPT9 35 28 #N/A #N/A #N/A #N/A ### #N/A #N/A #N/A #N/A #N/A #N/A #N/A #N/A
12.00 12.45 SPT10 42 33 0 90 10 0 ### #N/A #N/A #N/A #N/A #N/A #N/A #N/A #N/A
13.00 13.45 SPT11 46 35 #N/A #N/A #N/A #N/A ### #N/A #N/A #N/A #N/A #N/A #N/A #N/A #N/A
14.00 14.45 SPT12 50 38 0 94 6 0 ### #N/A #N/A #N/A #N/A #N/A #N/A #N/A #N/A
15.00 15.45 SPT13 44 33 #N/A #N/A #N/A #N/A ### #N/A #N/A #N/A #N/A #N/A #N/A #N/A #N/A
16.00 16.45 SPT14 61 45 0 96 4 0 ### #N/A #N/A #N/A #N/A #N/A #N/A #N/A #N/A
17.00 17.45 SPT15 66 48 #N/A #N/A #N/A #N/A ### #N/A #N/A #N/A #N/A #N/A #N/A #N/A #N/A
18.00 18.45 SPT16 76 54 0 95 5 0 ### #N/A #N/A #N/A #N/A #N/A #N/A #N/A #N/A
19.00 19.40 SPT17 100/ 25cm
100/ 25cm #N/A #N/A #N/A #N/A ### #N/A #N/A #N/A #N/A #N/A #N/A #N/A #N/A
20.00 20.41 SPT18 100/ 26cm
100/ 26cm 0 99 1 0 ### #N/A #N/A #N/A #N/A #N/A #N/A #N/A #N/A
21.00 21.38 SPT19 100/ 23cm
100/ 23cm #N/A #N/A #N/A #N/A ### #N/A #N/A #N/A #N/A #N/A #N/A #N/A #N/A
22.00 22.40 SPT20 100/ 25cm
100/ 25cm 0 91 9 0 ### #N/A #N/A #N/A #N/A #N/A #N/A #N/A #N/A
- SP, 20.0 to 22.0 m
Dense to very dense grey fine sand (SP-SM) - dense, 11.0 to 16.0 m
- SP-SM, 22.0 to 23.0 m
- SP, 16.0 to 18.0 m - very dense, 16.0 to 23.0 m
- SP-SM, 18.0 to 20.0 m
(1) SPT is outside NABL scope.
Extension of Barauni Super Critical Coal Fired Thermal Power Station at Barauni, Bihar. M/s. STEAG Energy Services (India) Pvt. Ltd.
Project No. 215081-II Plate 6 of 69

Location : Boring Method :UTM Coordinates : Casing Depth :
Boring Start :Boring Finish :
From
To Field
Value
, Nf
Corre
cted V
alue,
N" Grav
el (%
)
Sand
(%)
Silt (
%)
Clay
(%)
Liquid
(%)
Plasti
c (%
)Pla
sticit
y Ind
ex
(%)
Bulk
Dens
ity
(gms/c
m3 )Dr
y Den
sity
(gms/c
m3 )Mo
isture
Con
tent
(%)
Type
of Te
stCo
nfinin
g Pr
essu
res,
(kg/cm
2)
Cohe
sion
Interc
ept, '
c' (kg
/cm2 )
Angle
of In
terna
l Fri
ction
,
(degre
es)
40.32 m (RL 5.2 m)
RL 45.50 m
Shear TestsDensity and Moisture35.9 m
9.60 mTermination Depth :
Depth
of St
rata,
(m)
Coal Silo #4 Site402227.78 m E, 2809110.21 m N Ground Water Depth :
Ground Water Level :Grain Size Analysis Atterberg Limits
Surface Elevation :
Symb
olDepth, m
Samp
le No
. SOIL DESCRIPTION
SPT (1)
Spec
ific G
ravity
Soil Profile (BH-P-1)Shell & Auger39.0 m13-Jul-1514-Jul-15
23.00 23.38 SPT21 100/ 23cm
100/ 23cm #N/A #N/A #N/A #N/A ### #N/A #N/A #N/A #N/A #N/A #N/A #N/A #N/A
24.00 24.36 SPT22 100/ 21cm
100/ 21cm 0 91 9 0 ### #N/A #N/A #N/A #N/A #N/A #N/A #N/A #N/A
25.00 25.38 SPT23 100/ 23cm
100/ 23cm #N/A #N/A #N/A #N/A ### #N/A #N/A #N/A #N/A #N/A #N/A #N/A #N/A
26.00 26.35 SPT24 100/ 20cm
100/ 20cm 0 88 12 0 ### #N/A #N/A #N/A #N/A #N/A #N/A #N/A #N/A
27.00 27.40 SPT25 100/ 25cm
100/ 25cm #N/A #N/A #N/A #N/A ### #N/A #N/A #N/A #N/A #N/A #N/A #N/A #N/A
28.00 28.38 SPT26 100/ 23cm
100/ 23cm 0 90 10 0 ### #N/A #N/A #N/A #N/A #N/A #N/A #N/A #N/A
29.00 29.35 SPT27 100/ 20cm
100/ 20cm #N/A #N/A #N/A #N/A ### #N/A #N/A #N/A #N/A #N/A #N/A #N/A #N/A
30.00 30.35 SPT28 100/ 20cm
100/ 20cm 0 92 8 0 ### #N/A #N/A #N/A #N/A #N/A #N/A #N/A #N/A
31.00 31.38 SPT29 100/ 23cm
100/ 23cm #N/A #N/A #N/A #N/A ### #N/A #N/A #N/A #N/A #N/A #N/A #N/A #N/A
32.00 32.36 SPT30 100/ 21cm
100/ 21cm #N/A #N/A #N/A #N/A ### #N/A #N/A #N/A #N/A #N/A #N/A #N/A #N/A
33.00 33.38 SPT31 100/ 23cm
100/ 23cm 0 91 9 0 ### #N/A #N/A #N/A #N/A #N/A #N/A #N/A #N/A
34.00 34.35 SPT32 100/ 20cm
100/ 20cm #N/A #N/A #N/A #N/A ### #N/A #N/A #N/A #N/A #N/A #N/A #N/A #N/A
Very dense grey fine sand (SP-SM)
(1) SPT is outside NABL scope.
Extension of Barauni Super Critical Coal Fired Thermal Power Station at Barauni, Bihar. M/s. STEAG Energy Services (India) Pvt. Ltd.
Project No. 215081-II Plate 7 of 69

Location : Boring Method :UTM Coordinates : Casing Depth :
Boring Start :Boring Finish :
From
To Field
Value
, Nf
Corre
cted V
alue,
N" Grav
el (%
)
Sand
(%)
Silt (
%)
Clay
(%)
Liquid
(%)
Plasti
c (%
)Pla
sticit
y Ind
ex
(%)
Bulk
Dens
ity
(gms/c
m3 )Dr
y Den
sity
(gms/c
m3 )Mo
isture
Con
tent
(%)
Type
of Te
stCo
nfinin
g Pr
essu
res,
(kg/cm
2)
Cohe
sion
Interc
ept, '
c' (kg
/cm2 )
Angle
of In
terna
l Fri
ction
,
(degre
es)
40.32 m (RL 5.2 m)
RL 45.50 m
Shear TestsDensity and Moisture35.9 m
9.60 mTermination Depth :
Depth
of St
rata,
(m)
Coal Silo #4 Site402227.78 m E, 2809110.21 m N Ground Water Depth :
Ground Water Level :Grain Size Analysis Atterberg Limits
Surface Elevation :
Symb
olDepth, m
Samp
le No
. SOIL DESCRIPTION
SPT (1)
Spec
ific G
ravity
Soil Profile (BH-P-1)Shell & Auger39.0 m13-Jul-1514-Jul-15
35.00 35.35 SPT33 100/ 20cm
100/ 20cm 0 91 9 0 ### #N/A #N/A #N/A #N/A #N/A #N/A #N/A #N/A
36.00 36.39 SPT34 100/ 24cm
100/ 24cm #N/A #N/A #N/A #N/A ### #N/A #N/A #N/A #N/A #N/A #N/A #N/A #N/A
37.00 37.33 SPT35 100/ 18cm
100/ 18cm 0 92 8 0 ### #N/A #N/A #N/A #N/A #N/A #N/A #N/A #N/A
38.00 38.35 SPT36 100/ 20cm
100/ 20cm #N/A #N/A #N/A #N/A ### #N/A #N/A #N/A #N/A #N/A #N/A #N/A #N/A
39.00 39.33 SPT37 100/ 18cm
100/ 18cm 0 92 8 0 ### #N/A #N/A #N/A #N/A #N/A #N/A #N/A #N/A
40.00 40.32 SPT38 100/ 17cm
100/ 17cm 40.45 #N/A #N/A #N/A #N/A ### #N/A #N/A #N/A #N/A #N/A #N/A #N/A #N/A
#N/A #N/A #N/A #N/A #N/A #N/A #N/A ### #N/A #N/A #N/A #N/A #N/A #N/A #N/A #N/A
#N/A #N/A #N/A #N/A #N/A #N/A #N/A ### #N/A #N/A #N/A #N/A #N/A #N/A #N/A #N/A
#N/A #N/A #N/A #N/A #N/A #N/A #N/A ### #N/A #N/A #N/A #N/A #N/A #N/A #N/A #N/A
#N/A #N/A #N/A #N/A #N/A #N/A #N/A ### #N/A #N/A #N/A #N/A #N/A #N/A #N/A #N/A
#N/A #N/A #N/A #N/A #N/A #N/A #N/A ### #N/A #N/A #N/A #N/A #N/A #N/A #N/A #N/A
#N/A #N/A #N/A #N/A #N/A #N/A #N/A ### #N/A #N/A #N/A #N/A #N/A #N/A #N/A #N/A
Very dense grey fine sand (SP-SM)
(1) SPT is outside NABL scope.
Extension of Barauni Super Critical Coal Fired Thermal Power Station at Barauni, Bihar. M/s. STEAG Energy Services (India) Pvt. Ltd.
Project No. 215081-II Plate 8 of 69

Location : Boring Method :UTM Coordinates : Casing Depth :
Boring Start :Boring Finish :
From
To Field
Value
, Nf
Corre
cted V
alue,
N" Grav
el (%
)
Sand
(%)
Silt (
%)
Clay
(%)
Liquid
(%)
Plasti
c (%
)Pla
sticit
y Ind
ex
(%)
Bulk
Dens
ity
(gms/c
m3 )Dr
y Den
sity
(gms/c
m3 )Mo
isture
Con
tent
(%)
Type
of Te
stCo
nfinin
g Pr
essu
res,
(kg/cm
2)
Cohe
sion
Interc
ept, '
c' (kg
/cm2 )
Angle
of In
terna
l Fri
ction
,
(degre
es)
0.00 1.00 DS1 #N/A #N/A #N/A #N/A #N/A ### #N/A #N/A #N/A #N/A #N/A #N/A #N/A
1.00 1.45 SPT1 8 12 0 19 74 7 31.8 20.3 11.4 #N/A #N/A #N/A #N/A #N/A #N/A #N/A
2.00 2.45 SPT2 10 13 #N/A #N/A #N/A #N/A ### #N/A #N/A #N/A #N/A #N/A #N/A #N/A #N/A
3.00 3.30 UDS1 #N/A 4.00 0 42 44 14 ### #N/A 1.46 1.07 35.8 DS 0.5 ,1, 1.5 0.0 30.6
4.00 4.45 SPT3 7 8 #N/A #N/A #N/A #N/A ### #N/A #N/A #N/A #N/A #N/A #N/A #N/A #N/A
5.00 5.45 SPT4 8 8 0 10 80 10 ### #N/A #N/A #N/A 2.62 #N/A #N/A #N/A #N/A
6.00 6.30 UDS2 #N/A 7.00 #N/A #N/A #N/A #N/A 31.7 24.0 7.7 1.92 1.52 26.2 UC - 1.7 #N/A
7.00 7.45 SPT5 5 5 0 3 77 20 43.6 22.6 21.0 #N/A #N/A #N/A #N/A #N/A #N/A #N/A
8.00 8.45 SPT6 5 5 #N/A #N/A #N/A #N/A 39.3 25.0 14.3 #N/A #N/A #N/A #N/A #N/A #N/A #N/A
9.00 9.45 SPT7 6 6 10.00 0 3 79 18 40.9 21.3 19.6 #N/A #N/A #N/A #N/A #N/A #N/A #N/A
10.00 10.45 SPT8 9 7 #N/A #N/A #N/A #N/A ### #N/A #N/A #N/A #N/A #N/A #N/A #N/A #N/A
11.00 11.45 SPT9 26 21 12.00 0 24 61 15 30.8 20.7 10.1 #N/A #N/A #N/A #N/A #N/A #N/A #N/A
40.34 m (RL 5.2 m)
RL 45.50 m
Shear TestsDensity and Moisture35.4 m
10.10 mTermination Depth :Ground Water Depth :
Ground Water Level :Atterberg LimitsGrain Size Analysis
Chimney Site401627.08 m E, 2808823.46 m N
Depth
of St
rata,
(m)
Surface Elevation :
FILL: Flyash
- loose, 10.0 to 11.0 m - medium dense, 11.0 to 12.0 m
Symb
ol
Firm grey clayey silt, medium plastic (CI)
Depth, m
Samp
le No
. SOIL DESCRIPTION
SPT (1)
Loose to medium dense grey sandy silt, low plastic (CL)
Spec
ific G
ravity
Loose grey sandy silt, low plastic (CL)
Soil Profile (BH-P-2)Shell & Auger38.5 m02-Jul-1506-Jul-15
(1) SPT is outside NABL scope.
Extension of Barauni Super Critical Coal Fired Thermal Power Station at Barauni, Bihar. M/s. STEAG Energy Services (India) Pvt. Ltd.
Project No. 215081-II Plate 9 of 69

Location : Boring Method :UTM Coordinates : Casing Depth :
Boring Start :Boring Finish :
From
To Field
Value
, Nf
Corre
cted V
alue,
N" Grav
el (%
)
Sand
(%)
Silt (
%)
Clay
(%)
Liquid
(%)
Plasti
c (%
)Pla
sticit
y Ind
ex
(%)
Bulk
Dens
ity
(gms/c
m3 )Dr
y Den
sity
(gms/c
m3 )Mo
isture
Con
tent
(%)
Type
of Te
stCo
nfinin
g Pr
essu
res,
(kg/cm
2)
Cohe
sion
Interc
ept, '
c' (kg
/cm2 )
Angle
of In
terna
l Fri
ction
,
(degre
es)
40.34 m (RL 5.2 m)
RL 45.50 m
Shear TestsDensity and Moisture35.4 m
10.10 mTermination Depth :Ground Water Depth :
Ground Water Level :Atterberg LimitsGrain Size Analysis
Chimney Site401627.08 m E, 2808823.46 m N
Depth
of St
rata,
(m)
Surface Elevation :
Symb
olDepth, m
Samp
le No
. SOIL DESCRIPTION
SPT (1)
Spec
ific G
ravity
Soil Profile (BH-P-2)Shell & Auger38.5 m02-Jul-1506-Jul-15
12.00 12.45 SPT10 32 25 #N/A #N/A #N/A #N/A ### #N/A #N/A #N/A #N/A #N/A #N/A #N/A #N/A
13.00 13.45 SPT11 32 24 0 92 8 0 ### #N/A #N/A #N/A #N/A #N/A #N/A #N/A #N/A
14.00 14.38 SPT12 100/ 23cm
100/ 23cm #N/A #N/A #N/A #N/A ### #N/A #N/A #N/A #N/A #N/A #N/A #N/A #N/A
15.00 15.36 SPT13 100/ 21cm
100/ 21cm 0 94 6 0 ### #N/A #N/A #N/A #N/A #N/A #N/A #N/A #N/A
16.00 16.34 SPT14 100/ 19cm
100/ 19cm #N/A #N/A #N/A #N/A ### #N/A #N/A #N/A #N/A #N/A #N/A #N/A #N/A
17.00 17.37 SPT15 100/ 22cm
100/ 22cm 0 96 4 0 ### #N/A #N/A #N/A #N/A #N/A #N/A #N/A #N/A
18.00 18.42 SPT16 100/ 27cm
100/ 27cm #N/A #N/A #N/A #N/A ### #N/A #N/A #N/A #N/A #N/A #N/A #N/A #N/A
19.00 19.44 SPT17 100/ 29cm
100/ 29cm 0 95 5 0 ### #N/A #N/A #N/A #N/A #N/A #N/A #N/A #N/A
20.00 20.42 SPT18 100/ 27cm
100/ 27cm #N/A #N/A #N/A #N/A ### #N/A #N/A #N/A #N/A #N/A #N/A #N/A #N/A
21.00 21.40 SPT19 100/ 25cm
100/ 25cm 0 94 6 0 ### #N/A #N/A #N/A #N/A #N/A #N/A #N/A #N/A
22.00 22.43 SPT20 100/ 28cm
100/ 28cm #N/A #N/A #N/A #N/A ### #N/A #N/A #N/A #N/A #N/A #N/A #N/A #N/A
23.00 23.40 SPT21 100/ 25cm
100/ 25cm 0 98 2 0 ### #N/A #N/A #N/A #N/A #N/A #N/A #N/A #N/A
Dense to very dense grey fine sand (SP-SM) - dense, 12.0 to 14.0 m
- very dense, 14.0 to 24.0 m
- SP, 23.0 to 24.0 m
- SP-SM, 19.0 to 23.0 m
- SP, 17.0 to 19.0 m
(1) SPT is outside NABL scope.
Extension of Barauni Super Critical Coal Fired Thermal Power Station at Barauni, Bihar. M/s. STEAG Energy Services (India) Pvt. Ltd.
Project No. 215081-II Plate 10 of 69

Location : Boring Method :UTM Coordinates : Casing Depth :
Boring Start :Boring Finish :
From
To Field
Value
, Nf
Corre
cted V
alue,
N" Grav
el (%
)
Sand
(%)
Silt (
%)
Clay
(%)
Liquid
(%)
Plasti
c (%
)Pla
sticit
y Ind
ex
(%)
Bulk
Dens
ity
(gms/c
m3 )Dr
y Den
sity
(gms/c
m3 )Mo
isture
Con
tent
(%)
Type
of Te
stCo
nfinin
g Pr
essu
res,
(kg/cm
2)
Cohe
sion
Interc
ept, '
c' (kg
/cm2 )
Angle
of In
terna
l Fri
ction
,
(degre
es)
40.34 m (RL 5.2 m)
RL 45.50 m
Shear TestsDensity and Moisture35.4 m
10.10 mTermination Depth :Ground Water Depth :
Ground Water Level :Atterberg LimitsGrain Size Analysis
Chimney Site401627.08 m E, 2808823.46 m N
Depth
of St
rata,
(m)
Surface Elevation :
Symb
olDepth, m
Samp
le No
. SOIL DESCRIPTION
SPT (1)
Spec
ific G
ravity
Soil Profile (BH-P-2)Shell & Auger38.5 m02-Jul-1506-Jul-15
24.00 24.40 SPT22 100/ 25cm
100/ 25cm #N/A #N/A #N/A #N/A ### #N/A #N/A #N/A #N/A #N/A #N/A #N/A #N/A
25.00 25.44 SPT23 100/ 29cm
100/ 29cm 0 96 4 0 ### #N/A #N/A #N/A #N/A #N/A #N/A #N/A #N/A
26.00 26.41 SPT24 100/ 26cm
100/ 26cm #N/A #N/A #N/A #N/A ### #N/A #N/A #N/A #N/A #N/A #N/A #N/A #N/A
27.00 27.39 SPT25 100/ 24cm
100/ 24cm 0 96 4 0 ### #N/A #N/A #N/A #N/A #N/A #N/A #N/A #N/A
28.00 28.37 SPT26 100/ 22cm
100/ 22cm #N/A #N/A #N/A #N/A ### #N/A #N/A #N/A #N/A #N/A #N/A #N/A #N/A
29.00 29.37 SPT27 100/ 22cm
100/ 22cm 0 96 4 0 ### #N/A #N/A #N/A #N/A #N/A #N/A #N/A #N/A
30.00 30.35 SPT28 100/ 20cm
100/ 20cm #N/A #N/A #N/A #N/A ### #N/A #N/A #N/A #N/A #N/A #N/A #N/A #N/A
31.00 31.38 SPT29 100/ 23cm
100/ 23cm 0 95 5 0 ### #N/A #N/A #N/A #N/A #N/A #N/A #N/A #N/A
32.00 32.40 SPT30 100/ 25cm
100/ 25cm #N/A #N/A #N/A #N/A ### #N/A #N/A #N/A #N/A #N/A #N/A #N/A #N/A
33.00 33.41 SPT31 100/ 26cm
100/ 26cm #N/A #N/A #N/A #N/A ### #N/A #N/A #N/A #N/A #N/A #N/A #N/A #N/A
34.00 34.37 SPT32 100/ 22cm
100/ 22cm 1 95 4 0 ### #N/A #N/A #N/A #N/A #N/A #N/A #N/A #N/A
35.00 35.35 SPT33 100/ 20cm
100/ 20cm #N/A #N/A #N/A #N/A ### #N/A #N/A #N/A #N/A #N/A #N/A #N/A #N/A
- SP, 34.0 to 36.0 m - with traces of gravel, 34.0 to 35.0 m
Very dense grey fine sand (SP)
- SP-SM, 31.0 to 34.0 m
(1) SPT is outside NABL scope.
Extension of Barauni Super Critical Coal Fired Thermal Power Station at Barauni, Bihar. M/s. STEAG Energy Services (India) Pvt. Ltd.
Project No. 215081-II Plate 11 of 69

Location : Boring Method :UTM Coordinates : Casing Depth :
Boring Start :Boring Finish :
From
To Field
Value
, Nf
Corre
cted V
alue,
N" Grav
el (%
)
Sand
(%)
Silt (
%)
Clay
(%)
Liquid
(%)
Plasti
c (%
)Pla
sticit
y Ind
ex
(%)
Bulk
Dens
ity
(gms/c
m3 )Dr
y Den
sity
(gms/c
m3 )Mo
isture
Con
tent
(%)
Type
of Te
stCo
nfinin
g Pr
essu
res,
(kg/cm
2)
Cohe
sion
Interc
ept, '
c' (kg
/cm2 )
Angle
of In
terna
l Fri
ction
,
(degre
es)
40.34 m (RL 5.2 m)
RL 45.50 m
Shear TestsDensity and Moisture35.4 m
10.10 mTermination Depth :Ground Water Depth :
Ground Water Level :Atterberg LimitsGrain Size Analysis
Chimney Site401627.08 m E, 2808823.46 m N
Depth
of St
rata,
(m)
Surface Elevation :
Symb
olDepth, m
Samp
le No
. SOIL DESCRIPTION
SPT (1)
Spec
ific G
ravity
Soil Profile (BH-P-2)Shell & Auger38.5 m02-Jul-1506-Jul-15
36.00 36.33 SPT34 100/ 18cm
100/ 18cm 0 89 11 0 ### #N/A #N/A #N/A #N/A #N/A #N/A #N/A #N/A
37.00 37.39 SPT35 100/ 24cm
100/ 24cm #N/A #N/A #N/A #N/A ### #N/A #N/A #N/A #N/A #N/A #N/A #N/A #N/A
38.00 38.38 SPT36 100/ 23cm
100/ 23cm 6 89 5 0 ### #N/A #N/A #N/A #N/A #N/A #N/A #N/A #N/A
39.00 39.37 SPT37 100/ 22cm
100/ 22cm #N/A #N/A #N/A #N/A ### #N/A #N/A #N/A #N/A #N/A #N/A #N/A #N/A
40.00 40.34 SPT38 100/ 19cm
100/ 19cm 40.34 4 87 9 0 ### #N/A #N/A #N/A #N/A #N/A #N/A #N/A #N/A
#N/A #N/A #N/A #N/A #N/A #N/A #N/A ### #N/A #N/A #N/A #N/A #N/A #N/A #N/A #N/A
#N/A #N/A #N/A #N/A #N/A #N/A #N/A ### #N/A #N/A #N/A #N/A #N/A #N/A #N/A #N/A
#N/A #N/A #N/A #N/A #N/A #N/A #N/A ### #N/A #N/A #N/A #N/A #N/A #N/A #N/A #N/A
#N/A #N/A #N/A #N/A #N/A #N/A #N/A ### #N/A #N/A #N/A #N/A #N/A #N/A #N/A #N/A
#N/A #N/A #N/A #N/A #N/A #N/A #N/A ### #N/A #N/A #N/A #N/A #N/A #N/A #N/A #N/A
#N/A #N/A #N/A #N/A #N/A #N/A #N/A ### #N/A #N/A #N/A #N/A #N/A #N/A #N/A #N/A
#N/A #N/A #N/A #N/A #N/A #N/A #N/A ### #N/A #N/A #N/A #N/A #N/A #N/A #N/A #N/A
- with traces of gravel, 40.0 to 40.34 m
- with gravel, 38.0 to 39.0 m
Very dense grey fine sand (SP-SM)
(1) SPT is outside NABL scope.
Extension of Barauni Super Critical Coal Fired Thermal Power Station at Barauni, Bihar. M/s. STEAG Energy Services (India) Pvt. Ltd.
Project No. 215081-II Plate 12 of 69
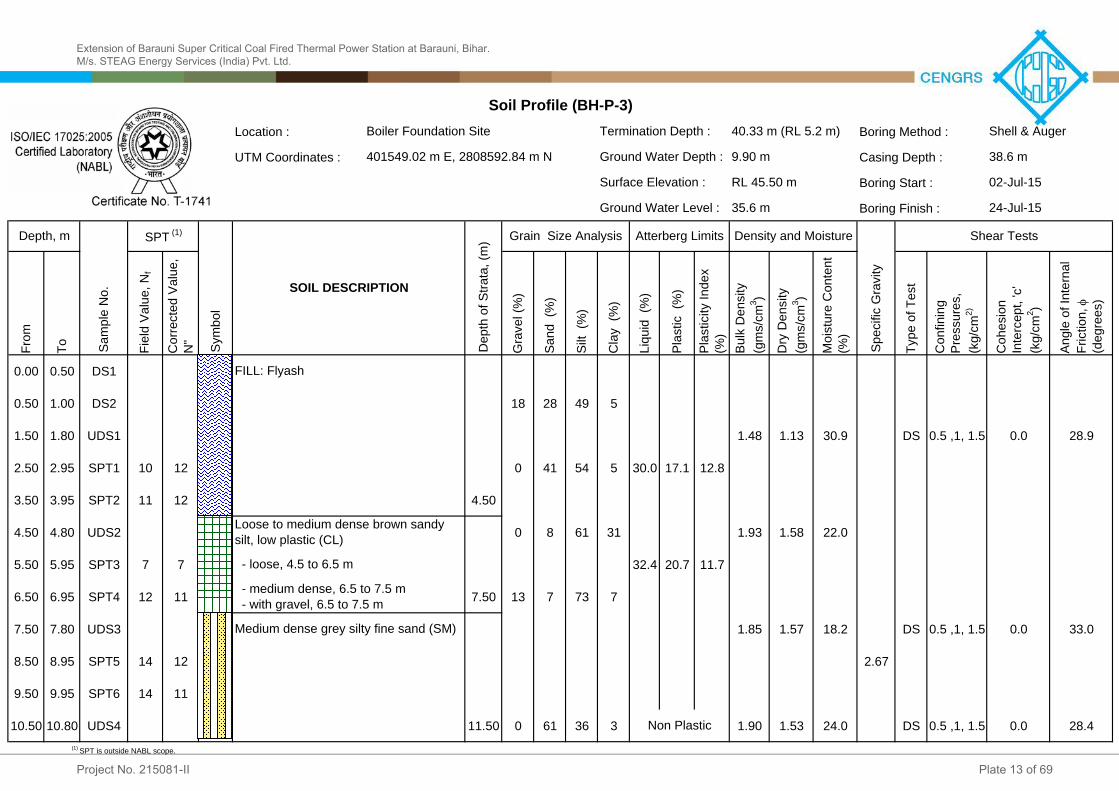
Location : Boring Method :UTM Coordinates : Casing Depth :
Boring Start :Boring Finish :
From
To Field
Value
, Nf
Corre
cted V
alue,
N" Grav
el (%
)
Sand
(%)
Silt (
%)
Clay
(%)
Liquid
(%)
Plasti
c (%
)Pla
sticit
y Ind
ex
(%)
Bulk
Dens
ity
(gms/c
m3 )Dr
y Den
sity
(gms/c
m3 )Mo
isture
Con
tent
(%)
Type
of Te
stCo
nfinin
g Pr
essu
res,
(kg/cm
2)
Cohe
sion
Interc
ept, '
c' (kg
/cm2 )
Angle
of In
terna
l Fri
ction
,
(degre
es)
0.00 0.50 DS1 #N/A #N/A #N/A #N/A #N/A ### #N/A #N/A #N/A #N/A #N/A #N/A #N/A
0.50 1.00 DS2 #N/A 18 28 49 5 ### #N/A #N/A #N/A #N/A #N/A #N/A #N/A
1.50 1.80 UDS1 #N/A #N/A #N/A #N/A #N/A ### #N/A 1.48 1.13 30.9 DS 0.5 ,1, 1.5 0.0 28.9
2.50 2.95 SPT1 10 12 0 41 54 5 30.0 17.1 12.8 #N/A #N/A #N/A #N/A #N/A #N/A #N/A
3.50 3.95 SPT2 11 12 4.50 #N/A #N/A #N/A #N/A ### #N/A #N/A #N/A #N/A #N/A #N/A #N/A #N/A
4.50 4.80 UDS2 #N/A 0 8 61 31 ### #N/A 1.93 1.58 22.0 #N/A #N/A #N/A #N/A
5.50 5.95 SPT3 7 7 #N/A #N/A #N/A #N/A 32.4 20.7 11.7 #N/A #N/A #N/A #N/A #N/A #N/A #N/A
6.50 6.95 SPT4 12 11 7.50 13 7 73 7 ### #N/A #N/A #N/A #N/A #N/A #N/A #N/A #N/A
7.50 7.80 UDS3 #N/A #N/A #N/A #N/A #N/A ### #N/A 1.85 1.57 18.2 DS 0.5 ,1, 1.5 0.0 33.0
8.50 8.95 SPT5 14 12 #N/A #N/A #N/A #N/A ### #N/A #N/A #N/A 2.67 #N/A #N/A #N/A #N/A
9.50 9.95 SPT6 14 11 #N/A #N/A #N/A #N/A ### #N/A #N/A #N/A #N/A #N/A #N/A #N/A #N/A
10.50 10.80 UDS4 #N/A 11.50 0 61 36 3 1.90 1.53 24.0 DS 0.5 ,1, 1.5 0.0 28.4
40.33 m (RL 5.2 m)
RL 45.50 m
Shear TestsDensity and Moisture35.6 m
9.90 mTermination Depth :Ground Water Depth :
Ground Water Level :Atterberg LimitsGrain Size Analysis
Boiler Foundation Site401549.02 m E, 2808592.84 m N
Depth
of St
rata,
(m)
Surface Elevation :
FILL: Flyash
Non Plastic
Medium dense grey silty fine sand (SM)
- loose, 4.5 to 6.5 m
Symb
ol
- medium dense, 6.5 to 7.5 m - with gravel, 6.5 to 7.5 m
Depth, m
Samp
le No
. SOIL DESCRIPTION
SPT (1)
Spec
ific G
ravity
Loose to medium dense brown sandy silt, low plastic (CL)
Soil Profile (BH-P-3)Shell & Auger38.6 m02-Jul-1524-Jul-15
(1) SPT is outside NABL scope.
Extension of Barauni Super Critical Coal Fired Thermal Power Station at Barauni, Bihar. M/s. STEAG Energy Services (India) Pvt. Ltd.
Project No. 215081-II Plate 13 of 69

Location : Boring Method :UTM Coordinates : Casing Depth :
Boring Start :Boring Finish :
From
To Field
Value
, Nf
Corre
cted V
alue,
N" Grav
el (%
)
Sand
(%)
Silt (
%)
Clay
(%)
Liquid
(%)
Plasti
c (%
)Pla
sticit
y Ind
ex
(%)
Bulk
Dens
ity
(gms/c
m3 )Dr
y Den
sity
(gms/c
m3 )Mo
isture
Con
tent
(%)
Type
of Te
stCo
nfinin
g Pr
essu
res,
(kg/cm
2)
Cohe
sion
Interc
ept, '
c' (kg
/cm2 )
Angle
of In
terna
l Fri
ction
,
(degre
es)
40.33 m (RL 5.2 m)
RL 45.50 m
Shear TestsDensity and Moisture35.6 m
9.90 mTermination Depth :Ground Water Depth :
Ground Water Level :Atterberg LimitsGrain Size Analysis
Boiler Foundation Site401549.02 m E, 2808592.84 m N
Depth
of St
rata,
(m)
Surface Elevation :
Symb
olDepth, m
Samp
le No
. SOIL DESCRIPTION
SPT (1)
Spec
ific G
ravity
Soil Profile (BH-P-3)Shell & Auger38.6 m02-Jul-1524-Jul-15
11.50 11.95 SPT7 15 12 #N/A #N/A #N/A #N/A ### #N/A #N/A #N/A #N/A #N/A #N/A #N/A #N/A
12.50 12.95 SPT8 17 13 0 91 9 0 ### #N/A #N/A #N/A #N/A #N/A #N/A #N/A #N/A
13.50 13.95 SPT9 26 20 #N/A #N/A #N/A #N/A ### #N/A #N/A #N/A #N/A #N/A #N/A #N/A #N/A
14.50 14.95 SPT10 32 24 0 89 11 0 ### #N/A #N/A #N/A #N/A #N/A #N/A #N/A #N/A
15.50 15.95 SPT11 38 28 16.50 #N/A #N/A #N/A #N/A ### #N/A #N/A #N/A #N/A #N/A #N/A #N/A #N/A
16.50 16.95 SPT12 45 32 0 87 13 0 ### #N/A #N/A #N/A #N/A #N/A #N/A #N/A #N/A
17.50 17.95 SPT13 50 35 18.50 #N/A #N/A #N/A #N/A ### #N/A #N/A #N/A #N/A #N/A #N/A #N/A #N/A
18.50 18.95 SPT14 56 39 0 88 12 0 ### #N/A #N/A #N/A #N/A #N/A #N/A #N/A #N/A
19.50 19.95 SPT15 66 45 #N/A #N/A #N/A #N/A ### #N/A #N/A #N/A #N/A #N/A #N/A #N/A #N/A
20.50 20.95 SPT16 70 47 0 93 7 0 ### #N/A #N/A #N/A #N/A #N/A #N/A #N/A #N/A
21.50 21.88 SPT17 100/ 23cm
100/ 23cm #N/A #N/A #N/A #N/A ### #N/A #N/A #N/A #N/A #N/A #N/A #N/A #N/A
22.50 22.90 SPT18 100/ 25cm
100/ 25cm 0 90 10 0 ### #N/A #N/A #N/A #N/A #N/A #N/A #N/A #N/A
Medium dense to dense grey fine sand (SP-SM) - medium dense, 11.5 to 14.5 m
- dense, 14.5 to 16.5 m
Very dense grey fine sand (SP-SM)
Dense grey silty fine sand (SM)
(1) SPT is outside NABL scope.
Extension of Barauni Super Critical Coal Fired Thermal Power Station at Barauni, Bihar. M/s. STEAG Energy Services (India) Pvt. Ltd.
Project No. 215081-II Plate 14 of 69
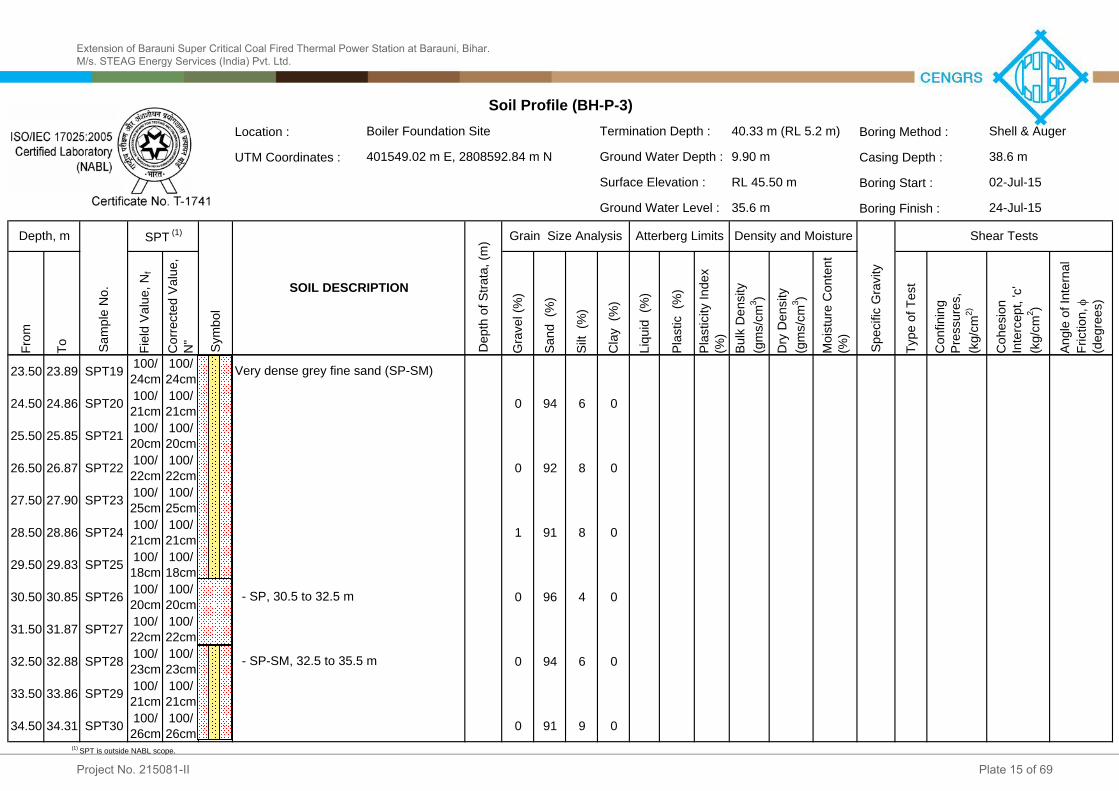
Location : Boring Method :UTM Coordinates : Casing Depth :
Boring Start :Boring Finish :
From
To Field
Value
, Nf
Corre
cted V
alue,
N" Grav
el (%
)
Sand
(%)
Silt (
%)
Clay
(%)
Liquid
(%)
Plasti
c (%
)Pla
sticit
y Ind
ex
(%)
Bulk
Dens
ity
(gms/c
m3 )Dr
y Den
sity
(gms/c
m3 )Mo
isture
Con
tent
(%)
Type
of Te
stCo
nfinin
g Pr
essu
res,
(kg/cm
2)
Cohe
sion
Interc
ept, '
c' (kg
/cm2 )
Angle
of In
terna
l Fri
ction
,
(degre
es)
40.33 m (RL 5.2 m)
RL 45.50 m
Shear TestsDensity and Moisture35.6 m
9.90 mTermination Depth :Ground Water Depth :
Ground Water Level :Atterberg LimitsGrain Size Analysis
Boiler Foundation Site401549.02 m E, 2808592.84 m N
Depth
of St
rata,
(m)
Surface Elevation :
Symb
olDepth, m
Samp
le No
. SOIL DESCRIPTION
SPT (1)
Spec
ific G
ravity
Soil Profile (BH-P-3)Shell & Auger38.6 m02-Jul-1524-Jul-15
23.50 23.89 SPT19 100/ 24cm
100/ 24cm #N/A #N/A #N/A #N/A ### #N/A #N/A #N/A #N/A #N/A #N/A #N/A #N/A
24.50 24.86 SPT20 100/ 21cm
100/ 21cm 0 94 6 0 ### #N/A #N/A #N/A #N/A #N/A #N/A #N/A #N/A
25.50 25.85 SPT21 100/ 20cm
100/ 20cm #N/A #N/A #N/A #N/A ### #N/A #N/A #N/A #N/A #N/A #N/A #N/A #N/A
26.50 26.87 SPT22 100/ 22cm
100/ 22cm 0 92 8 0 ### #N/A #N/A #N/A #N/A #N/A #N/A #N/A #N/A
27.50 27.90 SPT23 100/ 25cm
100/ 25cm #N/A #N/A #N/A #N/A ### #N/A #N/A #N/A #N/A #N/A #N/A #N/A #N/A
28.50 28.86 SPT24 100/ 21cm
100/ 21cm 1 91 8 0 ### #N/A #N/A #N/A #N/A #N/A #N/A #N/A #N/A
29.50 29.83 SPT25 100/ 18cm
100/ 18cm #N/A #N/A #N/A #N/A ### #N/A #N/A #N/A #N/A #N/A #N/A #N/A #N/A
30.50 30.85 SPT26 100/ 20cm
100/ 20cm 0 96 4 0 ### #N/A #N/A #N/A #N/A #N/A #N/A #N/A #N/A
31.50 31.87 SPT27 100/ 22cm
100/ 22cm #N/A #N/A #N/A #N/A ### #N/A #N/A #N/A #N/A #N/A #N/A #N/A #N/A
32.50 32.88 SPT28 100/ 23cm
100/ 23cm 0 94 6 0 ### #N/A #N/A #N/A #N/A #N/A #N/A #N/A #N/A
33.50 33.86 SPT29 100/ 21cm
100/ 21cm #N/A #N/A #N/A #N/A ### #N/A #N/A #N/A #N/A #N/A #N/A #N/A #N/A
34.50 34.31 SPT30 100/ 26cm
100/ 26cm 0 91 9 0 ### #N/A #N/A #N/A #N/A #N/A #N/A #N/A #N/A
- SP-SM, 32.5 to 35.5 m
Very dense grey fine sand (SP-SM)
- SP, 30.5 to 32.5 m
(1) SPT is outside NABL scope.
Extension of Barauni Super Critical Coal Fired Thermal Power Station at Barauni, Bihar. M/s. STEAG Energy Services (India) Pvt. Ltd.
Project No. 215081-II Plate 15 of 69

Location : Boring Method :UTM Coordinates : Casing Depth :
Boring Start :Boring Finish :
From
To Field
Value
, Nf
Corre
cted V
alue,
N" Grav
el (%
)
Sand
(%)
Silt (
%)
Clay
(%)
Liquid
(%)
Plasti
c (%
)Pla
sticit
y Ind
ex
(%)
Bulk
Dens
ity
(gms/c
m3 )Dr
y Den
sity
(gms/c
m3 )Mo
isture
Con
tent
(%)
Type
of Te
stCo
nfinin
g Pr
essu
res,
(kg/cm
2)
Cohe
sion
Interc
ept, '
c' (kg
/cm2 )
Angle
of In
terna
l Fri
ction
,
(degre
es)
40.33 m (RL 5.2 m)
RL 45.50 m
Shear TestsDensity and Moisture35.6 m
9.90 mTermination Depth :Ground Water Depth :
Ground Water Level :Atterberg LimitsGrain Size Analysis
Boiler Foundation Site401549.02 m E, 2808592.84 m N
Depth
of St
rata,
(m)
Surface Elevation :
Symb
olDepth, m
Samp
le No
. SOIL DESCRIPTION
SPT (1)
Spec
ific G
ravity
Soil Profile (BH-P-3)Shell & Auger38.6 m02-Jul-1524-Jul-15
35.50 35.90 SPT31 100/ 25cm
100/ 25cm #N/A #N/A #N/A #N/A ### #N/A #N/A #N/A #N/A #N/A #N/A #N/A #N/A
36.50 36.82 SPT32 100/ 27cm
100/ 27cm 0 96 4 0 ### #N/A #N/A #N/A #N/A #N/A #N/A #N/A #N/A
37.50 37.85 SPT33 100/ 20cm
100/ 20cm #N/A #N/A #N/A #N/A ### #N/A #N/A #N/A #N/A #N/A #N/A #N/A #N/A
38.50 38.80 SPT34 100/ 15cm
100/ 15cm 0 95 5 0 ### #N/A #N/A #N/A #N/A #N/A #N/A #N/A #N/A
40.00 40.33 SPT35 100/ 18cm
100/ 18cm 40.33 #N/A #N/A #N/A #N/A ### #N/A #N/A #N/A #N/A #N/A #N/A #N/A #N/A
#N/A #N/A #N/A #N/A #N/A #N/A #N/A ### #N/A #N/A #N/A #N/A #N/A #N/A #N/A #N/A
#N/A #N/A #N/A #N/A #N/A #N/A #N/A ### #N/A #N/A #N/A #N/A #N/A #N/A #N/A #N/A
#N/A #N/A #N/A #N/A #N/A #N/A #N/A ### #N/A #N/A #N/A #N/A #N/A #N/A #N/A #N/A
#N/A #N/A #N/A #N/A #N/A #N/A #N/A ### #N/A #N/A #N/A #N/A #N/A #N/A #N/A #N/A
#N/A #N/A #N/A #N/A #N/A #N/A #N/A ### #N/A #N/A #N/A #N/A #N/A #N/A #N/A #N/A
#N/A #N/A #N/A #N/A #N/A #N/A #N/A ### #N/A #N/A #N/A #N/A #N/A #N/A #N/A #N/A
#N/A #N/A #N/A #N/A #N/A #N/A #N/A ### #N/A #N/A #N/A #N/A #N/A #N/A #N/A #N/A
Very dense grey fine sand (SP)
- SP-SM, 38.5 to 40.33 m
(1) SPT is outside NABL scope.
Extension of Barauni Super Critical Coal Fired Thermal Power Station at Barauni, Bihar. M/s. STEAG Energy Services (India) Pvt. Ltd.
Project No. 215081-II Plate 16 of 69
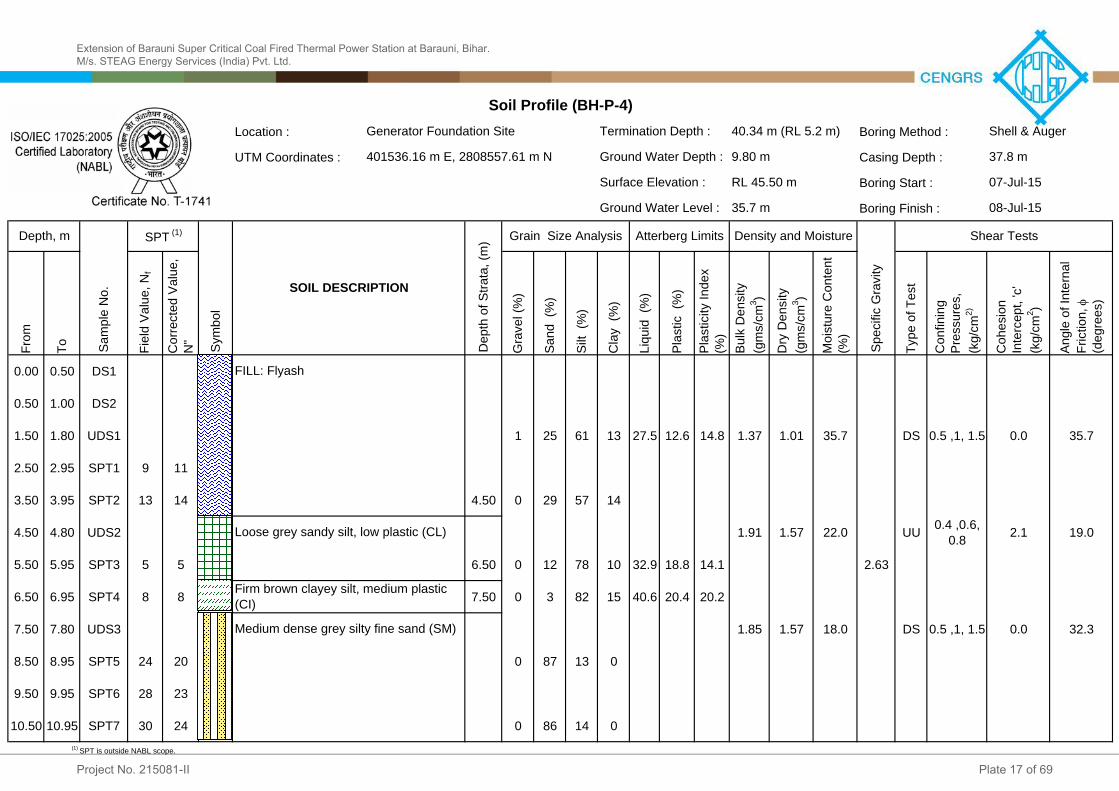
Location : Boring Method :UTM Coordinates : Casing Depth :
Boring Start :Boring Finish :
From
To Field
Value
, Nf
Corre
cted V
alue,
N" Grav
el (%
)
Sand
(%)
Silt (
%)
Clay
(%)
Liquid
(%)
Plasti
c (%
)Pla
sticit
y Ind
ex
(%)
Bulk
Dens
ity
(gms/c
m3 )Dr
y Den
sity
(gms/c
m3 )Mo
isture
Con
tent
(%)
Type
of Te
stCo
nfinin
g Pr
essu
res,
(kg/cm
2)
Cohe
sion
Interc
ept, '
c' (kg
/cm2 )
Angle
of In
terna
l Fri
ction
,
(degre
es)
0.00 0.50 DS1 #N/A #N/A #N/A #N/A #N/A ### #N/A #N/A #N/A #N/A #N/A #N/A #N/A
0.50 1.00 DS2 #N/A #N/A #N/A #N/A #N/A ### #N/A #N/A #N/A #N/A #N/A #N/A #N/A
1.50 1.80 UDS1 #N/A 1 25 61 13 27.5 12.6 14.8 1.37 1.01 35.7 DS 0.5 ,1, 1.5 0.0 35.7
2.50 2.95 SPT1 9 11 #N/A #N/A #N/A #N/A ### #N/A #N/A #N/A #N/A #N/A #N/A #N/A #N/A
3.50 3.95 SPT2 13 14 4.50 0 29 57 14 ### #N/A #N/A #N/A #N/A #N/A #N/A #N/A #N/A
4.50 4.80 UDS2 #N/A #N/A #N/A #N/A #N/A ### #N/A 1.91 1.57 22.0 UU 0.4 ,0.6, 0.8 2.1 19.0
5.50 5.95 SPT3 5 5 6.50 0 12 78 10 32.9 18.8 14.1 #N/A #N/A 2.63 #N/A #N/A #N/A #N/A
6.50 6.95 SPT4 8 8 7.50 0 3 82 15 40.6 20.4 20.2 #N/A #N/A #N/A #N/A #N/A #N/A #N/A
7.50 7.80 UDS3 #N/A #N/A #N/A #N/A #N/A ### #N/A 1.85 1.57 18.0 DS 0.5 ,1, 1.5 0.0 32.3
8.50 8.95 SPT5 24 20 0 87 13 0 ### #N/A #N/A #N/A #N/A #N/A #N/A #N/A #N/A
9.50 9.95 SPT6 28 23 #N/A #N/A #N/A #N/A ### #N/A #N/A #N/A #N/A #N/A #N/A #N/A #N/A
10.50 10.95 SPT7 30 24 0 86 14 0 ### #N/A #N/A #N/A #N/A #N/A #N/A #N/A #N/A
40.34 m (RL 5.2 m)
RL 45.50 m
Shear TestsDensity and Moisture35.7 m
9.80 mTermination Depth :Ground Water Depth :
Ground Water Level :Atterberg LimitsGrain Size Analysis
Generator Foundation Site401536.16 m E, 2808557.61 m N
Depth
of St
rata,
(m)
Surface Elevation :
FILL: Flyash
Medium dense grey silty fine sand (SM)
Symb
ol
Firm brown clayey silt, medium plastic (CI)
Depth, m
Samp
le No
. SOIL DESCRIPTION
SPT (1)
Spec
ific G
ravity
Loose grey sandy silt, low plastic (CL)
Soil Profile (BH-P-4)Shell & Auger37.8 m07-Jul-1508-Jul-15
(1) SPT is outside NABL scope.
Extension of Barauni Super Critical Coal Fired Thermal Power Station at Barauni, Bihar. M/s. STEAG Energy Services (India) Pvt. Ltd.
Project No. 215081-II Plate 17 of 69
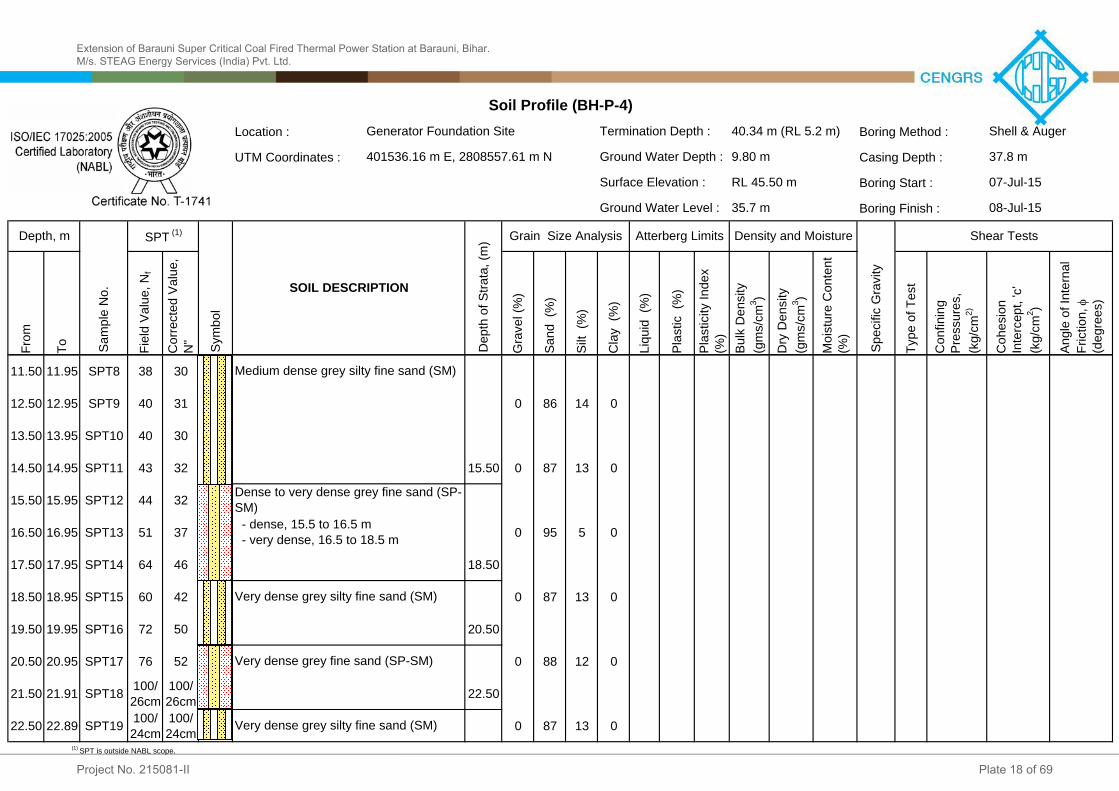
Location : Boring Method :UTM Coordinates : Casing Depth :
Boring Start :Boring Finish :
From
To Field
Value
, Nf
Corre
cted V
alue,
N" Grav
el (%
)
Sand
(%)
Silt (
%)
Clay
(%)
Liquid
(%)
Plasti
c (%
)Pla
sticit
y Ind
ex
(%)
Bulk
Dens
ity
(gms/c
m3 )Dr
y Den
sity
(gms/c
m3 )Mo
isture
Con
tent
(%)
Type
of Te
stCo
nfinin
g Pr
essu
res,
(kg/cm
2)
Cohe
sion
Interc
ept, '
c' (kg
/cm2 )
Angle
of In
terna
l Fri
ction
,
(degre
es)
40.34 m (RL 5.2 m)
RL 45.50 m
Shear TestsDensity and Moisture35.7 m
9.80 mTermination Depth :Ground Water Depth :
Ground Water Level :Atterberg LimitsGrain Size Analysis
Generator Foundation Site401536.16 m E, 2808557.61 m N
Depth
of St
rata,
(m)
Surface Elevation :
Symb
olDepth, m
Samp
le No
. SOIL DESCRIPTION
SPT (1)
Spec
ific G
ravity
Soil Profile (BH-P-4)Shell & Auger37.8 m07-Jul-1508-Jul-15
11.50 11.95 SPT8 38 30 #N/A #N/A #N/A #N/A ### #N/A #N/A #N/A #N/A #N/A #N/A #N/A #N/A
12.50 12.95 SPT9 40 31 0 86 14 0 ### #N/A #N/A #N/A #N/A #N/A #N/A #N/A #N/A
13.50 13.95 SPT10 40 30 #N/A #N/A #N/A #N/A ### #N/A #N/A #N/A #N/A #N/A #N/A #N/A #N/A
14.50 14.95 SPT11 43 32 15.50 0 87 13 0 ### #N/A #N/A #N/A #N/A #N/A #N/A #N/A #N/A
15.50 15.95 SPT12 44 32 #N/A #N/A #N/A #N/A ### #N/A #N/A #N/A #N/A #N/A #N/A #N/A #N/A
16.50 16.95 SPT13 51 37 0 95 5 0 ### #N/A #N/A #N/A #N/A #N/A #N/A #N/A #N/A
17.50 17.95 SPT14 64 46 18.50 #N/A #N/A #N/A #N/A ### #N/A #N/A #N/A #N/A #N/A #N/A #N/A #N/A
18.50 18.95 SPT15 60 42 0 87 13 0 ### #N/A #N/A #N/A #N/A #N/A #N/A #N/A #N/A
19.50 19.95 SPT16 72 50 20.50 #N/A #N/A #N/A #N/A ### #N/A #N/A #N/A #N/A #N/A #N/A #N/A #N/A
20.50 20.95 SPT17 76 52 0 88 12 0 ### #N/A #N/A #N/A #N/A #N/A #N/A #N/A #N/A
21.50 21.91 SPT18 100/ 26cm
100/ 26cm 22.50 #N/A #N/A #N/A #N/A ### #N/A #N/A #N/A #N/A #N/A #N/A #N/A #N/A
22.50 22.89 SPT19 100/ 24cm
100/ 24cm 0 87 13 0 ### #N/A #N/A #N/A #N/A #N/A #N/A #N/A #N/A
Very dense grey fine sand (SP-SM)
Medium dense grey silty fine sand (SM)
Dense to very dense grey fine sand (SP-SM)
Very dense grey silty fine sand (SM)
Very dense grey silty fine sand (SM)
- dense, 15.5 to 16.5 m - very dense, 16.5 to 18.5 m
(1) SPT is outside NABL scope.
Extension of Barauni Super Critical Coal Fired Thermal Power Station at Barauni, Bihar. M/s. STEAG Energy Services (India) Pvt. Ltd.
Project No. 215081-II Plate 18 of 69

Location : Boring Method :UTM Coordinates : Casing Depth :
Boring Start :Boring Finish :
From
To Field
Value
, Nf
Corre
cted V
alue,
N" Grav
el (%
)
Sand
(%)
Silt (
%)
Clay
(%)
Liquid
(%)
Plasti
c (%
)Pla
sticit
y Ind
ex
(%)
Bulk
Dens
ity
(gms/c
m3 )Dr
y Den
sity
(gms/c
m3 )Mo
isture
Con
tent
(%)
Type
of Te
stCo
nfinin
g Pr
essu
res,
(kg/cm
2)
Cohe
sion
Interc
ept, '
c' (kg
/cm2 )
Angle
of In
terna
l Fri
ction
,
(degre
es)
40.34 m (RL 5.2 m)
RL 45.50 m
Shear TestsDensity and Moisture35.7 m
9.80 mTermination Depth :Ground Water Depth :
Ground Water Level :Atterberg LimitsGrain Size Analysis
Generator Foundation Site401536.16 m E, 2808557.61 m N
Depth
of St
rata,
(m)
Surface Elevation :
Symb
olDepth, m
Samp
le No
. SOIL DESCRIPTION
SPT (1)
Spec
ific G
ravity
Soil Profile (BH-P-4)Shell & Auger37.8 m07-Jul-1508-Jul-15
23.50 23.88 SPT20 100/ 23cm
100/ 23cm #N/A #N/A #N/A #N/A ### #N/A #N/A #N/A #N/A #N/A #N/A #N/A #N/A
24.50 24.92 SPT21 100/ 27cm
100/ 27cm 0 87 13 0 ### #N/A #N/A #N/A #N/A #N/A #N/A #N/A #N/A
25.50 25.90 SPT22 100/ 25cm
100/ 25cm 26.50 #N/A #N/A #N/A #N/A ### #N/A #N/A #N/A #N/A #N/A #N/A #N/A #N/A
26.50 26.86 SPT23 100/ 21cm
100/ 21cm 0 90 10 0 ### #N/A #N/A #N/A #N/A #N/A #N/A #N/A #N/A
27.50 27.87 SPT24 100/ 22cm
100/ 22cm #N/A #N/A #N/A #N/A ### #N/A #N/A #N/A #N/A #N/A #N/A #N/A #N/A
28.50 28.85 SPT25 100/ 20cm
100/ 20cm 1 96 3 0 ### #N/A #N/A #N/A #N/A #N/A #N/A #N/A #N/A
29.50 29.83 SPT26 100/ 18cm
100/ 18cm #N/A #N/A #N/A #N/A ### #N/A #N/A #N/A #N/A #N/A #N/A #N/A #N/A
30.50 30.88 SPT27 100/ 23cm
100/ 23cm 1 95 4 0 ### #N/A #N/A #N/A #N/A #N/A #N/A #N/A #N/A
31.50 31.86 SPT28 100/ 21cm
100/ 21cm #N/A #N/A #N/A #N/A ### #N/A #N/A #N/A #N/A #N/A #N/A #N/A #N/A
32.50 32.85 SPT29 100/ 20cm
100/ 20cm 0 89 11 0 ### #N/A #N/A #N/A #N/A #N/A #N/A #N/A #N/A
33.50 33.90 SPT30 100/ 25cm
100/ 25cm #N/A #N/A #N/A #N/A ### #N/A #N/A #N/A #N/A #N/A #N/A #N/A #N/A
34.50 34.88 SPT31 100/ 23cm
100/ 23cm #N/A #N/A #N/A #N/A ### #N/A #N/A #N/A #N/A #N/A #N/A #N/A #N/A
- SP-SM, 32.5 to 35.5 m
- SP, with traces of gravel, 28.5 to 32.5 m
Very dense grey fine sand (SP-SM)
Very desen grey silty fine sand (SM)
(1) SPT is outside NABL scope.
Extension of Barauni Super Critical Coal Fired Thermal Power Station at Barauni, Bihar. M/s. STEAG Energy Services (India) Pvt. Ltd.
Project No. 215081-II Plate 19 of 69

Location : Boring Method :UTM Coordinates : Casing Depth :
Boring Start :Boring Finish :
From
To Field
Value
, Nf
Corre
cted V
alue,
N" Grav
el (%
)
Sand
(%)
Silt (
%)
Clay
(%)
Liquid
(%)
Plasti
c (%
)Pla
sticit
y Ind
ex
(%)
Bulk
Dens
ity
(gms/c
m3 )Dr
y Den
sity
(gms/c
m3 )Mo
isture
Con
tent
(%)
Type
of Te
stCo
nfinin
g Pr
essu
res,
(kg/cm
2)
Cohe
sion
Interc
ept, '
c' (kg
/cm2 )
Angle
of In
terna
l Fri
ction
,
(degre
es)
40.34 m (RL 5.2 m)
RL 45.50 m
Shear TestsDensity and Moisture35.7 m
9.80 mTermination Depth :Ground Water Depth :
Ground Water Level :Atterberg LimitsGrain Size Analysis
Generator Foundation Site401536.16 m E, 2808557.61 m N
Depth
of St
rata,
(m)
Surface Elevation :
Symb
olDepth, m
Samp
le No
. SOIL DESCRIPTION
SPT (1)
Spec
ific G
ravity
Soil Profile (BH-P-4)Shell & Auger37.8 m07-Jul-1508-Jul-15
35.50 35.85 SPT32 100/ 20cm
100/ 20cm 0 87 13 0 ### #N/A #N/A #N/A #N/A #N/A #N/A #N/A #N/A
36.50 36.87 SPT33 100/ 22cm
100/ 22cm #N/A #N/A #N/A #N/A ### #N/A #N/A #N/A #N/A #N/A #N/A #N/A #N/A
37.50 37.83 SPT34 100/ 18cm
100/ 18cm 0 91 9 0 ### #N/A #N/A #N/A #N/A #N/A #N/A #N/A #N/A
38.50 38.85 SPT35 100/ 20cm
100/ 20cm 40.00 #N/A #N/A #N/A #N/A ### #N/A #N/A #N/A #N/A #N/A #N/A #N/A #N/A
40.00 40.34 SPT36 100/ 19cm
100/ 19cm 40.34 0 84 16 0 ### #N/A #N/A #N/A #N/A #N/A #N/A #N/A #N/A
#N/A #N/A #N/A #N/A #N/A #N/A #N/A ### #N/A #N/A #N/A #N/A #N/A #N/A #N/A #N/A
#N/A #N/A #N/A #N/A #N/A #N/A #N/A ### #N/A #N/A #N/A #N/A #N/A #N/A #N/A #N/A
#N/A #N/A #N/A #N/A #N/A #N/A #N/A ### #N/A #N/A #N/A #N/A #N/A #N/A #N/A #N/A
#N/A #N/A #N/A #N/A #N/A #N/A #N/A ### #N/A #N/A #N/A #N/A #N/A #N/A #N/A #N/A
#N/A #N/A #N/A #N/A #N/A #N/A #N/A ### #N/A #N/A #N/A #N/A #N/A #N/A #N/A #N/A
#N/A #N/A #N/A #N/A #N/A #N/A #N/A ### #N/A #N/A #N/A #N/A #N/A #N/A #N/A #N/A
#N/A #N/A #N/A #N/A #N/A #N/A #N/A ### #N/A #N/A #N/A #N/A #N/A #N/A #N/A #N/A
Very dense grey silty fine sand (SM)
Very dense grey fine sand (SP-SM)
(1) SPT is outside NABL scope.
Extension of Barauni Super Critical Coal Fired Thermal Power Station at Barauni, Bihar. M/s. STEAG Energy Services (India) Pvt. Ltd.
Project No. 215081-II Plate 20 of 69

Location : Boring Method :UTM Coordinates : Casing Depth :
Boring Start :Boring Finish :
From
To Field
Value
, Nf
Corre
cted V
alue,
N" Grav
el (%
)
Sand
(%)
Silt (
%)
Clay
(%)
Liquid
(%)
Plasti
c (%
)Pla
sticit
y Ind
ex
(%)
Bulk
Dens
ity
(gms/c
m3 )Dr
y Den
sity
(gms/c
m3 )Mo
isture
Con
tent
(%)
Type
of Te
stCo
nfinin
g Pr
essu
res,
(kg/cm
2)
Cohe
sion
Interc
ept, '
c' (kg
/cm2 )
Angle
of In
terna
l Fri
ction
,
(degre
es)
0.00 1.00 DS1 #N/A #N/A #N/A #N/A #N/A ### #N/A #N/A #N/A #N/A #N/A #N/A #N/A
1.00 1.45 SPT1 #N/A 26 18 35.1 20.6 14.5 #N/A #N/A #N/A #N/A #N/A #N/A #N/A
2.00 2.45 SPT2 7 9 #N/A #N/A #N/A #N/A ### #N/A #N/A #N/A #N/A #N/A #N/A #N/A #N/A
3.00 3.30 UDS1 #N/A 4.00 3 15 54 28 ### #N/A 1.43 1.10 30.0 DS 0.5 ,1, 1.5 0.0 39.0
4.00 4.45 SPT3 5 5 0 4 81 15 36.8 21.1 15.6 #N/A #N/A #N/A #N/A #N/A #N/A #N/A
5.00 5.45 SPT4 7 7 6.00 0 6 71 23 46.6 22.4 24.2 #N/A #N/A #N/A #N/A #N/A #N/A #N/A
6.00 6.30 DS2 #N/A #N/A #N/A #N/A #N/A ### #N/A #N/A #N/A #N/A #N/A #N/A #N/A
7.00 7.45 SPT5 14 13 #N/A #N/A #N/A #N/A ### #N/A #N/A #N/A 2.64 #N/A #N/A #N/A #N/A
8.00 8.45 SPT6 16 14 0 81 19 0 ### #N/A #N/A #N/A #N/A #N/A #N/A #N/A #N/A
9.00 9.45 SPT7 18 15 #N/A #N/A #N/A #N/A ### #N/A #N/A #N/A #N/A #N/A #N/A #N/A #N/A
10.00 10.45 SPT8 21 17 2 84 14 0 ### #N/A #N/A #N/A #N/A #N/A #N/A #N/A #N/A
11.00 11.45 SPT9 28 22 12.00 #N/A #N/A #N/A #N/A ### #N/A #N/A #N/A #N/A #N/A #N/A #N/A #N/A
40.33 m (RL 5.2 m)
RL 45.50 m
Shear TestsDensity and Moisture35.65 m
9.85 mTermination Depth :Ground Water Depth :
Ground Water Level :Atterberg LimitsGrain Size Analysis
Generator Transformer Site401506.00 m E, 2808528.00 m N
Depth
of St
rata,
(m)
Surface Elevation :
FILL: Flyash
56
Medium dense grey silty fine sand (SM)
Symb
olDepth, m
Samp
le No
. SOIL DESCRIPTION
SPT (1)
- with traces of gravel, 10.0 to 12.0 m
Spec
ific G
ravity
Firm brown clayey silt, medium plastic (CI)
Soil Profile (BH-P-5)Shell & Auger38.9 m07-Jul-1509-Jul-15
(1) SPT is outside NABL scope.
Extension of Barauni Super Critical Coal Fired Thermal Power Station at Barauni, Bihar. M/s. STEAG Energy Services (India) Pvt. Ltd.
Project No. 215081-II Plate 21 of 69

Location : Boring Method :UTM Coordinates : Casing Depth :
Boring Start :Boring Finish :
From
To Field
Value
, Nf
Corre
cted V
alue,
N" Grav
el (%
)
Sand
(%)
Silt (
%)
Clay
(%)
Liquid
(%)
Plasti
c (%
)Pla
sticit
y Ind
ex
(%)
Bulk
Dens
ity
(gms/c
m3 )Dr
y Den
sity
(gms/c
m3 )Mo
isture
Con
tent
(%)
Type
of Te
stCo
nfinin
g Pr
essu
res,
(kg/cm
2)
Cohe
sion
Interc
ept, '
c' (kg
/cm2 )
Angle
of In
terna
l Fri
ction
,
(degre
es)
40.33 m (RL 5.2 m)
RL 45.50 m
Shear TestsDensity and Moisture35.65 m
9.85 mTermination Depth :Ground Water Depth :
Ground Water Level :Atterberg LimitsGrain Size Analysis
Generator Transformer Site401506.00 m E, 2808528.00 m N
Depth
of St
rata,
(m)
Surface Elevation :
Symb
olDepth, m
Samp
le No
. SOIL DESCRIPTION
SPT (1)
Spec
ific G
ravity
Soil Profile (BH-P-5)Shell & Auger38.9 m07-Jul-1509-Jul-15
12.00 12.45 SPT10 30 23 #N/A #N/A #N/A #N/A ### #N/A #N/A #N/A #N/A #N/A #N/A #N/A #N/A
13.00 13.45 SPT11 32 24 0 88 12 0 ### #N/A #N/A #N/A #N/A #N/A #N/A #N/A #N/A
14.00 14.45 SPT12 38 29 #N/A #N/A #N/A #N/A ### #N/A #N/A #N/A #N/A #N/A #N/A #N/A #N/A
15.00 15.45 SPT13 44 33 2 92 6 0 ### #N/A #N/A #N/A #N/A #N/A #N/A #N/A #N/A
16.00 16.45 SPT14 44 32 #N/A #N/A #N/A #N/A ### #N/A #N/A #N/A #N/A #N/A #N/A #N/A #N/A
17.00 17.45 SPT15 51 37 0 95 5 0 ### #N/A #N/A #N/A #N/A #N/A #N/A #N/A #N/A
18.00 18.45 SPT16 58 41 19.00 #N/A #N/A #N/A #N/A ### #N/A #N/A #N/A #N/A #N/A #N/A #N/A #N/A
19.00 19.45 SPT17 63 44 0 87 13 0 ### #N/A #N/A #N/A #N/A #N/A #N/A #N/A #N/A
20.00 20.45 SPT18 67 46 #N/A #N/A #N/A #N/A ### #N/A #N/A #N/A #N/A #N/A #N/A #N/A #N/A
21.00 21.45 SPT19 74 50 0 87 13 0 ### #N/A #N/A #N/A #N/A #N/A #N/A #N/A #N/A
22.00 22.45 SPT20 76 50 23.00 #N/A #N/A #N/A #N/A ### #N/A #N/A #N/A #N/A #N/A #N/A #N/A #N/A
23.00 23.41 SPT21 100/ 26cm
100/ 26cm 0 98 2 0 ### #N/A #N/A #N/A #N/A #N/A #N/A #N/A #N/A
Dense to very dense grey fine sand (SP-SM) - dense, 12.0 to 17.0 m
- with traces of gravel, 15.0 to 16.0 m
Very dense grey fine sand (SP)
Very dense grey silty fine sand (SM)
- very dense, 17.0 to 19.0 m
(1) SPT is outside NABL scope.
Extension of Barauni Super Critical Coal Fired Thermal Power Station at Barauni, Bihar. M/s. STEAG Energy Services (India) Pvt. Ltd.
Project No. 215081-II Plate 22 of 69
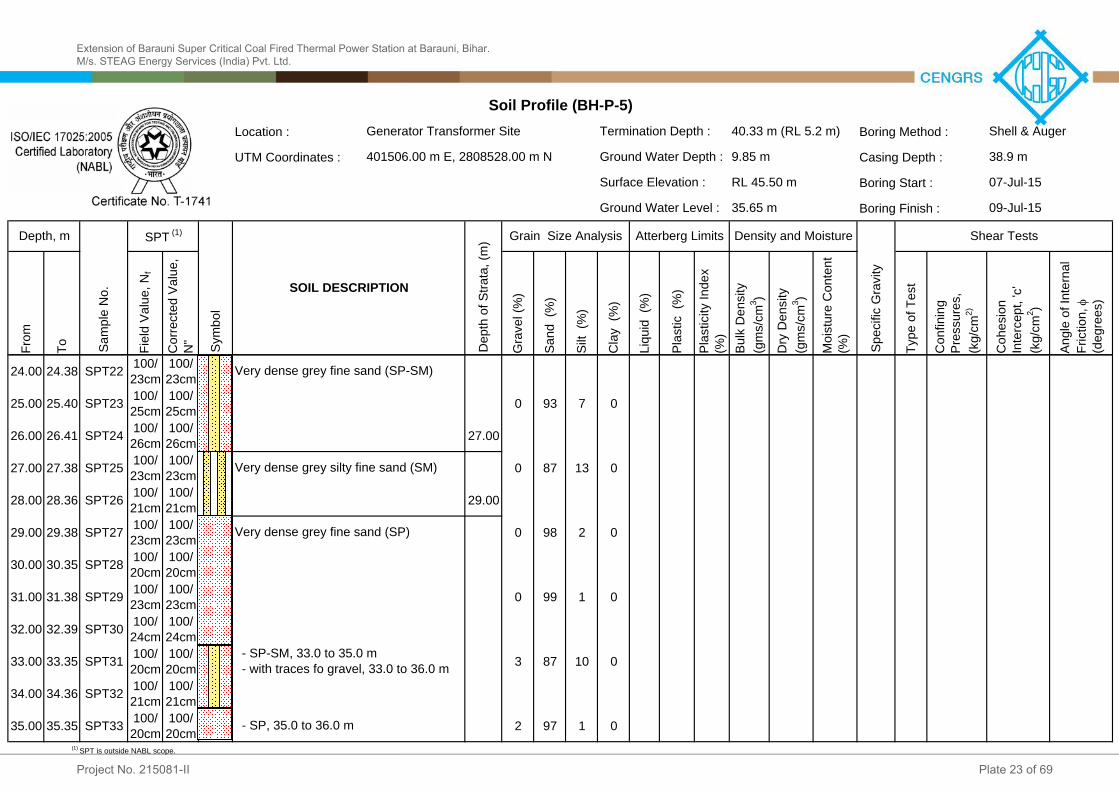
Location : Boring Method :UTM Coordinates : Casing Depth :
Boring Start :Boring Finish :
From
To Field
Value
, Nf
Corre
cted V
alue,
N" Grav
el (%
)
Sand
(%)
Silt (
%)
Clay
(%)
Liquid
(%)
Plasti
c (%
)Pla
sticit
y Ind
ex
(%)
Bulk
Dens
ity
(gms/c
m3 )Dr
y Den
sity
(gms/c
m3 )Mo
isture
Con
tent
(%)
Type
of Te
stCo
nfinin
g Pr
essu
res,
(kg/cm
2)
Cohe
sion
Interc
ept, '
c' (kg
/cm2 )
Angle
of In
terna
l Fri
ction
,
(degre
es)
40.33 m (RL 5.2 m)
RL 45.50 m
Shear TestsDensity and Moisture35.65 m
9.85 mTermination Depth :Ground Water Depth :
Ground Water Level :Atterberg LimitsGrain Size Analysis
Generator Transformer Site401506.00 m E, 2808528.00 m N
Depth
of St
rata,
(m)
Surface Elevation :
Symb
olDepth, m
Samp
le No
. SOIL DESCRIPTION
SPT (1)
Spec
ific G
ravity
Soil Profile (BH-P-5)Shell & Auger38.9 m07-Jul-1509-Jul-15
24.00 24.38 SPT22 100/ 23cm
100/ 23cm #N/A #N/A #N/A #N/A ### #N/A #N/A #N/A #N/A #N/A #N/A #N/A #N/A
25.00 25.40 SPT23 100/ 25cm
100/ 25cm 0 93 7 0 ### #N/A #N/A #N/A #N/A #N/A #N/A #N/A #N/A
26.00 26.41 SPT24 100/ 26cm
100/ 26cm 27.00 #N/A #N/A #N/A #N/A ### #N/A #N/A #N/A #N/A #N/A #N/A #N/A #N/A
27.00 27.38 SPT25 100/ 23cm
100/ 23cm 0 87 13 0 ### #N/A #N/A #N/A #N/A #N/A #N/A #N/A #N/A
28.00 28.36 SPT26 100/ 21cm
100/ 21cm 29.00 #N/A #N/A #N/A #N/A ### #N/A #N/A #N/A #N/A #N/A #N/A #N/A #N/A
29.00 29.38 SPT27 100/ 23cm
100/ 23cm 0 98 2 0 ### #N/A #N/A #N/A #N/A #N/A #N/A #N/A #N/A
30.00 30.35 SPT28 100/ 20cm
100/ 20cm #N/A #N/A #N/A #N/A ### #N/A #N/A #N/A #N/A #N/A #N/A #N/A #N/A
31.00 31.38 SPT29 100/ 23cm
100/ 23cm 0 99 1 0 ### #N/A #N/A #N/A #N/A #N/A #N/A #N/A #N/A
32.00 32.39 SPT30 100/ 24cm
100/ 24cm #N/A #N/A #N/A #N/A ### #N/A #N/A #N/A #N/A #N/A #N/A #N/A #N/A
33.00 33.35 SPT31 100/ 20cm
100/ 20cm 3 87 10 0 ### #N/A #N/A #N/A #N/A #N/A #N/A #N/A #N/A
34.00 34.36 SPT32 100/ 21cm
100/ 21cm #N/A #N/A #N/A #N/A ### #N/A #N/A #N/A #N/A #N/A #N/A #N/A #N/A
35.00 35.35 SPT33 100/ 20cm
100/ 20cm 2 97 1 0 ### #N/A #N/A #N/A #N/A #N/A #N/A #N/A #N/A
- SP-SM, 33.0 to 35.0 m - with traces fo gravel, 33.0 to 36.0 m
Very dense grey fine sand (SP)
- SP, 35.0 to 36.0 m
Very dense grey silty fine sand (SM)
Very dense grey fine sand (SP-SM)
(1) SPT is outside NABL scope.
Extension of Barauni Super Critical Coal Fired Thermal Power Station at Barauni, Bihar. M/s. STEAG Energy Services (India) Pvt. Ltd.
Project No. 215081-II Plate 23 of 69

Location : Boring Method :UTM Coordinates : Casing Depth :
Boring Start :Boring Finish :
From
To Field
Value
, Nf
Corre
cted V
alue,
N" Grav
el (%
)
Sand
(%)
Silt (
%)
Clay
(%)
Liquid
(%)
Plasti
c (%
)Pla
sticit
y Ind
ex
(%)
Bulk
Dens
ity
(gms/c
m3 )Dr
y Den
sity
(gms/c
m3 )Mo
isture
Con
tent
(%)
Type
of Te
stCo
nfinin
g Pr
essu
res,
(kg/cm
2)
Cohe
sion
Interc
ept, '
c' (kg
/cm2 )
Angle
of In
terna
l Fri
ction
,
(degre
es)
40.33 m (RL 5.2 m)
RL 45.50 m
Shear TestsDensity and Moisture35.65 m
9.85 mTermination Depth :Ground Water Depth :
Ground Water Level :Atterberg LimitsGrain Size Analysis
Generator Transformer Site401506.00 m E, 2808528.00 m N
Depth
of St
rata,
(m)
Surface Elevation :
Symb
olDepth, m
Samp
le No
. SOIL DESCRIPTION
SPT (1)
Spec
ific G
ravity
Soil Profile (BH-P-5)Shell & Auger38.9 m07-Jul-1509-Jul-15
36.00 36.37 SPT34 100/ 22cm
100/ 22cm #N/A #N/A #N/A #N/A ### #N/A #N/A #N/A #N/A #N/A #N/A #N/A #N/A
37.00 37.36 SPT35 100/ 21cm
100/ 21cm 2 93 5 0 ### #N/A #N/A #N/A #N/A #N/A #N/A #N/A #N/A
38.00 38.33 SPT36 100/ 18cm
100/ 18cm #N/A #N/A #N/A #N/A ### #N/A #N/A #N/A #N/A #N/A #N/A #N/A #N/A
39.00 39.38 SPT37 100/ 23cm
100/ 23cm #N/A #N/A #N/A #N/A ### #N/A #N/A #N/A #N/A #N/A #N/A #N/A #N/A
40.00 40.33 SPT38 100/ 18cm
100/ 18cm 40.33 0 88 12 0 ### #N/A #N/A #N/A #N/A #N/A #N/A #N/A #N/A
#N/A #N/A #N/A #N/A #N/A #N/A #N/A ### #N/A #N/A #N/A #N/A #N/A #N/A #N/A #N/A
#N/A #N/A #N/A #N/A #N/A #N/A #N/A ### #N/A #N/A #N/A #N/A #N/A #N/A #N/A #N/A
#N/A #N/A #N/A #N/A #N/A #N/A #N/A ### #N/A #N/A #N/A #N/A #N/A #N/A #N/A #N/A
#N/A #N/A #N/A #N/A #N/A #N/A #N/A ### #N/A #N/A #N/A #N/A #N/A #N/A #N/A #N/A
#N/A #N/A #N/A #N/A #N/A #N/A #N/A ### #N/A #N/A #N/A #N/A #N/A #N/A #N/A #N/A
#N/A #N/A #N/A #N/A #N/A #N/A #N/A ### #N/A #N/A #N/A #N/A #N/A #N/A #N/A #N/A
#N/A #N/A #N/A #N/A #N/A #N/A #N/A ### #N/A #N/A #N/A #N/A #N/A #N/A #N/A #N/A
- with traces of gravel, 37.0 to 38.0 m
Very dense grey fine sand (SP-SM)
(1) SPT is outside NABL scope.
Extension of Barauni Super Critical Coal Fired Thermal Power Station at Barauni, Bihar. M/s. STEAG Energy Services (India) Pvt. Ltd.
Project No. 215081-II Plate 24 of 69

Location : Boring Method :UTM Coordinates : Casing Depth :
Boring Start :Boring Finish :
From
To Field
Value
, Nf
Corre
cted V
alue,
N" Grav
el (%
)
Sand
(%)
Silt (
%)
Clay
(%)
Liquid
(%)
Plasti
c (%
)Pla
sticit
y Ind
ex
(%)
Bulk
Dens
ity
(gms/c
m3 )Dr
y Den
sity
(gms/c
m3 )Mo
isture
Con
tent
(%)
Type
of Te
stCo
nfinin
g Pr
essu
res,
(kg/cm
2)
Cohe
sion
Interc
ept, '
c' (kg
/cm2 )
Angle
of In
terna
l Fri
ction
,
(degre
es)
0.00 0.50 DS1 #N/A #N/A #N/A #N/A #N/A ### #N/A #N/A #N/A #N/A #N/A #N/A #N/A
0.50 1.00 DS2 #N/A 0 62 35 3 ### #N/A #N/A #N/A #N/A #N/A #N/A #N/A
1.50 1.80 UDS1 #N/A #N/A #N/A #N/A #N/A ### #N/A 1.46 1.09 34.0 DS 0.5 ,1, 1.5 0.0 32.4
2.50 2.95 SPT1 6 7 0 22 50 28 32.1 17.1 15.0 #N/A #N/A #N/A #N/A #N/A #N/A #N/A
3.50 3.95 SPT2 9 10 4.50 #N/A #N/A #N/A #N/A ### #N/A #N/A #N/A #N/A #N/A #N/A #N/A #N/A
4.50 4.80 UDS2 #N/A 2 20 55 23 ### #N/A 1.92 1.59 21.0 UU 0.4 ,0.6, 0.8 2.9 5.7
5.50 5.95 SPT3 7 7 6.50 #N/A #N/A #N/A #N/A 35.6 21.8 13.7 #N/A #N/A #N/A #N/A #N/A #N/A #N/A
6.50 6.95 SPT4 20 19 7.50 0 25 57 18 28.7 18.5 10.2 #N/A #N/A #N/A #N/A #N/A #N/A #N/A
7.50 7.95 SPT5 23 20 #N/A #N/A #N/A #N/A ### #N/A #N/A #N/A #N/A #N/A #N/A #N/A #N/A
8.50 8.95 SPT6 24 20 0 81 19 0 ### #N/A #N/A #N/A #N/A #N/A #N/A #N/A #N/A
9.50 9.95 SPT7 27 22 #N/A #N/A #N/A #N/A ### #N/A #N/A #N/A 2.64 #N/A #N/A #N/A #N/A
10.50 10.95 SPT8 36 29 0 76 24 0 ### #N/A #N/A #N/A #N/A #N/A #N/A #N/A #N/A
40.3 m (RL 5.2 m)
RL 45.50 m
Shear TestsDensity and Moisture36.1 m
9.40 mTermination Depth :Ground Water Depth :
Ground Water Level :Atterberg LimitsGrain Size Analysis
Raw Water Storage Tank Site401514.17 m E, 2808315.16 m N
Depth
of St
rata,
(m)
Surface Elevation :
FILL: Flyash
Medium dense to dense grey silty fine sand (SM)
- dense, 10.5 to 11.5 m
Symb
ol
Medium dense brown sandy silt, low plastic (CL)
Depth, m
Samp
le No
. SOIL DESCRIPTION
SPT (1)
Spec
ific G
ravity
Firm brown clayey silt with traces of gravel, medium plastic (CI)
- medium dense, 7.5 to 10.5 m
Soil Profile (BH-P-6)Shell & Auger39.5 m10-Jul-1511-Jul-15
(1) SPT is outside NABL scope.
Extension of Barauni Super Critical Coal Fired Thermal Power Station at Barauni, Bihar. M/s. STEAG Energy Services (India) Pvt. Ltd.
Project No. 215081-II Plate 25 of 69

Location : Boring Method :UTM Coordinates : Casing Depth :
Boring Start :Boring Finish :
From
To Field
Value
, Nf
Corre
cted V
alue,
N" Grav
el (%
)
Sand
(%)
Silt (
%)
Clay
(%)
Liquid
(%)
Plasti
c (%
)Pla
sticit
y Ind
ex
(%)
Bulk
Dens
ity
(gms/c
m3 )Dr
y Den
sity
(gms/c
m3 )Mo
isture
Con
tent
(%)
Type
of Te
stCo
nfinin
g Pr
essu
res,
(kg/cm
2)
Cohe
sion
Interc
ept, '
c' (kg
/cm2 )
Angle
of In
terna
l Fri
ction
,
(degre
es)
40.3 m (RL 5.2 m)
RL 45.50 m
Shear TestsDensity and Moisture36.1 m
9.40 mTermination Depth :Ground Water Depth :
Ground Water Level :Atterberg LimitsGrain Size Analysis
Raw Water Storage Tank Site401514.17 m E, 2808315.16 m N
Depth
of St
rata,
(m)
Surface Elevation :
Symb
olDepth, m
Samp
le No
. SOIL DESCRIPTION
SPT (1)
Spec
ific G
ravity
Soil Profile (BH-P-6)Shell & Auger39.5 m10-Jul-1511-Jul-15
11.50 11.95 SPT9 39 31 #N/A #N/A #N/A #N/A ### #N/A #N/A #N/A #N/A #N/A #N/A #N/A #N/A
12.50 12.95 SPT10 41 32 0 79 21 0 ### #N/A #N/A #N/A #N/A #N/A #N/A #N/A #N/A
13.50 13.95 SPT11 47 36 #N/A #N/A #N/A #N/A ### #N/A #N/A #N/A #N/A #N/A #N/A #N/A #N/A
14.50 14.95 SPT12 51 38 1 80 19 0 ### #N/A #N/A #N/A #N/A #N/A #N/A #N/A #N/A
15.50 15.95 SPT13 55 41 #N/A #N/A #N/A #N/A ### #N/A #N/A #N/A #N/A #N/A #N/A #N/A #N/A
16.50 16.95 SPT14 61 44 17.50 #N/A #N/A #N/A #N/A ### #N/A #N/A #N/A #N/A #N/A #N/A #N/A #N/A
17.50 17.95 SPT15 49 35 0 94 6 0 ### #N/A #N/A #N/A #N/A #N/A #N/A #N/A #N/A
18.50 18.95 SPT16 62 44 #N/A #N/A #N/A #N/A ### #N/A #N/A #N/A #N/A #N/A #N/A #N/A #N/A
19.50 19.95 SPT17 72 50 0 98 2 0 ### #N/A #N/A #N/A #N/A #N/A #N/A #N/A #N/A
20.50 20.95 SPT18 80 55 #N/A #N/A #N/A #N/A ### #N/A #N/A #N/A #N/A #N/A #N/A #N/A #N/A
21.50 21.91 SPT19 100/ 26cm
100/ 26cm 0 97 3 0 ### #N/A #N/A #N/A #N/A #N/A #N/A #N/A #N/A
22.50 22.89 SPT20 100/ 24cm
100/ 24cm #N/A #N/A #N/A #N/A ### #N/A #N/A #N/A #N/A #N/A #N/A #N/A #N/A
Dense to very dense grey fine sand (SP-SM)
Dense to very dense grey silty fine sand (SM) - dense, 11.5 to 14.5 m
- very dense, 14.5 to 17.5 m - with traces of gravel, 14.5 to 15.5 m
- SP, 19.5 to 23.5 m - very dense, 19.5 to 23.5 m
- dense, 17.5 to 18.5 m
(1) SPT is outside NABL scope.
Extension of Barauni Super Critical Coal Fired Thermal Power Station at Barauni, Bihar. M/s. STEAG Energy Services (India) Pvt. Ltd.
Project No. 215081-II Plate 26 of 69

Location : Boring Method :UTM Coordinates : Casing Depth :
Boring Start :Boring Finish :
From
To Field
Value
, Nf
Corre
cted V
alue,
N" Grav
el (%
)
Sand
(%)
Silt (
%)
Clay
(%)
Liquid
(%)
Plasti
c (%
)Pla
sticit
y Ind
ex
(%)
Bulk
Dens
ity
(gms/c
m3 )Dr
y Den
sity
(gms/c
m3 )Mo
isture
Con
tent
(%)
Type
of Te
stCo
nfinin
g Pr
essu
res,
(kg/cm
2)
Cohe
sion
Interc
ept, '
c' (kg
/cm2 )
Angle
of In
terna
l Fri
ction
,
(degre
es)
40.3 m (RL 5.2 m)
RL 45.50 m
Shear TestsDensity and Moisture36.1 m
9.40 mTermination Depth :Ground Water Depth :
Ground Water Level :Atterberg LimitsGrain Size Analysis
Raw Water Storage Tank Site401514.17 m E, 2808315.16 m N
Depth
of St
rata,
(m)
Surface Elevation :
Symb
olDepth, m
Samp
le No
. SOIL DESCRIPTION
SPT (1)
Spec
ific G
ravity
Soil Profile (BH-P-6)Shell & Auger39.5 m10-Jul-1511-Jul-15
23.50 23.86 SPT21 100/ 21cm
100/ 21cm 0 98 2 0 ### #N/A #N/A #N/A #N/A #N/A #N/A #N/A #N/A
24.50 24.88 SPT22 100/ 23cm
100/ 23cm #N/A #N/A #N/A #N/A ### #N/A #N/A #N/A #N/A #N/A #N/A #N/A #N/A
25.50 25.90 SPT23 100/ 25cm
100/ 25cm 0 95 5 0 ### #N/A #N/A #N/A #N/A #N/A #N/A #N/A #N/A
26.50 26.87 SPT24 100/ 22cm
100/ 22cm #N/A #N/A #N/A #N/A ### #N/A #N/A #N/A #N/A #N/A #N/A #N/A #N/A
27.50 27.88 SPT25 100/ 23cm
100/ 23cm 0 96 4 0 ### #N/A #N/A #N/A #N/A #N/A #N/A #N/A #N/A
28.50 28.85 SPT26 100/ 20cm
100/ 20cm #N/A #N/A #N/A #N/A ### #N/A #N/A #N/A #N/A #N/A #N/A #N/A #N/A
29.50 29.86 SPT27 100/ 21cm
100/ 21cm 2 91 7 0 ### #N/A #N/A #N/A #N/A #N/A #N/A #N/A #N/A
30.50 30.83 SPT28 100/ 18cm
100/ 18cm #N/A #N/A #N/A #N/A ### #N/A #N/A #N/A #N/A #N/A #N/A #N/A #N/A
31.50 31.88 SPT29 100/ 23cm
100/ 23cm 0 98 2 0 ### #N/A #N/A #N/A #N/A #N/A #N/A #N/A #N/A
32.50 32.86 SPT30 100/ 21cm
100/ 21cm #N/A #N/A #N/A #N/A ### #N/A #N/A #N/A #N/A #N/A #N/A #N/A #N/A
33.80 33.85 SPT31 100/ 20cm
100/ 20cm 1 97 2 0 ### #N/A #N/A #N/A #N/A #N/A #N/A #N/A #N/A
34.80 34.89 SPT32 100/ 24cm
100/ 24cm #N/A #N/A #N/A #N/A ### #N/A #N/A #N/A #N/A #N/A #N/A #N/A #N/A
- SP, 31.5 to 35.5 m
- with traces of gravel, 33.8 to 34.8 m
- SP-SM, 25.5 to 27.5 m
- SP-SM, 29.5 to 31.5 m - with traces of gravel, 29.5 to 30.5 m
- SP, 27.5 to 29.5 m
Very dense grey fine sand (SP)
(1) SPT is outside NABL scope.
Extension of Barauni Super Critical Coal Fired Thermal Power Station at Barauni, Bihar. M/s. STEAG Energy Services (India) Pvt. Ltd.
Project No. 215081-II Plate 27 of 69
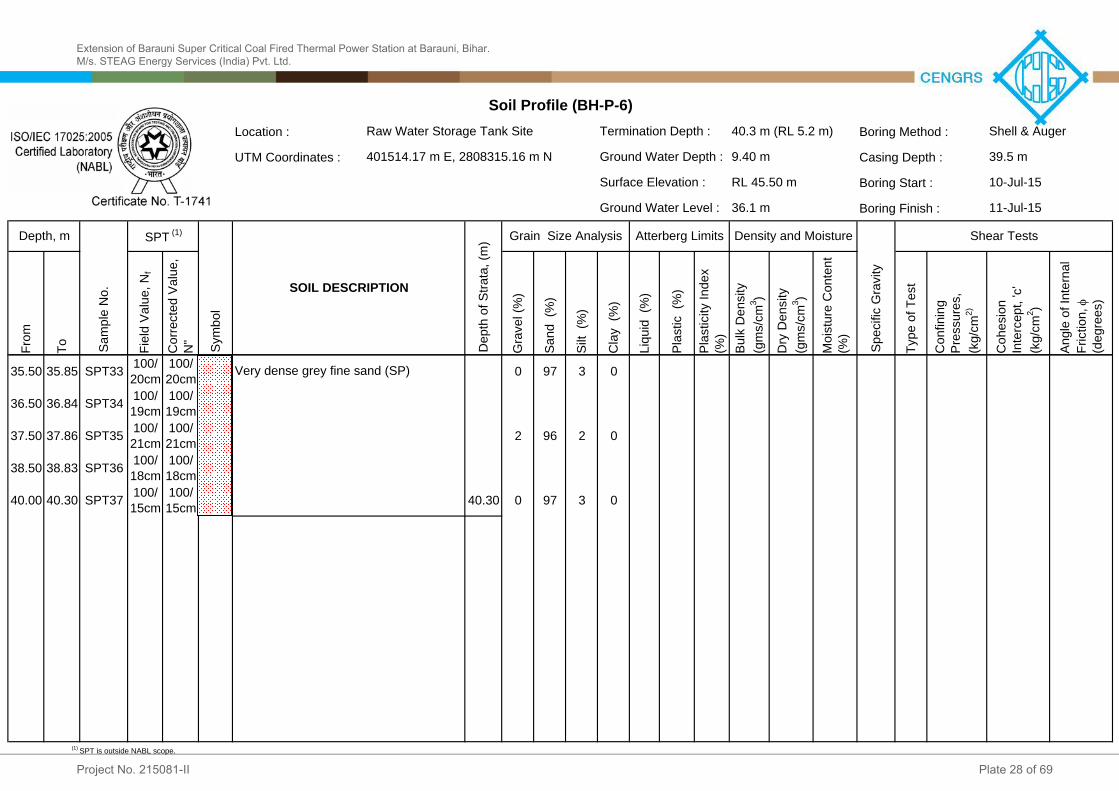
Location : Boring Method :UTM Coordinates : Casing Depth :
Boring Start :Boring Finish :
From
To Field
Value
, Nf
Corre
cted V
alue,
N" Grav
el (%
)
Sand
(%)
Silt (
%)
Clay
(%)
Liquid
(%)
Plasti
c (%
)Pla
sticit
y Ind
ex
(%)
Bulk
Dens
ity
(gms/c
m3 )Dr
y Den
sity
(gms/c
m3 )Mo
isture
Con
tent
(%)
Type
of Te
stCo
nfinin
g Pr
essu
res,
(kg/cm
2)
Cohe
sion
Interc
ept, '
c' (kg
/cm2 )
Angle
of In
terna
l Fri
ction
,
(degre
es)
40.3 m (RL 5.2 m)
RL 45.50 m
Shear TestsDensity and Moisture36.1 m
9.40 mTermination Depth :Ground Water Depth :
Ground Water Level :Atterberg LimitsGrain Size Analysis
Raw Water Storage Tank Site401514.17 m E, 2808315.16 m N
Depth
of St
rata,
(m)
Surface Elevation :
Symb
olDepth, m
Samp
le No
. SOIL DESCRIPTION
SPT (1)
Spec
ific G
ravity
Soil Profile (BH-P-6)Shell & Auger39.5 m10-Jul-1511-Jul-15
35.50 35.85 SPT33 100/ 20cm
100/ 20cm 0 97 3 0 ### #N/A #N/A #N/A #N/A #N/A #N/A #N/A #N/A
36.50 36.84 SPT34 100/ 19cm
100/ 19cm #N/A #N/A #N/A #N/A ### #N/A #N/A #N/A #N/A #N/A #N/A #N/A #N/A
37.50 37.86 SPT35 100/ 21cm
100/ 21cm 2 96 2 0 ### #N/A #N/A #N/A #N/A #N/A #N/A #N/A #N/A
38.50 38.83 SPT36 100/ 18cm
100/ 18cm #N/A #N/A #N/A #N/A ### #N/A #N/A #N/A #N/A #N/A #N/A #N/A #N/A
40.00 40.30 SPT37 100/ 15cm
100/ 15cm 40.30 0 97 3 0 ### #N/A #N/A #N/A #N/A #N/A #N/A #N/A #N/A
#N/A #N/A #N/A #N/A #N/A #N/A #N/A ### #N/A #N/A #N/A #N/A #N/A #N/A #N/A #N/A
#N/A #N/A #N/A #N/A #N/A #N/A #N/A ### #N/A #N/A #N/A #N/A #N/A #N/A #N/A #N/A
#N/A #N/A #N/A #N/A #N/A #N/A #N/A ### #N/A #N/A #N/A #N/A #N/A #N/A #N/A #N/A
#N/A #N/A #N/A #N/A #N/A #N/A #N/A ### #N/A #N/A #N/A #N/A #N/A #N/A #N/A #N/A
#N/A #N/A #N/A #N/A #N/A #N/A #N/A ### #N/A #N/A #N/A #N/A #N/A #N/A #N/A #N/A
#N/A #N/A #N/A #N/A #N/A #N/A #N/A ### #N/A #N/A #N/A #N/A #N/A #N/A #N/A #N/A
#N/A #N/A #N/A #N/A #N/A #N/A #N/A ### #N/A #N/A #N/A #N/A #N/A #N/A #N/A #N/A
Very dense grey fine sand (SP)
(1) SPT is outside NABL scope.
Extension of Barauni Super Critical Coal Fired Thermal Power Station at Barauni, Bihar. M/s. STEAG Energy Services (India) Pvt. Ltd.
Project No. 215081-II Plate 28 of 69

SYMBOLL E G E N D
Summary of Borehole Profiles
Clayey silt (CI)Sandy silt (CL)FILL: Flyash
DESCRIPTION
Water tableFine sand (SP)Fine sand (SP-SM)Silty sand (SM)
46
42
38
34
30
26
22
18
14
10
6
Redu
ced L
evel,
m
2 Coal Silo #4 Site
4.0
BH-P1RL: 45.50m
40.32m
17
2017
27
3330
35
76
42
N-Value
23
12
4650446166
100/25cm100/26cm100/23cm100/25cm100/23cm
100/23cm100/21cm
100/20cm100/25cm100/23cm100/20cm100/20cm100/23cm100/21cm100/23cm100/20cm100/20cm
100/18cm100/24cm
100/20cm100/18cm100/17cm
5.0
10.0
16.0
18.0
20.0
22.0
BH-P2RL: 45.50m
40.34m
10
87
5
96
26
100/29cm
32
N-Value
5
8
100/23cm100/21cm100/19cm100/22cm100/27cm
100/27cm
32
100/25cm100/28cm100/15cm
100/29cm100/15cm
100/26cm100/24cm100/22cm100/22cm100/20cm101/23cm101/25cm102/26cm103/22cm101/20cm
101/24cm101/18cm
100/23cm101/22cm100/19cm
4.0
10.0
7.0
12.0
17.0
19.0
23.0
31.0
34.0
36.0
4.5
BH-P-3RL: 45.50m
40.33m
1011
1414
1517
N-Value
26323845
712
50566670100/23cm100/25cm100/24cm100/21cm100/20cm100/22cm100/25cm100/21cm100/18cm100/20cm100/22cm100/23cm100/21cm100/26cm100/25cm100/17cm100/20cm100/15cm
100/18cm
7.5
11.5
16.5
18.5
30.5
32.5
35.5
38.5
BH-P-4RL: 45.50m
40.34 m
913
2428
3840
N-Value
40434451
58
64607276100/26cm100/24cm100/23cm100/27cm100/25cm100/21cm100/22cm100/20cm100/18cm100/23cm100/21cm100/20cm100/25cm100/23cm100/20cm100/22cm100/18cm100/20cm
100/19cm
4.5
6.5
30
7.5
15.5
18.5
20.5
22.5
26.5
28.5
32.5
40.0
4.0
BH-P5RL: 45.50m
40.33 m
7
75
16
2118
28
58
30
N-Value
14
3238444451
63677476100/26cm
100/25cm100/23cm
100/26cm100/23cm100/21cm100/23cm100/20cm100/23cm100/24cm100/20cm100/21cm100/20cm
100/21cm100/22cm
100/18cm100/23cm100/18cm
6.0
12.0
19.0
23.024.0
27.0
29.0
33.0
35.036.0
BH-P-6RL: 45.50m
40.30 m
69
2427
3941
N-Value
47515561
720
49627280100/26cm100/24cm100/21cm100/23cm100/25cm100/22cm100/23cm100/20cm100/21cm100/18cm100/23cm100/21cm100/20cm100/24cm100/20cm100/19cm100/21cm100/18cm
100/15cm
6.5
36
4.5
237.5
17.5
19.5
25.5
27.5
29.5
31.5
Chimney SiteBoiler
Foundation SiteGenerator
Foundation SiteGenerator
Transformer SiteRaw Water
Storage Tank Site
Extension of Barauni Super Critical Coal Fired Thermal Power Station at Barauni, Bihar. M/s. STEAG Energy Services (India) Pvt. Ltd.
Project No. 215081-II Plate 29 of 69

Symbol
Boiler Foundation SiteGenerator Foundation SiteGenerator Transformer Site
Raw Water Storage Tank Site
IS : 2131-1981, RA-2007
LocationBorehole Details
Borehole Number
Standard Penetration Test
45.5045.50
Reduced Level,m45.50
BH-P-2BH-P-1
45.50
Field SPT Values versus Reduced Level
BH-P-6BH-P-5BH-P-4BH-P-3
Coal Silo #4 SiteChimney Site
45.50
45.50
2
6
10
14
18
22
26
30
34
38
42
460 10 20 30 40 50 60 70 80 90 100
Field SPT Value (N)
Redu
ced L
evel,
m 100/25cm
100/23cm
100/23cm100/26cm100/26cm100/26cm
Extension of Barauni Super Critical Coal Fired Thermal Power Station at Barauni, Bihar. M/s. STEAG Energy Services (India) Pvt. Ltd.
Project No. 215081-II Plate 30 of 69
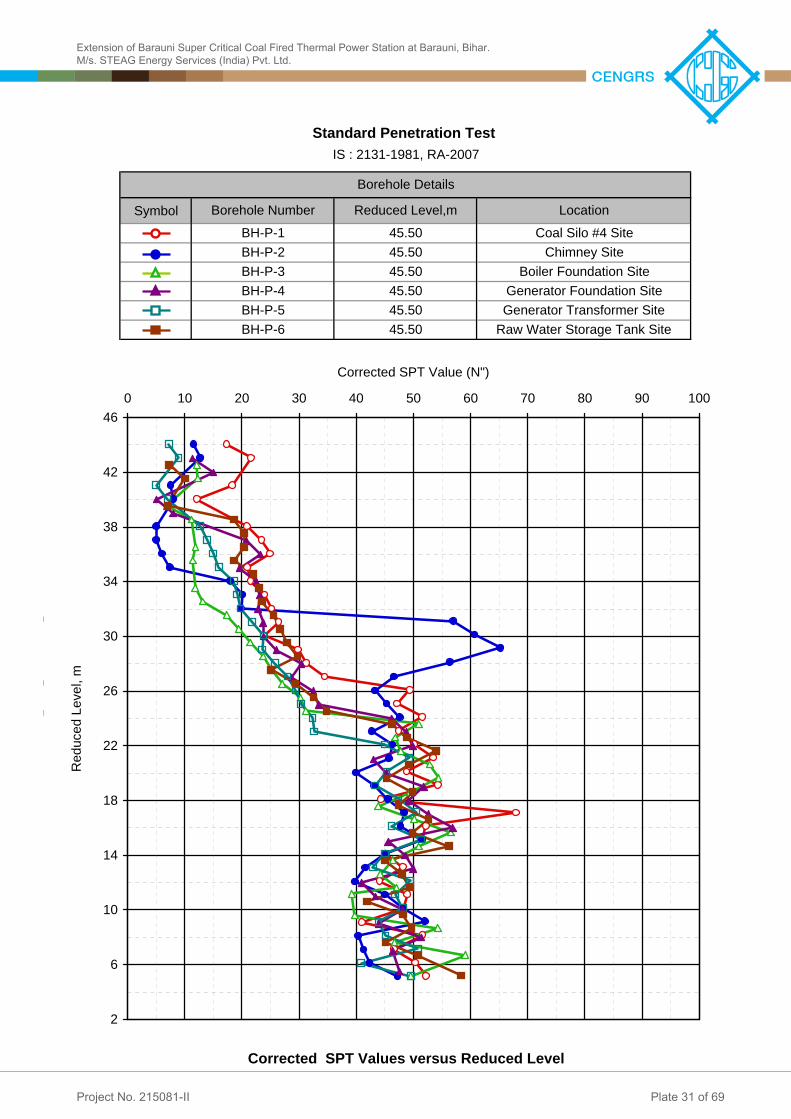
Symbol
Generator Transformer SiteRaw Water Storage Tank Site
Coal Silo #4 SiteChimney Site
Boiler Foundation SiteGenerator Foundation Site
IS : 2131-1981, RA-2007Borehole Details
LocationBorehole Number Reduced Level,m
Standard Penetration Test
BH-P-6BH-P-5 45.50
45.50
Corrected SPT Values versus Reduced Level
45.50BH-P-4 45.50BH-P-3
BH-P-1 45.50BH-P-2 45.50
2
6
10
14
18
22
26
30
34
38
42
460 10 20 30 40 50 60 70 80 90 100
Corrected SPT Value (N")
Redu
ced L
evel,
mm
m
m
Extension of Barauni Super Critical Coal Fired Thermal Power Station at Barauni, Bihar. M/s. STEAG Energy Services (India) Pvt. Ltd.
Project No. 215081-II Plate 31 of 69
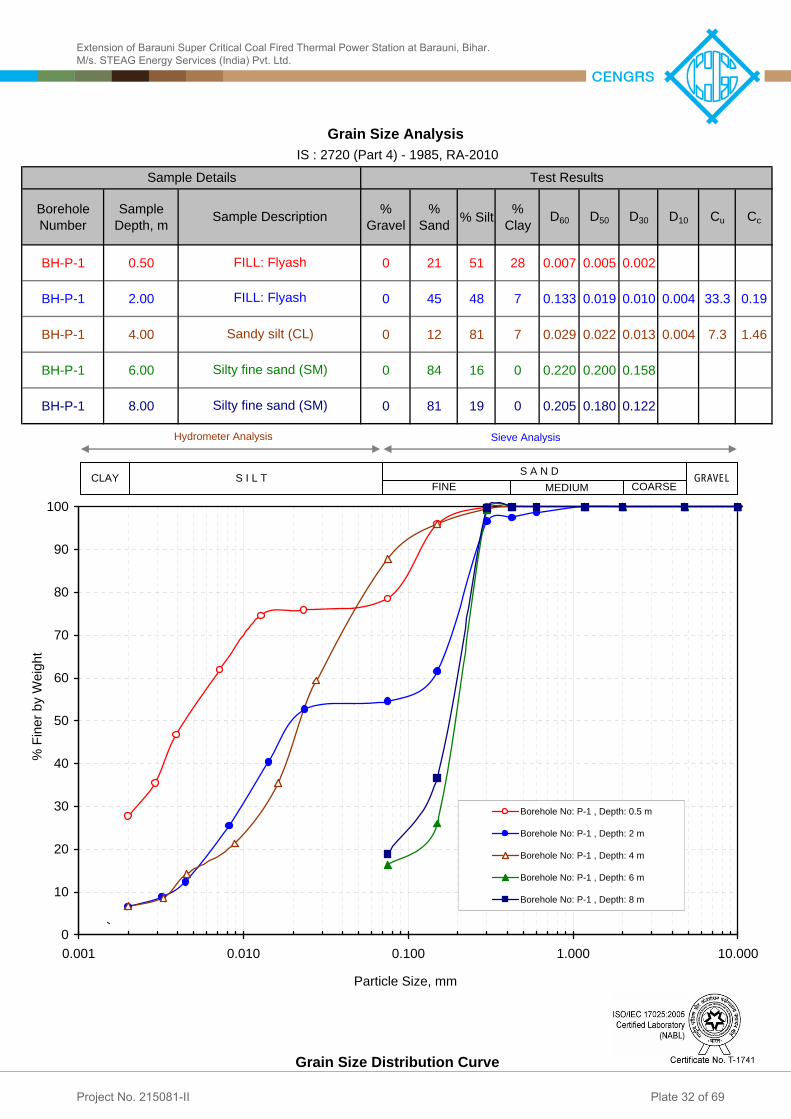
Borehole Number
Sample Depth, m
% Gravel
% Sand % Silt %
Clay D60 D50 D30 D10 Cu Cc
BH-P-1 0.50 0 21 51 28 0.007 0.005 0.002
BH-P-1 2.00 0 45 48 7 0.133 0.019 0.010 0.004 33.3 0.19
BH-P-1 4.00 0 12 81 7 0.029 0.022 0.013 0.004 7.3 1.46
BH-P-1 6.00 0 84 16 0 0.220 0.200 0.158
BH-P-1 8.00 0 81 19 0 0.205 0.180 0.122
Sample Details
Sample Description
FILL: Flyash
IS : 2720 (Part 4) - 1985, RA-2010Grain Size Analysis
Test Results
FILL: Flyash
Sandy silt (CL)
Silty fine sand (SM)
Silty fine sand (SM)
Grain Size Distribution Curve
0
10
20
30
40
50
60
70
80
90
100
0.001 0.010 0.100 1.000 10.000Particle Size, mm
% Fin
er by
Weig
ht
Borehole No: P-1 , Depth: 0.5 mBorehole No: P-1 , Depth: 2 mBorehole No: P-1 , Depth: 4 mBorehole No: P-1 , Depth: 6 mBorehole No: P-1 , Depth: 8 m
GRAVELCOARSEFINE MEDIUM S A N DS I L TCLAY
Hydrometer Analysis Sieve Analysis
Extension of Barauni Super Critical Coal Fired Thermal Power Station at Barauni, Bihar. M/s. STEAG Energy Services (India) Pvt. Ltd.
Project No. 215081-II Plate 32 of 69

Borehole Number
Sample Depth, m
% Gravel
% Sand % Silt %
Clay D60 D50 D30 D10 Cu Cc
BH-P-1 10.00 0 93 7 0 0.240 0.210 0.178 0.097 2.5 1.36
BH-P-1 12.00 0 90 10 0 0.280 0.250 0.192 0.079 3.5 1.67
BH-P-1 14.00 0 94 6 0 0.276 0.250 0.194 0.113 2.4 1.21
BH-P-1 16.00 0 96 4 0 0.288 0.260 0.205 0.150 1.9 0.97
BH-P-1 18.00 0 95 5 0 0.280 0.250 0.206 0.157 1.8 0.97
Sample Details
Sample Description
Fine sand (SP-SM)
IS : 2720 (Part 4) - 1985, RA-2010Grain Size Analysis
Test Results
Fine sand (SP-SM)
Fine sand (SP-SM)
Fine sand (SP-SM)
Fine sand (SP)
Grain Size Distribution Curve
0
10
20
30
40
50
60
70
80
90
100
0.001 0.010 0.100 1.000 10.000
Particle Size, mm
% Fin
er by
Weig
ht
Borehole No: P-1 , Depth: 10 mBorehole No: P-1 , Depth: 12 mBorehole No: P-1 , Depth: 14 mBorehole No: P-1 , Depth: 16 mBorehole No: P-1 , Depth: 18 m
GRAVELCOARSEFINE MEDIUM S A N DS I L TCLAY
Hydrometer Analysis Sieve Analysis
Extension of Barauni Super Critical Coal Fired Thermal Power Station at Barauni, Bihar. M/s. STEAG Energy Services (India) Pvt. Ltd.
Project No. 215081-II Plate 33 of 69

Borehole Number
Sample Depth, m
% Gravel
% Sand % Silt %
Clay D60 D50 D30 D10 Cu Cc
BH-P-1 20.00 0 99 1 0 0.282 0.250 0.210 0.162 1.7 0.97
BH-P-1 22.00 0 91 9 0 0.276 0.240 0.183 0.085 3.3 1.43
BH-P-1 24.00 0 91 9 0 0.286 0.240 0.188 0.080 3.6 1.54
BH-P-1 26.00 0 88 12 0 0.263 0.220 0.163
BH-P-1 28.00 0 90 10 0 0.274 0.230 0.181 0.078 3.5 1.53
Sample Details
Sample Description
Fine sand (SP)
IS : 2720 (Part 4) - 1985, RA-2010Grain Size Analysis
Test Results
Fine sand (SP-SM)
Fine sand (SP-SM)
Fine sand (SP-SM)
Fine sand (SP-SM)
Grain Size Distribution Curve
0
10
20
30
40
50
60
70
80
90
100
0.001 0.010 0.100 1.000 10.000Particle Size, mm
% Fin
er by
Weig
ht
Borehole No: P-1 , Depth: 20 mBorehole No: P-1 , Depth: 22 mBorehole No: P-1 , Depth: 24 mBorehole No: P-1 , Depth: 26 mBorehole No: P-1 , Depth: 28 m
GRAVELCOARSEFINE MEDIUM S A N DS I L TCLAY
Hydrometer Analysis Sieve Analysis
Extension of Barauni Super Critical Coal Fired Thermal Power Station at Barauni, Bihar. M/s. STEAG Energy Services (India) Pvt. Ltd.
Project No. 215081-II Plate 34 of 69

Borehole Number
Sample Depth, m
% Gravel
% Sand % Silt %
Clay D60 D50 D30 D10 Cu Cc
BH-P-1 30.00 0 92 8 0 0.271 0.230 0.190 0.098 2.8 1.36
BH-P-1 33.00 0 91 9 0 0.266 0.230 0.186 0.085 3.1 1.53
BH-P-1 35.00 0 91 9 0 0.275 0.240 0.192 0.083 3.3 1.62
BH-P-1 37.00 0 92 8 0 0.288 0.250 0.198 0.102 2.8 1.33
BH-P-1 39.00 0 92 8 0 0.273 0.240 0.192 0.099 2.8 1.36
Sample Details
Sample Description
Fine sand (SP-SM)
IS : 2720 (Part 4) - 1985, RA-2010Grain Size Analysis
Test Results
Fine sand (SP-SM)
Fine sand (SP-SM)
Fine sand (SP-SM)
Fine sand (SP-SM)
Grain Size Distribution Curve
0
10
20
30
40
50
60
70
80
90
100
0.001 0.010 0.100 1.000 10.000Particle Size, mm
% Fin
er by
Weig
ht
Borehole No: P-1 , Depth: 30 mBorehole No: P-1 , Depth: 33 mBorehole No: P-1 , Depth: 35 mBorehole No: P-1 , Depth: 37 mBorehole No: P-1 , Depth: 39 m
GRAVELCOARSEFINE MEDIUM S A N DS I L TCLAY
Hydrometer Analysis Sieve Analysis
Extension of Barauni Super Critical Coal Fired Thermal Power Station at Barauni, Bihar. M/s. STEAG Energy Services (India) Pvt. Ltd.
Project No. 215081-II Plate 35 of 69

Borehole Number
Sample Depth, m
% Gravel
% Sand % Silt %
Clay D60 D50 D30 D10 Cu Cc
BH-P-2 1.00 0 19 74 7 0.044 0.029 0.016 0.003 14.7 1.94
BH-P-2 3.00 0 42 44 14 0.091 0.020 0.008
BH-P-2 5.00 0 10 80 10 0.025 0.019 0.010 0.002 12.5 2.00
BH-P-2 7.00 0 3 77 20 0.010 0.008 0.004
BH-P-2 9.00 0 3 79 18 0.012 0.009 0.004
Sample Details
Sample Description
FILL: Flyash
IS : 2720 (Part 4) - 1985, RA-2010Grain Size Analysis
Test Results
FILL: Flyash
Sandy silt (CL)
Clayey silt (CI)
Clayey silt (CI)
Grain Size Distribution Curve
0
10
20
30
40
50
60
70
80
90
100
0.001 0.010 0.100 1.000 10.000Particle Size, mm
% Fin
er by
Weig
ht
Borehole No: P-2 , Depth: 1 mBorehole No: P-2 , Depth: 3 mBorehole No: P-2 , Depth: 5 mBorehole No: P-2 , Depth: 7 mBorehole No: P-2 , Depth: 9 m
GRAVELCOARSEFINE MEDIUM S A N DS I L TCLAY
Hydrometer Analysis Sieve Analysis
Extension of Barauni Super Critical Coal Fired Thermal Power Station at Barauni, Bihar. M/s. STEAG Energy Services (India) Pvt. Ltd.
Project No. 215081-II Plate 36 of 69

Borehole Number
Sample Depth, m
% Gravel
% Sand % Silt %
Clay D60 D50 D30 D10 Cu Cc
BH-P-2 11.00 0 24 61 15 0.024 0.016 0.006
BH-P-2 13.00 0 92 8 0 0.208 0.180 0.134 0.080 2.6 1.08
BH-P-2 15.00 0 94 6 0 0.265 0.220 0.184 0.102 2.6 1.25
BH-P-2 17.00 0 96 4 0 0.246 0.210 0.181 0.112 2.2 1.19
BH-P-2 19.00 0 95 5 0 0.265 0.220 0.197 0.152 1.7 0.96
Sample Details
Sample Description
Sandy silt (CL)
IS : 2720 (Part 4) - 1985, RA-2010Grain Size Analysis
Test Results
Fine sand (SP-SM)
Fine sand (SP-SM)
Fine sand (SP-SM)
Fine sand (SP)
Grain Size Distribution Curve
0
10
20
30
40
50
60
70
80
90
100
0.001 0.010 0.100 1.000 10.000Particle Size, mm
% Fin
er by
Weig
ht
Borehole No: P-2 , Depth: 11 mBorehole No: P-2 , Depth: 13 mBorehole No: P-2 , Depth: 15 mBorehole No: P-2 , Depth: 17 mBorehole No: P-2 , Depth: 19 m
GRAVELCOARSEFINE MEDIUM S A N DS I L TCLAY
Hydrometer Analysis Sieve Analysis
Extension of Barauni Super Critical Coal Fired Thermal Power Station at Barauni, Bihar. M/s. STEAG Energy Services (India) Pvt. Ltd.
Project No. 215081-II Plate 37 of 69

Borehole Number
Sample Depth, m
% Gravel
% Sand % Silt %
Clay D60 D50 D30 D10 Cu Cc
BH-P-2 21.00 0 94 6 0 0.280 0.250 0.201 0.142 2.0 1.02
BH-P-2 23.00 0 98 2 0 0.295 0.260 0.212 0.157 1.9 0.97
BH-P-2 25.00 0 96 4 0 0.282 0.250 0.206 0.155 1.8 0.97
BH-P-2 27.00 0 96 4 0 0.291 0.260 0.211 0.158 1.8 0.97
BH-P-2 29.00 0 96 4 0 0.259 0.220 0.194 0.150 1.7 0.97
Sample Details
Sample Description
Fine sand (SP-SM)
IS : 2720 (Part 4) - 1985, RA-2010Grain Size Analysis
Test Results
Fine sand (SP)
Fine sand (SP)
Fine sand (SP)
Fine sand (SP)
Grain Size Distribution Curve
0
10
20
30
40
50
60
70
80
90
100
0.001 0.010 0.100 1.000 10.000
Particle Size, mm
% Fin
er by
Weig
ht
Borehole No: P-2 , Depth: 21 mBorehole No: P-2 , Depth: 23 mBorehole No: P-2 , Depth: 25 mBorehole No: P-2 , Depth: 27 mBorehole No: P-2 , Depth: 29 m
GRAVELCOARSEFINE MEDIUM S A N DS I L TCLAY
Hydrometer Analysis Sieve Analysis
Extension of Barauni Super Critical Coal Fired Thermal Power Station at Barauni, Bihar. M/s. STEAG Energy Services (India) Pvt. Ltd.
Project No. 215081-II Plate 38 of 69

Borehole Number
Sample Depth, m
% Gravel
% Sand % Silt %
Clay D60 D50 D30 D10 Cu Cc
BH-P-2 31.00 0 95 5 0 0.268 0.230 0.194 0.128 2.1 1.10
BH-P-2 34.00 1 95 4 0 0.257 0.220 0.192 0.139 1.9 1.03
BH-P-2 36.00 0 89 11 0 0.239 0.210 0.177
BH-P-2 38.00 6 89 5 0 0.259 0.220 0.187 0.113 2.3 1.19
BH-P-2 40.00 4 87 9 0 0.252 0.220 0.178 0.084 3.0 1.50
Sample Details
Sample Description
Fine sand (SP-SM)
IS : 2720 (Part 4) - 1985, RA-2010Grain Size Analysis
Test Results
Fine sand with traces of gravel (SP)
Fine sand (SP-SM)
Fine sand with traces of gravel (SP-SM)
Fine sand with gravel (SP-SM)
Grain Size Distribution Curve
0
10
20
30
40
50
60
70
80
90
100
0.001 0.010 0.100 1.000 10.000Particle Size, mm
% Fin
er by
Weig
ht
Borehole No: P-2 , Depth: 31 mBorehole No: P-2 , Depth: 34 mBorehole No: P-2 , Depth: 36 mBorehole No: P-2 , Depth: 38 mBorehole No: P-2 , Depth: 40 m
GRAVELCOARSEFINE MEDIUM S A N DS I L TCLAY
Hydrometer Analysis Sieve Analysis
Extension of Barauni Super Critical Coal Fired Thermal Power Station at Barauni, Bihar. M/s. STEAG Energy Services (India) Pvt. Ltd.
Project No. 215081-II Plate 39 of 69

Borehole Number
Sample Depth, m
% Gravel
% Sand % Silt %
Clay D60 D50 D30 D10 Cu Cc
BH-P-3 0.50 18 28 49 5 0.127 0.060 0.025 0.004 31.8 1.23
BH-P-3 2.50 0 41 54 5 0.082 0.052 0.025 0.004 20.5 1.91
BH-P-3 4.50 0 8 61 31 0.006 0.004 0.002
BH-P-3 6.50 13 7 73 7 0.036 0.024 0.014 0.003 12.0 1.81
BH-P-3 10.50 0 61 36 3 0.111 0.090 0.056 0.014 7.9 2.02
Sample Details
Sample Description
FILL: Flyash
IS : 2720 (Part 4) - 1985, RA-2010Grain Size Analysis
Test Results
FILL: Flyash
Sandy silt (CL)
Silty fine sand (SM)
Sandy silt with gravel (CL)
Grain Size Distribution Curve
0
10
20
30
40
50
60
70
80
90
100
0.001 0.010 0.100 1.000 10.000Particle Size, mm
% Fin
er by
Weig
ht
Borehole No: P-3 , Depth: 0.5 mBorehole No: P-3 , Depth: 2.5 mBorehole No: P-3 , Depth: 4.5 mBorehole No: P-3 , Depth: 6.5 mBorehole No: P-3 , Depth: 10.5 m
GRAVELCOARSEFINE MEDIUM S A N DS I L TCLAY
Hydrometer Analysis Sieve Analysis
Extension of Barauni Super Critical Coal Fired Thermal Power Station at Barauni, Bihar. M/s. STEAG Energy Services (India) Pvt. Ltd.
Project No. 215081-II Plate 40 of 69
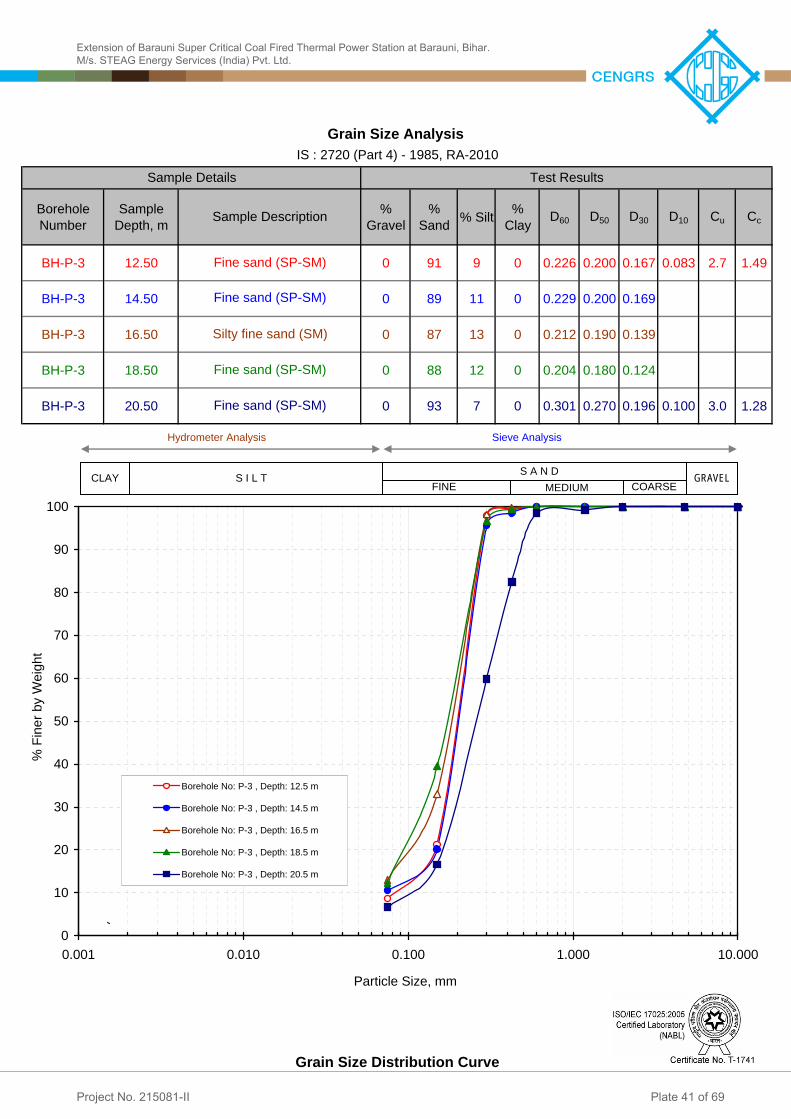
Borehole Number
Sample Depth, m
% Gravel
% Sand % Silt %
Clay D60 D50 D30 D10 Cu Cc
BH-P-3 12.50 0 91 9 0 0.226 0.200 0.167 0.083 2.7 1.49
BH-P-3 14.50 0 89 11 0 0.229 0.200 0.169
BH-P-3 16.50 0 87 13 0 0.212 0.190 0.139
BH-P-3 18.50 0 88 12 0 0.204 0.180 0.124
BH-P-3 20.50 0 93 7 0 0.301 0.270 0.196 0.100 3.0 1.28
Sample Details
Sample Description
Fine sand (SP-SM)
IS : 2720 (Part 4) - 1985, RA-2010Grain Size Analysis
Test Results
Fine sand (SP-SM)
Silty fine sand (SM)
Fine sand (SP-SM)
Fine sand (SP-SM)
Grain Size Distribution Curve
0
10
20
30
40
50
60
70
80
90
100
0.001 0.010 0.100 1.000 10.000Particle Size, mm
% Fin
er by
Weig
ht
Borehole No: P-3 , Depth: 12.5 mBorehole No: P-3 , Depth: 14.5 mBorehole No: P-3 , Depth: 16.5 mBorehole No: P-3 , Depth: 18.5 mBorehole No: P-3 , Depth: 20.5 m
GRAVELCOARSEFINE MEDIUM S A N DS I L TCLAY
Hydrometer Analysis Sieve Analysis
Extension of Barauni Super Critical Coal Fired Thermal Power Station at Barauni, Bihar. M/s. STEAG Energy Services (India) Pvt. Ltd.
Project No. 215081-II Plate 41 of 69

Borehole Number
Sample Depth, m
% Gravel
% Sand % Silt %
Clay D60 D50 D30 D10 Cu Cc
BH-P-3 22.50 0 90 10 0 0.314 0.280 0.199 0.078 4.0 1.62
BH-P-3 24.50 0 94 6 0 0.307 0.280 0.206 0.116 2.7 1.19
BH-P-3 26.50 0 92 8 0 0.253 0.230 0.187 0.100 2.5 1.38
BH-P-3 28.50 1 91 8 0 0.279 0.250 0.199 0.115 2.4 1.23
BH-P-3 30.50 0 96 4 0 0.268 0.240 0.198 0.152 1.8 0.96
Sample Details
Sample Description
Fine sand (SP-SM)
IS : 2720 (Part 4) - 1985, RA-2010Grain Size Analysis
Test Results
Fine sand (SP-SM)
Fine sand (SP-SM)
Fine sand (SP)
Fine sand with traces of gravel (SP-SM)
Grain Size Distribution Curve
0
10
20
30
40
50
60
70
80
90
100
0.001 0.010 0.100 1.000 10.000Particle Size, mm
% Fin
er by
Weig
ht
Borehole No: P-3 , Depth: 22.5 mBorehole No: P-3 , Depth: 24.5 mBorehole No: P-3 , Depth: 26.5 mBorehole No: P-3 , Depth: 28.5 mBorehole No: P-3 , Depth: 30.5 m
GRAVELCOARSEFINE MEDIUM S A N DS I L TCLAY
Hydrometer Analysis Sieve Analysis
Extension of Barauni Super Critical Coal Fired Thermal Power Station at Barauni, Bihar. M/s. STEAG Energy Services (India) Pvt. Ltd.
Project No. 215081-II Plate 42 of 69

Borehole Number
Sample Depth, m
% Gravel
% Sand % Silt %
Clay D60 D50 D30 D10 Cu Cc
BH-P-3 32.50 0 94 6 0 0.290 0.270 0.205 0.143 2.0 1.01
BH-P-3 34.50 0 91 9 0 0.298 0.270 0.204 0.098 3.0 1.43
BH-P-3 36.50 0 96 4 0 0.259 0.230 0.195 0.153 1.7 0.96
BH-P-3 38.50 0 95 5 0 0.267 0.240 0.199 0.154 1.7 0.96
Sample Details
Sample Description
Fine sand (SP-SM)
IS : 2720 (Part 4) - 1985, RA-2010Grain Size Analysis
Test Results
Fine sand (SP-SM)
Fine sand (SP)
Fine sand (SP-SM)
Grain Size Distribution Curve
0
10
20
30
40
50
60
70
80
90
100
0.001 0.010 0.100 1.000 10.000Particle Size, mm
% Fin
er by
Weig
ht
Borehole No: P-3 , Depth: 32.5 m
Borehole No: P-3 , Depth: 34.5 m
Borehole No: P-3 , Depth: 36.5 m
Borehole No: P-3 , Depth: 38.5 m
GRAVELCOARSEFINE MEDIUM S A N DS I L TCLAY
Hydrometer Analysis Sieve Analysis
Extension of Barauni Super Critical Coal Fired Thermal Power Station at Barauni, Bihar. M/s. STEAG Energy Services (India) Pvt. Ltd.
Project No. 215081-II Plate 43 of 69

Borehole Number
Sample Depth, m
% Gravel
% Sand % Silt %
Clay D60 D50 D30 D10 Cu Cc
BH-P-4 1.50 1 25 61 13 0.031 0.019 0.008
BH-P-4 3.50 0 29 57 14 0.043 0.022 0.009
BH-P-4 5.50 0 12 78 10 0.018 0.014 0.006
BH-P-4 6.50 0 3 82 15 0.016 0.013 0.006
BH-P-4 8.50 0 87 13 0 0.211 0.190 0.137
Grain Size Distribution Curve
Silty fine sand (SM)
Clayey silt (CI)
FILL: Flyash
Sandy silt (CL)
IS : 2720 (Part 4) - 1985, RA-2010Grain Size Analysis
Test ResultsSample Details
Sample Description
FILL: Flyash
0
10
20
30
40
50
60
70
80
90
100
0.001 0.010 0.100 1.000 10.000Particle Size, mm
% Fin
er by
Weig
ht
Borehole No: P-4 , Depth: 1.5 mBorehole No: P-4 , Depth: 3.5 mBorehole No: P-4 , Depth: 5.5 mBorehole No: P-4 , Depth: 6.5 mBorehole No: P-4 , Depth: 8.5 m
GRAVELCOARSEFINE MEDIUM S A N DS I L TCLAY
Hydrometer Analysis Sieve Analysis
Extension of Barauni Super Critical Coal Fired Thermal Power Station at Barauni, Bihar. M/s. STEAG Energy Services (India) Pvt. Ltd.
Project No. 215081-II Plate 44 of 69

Borehole Number
Sample Depth, m
% Gravel
% Sand % Silt %
Clay D60 D50 D30 D10 Cu Cc
BH-P-4 10.50 0 86 14 0 0.227 0.200 0.168
BH-P-4 12.50 0 86 14 0 0.218 0.190 0.152
BH-P-4 14.50 0 87 13 0 0.229 0.200 0.171
BH-P-4 16.50 0 95 5 0 0.241 0.220 0.186 0.144 1.7 1.00
BH-P-4 18.50 0 87 13 0 0.204 0.180 0.124
Grain Size Distribution Curve
Silty fine sand (SM)
Fine sand (SP-SM)
Silty fine sand (SM)
Silty fine sand (SM)
IS : 2720 (Part 4) - 1985, RA-2010Grain Size Analysis
Test ResultsSample Details
Sample Description
Silty fine sand (SM)
0
10
20
30
40
50
60
70
80
90
100
0.001 0.010 0.100 1.000 10.000Particle Size, mm
% Fin
er by
Weig
ht
Borehole No: P-4 , Depth: 10.5 mBorehole No: P-4 , Depth: 12.5 mBorehole No: P-4 , Depth: 14.5 mBorehole No: P-4 , Depth: 16.5 mBorehole No: P-4 , Depth: 18.5 m
GRAVELCOARSEFINE MEDIUM S A N DS I L TCLAY
Hydrometer Analysis Sieve Analysis
Extension of Barauni Super Critical Coal Fired Thermal Power Station at Barauni, Bihar. M/s. STEAG Energy Services (India) Pvt. Ltd.
Project No. 215081-II Plate 45 of 69

Borehole Number
Sample Depth, m
% Gravel
% Sand % Silt %
Clay D60 D50 D30 D10 Cu Cc
BH-P-4 20.50 0 88 12 0 0.222 0.200 0.156
BH-P-4 22.50 0 87 13 0 0.222 0.200 0.158
BH-P-4 24.50 0 87 13 0 0.212 0.180 0.132
BH-P-4 26.50 0 90 10 0 0.249 0.220 0.176 0.077 3.2 1.62
BH-P-4 28.50 1 96 3 0 0.278 0.250 0.202 0.152 1.8 0.97
Grain Size Distribution Curve
Fine sand with traces of gravel (SP)
Fine sand (SP-SM)
Silty fine sand (SM)
Silty fine sand (SM)
IS : 2720 (Part 4) - 1985, RA-2010Grain Size Analysis
Test ResultsSample Details
Sample Description
Fine sand (SP-SM)
0
10
20
30
40
50
60
70
80
90
100
0.001 0.010 0.100 1.000 10.000Particle Size, mm
% Fin
er by
Weig
ht
Borehole No: P-4 , Depth: 20.5 mBorehole No: P-4 , Depth: 22.5 mBorehole No: P-4 , Depth: 24.5 mBorehole No: P-4 , Depth: 26.5 mBorehole No: P-4 , Depth: 28.5 m
GRAVELCOARSEFINE MEDIUM S A N DS I L TCLAY
Hydrometer Analysis Sieve Analysis
Extension of Barauni Super Critical Coal Fired Thermal Power Station at Barauni, Bihar. M/s. STEAG Energy Services (India) Pvt. Ltd.
Project No. 215081-II Plate 46 of 69

Borehole Number
Sample Depth, m
% Gravel
% Sand % Silt %
Clay D60 D50 D30 D10 Cu Cc
BH-P-4 30.50 1 95 4 0 0.276 0.250 0.199 0.139 2.0 1.03
BH-P-4 32.50 0 89 11 0 0.239 0.210 0.159
BH-P-4 35.50 0 87 13 0 0.214 0.180 0.123
BH-P-4 37.50 0 91 9 0 0.244 0.210 0.163 0.078 3.1 1.40
BH-P-4 40.00 0 84 16 0 0.252 0.210 0.159
Grain Size Distribution Curve
Silty fine sand (SM)
Fine sand (SP-SM)
Fine sand (SP-SM)
Silty fine sand (SM)
IS : 2720 (Part 4) - 1985, RA-2010Grain Size Analysis
Test ResultsSample Details
Sample Description
Fine sand with traces of gravel (SP)
0
10
20
30
40
50
60
70
80
90
100
0.001 0.010 0.100 1.000 10.000Particle Size, mm
% Fin
er by
Weig
ht
Borehole No: P-4 , Depth: 30.5 mBorehole No: P-4 , Depth: 32.5 mBorehole No: P-4 , Depth: 35.5 mBorehole No: P-4 , Depth: 37.5 mBorehole No: P-4 , Depth: 40 m
GRAVELCOARSEFINE MEDIUM S A N DS I L TCLAY
Hydrometer Analysis Sieve Analysis
Extension of Barauni Super Critical Coal Fired Thermal Power Station at Barauni, Bihar. M/s. STEAG Energy Services (India) Pvt. Ltd.
Project No. 215081-II Plate 47 of 69

Borehole Number
Sample Depth, m
% Gravel
% Sand % Silt %
Clay D60 D50 D30 D10 Cu Cc
BH-P-5 1.00 26 18 0.331 0.040
BH-P-5 3.00 3 15 54 28 0.008 0.005 0.002
BH-P-5 4.00 0 4 81 15 0.017 0.013 0.006
BH-P-5 5.00 0 6 71 23 0.009 0.007 0.003
BH-P-5 8.00 0 81 19 0 0.216 0.190 0.137
Grain Size Distribution Curve
Silty fine sand (SM)
Clayey silt (CI)
FILL: Flyash
Clayey silt (CI)
56
IS : 2720 (Part 4) - 1985, RA-2010Grain Size Analysis
Test ResultsSample Details
Sample Description
FILL: Flyash
0
10
20
30
40
50
60
70
80
90
100
0.001 0.010 0.100 1.000 10.000 100.000Particle Size, mm
% Fin
er by
Weig
ht
Borehole No: P-5 , Depth: 1 mBorehole No: P-5 , Depth: 3 mBorehole No: P-5 , Depth: 4 mBorehole No: P-5 , Depth: 5 mBorehole No: P-5 , Depth: 8 m
Hydrometer Analysis Sieve Analysis
GRAVELFINE MEDIUM
S I L TCOARSE
S A N DCLAYFINE COARSE
Extension of Barauni Super Critical Coal Fired Thermal Power Station at Barauni, Bihar. M/s. STEAG Energy Services (India) Pvt. Ltd.
Project No. 215081-II Plate 48 of 69

Borehole Number
Sample Depth, m
% Gravel
% Sand % Silt %
Clay D60 D50 D30 D10 Cu Cc
BH-P-5 10.00 2 84 14 0 0.231 0.200 0.167
BH-P-5 13.00 0 88 12 0 0.239 0.210 0.173
BH-P-5 15.00 2 92 6 0 0.467 0.400 0.274 0.159 2.9 1.01
BH-P-5 17.00 0 95 5 0 0.289 0.260 0.204 0.142 2.0 1.01
BH-P-5 19.00 0 87 13 0 0.244 0.220 0.180
Grain Size Distribution Curve
Silty fine sand (SM)
Fine sand (SP-SM)
Fine sand (SP-SM)Fine sand with traces of
gravel (SP-SM)
IS : 2720 (Part 4) - 1985, RA-2010Grain Size Analysis
Test ResultsSample Details
Sample Description
Silty fine sand (SM)
0
10
20
30
40
50
60
70
80
90
100
0.001 0.010 0.100 1.000 10.000Particle Size, mm
% Fin
er by
Weig
ht
Borehole No: P-5 , Depth: 10 mBorehole No: P-5 , Depth: 13 mBorehole No: P-5 , Depth: 15 mBorehole No: P-5 , Depth: 17 mBorehole No: P-5 , Depth: 19 m
GRAVELCOARSEFINE MEDIUM S A N DS I L TCLAY
Hydrometer Analysis Sieve Analysis
Extension of Barauni Super Critical Coal Fired Thermal Power Station at Barauni, Bihar. M/s. STEAG Energy Services (India) Pvt. Ltd.
Project No. 215081-II Plate 49 of 69

Borehole Number
Sample Depth, m
% Gravel
% Sand % Silt %
Clay D60 D50 D30 D10 Cu Cc
BH-P-5 21.00 0 87 13 0 0.223 0.200 0.157
BH-P-5 23.00 0 98 2 0 0.297 0.270 0.212 0.156 1.9 0.97
BH-P-5 25.00 0 93 7 0 0.317 0.280 0.213 0.140 2.3 1.02
BH-P-5 27.00 0 87 13 0 0.258 0.220 0.186
BH-P-5 29.00 0 98 2 0 0.377 0.320 0.243 0.167 2.3 0.94
Grain Size Distribution Curve
Fine sand (SP)
Silty fine sand (SM)
Fine sand (SP)
Fine sand (SP-SM)
IS : 2720 (Part 4) - 1985, RA-2010Grain Size Analysis
Test ResultsSample Details
Sample Description
Silty fine sand (SM)
0
10
20
30
40
50
60
70
80
90
100
0.001 0.010 0.100 1.000 10.000Particle Size, mm
% Fin
er by
Weig
ht
Borehole No: P-5 , Depth: 21 mBorehole No: P-5 , Depth: 23 mBorehole No: P-5 , Depth: 25 mBorehole No: P-5 , Depth: 27 mBorehole No: P-5 , Depth: 29 m
GRAVELCOARSEFINE MEDIUM S A N DS I L TCLAY
Hydrometer Analysis Sieve Analysis
Extension of Barauni Super Critical Coal Fired Thermal Power Station at Barauni, Bihar. M/s. STEAG Energy Services (India) Pvt. Ltd.
Project No. 215081-II Plate 50 of 69

Borehole Number
Sample Depth, m
% Gravel
% Sand % Silt %
Clay D60 D50 D30 D10 Cu Cc
BH-P-5 31.00 0 99 1 0 0.419 0.360 0.256 0.175 2.4 0.89
BH-P-5 33.00 3 87 10 0 0.454 0.400 0.246 0.082 5.5 1.63
BH-P-5 35.00 2 97 1 0 0.395 0.330 0.248 0.170 2.3 0.92
BH-P-5 37.00 2 93 5 0 0.409 0.340 0.250 0.160 2.6 0.96
BH-P-5 40.00 0 88 12 0 0.230 0.200 0.153
Grain Size Distribution Curve
Fine sand (SP-SM)
Fine sand with traces of gravel (SP-SM)
Fine sand with traces of gravel (SP-SM)
Fine sand with traces of gravel (SP)
IS : 2720 (Part 4) - 1985, RA-2010Grain Size Analysis
Test ResultsSample Details
Sample Description
Fine sand (SP)
0
10
20
30
40
50
60
70
80
90
100
0.001 0.010 0.100 1.000 10.000Particle Size, mm
% Fin
er by
Weig
ht
Borehole No: P-5 , Depth: 31 mBorehole No: P-5 , Depth: 33 mBorehole No: P-5 , Depth: 35 mBorehole No: P-5 , Depth: 37 mBorehole No: P-5 , Depth: 40 m
GRAVELCOARSEFINE MEDIUM S A N DS I L TCLAY
Hydrometer Analysis Sieve Analysis
Extension of Barauni Super Critical Coal Fired Thermal Power Station at Barauni, Bihar. M/s. STEAG Energy Services (India) Pvt. Ltd.
Project No. 215081-II Plate 51 of 69
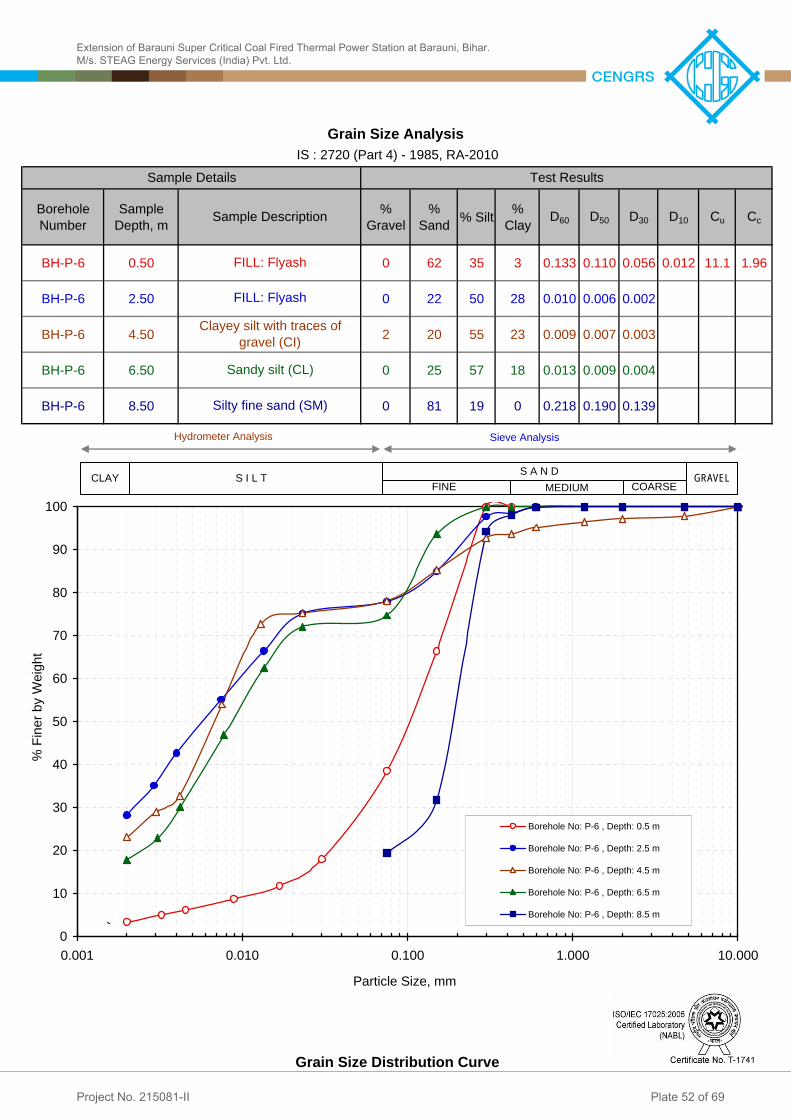
Borehole Number
Sample Depth, m
% Gravel
% Sand % Silt %
Clay D60 D50 D30 D10 Cu Cc
BH-P-6 0.50 0 62 35 3 0.133 0.110 0.056 0.012 11.1 1.96
BH-P-6 2.50 0 22 50 28 0.010 0.006 0.002
BH-P-6 4.50 2 20 55 23 0.009 0.007 0.003
BH-P-6 6.50 0 25 57 18 0.013 0.009 0.004
BH-P-6 8.50 0 81 19 0 0.218 0.190 0.139
Grain Size Distribution Curve
Silty fine sand (SM)
Sandy silt (CL)
FILL: FlyashClayey silt with traces of
gravel (CI)
IS : 2720 (Part 4) - 1985, RA-2010Grain Size Analysis
Test ResultsSample Details
Sample Description
FILL: Flyash
0
10
20
30
40
50
60
70
80
90
100
0.001 0.010 0.100 1.000 10.000Particle Size, mm
% Fin
er by
Weig
ht
Borehole No: P-6 , Depth: 0.5 mBorehole No: P-6 , Depth: 2.5 mBorehole No: P-6 , Depth: 4.5 mBorehole No: P-6 , Depth: 6.5 mBorehole No: P-6 , Depth: 8.5 m
GRAVELCOARSEFINE MEDIUM S A N DS I L TCLAY
Hydrometer Analysis Sieve Analysis
Extension of Barauni Super Critical Coal Fired Thermal Power Station at Barauni, Bihar. M/s. STEAG Energy Services (India) Pvt. Ltd.
Project No. 215081-II Plate 52 of 69

Borehole Number
Sample Depth, m
% Gravel
% Sand % Silt %
Clay D60 D50 D30 D10 Cu Cc
BH-P-6 10.50 0 76 24 0 0.200 0.170 0.099
BH-P-6 12.50 0 79 21 0 0.216 0.190 0.136
BH-P-6 14.50 1 80 19 0 0.219 0.190 0.153
BH-P-6 17.50 0 94 6 0 0.225 0.190 0.149 0.088 2.6 1.12
BH-P-6 19.50 0 98 2 0 0.368 0.220 0.234 0.148 2.5 1.01
Grain Size Distribution Curve
Fine sand (SP)
Fine sand (SP-SM)
Silty fine sand (SM)Silty fine sand with traces of
gravel (SM)
IS : 2720 (Part 4) - 1985, RA-2010Grain Size Analysis
Test ResultsSample Details
Sample Description
Silty fine sand (SM)
0
10
20
30
40
50
60
70
80
90
100
0.001 0.010 0.100 1.000 10.000Particle Size, mm
% Fin
er by
Weig
ht
Borehole No: P-6 , Depth: 10.5 mBorehole No: P-6 , Depth: 12.5 mBorehole No: P-6 , Depth: 14.5 mBorehole No: P-6 , Depth: 17.5 mBorehole No: P-6 , Depth: 19.5 m
GRAVELCOARSEFINE MEDIUM S A N DS I L TCLAY
Hydrometer Analysis Sieve Analysis
Extension of Barauni Super Critical Coal Fired Thermal Power Station at Barauni, Bihar. M/s. STEAG Energy Services (India) Pvt. Ltd.
Project No. 215081-II Plate 53 of 69
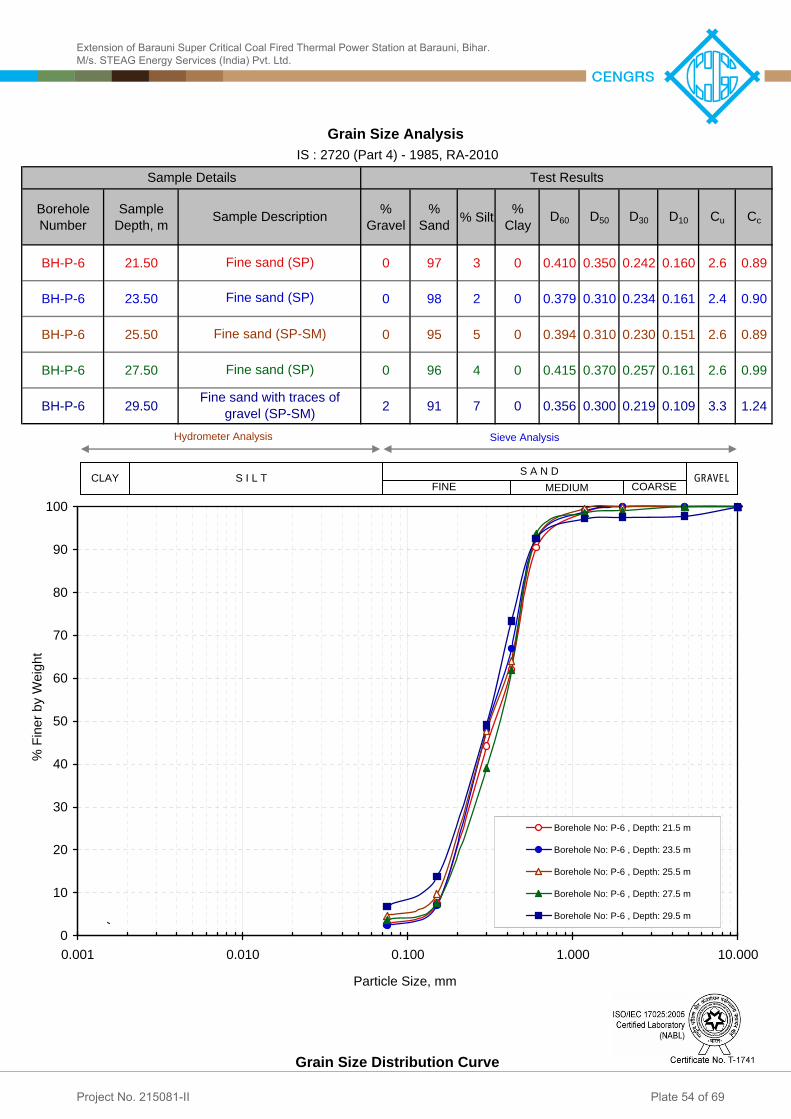
Borehole Number
Sample Depth, m
% Gravel
% Sand % Silt %
Clay D60 D50 D30 D10 Cu Cc
BH-P-6 21.50 0 97 3 0 0.410 0.350 0.242 0.160 2.6 0.89
BH-P-6 23.50 0 98 2 0 0.379 0.310 0.234 0.161 2.4 0.90
BH-P-6 25.50 0 95 5 0 0.394 0.310 0.230 0.151 2.6 0.89
BH-P-6 27.50 0 96 4 0 0.415 0.370 0.257 0.161 2.6 0.99
BH-P-6 29.50 2 91 7 0 0.356 0.300 0.219 0.109 3.3 1.24
Grain Size Distribution Curve
Fine sand with traces of gravel (SP-SM)
Fine sand (SP)
Fine sand (SP)
Fine sand (SP-SM)
IS : 2720 (Part 4) - 1985, RA-2010Grain Size Analysis
Test ResultsSample Details
Sample Description
Fine sand (SP)
0
10
20
30
40
50
60
70
80
90
100
0.001 0.010 0.100 1.000 10.000Particle Size, mm
% Fin
er by
Weig
ht
Borehole No: P-6 , Depth: 21.5 mBorehole No: P-6 , Depth: 23.5 mBorehole No: P-6 , Depth: 25.5 mBorehole No: P-6 , Depth: 27.5 mBorehole No: P-6 , Depth: 29.5 m
GRAVELCOARSEFINE MEDIUM S A N DS I L TCLAY
Hydrometer Analysis Sieve Analysis
Extension of Barauni Super Critical Coal Fired Thermal Power Station at Barauni, Bihar. M/s. STEAG Energy Services (India) Pvt. Ltd.
Project No. 215081-II Plate 54 of 69

Borehole Number
Sample Depth, m
% Gravel
% Sand % Silt %
Clay D60 D50 D30 D10 Cu Cc
BH-P-6 31.50 0 98 2 0 0.472 0.400 0.288 0.185 2.6 0.95
BH-P-6 33.80 1 97 2 0 0.478 0.400 0.294 0.187 2.6 0.97
BH-P-6 35.50 0 97 3 0 0.456 0.390 0.277 0.181 2.5 0.93
BH-P-6 37.50 2 96 2 0 0.479 0.400 0.291 0.187 2.6 0.95
BH-P-6 40.00 0 97 3 0 0.497 0.440 0.314 0.188 2.6 1.06
Grain Size Distribution Curve
Fine sand (SP)
Fine sand with traces of gravel (SP)
Fine sand with traces of gravel (SP)
Fine sand (SP)
IS : 2720 (Part 4) - 1985, RA-2010Grain Size Analysis
Test ResultsSample Details
Sample Description
Fine sand (SP)
0
10
20
30
40
50
60
70
80
90
100
0.001 0.010 0.100 1.000 10.000Particle Size, mm
% Fin
er by
Weig
ht
Borehole No: P-6 , Depth: 31.5 mBorehole No: P-6 , Depth: 33.8 mBorehole No: P-6 , Depth: 35.5 mBorehole No: P-6 , Depth: 37.5 mBorehole No: P-6 , Depth: 40 m
GRAVELCOARSEFINE MEDIUM S A N DS I L TCLAY
Hydrometer Analysis Sieve Analysis
Extension of Barauni Super Critical Coal Fired Thermal Power Station at Barauni, Bihar. M/s. STEAG Energy Services (India) Pvt. Ltd.
Project No. 215081-II Plate 55 of 69

0.00 kg/cm2
38.9 degrees
Mohr-Coulomb Failure Envelope
IS : 2720 (Part-13)-1986, RA-2010
Sample Description: FILL: FlyashSample Depth: 3 m
Saturated
Angle of Internal Friction, :
Cohesion Intercept, c :
Sample No.: UDS1Borehole No.: BH-P-1
Type of Sample:
Samp
le De
tails
Drained Direct Shear Test
Moisture Content (%):Dry Density of Soil (g/cm3):
Test
Resu
lts
Remoulded1.06
y = 0.8061xR2 = 0.991
0.0
0.5
1.0
1.5
2.0
2.5
0.0 0.5 1.0 1.5 2.0 2.5Normal Stress sff, kg/cm2
Shea
r Stre
ss t ff,
kg/cm
2
Extension of Barauni Super Critical Coal Fired Thermal Power Station at Barauni, Bihar. M/s. STEAG Energy Services (India) Pvt. Ltd.
Project No. 215081-II Plate 56 of 69

0.00 kg/cm2
30.3 degrees
Mohr-Coulomb Failure Envelope
IS : 2720 (Part-13)-1986, RA-2010
Sample Description: Silty fine sandSample Depth: 6 m
Saturated
Angle of Internal Friction, :
Cohesion Intercept, c :
Sample No.: UDS2Borehole No.: BH-P-1
Type of Sample:
Samp
le De
tails
Drained Direct Shear Test
Moisture Content (%):Dry Density of Soil (g/cm3):
Test
Resu
lts
Remoulded1.48
y = 0.5835xR2 = 0.9981
0.0
0.5
1.0
1.5
2.0
2.5
0.0 0.5 1.0 1.5 2.0 2.5Normal Stress sff, kg/cm2
Shea
r Stre
ss t ff,
kg/cm
2
Extension of Barauni Super Critical Coal Fired Thermal Power Station at Barauni, Bihar. M/s. STEAG Energy Services (India) Pvt. Ltd.
Project No. 215081-II Plate 57 of 69

0.00 kg/cm2
30.6 degrees
Mohr-Coulomb Failure Envelope
IS : 2720 (Part-13)-1986, RA-2010
Sample Description: FILL: FlyashSample Depth: 3 m
Saturated
Angle of Internal Friction, :
Cohesion Intercept, c :
Sample No.: UDS1Borehole No.: BH-P-2
Type of Sample:
Samp
le De
tails
Drained Direct Shear Test
Moisture Content (%):Dry Density of Soil (g/cm3):
Test
Resu
lts
Remoulded1.07
y = 0.5925xR2 = 0.9966
0.0
0.5
1.0
1.5
2.0
2.5
0.0 0.5 1.0 1.5 2.0 2.5Normal Stress sff, kg/cm2
Shea
r Stre
ss t ff,
kg/cm
2
Extension of Barauni Super Critical Coal Fired Thermal Power Station at Barauni, Bihar. M/s. STEAG Energy Services (India) Pvt. Ltd.
Project No. 215081-II Plate 58 of 69
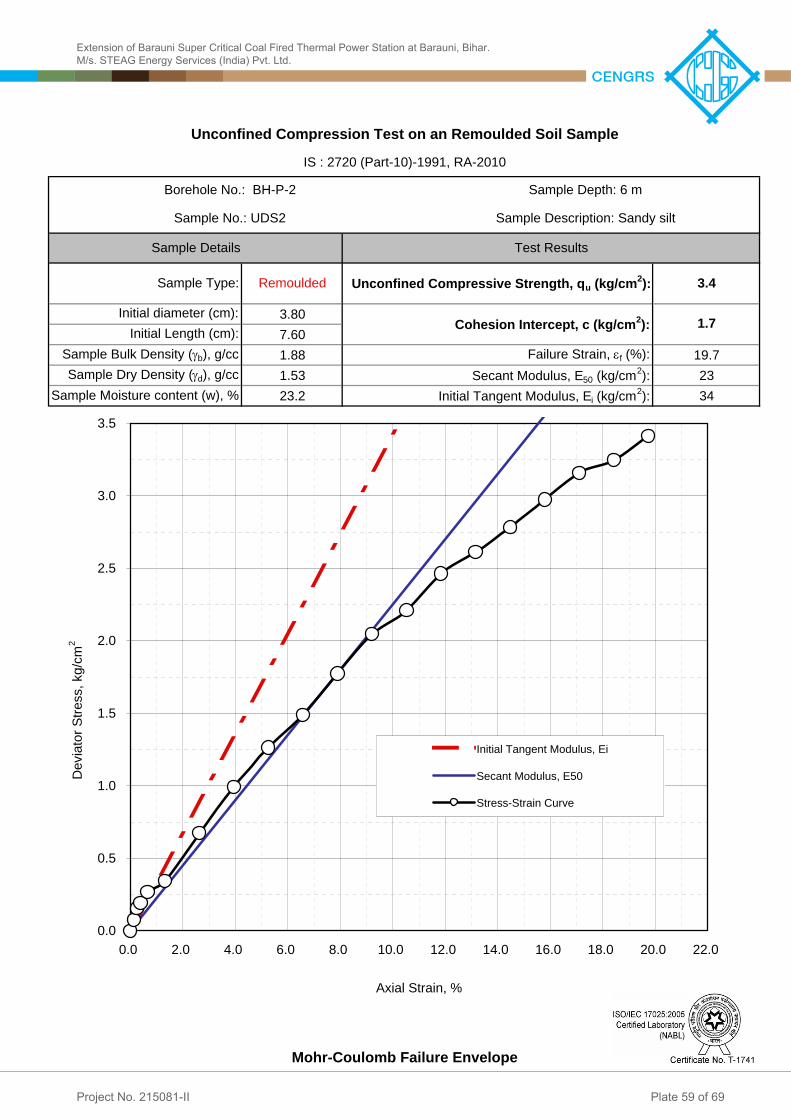
3.807.601.88 19.71.53 2323.2 34
Sample Dry Density (d), g/cc Secant Modulus, E50 (kg/cm2): Failure Strain, f (%):
Cohesion Intercept, c (kg/cm2): Initial diameter (cm):
Initial Length (cm):Sample Bulk Density (b), g/cc
Unconfined Compressive Strength, qu (kg/cm2):
Sample Description: Sandy siltSample Depth: 6 mBorehole No.: BH-P-2
Sample No.: UDS2Test Results
Unconfined Compression Test on an Remoulded Soil Sample
IS : 2720 (Part-10)-1991, RA-2010
Sample Type: Remoulded
1.7
Sample Details
3.4
Mohr-Coulomb Failure Envelope
Initial Tangent Modulus, Ei (kg/cm2): Sample Moisture content (w), %
0.0
0.5
1.0
1.5
2.0
2.5
3.0
3.5
0.0 2.0 4.0 6.0 8.0 10.0 12.0 14.0 16.0 18.0 20.0 22.0
Axial Strain, %
Devia
tor St
ress,
kg/cm
2
Initial Tangent Modulus, Ei
Secant Modulus, E50Stress-Strain Curve
Extension of Barauni Super Critical Coal Fired Thermal Power Station at Barauni, Bihar. M/s. STEAG Energy Services (India) Pvt. Ltd.
Project No. 215081-II Plate 59 of 69

0.00 kg/cm2
28.9 degrees
Mohr-Coulomb Failure Envelope
IS : 2720 (Part-13)-1986, RA-2010
Sample Description: FILL: FlyashSample Depth: 1.5 m
Saturated
Angle of Internal Friction, :
Cohesion Intercept, c :
Sample No.: UDS1Borehole No.: BH-P-3
Type of Sample:
Samp
le De
tails
Drained Direct Shear Test
Moisture Content (%):Dry Density of Soil (g/cm3):
Test
Resu
lts
Remoulded1.13
y = 0.553xR2 = 0.9975
0.0
0.5
1.0
1.5
2.0
2.5
0.0 0.5 1.0 1.5 2.0 2.5Normal Stress sff, kg/cm2
Shea
r Stre
ss t ff,
kg/cm
2
Extension of Barauni Super Critical Coal Fired Thermal Power Station at Barauni, Bihar. M/s. STEAG Energy Services (India) Pvt. Ltd.
Project No. 215081-II Plate 60 of 69

0.00 kg/cm2
33.0 degrees
Mohr-Coulomb Failure Envelope
IS : 2720 (Part-13)-1986, RA-2010
Sample Description: Silty fine sandSample Depth: 7.5 m
Saturated
Angle of Internal Friction, :
Cohesion Intercept, c :
Sample No.: UDS3Borehole No.: BH-P-3
Type of Sample:
Samp
le De
tails
Drained Direct Shear Test
Moisture Content (%):Dry Density of Soil (g/cm3):
Test
Resu
lts
Remoulded1.57
y = 0.6497xR2 = 0.9414
0.0
0.5
1.0
1.5
2.0
2.5
0.0 0.5 1.0 1.5 2.0 2.5Normal Stress sff, kg/cm2
Shea
r Stre
ss t ff,
kg/cm
2
Extension of Barauni Super Critical Coal Fired Thermal Power Station at Barauni, Bihar. M/s. STEAG Energy Services (India) Pvt. Ltd.
Project No. 215081-II Plate 61 of 69

0.00 kg/cm2
28.4 degrees
Mohr-Coulomb Failure Envelope
IS : 2720 (Part-13)-1986, RA-2010
Sample Description: Silty fine sandSample Depth: 10.5 m
Saturated
Angle of Internal Friction, :
Cohesion Intercept, c :
Sample No.: UDS4Borehole No.: BH-P-3
Type of Sample:
Samp
le De
tails
Drained Direct Shear Test
Moisture Content (%):Dry Density of Soil (g/cm3):
Test
Resu
lts
Remoulded1.53
y = 0.5413xR2 = 0.9985
0.0
0.5
1.0
1.5
2.0
2.5
0.0 0.5 1.0 1.5 2.0 2.5Normal Stress sff, kg/cm2
Shea
r Stre
ss t ff,
kg/cm
2
Extension of Barauni Super Critical Coal Fired Thermal Power Station at Barauni, Bihar. M/s. STEAG Energy Services (India) Pvt. Ltd.
Project No. 215081-II Plate 62 of 69

0.00 kg/cm2
35.7 degrees
Mohr-Coulomb Failure Envelope
IS : 2720 (Part-13)-1986, RA-2010
Sample Description: FILL: FlyashSample Depth: 1.5 m
Saturated
Angle of Internal Friction, :
Cohesion Intercept, c :
Sample No.: UDS1Borehole No.: BH-P-4
Type of Sample:
Samp
le De
tails
Drained Direct Shear Test
Moisture Content (%):Dry Density of Soil (g/cm3):
Test
Resu
lts
Remoulded1.01
y = 0.7198xR2 = 0.9982
0.0
0.5
1.0
1.5
2.0
2.5
0.0 0.5 1.0 1.5 2.0 2.5Normal Stress sff, kg/cm2
Shea
r Stre
ss t ff,
kg/cm
2
Extension of Barauni Super Critical Coal Fired Thermal Power Station at Barauni, Bihar. M/s. STEAG Energy Services (India) Pvt. Ltd.
Project No. 215081-II Plate 63 of 69

3.8 3.8 3.87.6 7.6 7.61.87 1.87 1.871.56 1.57 1.5619.9 19.6 19.86.16 6.38 6.5423.7 23.7 23.72.10 kg/cm2
19.0 degrees
Peak Deviator Stress, (3-1)f (kg/cm2):Failure Strain, f (%):
Initial Length (cm):Bulk Density (g/cc):Dry Density (g/cc):
Unconsolidated Undrained Triaxial Test IS : 2720 (Part-11)-1993, RA-2007
Sample Depth: 4.5 mTe
st Re
sults
Moisture Content (%):
Cohesion Intercept, c:Angle of Internal Friction, :
Sample Description: Sandy silt
Mohr-Coulomb Failure Envelope
Borehole No.: BH-P-4
Sample No.: UDS2
Samp
le De
tails
Initial diameter (cm):0.80.60.4Confining Pressure, 0 (kg/cm2):
0.00.51.01.52.02.53.03.54.04.55.05.56.06.57.07.58.0
0.0 0.5 1.0 1.5 2.0 2.5 3.0 3.5 4.0 4.5 5.0 5.5 6.0 6.5 7.0 7.5 8.0Normal Stress sff, kg/cm2
Shea
r Stre
ss t ff,
kg/cm
2
Extension of Barauni Super Critical Coal Fired Thermal Power Station at Barauni, Bihar. M/s. STEAG Energy Services (India) Pvt. Ltd.
Project No. 215081-II Plate 64 of 69

0.00 kg/cm2
32.3 degrees
Mohr-Coulomb Failure Envelope
IS : 2720 (Part-13)-1986, RA-2010
Sample Description: Silty fine sandSample Depth: 7.5 m
Saturated
Angle of Internal Friction, :
Cohesion Intercept, c :
Sample No.: UDS3Borehole No.: BH-P-4
Type of Sample:
Samp
le De
tails
Drained Direct Shear Test
Moisture Content (%):Dry Density of Soil (g/cm3):
Test
Resu
lts
Remoulded1.57
y = 0.6315xR2 = 0.9446
0.0
0.5
1.0
1.5
2.0
2.5
0.0 0.5 1.0 1.5 2.0 2.5Normal Stress sff, kg/cm2
Shea
r Stre
ss t ff,
kg/cm
2
Extension of Barauni Super Critical Coal Fired Thermal Power Station at Barauni, Bihar. M/s. STEAG Energy Services (India) Pvt. Ltd.
Project No. 215081-II Plate 65 of 69

0.00 kg/cm2
39.0 degrees
Mohr-Coulomb Failure Envelope
IS : 2720 (Part-13)-1986, RA-2010
Sample Description: FILL: FlyashSample Depth: 3 m
Saturated
Angle of Internal Friction, :
Cohesion Intercept, c :
Sample No.: UDS1Borehole No.: BH-P-5
Type of Sample:
Samp
le De
tails
Drained Direct Shear Test
Moisture Content (%):Dry Density of Soil (g/cm3):
Test
Resu
lts
Remoulded1.10
y = 0.81xR2 = 0.9927
0.0
0.5
1.0
1.5
2.0
2.5
0.0 0.5 1.0 1.5 2.0 2.5Normal Stress sff, kg/cm2
Shea
r Stre
ss t ff,
kg/cm
2
Extension of Barauni Super Critical Coal Fired Thermal Power Station at Barauni, Bihar. M/s. STEAG Energy Services (India) Pvt. Ltd.
Project No. 215081-II Plate 66 of 69

0.00 kg/cm2
32.4 degrees
Mohr-Coulomb Failure Envelope
IS : 2720 (Part-13)-1986, RA-2010
Sample Description: FILL: FlyashSample Depth: 1.5 m
Saturated
Angle of Internal Friction, :
Cohesion Intercept, c :
Sample No.: UDS1Borehole No.: BH-P-6
Type of Sample:
Samp
le De
tails
Drained Direct Shear Test
Moisture Content (%):Dry Density of Soil (g/cm3):
Test
Resu
lts
Remoulded1.09
y = 0.635xR2 = 0.9732
0.0
0.5
1.0
1.5
2.0
2.5
0.0 0.5 1.0 1.5 2.0 2.5Normal Stress sff, kg/cm2
Shea
r Stre
ss t ff,
kg/cm
2
Extension of Barauni Super Critical Coal Fired Thermal Power Station at Barauni, Bihar. M/s. STEAG Energy Services (India) Pvt. Ltd.
Project No. 215081-II Plate 67 of 69
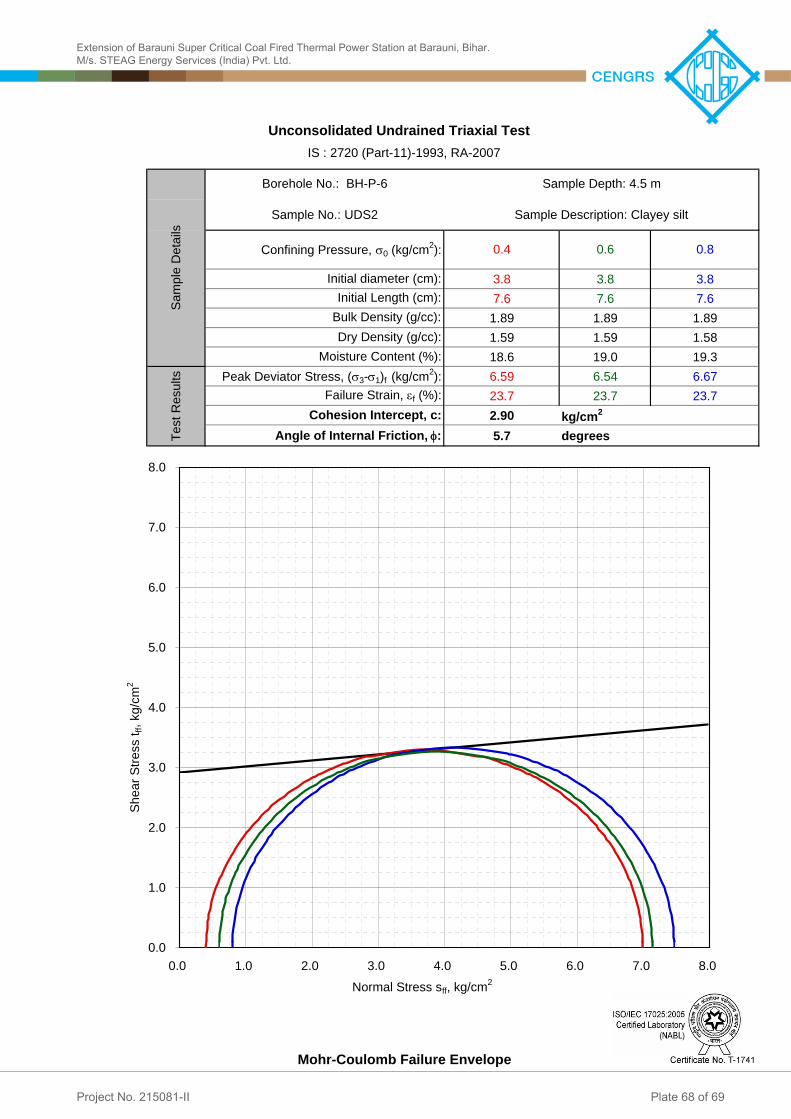
3.8 3.8 3.87.6 7.6 7.61.89 1.89 1.891.59 1.59 1.5818.6 19.0 19.36.59 6.54 6.6723.7 23.7 23.72.90 kg/cm2
5.7 degrees
Peak Deviator Stress, (3-1)f (kg/cm2):Failure Strain, f (%):
Initial Length (cm):Bulk Density (g/cc):Dry Density (g/cc):
Unconsolidated Undrained Triaxial Test IS : 2720 (Part-11)-1993, RA-2007
Sample Depth: 4.5 mTe
st Re
sults
Moisture Content (%):
Cohesion Intercept, c:Angle of Internal Friction, :
Sample Description: Clayey silt
Mohr-Coulomb Failure Envelope
Borehole No.: BH-P-6
Sample No.: UDS2
Samp
le De
tails
Initial diameter (cm):0.80.60.4Confining Pressure, 0 (kg/cm2):
0.0
1.0
2.0
3.0
4.0
5.0
6.0
7.0
8.0
0.0 1.0 2.0 3.0 4.0 5.0 6.0 7.0 8.0Normal Stress sff, kg/cm2
Shea
r Stre
ss t ff,
kg/cm
2
Extension of Barauni Super Critical Coal Fired Thermal Power Station at Barauni, Bihar. M/s. STEAG Energy Services (India) Pvt. Ltd.
Project No. 215081-II Plate 68 of 69

Borehole No. Depth, (m)0.503.000.503.000.502.501.503.500.002.000.502.50
Borehole No.BH-P1BH-P2BH-P3BH-P4BH-P-5BH-P6
12345
NegligibleModerate
HighVery High
0.11 0.05 7.7
0.11 0.06 7.9
0.11 0.05 7.50.11 0.04 7.6
0.11 0.04 7.60.11 0.04 7.5
BH-P5
0.10 0.05 7.40.11 0.05 7.70.11 0.05 7.8
BH-P6
BH-P1
BH-P2
BH-P3
BH-P4
7.5355 192 7.2
Chloride Content (Cl), mg/l172 7.3
340 127 7.4
135 7.3335 150
pH Value8.0
> 2.0
Sulphate Content (SO3), %
Chloride Content (Cl), %
0.11 0.06
0.050.10 7.7
In Groundwater (mg/l)
Soil-Water Extract Test Results
*Source : Institution of Civil Engineers, London (1979)
Not Applicable
0.2 to 0.5
0-2000 ppm
342
0-2000 ppm
0.5 to 1.0
Generally not applicableMore than 10,000 ppm
2000-10,000 ppm
Tropical Climate
> 5000
Temperate ClimateChloride Limits
Requirements for Concrete Exposed to Sulphate Attack as per IS : 456-2000, Clauses 8.2.2.4 and 9.1.2, Table 4, Page-19
Concentration of Sulphates, expressed as SO 3 In-Soil-Water Extract (Total) Percent
Traces (<0.2)Class
Only if considerably in excess of 20,000 ppm
Classification
331
2000-20,000 ppm
300-1200Less than 300
Classification of Chloride Conditions in Groundwater*
1.0 to 2.01200-25002500-5000
Groundwater Test ResultsSulphate Content (SO3), mg/l
347pH Value
TEST RESULTS
IS : 456-2000, SPECIFICATIONS
Chemical Test Results
112 7.4
0.10 0.04 7.7
Extension of Barauni Super Critical Coal Fired Thermal Power Station at Barauni, Bihar. M/s. STEAG Energy Services (India) Pvt. Ltd.
Project No. 215081-II Plate 69 of 69
APPENDIX-A
LIQUEFACTION SUSCEPTIBILITY ASSESSMENT

Several corrections are applied to the field N value:(N1)60 = Nm.CN.CE.CB.CR.CS(N1)60,cs = + (N1)60
FOS = Factor of safety against liquefaction (N1)60 = Corrected SPT N valueCRR7.5 = Cyclic Resistance Ratio Nm = Measured (field) SPT N value
CSR = Cyclic Stress Ratio Coefficients based on fines contentIV 45.5 N amax = Peak horizontal acceleration CN= Factor to normalize Nm to reference overburden stress6.7 9.6 WT g = Acceleration of gravity CE = Correction for hammer energy ratio (ER)0.24 4.0 150 'vo = Effective vertical overburden stress CR = correction for rod length1.0 41.5 0.75 rd = Stress reduction coefficient CS = correction for samplers with or without liners
Laye
r
Soil
Des
crip
tion
Dep
th to
Top
of
Laye
r (m
)
Laye
r Thi
ckne
ss (m
)
Uni
t wei
ght
(T/m
3 )
Tota
l Ove
rbur
den
Pres
sure
at M
iddl
e of
Lay
er (T
/m2 )
Effe
ctiv
e St
ress
at
Mid
dle
of L
ayer
, ba
sed
on d
esig
n G
WT
(T/m
2 )
Effe
ctiv
e St
ress
at
Mid
dle
of L
ayer
, ba
sed
on a
ctua
l G
WT
(T/m
2 )
Nm
Fine
s C
onte
nt (%
)
CN
CE
CB
CR
CS
(N1)
60,c
s
CR
R(7
.5)
Stre
ss R
educ
tion
Fact
or (r
d)
CSR
Mag
nitu
de S
calin
g Fa
ctor
CSR
7.5
Com
pute
d FO
S ag
ains
t liq
uefa
ctio
n
Plas
ticity
Inde
x (%
)
1 Fly ash 0.0 1.0 1.40 0.7 0.7 0.700 10 79 1.70 0.75 1.05 0.75 1.20 5.00 1.20 19 0.21 1.00 0.16 1.442 0.11 NL 6.02 Fly ash 1.0 1.0 1.40 2.1 2.1 2.1 12 79 1.70 0.75 1.05 0.75 1.20 5.00 1.20 22 0.25 0.99 0.15 1.442 0.11 NL 6.03 Fly ash 2.0 2.0 1.40 4.2 4.2 4.2 17 55 1.54 0.75 1.05 0.75 1.20 5.00 1.20 27 0.35 0.98 0.15 1.442 0.11 NL 6.04 Sandy silt 4.0 1.0 1.65 6.4 5.9 6.4 17 88 1.25 0.75 1.05 0.85 1.20 5.00 1.20 25 0.30 0.97 0.16 1.442 0.11 NL5 Silty fine sand 5.0 2.0 1.65 8.9 6.9 8.9 20 16 1.06 0.75 1.05 0.95 1.20 2.77 1.05 23 0.25 0.95 0.19 1.442 0.13 1.926 Silty fine sand 7.0 1.0 1.65 11.4 7.9 11.4 23 17 0.94 0.75 1.05 0.95 1.20 3.01 1.06 24 0.27 0.94 0.21 1.442 0.15 1.827 Silty fine sand 8.0 1.0 1.65 13.0 8.6 13.0 27 19 0.88 0.75 1.05 0.95 1.20 3.43 1.07 26 0.32 0.93 0.22 1.442 0.15 2.088 Silty fine sand 9.0 1.65 30 15 NL9
10 11
MSF= Magnitude Scaling Factors
Liquefaction Susceptibility Assessment
Symbols and Abbreviations-
Project Details
Borehole No. P-1As per Seed and Idriss Approach, as described in the NCEER Summary Report (2001) -
Theory
Surcharge Load, if any: 0Boring Details
Block N/A
Structure Coal Silo #4 Site
Existing Ground Level (EGL) 45.5Corrected SPT 'N' Value:
Influence of Fines Content:
T/m2
Design Earthquake Site Levels
Seismic Zone: Existing Ground Level, EGL (m): Sampler with liner?Earthquake Magnitude: Actual GW Depth (m): Hammer Type:
PGA (g): Design GW Depth (m): Borehole Diameter (mm):Critical Factor of Safety (FS): Design GW Level (m): SPT Energy Correction (CE) :
Conclusion: No Liquefaction potential
Calculations
N/A : Not Applicable (as in the case of unsaturated soils)NL : Not Liquefiable, e.g. if (N1)60,cs>30, PI>15%, or Fines Content>50%
:,5.7 whereCSR
CRRFOS
2001
]45)(10[50
135)(
)(341
2601
601
6015.7
NN
NCRR
dvo
vo
vo
av rg
aCSR
'
max' 65.0
MSF
Extension of Barauni Super Critical Coal Fired Thermal Power Station at Barauni, Bihar. M/s. STEAG Energy Services (India) Pvt. Ltd.
Appendix-A : Plate 1 of 6Project No. 215081-II

Several corrections are applied to the field N value:(N1)60 = Nm.CN.CE.CB.CR.CS(N1)60,cs = + (N1)60
FOS = Factor of safety against liquefaction (N1)60 = Corrected SPT N valueCRR7.5 = Cyclic Resistance Ratio Nm = Measured (field) SPT N value
CSR = Cyclic Stress Ratio Coefficients based on fines contentIV 45.5 N amax = Peak horizontal acceleration CN= Factor to normalize Nm to reference overburden stress6.7 10.1 WT g = Acceleration of gravity CE = Correction for hammer energy ratio (ER)0.24 4.0 150 'vo = Effective vertical overburden stress CR = correction for rod length1.0 41.5 0.75 rd = Stress reduction coefficient CS = correction for samplers with or without liners
Laye
r
Soil
Des
crip
tion
Dep
th to
Top
of
Laye
r (m
)
Laye
r Thi
ckne
ss (m
)
Uni
t wei
ght
(T/m
3 )
Tota
l Ove
rbur
den
Pres
sure
at M
iddl
e of
Lay
er (T
/m2 )
Effe
ctiv
e St
ress
at
Mid
dle
of L
ayer
, ba
sed
on d
esig
n G
WT
(T/m
2 )
Effe
ctiv
e St
ress
at
Mid
dle
of L
ayer
, ba
sed
on a
ctua
l G
WT
(T/m
2 )
Nm
Fine
s C
onte
nt (%
)
CN
CE
CB
CR
CS
(N1)
60,c
s
CR
R(7
.5)
Stre
ss R
educ
tion
Fact
or (r
d)
CSR
Mag
nitu
de S
calin
g Fa
ctor
CSR
7.5
Com
pute
d FO
S ag
ains
t liq
uefa
ctio
n
Plas
ticity
Inde
x (%
)
1 Fly ash 0.0 1.0 1.40 0.7 0.7 0.700 7 70 1.70 0.75 1.05 0.75 1.20 5.00 1.20 15 0.16 1.00 0.16 1.442 0.11 NL 11.42 Fly ash 1.0 1.0 1.40 2.1 2.1 2.1 8 81 1.70 0.75 1.05 0.75 1.20 5.00 1.20 17 0.18 0.99 0.15 1.442 0.11 NL 11.43 Fly ash 2.0 2.0 1.40 4.2 4.2 4.2 10 58 1.54 0.75 1.05 0.75 1.20 5.00 1.20 18 0.19 0.98 0.15 1.442 0.11 NL 11.44 Sandy silt 4.0 1.0 1.65 6.4 5.9 6.4 7 88 1.25 0.75 1.05 0.85 1.20 5.00 1.20 13 0.14 0.97 0.16 1.442 0.11 NL 7.75 Sandy silt 5.0 2.0 1.65 8.9 6.9 8.9 8 90 1.06 0.75 1.05 0.95 1.20 5.00 1.20 14 0.15 0.95 0.19 1.442 0.13 NL 7.76 Clayey silt 7.0 1.0 1.65 11.4 7.9 11.4 5 97 0.94 0.75 1.05 0.95 1.20 5.00 1.20 10 0.11 0.94 0.21 1.442 0.15 NL 21.07 Clayey silt 8.0 1.0 1.65 13.0 8.6 13.0 5 85 0.88 0.75 1.05 0.95 1.20 5.00 1.20 10 0.11 0.93 0.22 1.442 0.15 NL 14.38 Clayey silt 9.0 1.0 1.65 14.7 9.3 14.7 6 97 0.83 0.75 1.05 0.95 1.20 5.00 1.20 10 0.12 0.92 0.23 1.442 0.16 NL 19.69 Sandy silt 10.0 1.0 1.65 16.3 9.9 16.3 9 70 0.78 0.75 1.05 1.00 1.20 5.00 1.20 13 0.14 0.89 0.23 1.442 0.16 NL 10.1
10 Sandy silt 11.0 1.0 1.65 18.0 10.6 16.6 26 76 0.78 0.75 1.05 1.00 1.20 5.00 1.20 28 0.37 0.87 0.23 1.442 0.16 NL 10.111 Fine sand 12.0 1.65 32 8 NL
MSF= Magnitude Scaling Factors
Conclusion: No Liquefaction potential
PGA (g): Design GW Depth (m): Borehole Diameter (mm):Critical Factor of Safety (FS): Design GW Level (m): SPT Energy Correction (CE) :
Calculations
Seismic Zone: Existing Ground Level, EGL (m): Sampler with liner?Earthquake Magnitude: Actual GW Depth (m): Hammer Type:
Surcharge Load, if any: 0 T/m2
Design Earthquake Site Levels
Liquefaction Susceptibility Assessment
Boring Details
Block N/A
Structure Chimney Site
Existing Ground Level (EGL) 45.5Corrected SPT 'N' Value:
Symbols and Abbreviations-
Project Details
Borehole No. P-2As per Seed and Idriss Approach, as described in the NCEER Summary Report (2001) -
Theory
Influence of Fines Content:
N/A : Not Applicable (as in the case of unsaturated soils)NL : Not Liquefiable, e.g. if (N1)60,cs>30, PI>15%, or Fines Content>50%
:,5.7 whereCSR
CRRFOS
2001
]45)(10[50
135)(
)(341
2601
601
6015.7
NN
NCRR
dvo
vo
vo
av rg
aCSR
'
max' 65.0
MSF
Extension of Barauni Super Critical Coal Fired Thermal Power Station at Barauni, Bihar. M/s. STEAG Energy Services (India) Pvt. Ltd.
Appendix-A : Plate 2 of 6Project No. 215081-II

Several corrections are applied to the field N value:(N1)60 = Nm.CN.CE.CB.CR.CS(N1)60,cs = + (N1)60
FOS = Factor of safety against liquefaction (N1)60 = Corrected SPT N valueCRR7.5 = Cyclic Resistance Ratio Nm = Measured (field) SPT N value
CSR = Cyclic Stress Ratio Coefficients based on fines contentIV 45.5 N amax = Peak horizontal acceleration CN= Factor to normalize Nm to reference overburden stress6.7 9.9 WT g = Acceleration of gravity CE = Correction for hammer energy ratio (ER)0.24 4.0 150 'vo = Effective vertical overburden stress CR = correction for rod length1.0 41.5 0.75 rd = Stress reduction coefficient CS = correction for samplers with or without liners
Laye
r
Soil
Des
crip
tion
Dep
th to
Top
of
Laye
r (m
)
Laye
r Thi
ckne
ss (m
)
Uni
t wei
ght
(T/m
3 )
Tota
l Ove
rbur
den
Pres
sure
at M
iddl
e of
Lay
er (T
/m2 )
Effe
ctiv
e St
ress
at
Mid
dle
of L
ayer
, ba
sed
on d
esig
n G
WT
(T/m
2 )
Effe
ctiv
e St
ress
at
Mid
dle
of L
ayer
, ba
sed
on a
ctua
l G
WT
(T/m
2 )
Nm
Fine
s C
onte
nt (%
)
CN
CE
CB
CR
CS
(N1)
60,c
s
CR
R(7
.5)
Stre
ss R
educ
tion
Fact
or (r
d)
CSR
Mag
nitu
de S
calin
g Fa
ctor
CSR
7.5
Com
pute
d FO
S ag
ains
t liq
uefa
ctio
n
Plas
ticity
Inde
x (%
)
1 Fly Ash 0.0 2.5 1.40 1.8 1.8 1.750 8 70 1.70 0.75 1.05 0.75 1.20 5.00 1.20 17 0.18 0.99 0.15 1.442 0.11 NL 12.82 Fly Ash 2.5 1.0 1.40 4.2 4.2 4.2 10 55 1.54 0.75 1.05 0.75 1.20 5.00 1.20 18 0.19 0.98 0.15 1.442 0.11 NL 12.83 Fly Ash 3.5 2.0 1.40 6.3 6.3 6.3 11 59 1.26 0.75 1.05 0.85 1.20 5.00 1.20 18 0.20 0.97 0.15 1.442 0.10 NL 12.84 Sandy silt 5.5 1.0 1.65 8.5 6.6 8.5 7 92 1.08 0.75 1.05 0.95 1.20 5.00 1.20 13 0.14 0.95 0.19 1.442 0.13 NL 11.75 Sandy silt 6.5 2.0 1.65 11.0 7.6 11.0 12 80 0.95 0.75 1.05 0.95 1.20 5.00 1.20 17 0.18 0.94 0.21 1.442 0.15 NL 11.76 Silty fine sand 8.5 1.0 1.75 13.5 8.6 13.5 14 25 0.86 0.75 1.05 0.95 1.20 4.29 1.12 16 0.17 0.93 0.23 1.442 0.16 1.107 Silty fine sand 9.5 2.0 1.75 16.2 9.8 16.2 14 39 0.79 0.75 1.05 1.00 1.20 5.00 1.20 17 0.19 0.89 0.23 1.442 0.16 1.178 Fine sand 11.5 1.0 1.75 18.8 10.9 16.7 15 10 0.77 0.75 1.05 1.00 1.20 0.87 1.02 12 0.13 0.85 0.23 1.442 0.16 0.839 Fine sand 12.5 1.0 1.75 20.5 11.7 17.5 17 9 0.76 0.75 1.05 1.00 1.20 0.56 1.02 13 0.14 0.83 0.23 1.442 0.16 0.89
10 Fine sand 13.5 1.0 1.85 22.3 12.5 18.3 26 10 0.74 0.75 1.05 1.00 1.20 0.87 1.02 19 0.21 0.80 0.22 1.442 0.15 1.3511 Fine sand 14.5 1.85 32 11 NL
MSF= Magnitude Scaling Factors0 T/m2
SPT Energy Correction (CE) :
Hammer Type:Borehole Diameter (mm):
Boring Details
Sampler with liner?
PGA (g): Design GW Depth (m):Earthquake Magnitude:
Site Levels
Existing Ground Level, EGL (m):Design Earthquake
Seismic Zone: Actual GW Depth (m):
Calculations
Project Details
Corrected SPT 'N' Value:
Borehole No. P-3
45.5
Theory
Surcharge Load, if any:
Critical Factor of Safety (FS): Design GW Level (m):
Liquefaction potential 11.5 to 13.5 m depthConclusion:
Liquefaction Susceptibility Assessment
Symbols and Abbreviations-
As per Seed and Idriss Approach, as described in the NCEER Summary Report (2001) -
Influence of Fines Content:Existing Ground Level (EGL)
Boiler Foundation SiteStructure
Block N/A
N/A : Not Applicable (as in the case of unsaturated soils)NL : Not Liquefiable, e.g. if (N1)60,cs>30, PI>15%, or Fines Content>50%
:,5.7 whereCSR
CRRFOS
2001
]45)(10[50
135)(
)(341
2601
601
6015.7
NN
NCRR
dvo
vo
vo
av rg
aCSR
'
max' 65.0
MSF
Extension of Barauni Super Critical Coal Fired Thermal Power Station at Barauni, Bihar. M/s. STEAG Energy Services (India) Pvt. Ltd.
Appendix-A : Plate 3 of 6Project No. 215081-II

Several corrections are applied to the field N value:(N1)60 = Nm.CN.CE.CB.CR.CS(N1)60,cs = + (N1)60
FOS = Factor of safety against liquefaction (N1)60 = Corrected SPT N valueCRR7.5 = Cyclic Resistance Ratio Nm = Measured (field) SPT N value
CSR = Cyclic Stress Ratio Coefficients based on fines contentIV 45.5 N amax = Peak horizontal acceleration CN= Factor to normalize Nm to reference overburden stress6.7 9.8 WT g = Acceleration of gravity CE = Correction for hammer energy ratio (ER)0.24 4.0 150 'vo = Effective vertical overburden stress CR = correction for rod length1.0 41.5 0.75 rd = Stress reduction coefficient CS = correction for samplers with or without liners
Laye
r
Soil
Des
crip
tion
Dep
th to
Top
of
Laye
r (m
)
Laye
r Thi
ckne
ss (m
)
Uni
t wei
ght
(T/m
3 )
Tota
l Ove
rbur
den
Pres
sure
at M
iddl
e of
Lay
er (T
/m2 )
Effe
ctiv
e St
ress
at
Mid
dle
of L
ayer
, ba
sed
on d
esig
n G
WT
(T/m
2 )
Effe
ctiv
e St
ress
at
Mid
dle
of L
ayer
, ba
sed
on a
ctua
l G
WT
(T/m
2 )
Nm
Fine
s C
onte
nt (%
)
CN
CE
CB
CR
CS
(N1)
60,c
s
CR
R(7
.5)
Stre
ss R
educ
tion
Fact
or (r
d)
CSR
Mag
nitu
de S
calin
g Fa
ctor
CSR
7.5
Com
pute
d FO
S ag
ains
t liq
uefa
ctio
n
Plas
ticity
Inde
x (%
)
1 Fly ash 0.0 2.5 1.40 1.8 1.8 1.750 8 70 1.70 0.75 1.05 0.75 1.20 5.00 1.20 17 0.18 0.99 0.15 1.442 0.11 NL 14.82 Fly ash 2.5 1.0 1.40 4.2 4.2 4.2 9 74 1.54 0.75 1.05 0.75 1.20 5.00 1.20 17 0.18 0.98 0.15 1.442 0.11 NL 14.83 Fly ash 3.5 2.0 1.40 6.3 6.3 6.3 13 71 1.26 0.75 1.05 0.85 1.20 5.00 1.20 21 0.23 0.97 0.15 1.442 0.10 NL 14.84 Sandy silt 5.5 1.0 1.65 8.5 6.6 8.5 5 88 1.08 0.75 1.05 0.95 1.20 5.00 1.20 11 0.12 0.95 0.19 1.442 0.13 NL 14.15 Clayey silt 6.5 2.0 1.65 11.0 7.6 11.0 8 97 0.95 0.75 1.05 0.95 1.20 5.00 1.20 13 0.14 0.94 0.21 1.442 0.15 NL 20.26 Silty fine sand 8.5 1.0 1.65 13.5 8.6 13.5 24 13 0.86 0.75 1.05 0.95 1.20 1.89 1.04 21 0.23 0.93 0.23 1.442 0.16 1.457 Silty fine sand 9.5 1.0 1.65 15.1 9.2 15.1 28 15 0.81 0.75 1.05 1.00 1.20 2.50 1.05 25 0.29 0.91 0.23 1.442 0.16 1.828 Silty fine sand 10.5 1.0 1.65 16.8 9.9 15.6 30 14 0.80 0.75 1.05 1.00 1.20 2.20 1.04 26 0.31 0.88 0.23 1.442 0.16 1.929 Silty fine sand 11.5 1.65 38 16 NL
10 11
MSF= Magnitude Scaling Factors0 T/m2
SPT Energy Correction (CE) :
Hammer Type:Borehole Diameter (mm):
Boring Details
Sampler with liner?
PGA (g): Design GW Depth (m):Earthquake Magnitude:
Site Levels
Existing Ground Level, EGL (m):Design Earthquake
Seismic Zone: Actual GW Depth (m):
Calculations
Project Details
Corrected SPT 'N' Value:
Borehole No. P-4
45.5
Theory
Surcharge Load, if any:
Critical Factor of Safety (FS): Design GW Level (m):
No Liquefaction potential Conclusion:
Liquefaction Susceptibility Assessment
Symbols and Abbreviations-
As per Seed and Idriss Approach, as described in the NCEER Summary Report (2001) -
Influence of Fines Content:Existing Ground Level (EGL)
Generator Foundation SiteStructure
Block N/A
N/A : Not Applicable (as in the case of unsaturated soils)NL : Not Liquefiable, e.g. if (N1)60,cs>30, PI>15%, or Fines Content>50%
:,5.7 whereCSR
CRRFOS
2001
]45)(10[50
135)(
)(341
2601
601
6015.7
NN
NCRR
dvo
vo
vo
av rg
aCSR
'
max' 65.0
MSF
Extension of Barauni Super Critical Coal Fired Thermal Power Station at Barauni, Bihar. M/s. STEAG Energy Services (India) Pvt. Ltd.
Appendix-A : Plate 4 of 6Project No. 215081-II

Several corrections are applied to the field N value:(N1)60 = Nm.CN.CE.CB.CR.CS(N1)60,cs = + (N1)60
FOS = Factor of safety against liquefaction (N1)60 = Corrected SPT N valueCRR7.5 = Cyclic Resistance Ratio Nm = Measured (field) SPT N value
CSR = Cyclic Stress Ratio Coefficients based on fines contentIV 45.5 N amax = Peak horizontal acceleration CN= Factor to normalize Nm to reference overburden stress6.7 9.9 WT g = Acceleration of gravity CE = Correction for hammer energy ratio (ER)0.24 4.0 150 'vo = Effective vertical overburden stress CR = correction for rod length1.0 41.5 0.75 rd = Stress reduction coefficient CS = correction for samplers with or without liners
Laye
r
Soil
Des
crip
tion
Dep
th to
Top
of
Laye
r (m
)
Laye
r Thi
ckne
ss (m
)
Uni
t wei
ght
(T/m
3 )
Tota
l Ove
rbur
den
Pres
sure
at M
iddl
e of
Lay
er (T
/m2 )
Effe
ctiv
e St
ress
at
Mid
dle
of L
ayer
, ba
sed
on d
esig
n G
WT
(T/m
2 )
Effe
ctiv
e St
ress
at
Mid
dle
of L
ayer
, ba
sed
on a
ctua
l G
WT
(T/m
2 )
Nm
Fine
s C
onte
nt (%
)
CN
CE
CB
CR
CS
(N1)
60,c
s
CR
R(7
.5)
Stre
ss R
educ
tion
Fact
or (r
d)
CSR
Mag
nitu
de S
calin
g Fa
ctor
CSR
7.5
Com
pute
d FO
S ag
ains
t liq
uefa
ctio
n
Plas
ticity
Inde
x (%
)
1 Fly ash 0.0 2.0 1.40 1.4 1.4 1.400 7 65 1.70 0.75 1.05 0.75 1.20 5.00 1.20 15 0.16 0.99 0.15 1.442 0.11 NL 14.52 Fly ash 2.0 2.0 1.40 4.2 4.2 4.2 7 56 1.54 0.75 1.05 0.75 1.20 5.00 1.20 14 0.15 0.98 0.15 1.442 0.11 NL 14.53 Clayey silt 4.0 1.0 1.70 6.5 6.0 6.5 5 96 1.25 0.75 1.05 0.85 1.20 5.00 1.20 11 0.12 0.97 0.16 1.442 0.11 NL 15.64 Clayey silt 5.0 2.0 1.65 9.0 7.0 9.0 7 94 1.06 0.75 1.05 0.95 1.20 5.00 1.20 13 0.14 0.95 0.19 1.442 0.13 NL 24.25 Silty fine sand 7.0 1.0 1.65 11.4 8.0 11.4 14 14 0.94 0.75 1.05 0.95 1.20 2.20 1.04 14 0.15 0.94 0.21 1.442 0.15 1.066 Silty fine sand 8.0 1.0 1.65 13.1 8.7 13.1 16 19 0.87 0.75 1.05 0.95 1.20 3.43 1.07 17 0.18 0.93 0.22 1.442 0.15 1.187 Silty fine sand 9.0 1.0 1.65 14.7 9.3 14.7 18 16 0.82 0.75 1.05 0.95 1.20 2.77 1.05 17 0.18 0.92 0.23 1.442 0.16 1.148 Silty fine sand 10.0 1.0 1.65 16.4 10.0 15.7 21 14 0.80 0.75 1.05 1.00 1.20 2.20 1.04 19 0.20 0.89 0.23 1.442 0.16 1.269 Silty fine sand 11.0 1.65 28 15 NL
10 11
MSF= Magnitude Scaling Factors
Existing Ground Level (EGL)
Generator Transformer SiteStructure
Surcharge Load, if any:
Block N/A
Calculations
Seismic Zone: Actual GW Depth (m):
As per Seed and Idriss Approach, as described in the NCEER Summary Report (2001) -
Influence of Fines Content:
No Liquefaction potential Conclusion:
Site Levels
Existing Ground Level, EGL (m):
Critical Factor of Safety (FS): Design GW Level (m):
Design Earthquake
PGA (g): Design GW Depth (m):Earthquake Magnitude:
Liquefaction Susceptibility Assessment
Project Details
Corrected SPT 'N' Value:
Borehole No. P-5
45.5
Theory
0 T/m2
SPT Energy Correction (CE) :
Hammer Type:Borehole Diameter (mm):
Boring Details
Sampler with liner?
Symbols and Abbreviations-
N/A : Not Applicable (as in the case of unsaturated soils)NL : Not Liquefiable, e.g. if (N1)60,cs>30, PI>15%, or Fines Content>50%
:,5.7 whereCSR
CRRFOS
2001
]45)(10[50
135)(
)(341
2601
601
6015.7
NN
NCRR
dvo
vo
vo
av rg
aCSR
'
max' 65.0
MSF
Extension of Barauni Super Critical Coal Fired Thermal Power Station at Barauni, Bihar. M/s. STEAG Energy Services (India) Pvt. Ltd.
Appendix-A : Plate 5 of 6Project No. 215081-II

Several corrections are applied to the field N value:(N1)60 = Nm.CN.CE.CB.CR.CS(N1)60,cs = + (N1)60
FOS = Factor of safety against liquefaction (N1)60 = Corrected SPT N valueCRR7.5 = Cyclic Resistance Ratio Nm = Measured (field) SPT N value
CSR = Cyclic Stress Ratio Coefficients based on fines contentIV 45.5 N amax = Peak horizontal acceleration CN= Factor to normalize Nm to reference overburden stress6.7 9.4 WT g = Acceleration of gravity CE = Correction for hammer energy ratio (ER)0.24 4.0 150 'vo = Effective vertical overburden stress CR = correction for rod length1.0 41.5 0.75 rd = Stress reduction coefficient CS = correction for samplers with or without liners
Laye
r
Soil
Des
crip
tion
Dep
th to
Top
of
Laye
r (m
)
Laye
r Thi
ckne
ss (m
)
Uni
t wei
ght
(T/m
3 )
Tota
l Ove
rbur
den
Pres
sure
at M
iddl
e of
Lay
er (T
/m2 )
Effe
ctiv
e St
ress
at
Mid
dle
of L
ayer
, ba
sed
on d
esig
n G
WT
(T/m
2 )
Effe
ctiv
e St
ress
at
Mid
dle
of L
ayer
, ba
sed
on a
ctua
l G
WT
(T/m
2 )
Nm
Fine
s C
onte
nt (%
)
CN
CE
CB
CR
CS
(N1)
60,c
s
CR
R(7
.5)
Stre
ss R
educ
tion
Fact
or (r
d)
CSR
Mag
nitu
de S
calin
g Fa
ctor
CSR
7.5
Com
pute
d FO
S ag
ains
t liq
uefa
ctio
n
Plas
ticity
Inde
x (%
)
1 Fly ash 0.0 2.5 1.40 1.8 1.8 1.750 5 38 1.70 0.75 1.05 0.75 1.20 5.00 1.20 12 0.13 0.99 0.15 1.442 0.11 N/A 15.02 Fly ash 2.5 1.0 1.40 4.2 4.2 4.2 6 78 1.54 0.75 1.05 0.75 1.20 5.00 1.20 13 0.14 0.98 0.15 1.442 0.11 NL 15.03 Fly ash 3.5 2.0 1.40 6.3 6.3 6.3 9 70 1.26 0.75 1.05 0.85 1.20 5.00 1.20 16 0.17 0.97 0.15 1.442 0.10 NL 15.04 Clayey silt 5.5 1.0 1.65 8.5 6.6 8.5 7 78 1.08 0.75 1.05 0.95 1.20 5.00 1.20 13 0.14 0.95 0.19 1.442 0.13 NL 13.75 Sandy silt 6.5 1.0 1.65 10.2 7.2 10.2 20 75 0.99 0.75 1.05 0.95 1.20 5.00 1.20 26 0.32 0.95 0.21 1.442 0.14 NL 10.26 Silty fine sand 7.5 1.0 1.65 11.8 7.9 11.8 23 16 0.92 0.75 1.05 0.95 1.20 2.77 1.05 23 0.25 0.94 0.22 1.442 0.15 1.677 Silty fine sand 8.5 1.0 1.65 13.5 8.6 13.5 24 19 0.86 0.75 1.05 0.95 1.20 3.43 1.07 23 0.26 0.93 0.23 1.442 0.16 1.668 Silty fine sand 9.5 1.65 27 15 NL9
10 11
MSF= Magnitude Scaling Factors0 T/m2
SPT Energy Correction (CE) :
Hammer Type:Borehole Diameter (mm):
Boring Details
Sampler with liner?
PGA (g): Design GW Depth (m):Earthquake Magnitude:
Site Levels
Existing Ground Level, EGL (m):Design Earthquake
Seismic Zone: Actual GW Depth (m):
Calculations
Project Details
Corrected SPT 'N' Value:
Borehole No. P-6
45.5
Theory
Surcharge Load, if any:
Critical Factor of Safety (FS): Design GW Level (m):
No Liquefaction potential Conclusion:
Liquefaction Susceptibility Assessment
Symbols and Abbreviations-
As per Seed and Idriss Approach, as described in the NCEER Summary Report (2001) -
Influence of Fines Content:Existing Ground Level (EGL)
Raw Water Storage Tank SiteStructure
Block N/A
N/A : Not Applicable (as in the case of unsaturated soils)NL : Not Liquefiable, e.g. if (N1)60,cs>30, PI>15%, or Fines Content>50%
:,5.7 whereCSR
CRRFOS
2001
]45)(10[50
135)(
)(341
2601
601
6015.7
NN
NCRR
dvo
vo
vo
av rg
aCSR
'
max' 65.0
MSF
Extension of Barauni Super Critical Coal Fired Thermal Power Station at Barauni, Bihar. M/s. STEAG Energy Services (India) Pvt. Ltd.
Appendix-A : Plate 6 of 6Project No. 215081-II

PILE FOUNDATION
COAL SILO SITE CHIMNEY SITE
GENERATOR FOUNDATION SITE GENERATOR TRANSFORMER SITE
RAW WATER TANK SITE

APPENDIX-B
TYPICAL CALCULATIONS

PILE FOUNDATION
COAL SILO # 4 SITE
CHIMNEY SITE GENERATOR FOUNDATION SITE
GENERATOR TRANSFORMER SITE RAW WATER TANK SITE

Qsafe = FS = = p = = L =c = k =' = D =
As =n = Ap =
2.0 m550 mm
1.728 0.238 m2
COL 20 11.0 2.0 m
i.e. 13.0 0.0 m
2.5 as per
From To1 0.0 4.0 0 0 14.0 1.0 0.00 2 4.0 12.0 65 4 16.5 1.0 0.33 3 12.0 15.0 0 30 17.5 1.0 0.00 20.95 22.404 15.0 20.0 0 31 18.5 1.1 0.00 23.93 25.995 20.0 30.0 0 32 19.5 1.1 0.00 28.88 30.216 30.0 40.0 0 33 20.0 1.2 0.00 34.86 35.19
#N/A #N/A #N/A #N/A #N/A #N/A #N/A #N/A #N/A #N/A #N/A #N/A
18.0 20.0 22.0 24.0 26.0
FlyashSandy silt
Fine sand
Fine sandFine sand
m
k
IS 2911 (Part 1 / Section 2) : 2010
, kN
/m3
(=),
degre
es
NNc Nq
pile diameters, i.e.
Design Water Table Depth:
Laye
r No
. Depth,m
5.0
Soil Classification c, kN
/m2
Factor of Safety :
Fine sand
m belowConsider overburden pressure to become constant below :
m2/m lengthOverburden Pressure to be considered below :
m below
Pile Surface Area, As = Pile cross-section Area, Ap =
Pile Type : Loading : RCC Pile
Computation of Safe Axial Compressive Pile CapacityBy Static Analysis
IS 2911 (Part 1 / Section 2) : 2010Analysis in accordance with
Pile surface area per m length
Adhesion factor (function of C u )
Number of layers
Axial Compression
Pile end bearing area
Effective density of soil, kN/m3
Pile segment length in selected layer
Pile diameterCoefficient of earth pressure
Factor of safetywhere :
Bearing capacity factors, which are a function of
Safe axial pile capacity, kN
Cohesion intercept, kN/m2
Pile Capacity Calculation at following Pile Length(s) below cut-off Level (m)
Pile Cross section :
Overburden pressure, kN/m2
Pile Diameter ,D : Circle Pile cut-off Level (COL) :
Nc, Nq, N=
Angle of wall friction between soil and pile, degrees
Qsafe=(1/FS){1 to n[(c+pktan)AsL]+[(cNc+pNq+0.5D ' N)Ap]}
Bored Cast in SituThe safe pile capacity is computed as :
Extension of Barauni Super Critical Coal Fired Thermal Power Station at Barauni, Bihar. M/s. STEAG Energy Services (India) Pvt. Ltd.
Project No. 215081-II Appendix-B : Plate 1 of 30

Pile Type : Loading : RCC Pile
Computation of Safe Axial Compressive Pile CapacityBy Static Analysis
IS 2911 (Part 1 / Section 2) : 2010Analysis in accordance with
Axial CompressionBored Cast in Situ
Pile Dia = 550 mm
kN/m 2 kN/m 2kN kN kN/m 2
kN kN kN MT
Safe
Pile
Capa
city
Overb
urden
Pr
essu
re
Cumu
lative
Sk
in Fri
ction
Unit S
kin
Fricti
onSk
in Fri
ction
in
Laye
r
Unit E
nd
Beari
ng
Safe
Pile
Capa
city
Total
End
Beari
ng
Ult. P
ile
Capa
city
2.0 0.0
Layer No.
Soil Parameters
c, kN
/m2
eff,
kN/m
3
1 0.00.0
(=
), de
grees
-
Depth
Below
GL
, mPil
e Len
gth
below
COL
, m
0.0
0
00
014.014.0
2.0 0.0
4.0 2.0
0.0
1
1 0.0
28.0
000
0
42
14.014.0
36.3 24 424.0 2.0
5.0 3.0
2
0.01
65.0 16.5444.5
46
42
36.3 24 42
44.8 25 45.0 3.0
2
65.05.1 3.1
2
65.0
6.5
16.54
445.2
314 360
46 44.8
26
25 465.0
10.0
25.1 3.1
2
12.065.0 6.54
67.6
6.54
90.0
314 360
54 94
454
7.530
26
13.00.0
11.0
10.0
212.0
65.0
93.8
6.5467.6
397.5
10
54 94
454 7.5
7.530
30
13.1 11.1
313.0
0.0
0.011.0
93.83
97.5 56 46497.5
10
185 649
97.5
7.530
0.0 30 7.513.1 11.1
15.0 13.0
3
3 0.097.5 56
56
464
97.5
117
185
649
765
97.5
97.5
0.0 30
31 8.5
7.5
0.0415.0 13.0
3
16.1 14.162
56
97.5
117
1063 298
7658.5
97.5
97.5 62
31 8.50.0
310.018.9 16.9
4
416.1 14.1
62
97.5716991180
1063
2393117
298
174956997.5
8.597.5 62
0.0 8.531
310.018.9 16.9
4
18.0
4
20.062
97.5716991180 2393117 174956997.5
0.0 8.531
18.0
4
20.062
Extension of Barauni Super Critical Coal Fired Thermal Power Station at Barauni, Bihar. M/s. STEAG Energy Services (India) Pvt. Ltd.
Project No. 215081-II Appendix-B : Plate 2 of 30
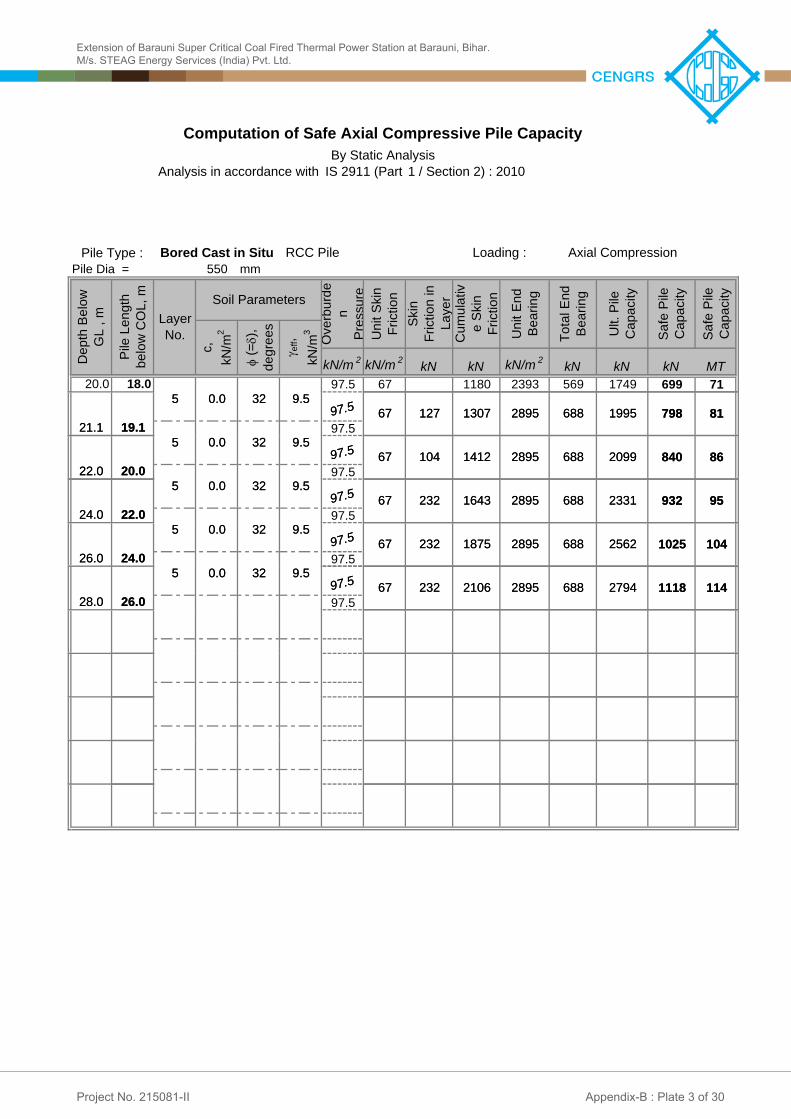
Pile Type : Loading : RCC Pile
Computation of Safe Axial Compressive Pile CapacityBy Static Analysis
IS 2911 (Part 1 / Section 2) : 2010Analysis in accordance with
Axial CompressionBored Cast in SituPile Dia = 550 mm
kN/m 2 kN/m 2kN kN kN/m 2
kN kN kN MT20.0 18.0 97.5 67 1180 2393 569 1749 699 71
Safe
Pile
Capa
city
81
Safe
Pile
Capa
city
Skin
Fricti
on in
La
yer
Ult. P
ile
Capa
city
Unit E
nd
Beari
ng
Total
End
Beari
ngSoil ParametersOv
erburd
en
Pres
sure
32
(=
), de
grees
eff,
kN/m
3
0.0 9.5
Layer No.
21.1 19.1
c, kN
/m2
5
Depth
Below
GL
, mPil
e Len
gth
below
COL
, m
1995
Cumu
lativ
e Skin
Fri
ction
97.5 798
Unit S
kin
Fricti
on67 127 1307 2895 688
97.586
81320.0
20.0
5 0.022.0
9.521.1 19.1
32 9.5
5199597.5 798
20991412
67 127 1307 2895 688
688 8406797.5 289510497.5
95
86
0.0 9.53224.0
20.0
22.0
5 0.0
522.0
32 9.520991412 688 840
67 232 1643 2895 688 2331 932
6797.5
97.5
2895104
97.595
104
0.0
26.0 24.0
32 9.5
9.53224.0 22.0
5 0.0
5
2895
67 232 1643 2895 688 2331 932
688 2562 1025187597.5
97.5
67 23297.5
104
1140.0 9.5325
26.0 24.0
28.0 26.0
32 9.55 0.02895 688 2562
688
1025
2794 1118
1875
2106
97.5
97.5 2895
67
67 232
232
97.5114
0.0 9.532
528.0 26.0
688
2794 1118
210697.5
2895
67 232
Extension of Barauni Super Critical Coal Fired Thermal Power Station at Barauni, Bihar. M/s. STEAG Energy Services (India) Pvt. Ltd.
Project No. 215081-II Appendix-B : Plate 3 of 30

whereQsafe = FS = = p = = L =c = k =' = D =n = As =W = Weight of the pile
2.0 m550 mm
1.728
COL 20 11.0 2.0 m
i.e. 13.0 0.0 m
3.00.7
From To1 0.0 4.0 0 0 14.0 1.0 0.002 4.0 12.0 65 4 16.5 1.0 0.333 12.0 15.0 0 30 17.5 1.0 0.004 15.0 20.0 0 31 18.5 1.1 0.005 20.0 30.0 0 32 19.5 1.1 0.006 30.0 40.0 0 33 20.0 1.2 0.00
#N/A #N/A #N/A #N/A #N/A #N/A #N/A #N/A #N/A #N/A #N/A #N/A
18.0 20.0 22.0 24.0 26.0
pile diameters, i.e. m below
Pile cut-off Level (COL) :
Number of layers
Cohesion intercept, kN/m2
m2/m lengthPile Surface Area, As =
Pile cross section shape : circle
Effective density of soil, kN/m3
Pile Diameter ,D :
Depth,m
Flyash
The safe uplift capacity of pile is calculated as :
Pile Type : Bored Cast in Situ RCC PileAxial Pullout (Uplift)Loading :
Pile surface area per m length
Friction angle between soil and pile, degrees ( = ) Pile segment length in selected layer
Factor of safetyAdhesion factor (function of C u ) Overburden pressure, kN/m2
Qsafe=(1/FS){1 to n[(c+pktan)AsL]} + W
Safe axial pile capacity, kN
m below
, kN
/m3
as per IS 2911 (Part1 / Section 2) : 2010 Clause 6.3.25.0
Fine sand
(=),
degre
es
Percentage of Ultimate Shaft Resistance to be used for Ultimate Pullout Capacity:Factor of Safety :
Pile Capacity Calculation at following Pile Length(s) below cut-off Level (m)
Fine sand
Consider overburden press. to become constant below :
Fine sandFine sand
m
Laye
r No
. k
Design Water Table Depth :
Sandy silt
Soil Classification
c, kN
/m2
Overburden Pressure to be considered below :
Computation of Safe Axial Pullout Capacity of PileBy Static Analysis
Analysis in accordance with IS 2911 (Part 1 / Section 2) : 2010
Coefficient of earth pressurePile diameter
Extension of Barauni Super Critical Coal Fired Thermal Power Station at Barauni, Bihar. M/s. STEAG Energy Services (India) Pvt. Ltd.
Project No. 215081-II Appendix-B : Plate 4 of 30

Pile Type : Bored Cast in Situ RCC Pile
Computation of Safe Axial Pullout Capacity of PileBy Static Analysis
Analysis in accordance with IS 2911 (Part 1 / Section 2) : 2010
Pile Dia = 550 mm
kN/m 2 kN/m 2kN kN kN kN kN MT
0.0
28.0
44.5
90.0
97.5
97.5
97.5
97.5
97.5
97.5
97.5
35
41
47
53
60
893
1062
1230
524
342
1399
1568
Safe
Pullo
ut Ca
pacit
y
Ultim
atePu
llout
Capa
city
210667.0 232
67.0
232
232
232
67.0
61.5
67.0
Cumu
lative
Sk
in Fri
ction
Unit S
kin
Fricti
on
93.8
65.02
14.0
7.503
0
30
4
02.0
-
0.02.04.0
1
1
2
32
28.0
26.0 24.0
22.024.0
0.026.0
5
15.04
13.0
313.0
0.0
Depth
Below
GL ,
m
22.0
0.0
3.0
0.0
5.0
Pile L
ength
below
CO
L,m
11.0
20.0
20.0
12.0
5
0.0
0.0
0.0
10.0
18.0
5
5
97.5
97.5
7.5030
32
3297.5
9.50
9.50
9.50
0.0
14.00
9.50
0.0
16.50
6.50
65.0
4
0.0
31
32
54.1 454
0
42
0
42
Safe
Pullo
ut Ca
pacit
y
Weigh
t of P
ile
97.5
1180
649
531
56.3
319
94
360
80
1412 74
97.5
97.5 403
464
67
1958.50
94 585
Bored Cast in Situ RCC Pile
24.2
26.3
87
1643
1875
Soil Parameters
Skin
Fricti
on in
La
yer
Layer No.
c, kN
/m2
eff,
kN/m
3
(=
), de
grees
0.0
36.3
Overb
urden
Pr
essu
re
67.3
Extension of Barauni Super Critical Coal Fired Thermal Power Station at Barauni, Bihar. M/s. STEAG Energy Services (India) Pvt. Ltd.
Project No. 215081-II Appendix-B : Plate 5 of 30

550 mm 2.0 m 18 m
FixedM 30
m4
P130.0 kPa
T = R = for Preconsolidated ClaysMN/m3 R =
m0.0 zf/R = 1.95
4.56 m m
e =H = zf =
5.0 mm88 kN = 9.0 Tonnes
Lateral Load Carrying Capacity for Pile Foundations
2.34 m
CirclePile cross-section :
4.492E-03
Pile Head :31000 MPa
RCC Pile
(EI/KB)1/4for Granular Soils and NC Clays
e/R =
Modulus of Elasticity :
0.0
Cohesive
Saturation :
(EI/ηh)1/5
Unconfined Compression Strength (qu) =Submerged
Reading off from graph,e + zf =
Deflection, …. for free-head pile
4.56
23.4Modulus of Subgrade Reaction, k1 =
Bored Cast in Situ
where : y =
Normally Consolidated or Preconsolidated Clays?
Pile Type :
Grade of Concrete :
Free-standing length of pile…. for fixed-head pile
Depth of Fixity, zf =
Computed Lateral Capacity of Pile, H =
Deflection,Lateral deflection at pile topLateral load applied
Permissible Horizontal Deflection at top of pile, Y =Depth of fixity
Free Standing Length of Pile or Length of pile below cut-off-level not contributing substantially to lateral capacity (e) :
Pile Dia : Pile Cut-off-Level below GL Pile Length :
Soil Classification:Moment of Inertia, I :
Head Condition
IRC 78 - 2014Analysis in accordance with:
33
103
)(x
EIzeH
y f
33
1012
)(x
EIzeH
y f
Extension of Barauni Super Critical Coal Fired Thermal Power Station at Barauni, Bihar. M/s. STEAG Energy Services (India) Pvt. Ltd.
Project No. 215081-II Appendix-B : Plate 6 of 30

Qsafe = FS = = p = = L =c = k =' = D =
As =n = Ap =
2.0 m600 mm
1.885 0.283 m2
COL 20 12.0 2.0 m
i.e. 14.0 0.0 m
2.5 as per
From To1 0.0 4.0 0 0 14.0 1.0 0.00 2 4.0 12.0 65 4 16.5 1.0 0.33 3 12.0 15.0 0 30 17.5 1.0 0.00 20.95 22.404 15.0 20.0 0 31 18.5 1.1 0.00 23.93 25.995 20.0 30.0 0 32 19.5 1.1 0.00 28.88 30.216 30.0 40.0 0 33 20.0 1.2 0.00 34.86 35.19
#N/A #N/A #N/A #N/A #N/A #N/A #N/A #N/A #N/A #N/A #N/A #N/A
18.0 20.0 22.0 24.0 26.0
FlyashSandy silt
Fine sand
Fine sandFine sand
m
k
IS 2911 (Part 1 / Section 2) : 2010
, kN
/m3
(=),
degre
es
NNc Nq
pile diameters, i.e.
Design Water Table Depth:
Laye
r No
. Depth,m
5.0
Soil Classification c, kN
/m2
Factor of Safety :
Fine sand
m belowConsider overburden pressure to become constant below :
m2/m lengthOverburden Pressure to be considered below :
m below
Pile Surface Area, As = Pile cross-section Area, Ap =
Pile Type : Loading : RCC Pile
Computation of Safe Axial Compressive Pile CapacityBy Static Analysis
IS 2911 (Part 1 / Section 2) : 2010Analysis in accordance with
Pile surface area per m length
Adhesion factor (function of C u )
Number of layers
Axial Compression
Pile end bearing area
Effective density of soil, kN/m3
Pile segment length in selected layer
Pile diameterCoefficient of earth pressure
Factor of safetywhere :
Bearing capacity factors, which are a function of
Safe axial pile capacity, kN
Cohesion intercept, kN/m2
Pile Capacity Calculation at following Pile Length(s) below cut-off Level (m)
Pile Cross section :
Overburden pressure, kN/m2
Pile Diameter ,D : Circle Pile cut-off Level (COL) :
Nc, Nq, N=
Angle of wall friction between soil and pile, degrees
Qsafe=(1/FS){1 to n[(c+pktan)AsL]+[(cNc+pNq+0.5D ' N)Ap]}
Bored Cast in SituThe safe pile capacity is computed as :
Extension of Barauni Super Critical Coal Fired Thermal Power Station at Barauni, Bihar. M/s. STEAG Energy Services (India) Pvt. Ltd.
Project No. 215081-II Appendix-B : Plate 7 of 30

Pile Type : Loading : RCC Pile
Computation of Safe Axial Compressive Pile CapacityBy Static Analysis
IS 2911 (Part 1 / Section 2) : 2010Analysis in accordance with
Axial CompressionBored Cast in Situ
Pile Dia = 600 mm
kN/m 2 kN/m 2kN kN kN/m 2
kN kN kN MT
0.0
28.0
44.5
45.8
90.0
99.0
105.0
105.0
105.0
105.0
105.0
Safe
Pile
Capa
city
85
829
150
1344
1194
2578150
89
114
325
720
338 393
55 123
0
00
Overb
urden
Pr
essu
re
Cumu
lative
Sk
in Fri
ction
Unit S
kin
Fricti
onSk
in Fri
ction
in
Laye
r
2073729
Un
it End
Be
aring
Sa
fe Pil
e Ca
pacit
y
Total
End
Beari
ng
Ult. P
ile
Capa
city
870
517
55
0
46
14.014.0
7.5
105.0
36.3
8.5
105.0
105.0
105.0
7.5
24 46
45.2
30
3026
25 9
66
0.0 30
31 8.5
7.5
0.0
0.0 8.531
310.018.8 16.8
4
18.0
4
20.0
4
14.0 12.0
15.0 13.0
3
3
16.2 14.2
13.20.0
2.0 0.0
4.0 2.0
0.0
5.0 3.0
2
65.0
11.2
10.0
25.2 3.2
2
12.065.0
94.5
6.5467.9
Layer No.
3
Soil Parameters
c, kN
/m2
eff,
kN/m
3
0.0
1
65.0
6.5
16.54
4
1 0.00.0
(=
), de
grees
-
Depth
Below
GL
, mPil
e Len
gth
below
COL
, m
102.0
66
59
61
66
605
Extension of Barauni Super Critical Coal Fired Thermal Power Station at Barauni, Bihar. M/s. STEAG Energy Services (India) Pvt. Ltd.
Project No. 215081-II Appendix-B : Plate 8 of 30

Pile Type : Loading : RCC Pile
Computation of Safe Axial Compressive Pile CapacityBy Static Analysis
IS 2911 (Part 1 / Section 2) : 2010Analysis in accordance with
Axial CompressionBored Cast in SituPile Dia = 600 mm
kN/m 2 kN/m 2kN kN kN/m 2
kN kN kN MT20.0 18.0 105.0 72 1344 2578 729 2073 829 85
105.0
105.0
105.0
105.0
105.0
113
124
135
Safe
Pile
Capa
city
102
97
Safe
Pile
Capa
city
Skin
Fricti
on in
La
yer
Ult. P
ile
Capa
city
Unit E
nd
Beari
ng
Total
End
Beari
ngSoil ParametersOv
erburd
en
Pres
sure
0.0
9.532
32
(=
), de
grees
eff,
kN/m
3
0.0
526.0 24.0
28.0 26.0
32 9.5
9.532
0.0
24.0
20.0
22.0
5 0.0
5 0.0
522.0
9.5
Layer No.
21.2 19.232 9.5
c, kN
/m2
5
Depth
Below
GL
, mPil
e Len
gth
below
COL
, m
2389
Cumu
lativ
e Skin
Fri
ction
105.0 956
Unit S
kin
Fricti
on
24981616
72 163 1507 3118 882
882
3118
999
72 272 1888 3118 882 2770 1108
882 3042
882
1217
3314 1326
72
2160
2432
105.0
105.0
105.0
105.0
3118
3118
72
72 272
109
272
Extension of Barauni Super Critical Coal Fired Thermal Power Station at Barauni, Bihar. M/s. STEAG Energy Services (India) Pvt. Ltd.
Project No. 215081-II Appendix-B : Plate 9 of 30

whereQsafe = FS = = p = = L =c = k =' = D =n = As =W = Weight of the pile
2.0 m600 mm
1.885
COL 20 12.0 2.0 m
i.e. 14.0 0.0 m
3.00.7
From To1 0.0 4.0 0 0 14.0 1.0 0.002 4.0 12.0 65 4 16.5 1.0 0.333 12.0 15.0 0 30 17.5 1.0 0.004 15.0 20.0 0 31 18.5 1.1 0.005 20.0 30.0 0 32 19.5 1.1 0.006 30.0 40.0 0 33 20.0 1.2 0.00
#N/A #N/A #N/A #N/A #N/A #N/A #N/A #N/A #N/A #N/A #N/A #N/A
18.0 20.0 22.0 24.0 26.0
pile diameters, i.e. m below
Pile cut-off Level (COL) :
Number of layers
Cohesion intercept, kN/m2
m2/m lengthPile Surface Area, As =
Pile cross section shape : circle
Effective density of soil, kN/m3
Pile Diameter ,D :
Depth,m
Flyash
The safe uplift capacity of pile is calculated as :
Pile Type : Bored Cast in Situ RCC PileAxial Pullout (Uplift)Loading :
Pile surface area per m length
Friction angle between soil and pile, degrees ( = ) Pile segment length in selected layer
Factor of safetyAdhesion factor (function of C u ) Overburden pressure, kN/m2
Qsafe=(1/FS){1 to n[(c+pktan)AsL]} + W
Safe axial pile capacity, kN
m below
, kN
/m3
as per IS 2911 (Part1 / Section 2) : 2010 Clause 6.3.25.0
Fine sand
(=),
degre
es
Percentage of Ultimate Shaft Resistance to be used for Ultimate Pullout Capacity:Factor of Safety :
Pile Capacity Calculation at following Pile Length(s) below cut-off Level (m)
Fine sand
Consider overburden press. to become constant below :
Fine sandFine sand
m
Laye
r No
. k
Design Water Table Depth :
Sandy silt
Soil Classification
c, kN
/m2
Overburden Pressure to be considered below :
Computation of Safe Axial Pullout Capacity of PileBy Static Analysis
Analysis in accordance with IS 2911 (Part 1 / Section 2) : 2010
Coefficient of earth pressurePile diameter
Extension of Barauni Super Critical Coal Fired Thermal Power Station at Barauni, Bihar. M/s. STEAG Energy Services (India) Pvt. Ltd.
Project No. 215081-II Appendix-B : Plate 10 of 30
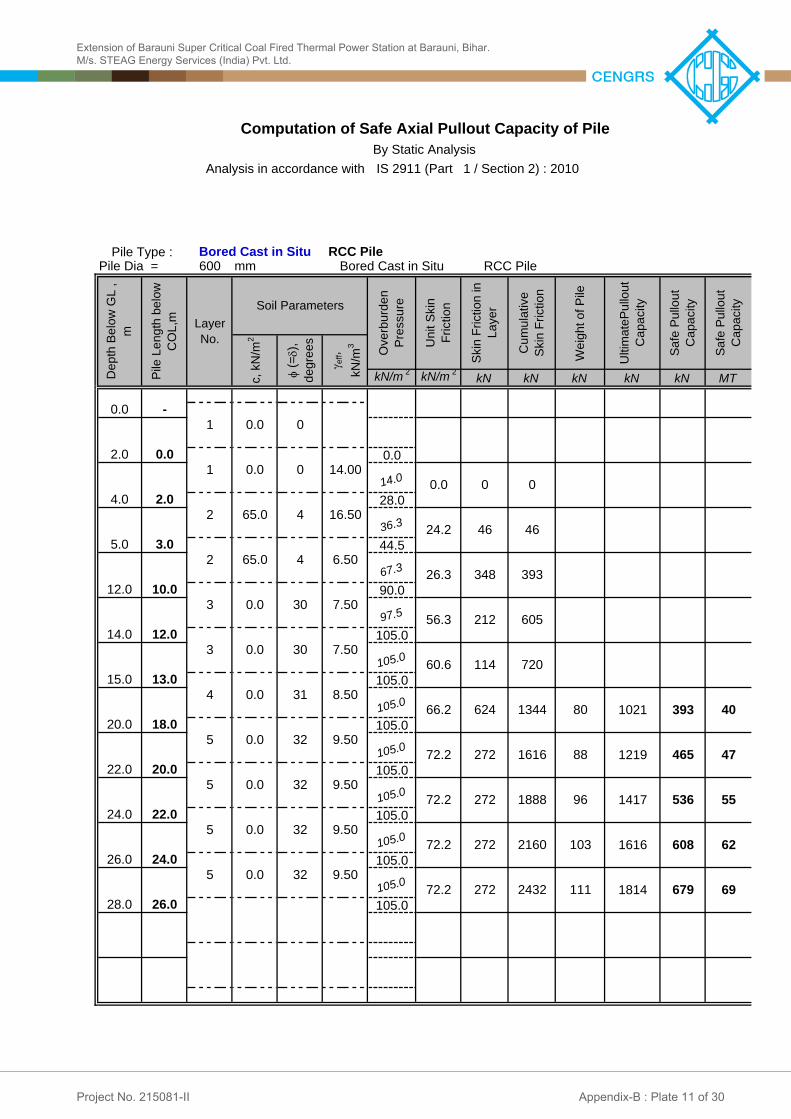
Pile Type : Bored Cast in Situ RCC Pile
Computation of Safe Axial Pullout Capacity of PileBy Static Analysis
Analysis in accordance with IS 2911 (Part 1 / Section 2) : 2010
Pile Dia = 600 mm
kN/m 2 kN/m 2kN kN kN kN kN MT
0.0
28.0
44.5
90.0
105.0
105.0
105.0
105.0
105.0
105.0
105.0
40
47
55
62
69
1021
1219
1417
608
393
1616
1814
Safe
Pullo
ut Ca
pacit
y
Ultim
atePu
llout
Capa
city
243272.2 272
72.2
272
272
272
72.2
66.2
72.2
Cumu
lative
Sk
in Fri
ction
Unit S
kin
Fricti
on
97.5
65.02
14.0
7.503
0
30
4
02.0
-
0.02.04.0
1
1
2
32
28.0
26.0 24.0
22.024.0
0.026.0
5
15.04
13.0
314.0
0.0
Depth
Below
GL ,
m
22.0
0.0
3.0
0.0
5.0
Pile L
ength
below
CO
L,m
12.0
20.0
20.0
12.0
5
0.0
0.0
0.0
10.0
18.0
5
5
105.0
105.0
7.5030
32
32105.0
9.50
9.50
9.50
0.0
14.00
9.50
0.0
16.50
6.50
65.0
4
0.0
31
32
56.3 605
0
46
0
46
Safe
Pullo
ut Ca
pacit
y
Weigh
t of P
ile
105.0
1344
720
624
60.6
348
212
393
96
1616 88
105.0
105.0 465
536
80
1148.50
111 679
Bored Cast in Situ RCC Pile
24.2
26.3
103
1888
2160
Soil Parameters
Skin
Fricti
on in
La
yer
Layer No.
c, kN
/m2
eff,
kN/m
3
(=
), de
grees
0.0
36.3
Overb
urden
Pr
essu
re
67.3
Extension of Barauni Super Critical Coal Fired Thermal Power Station at Barauni, Bihar. M/s. STEAG Energy Services (India) Pvt. Ltd.
Project No. 215081-II Appendix-B : Plate 11 of 30

600 mm 2.0 m 18 m
FixedM 30
m4
P130.0 kPa
T = R = for Preconsolidated ClaysMN/m3 R =
m0.0 zf/R = 1.95
4.97 m m
e =H = zf =
5.0 mm96 kN = 9.8 Tonnes
Lateral Load Carrying Capacity for Pile Foundations
2.55 m
CirclePile cross-section :
6.362E-03
Pile Head :31000 MPa
RCC Pile
(EI/KB)1/4for Granular Soils and NC Clays
e/R =
Modulus of Elasticity :
0.0
Cohesive
Saturation :
(EI/ηh)1/5
Unconfined Compression Strength (qu) =Submerged
Reading off from graph,e + zf =
Deflection, …. for free-head pile
4.97
23.4Modulus of Subgrade Reaction, k1 =
Bored Cast in Situ
where : y =
Normally Consolidated or Preconsolidated Clays?
Pile Type :
Grade of Concrete :
Free-standing length of pile…. for fixed-head pile
Depth of Fixity, zf =
Computed Lateral Capacity of Pile, H =
Deflection,Lateral deflection at pile topLateral load applied
Permissible Horizontal Deflection at top of pile, Y =Depth of fixity
Free Standing Length of Pile or Length of pile below cut-off-level not contributing substantially to lateral capacity (e) :
Pile Dia : Pile Cut-off-Level below GL Pile Length :
Soil Classification:Moment of Inertia, I :
Head Condition
IRC 78 - 2014Analysis in accordance with:
33
103
)(x
EIzeH
y f
33
1012
)(x
EIzeH
y f
Extension of Barauni Super Critical Coal Fired Thermal Power Station at Barauni, Bihar. M/s. STEAG Energy Services (India) Pvt. Ltd.
Project No. 215081-II Appendix-B : Plate 12 of 30

PILE FOUNDATION
BOILER FOUNDATION SITE

Qsafe = FS = = p = = L =c = k =' = D =
As =n = Ap =
2.0 m550 mm
1.728 0.238 m2
COL 20 11.0 2.0 m
i.e. 13.0 0.0 m
2.5 as per
From To1 0.0 4.5 0 0 14.0 1.0 0.00 2 4.5 7.5 65 4 16.5 1.0 0.33 3 7.5 13.0 0 0 17.5 1.0 0.00 4 13.0 20.0 0 31 18.5 1.1 0.00 23.93 25.995 20.0 30.0 0 32 19.5 1.1 0.00 28.88 30.216 30.0 40.0 0 33 20.0 1.2 0.00 34.86 35.19
#N/A #N/A #N/A #N/A #N/A #N/A #N/A #N/A #N/A #N/A #N/A #N/A
18.0 20.0 22.0 24.0 26.0
FlyashSandy silt
Fine sand
Fine sandFine sand
m
k
IS 2911 (Part 1 / Section 2) : 2010
, kN
/m3
(=),
degre
es
NNc Nq
pile diameters, i.e.
Design Water Table Depth:
Laye
r No
. Depth,m
5.0
Soil Classification c, kN
/m2
Factor of Safety :
Fine sand - liquefiable
m belowConsider overburden pressure to become constant below :
m2/m lengthOverburden Pressure to be considered below :
m below
Pile Surface Area, As = Pile cross-section Area, Ap =
Pile Type : Loading : RCC Pile
Computation of Safe Axial Compressive Pile CapacityBy Static Analysis
IS 2911 (Part 1 / Section 2) : 2010Analysis in accordance with
Pile surface area per m length
Adhesion factor (function of C u )
Number of layers
Axial Compression
Pile end bearing area
Effective density of soil, kN/m3
Pile segment length in selected layer
Pile diameterCoefficient of earth pressure
Factor of safetywhere :
Bearing capacity factors, which are a function of
Safe axial pile capacity, kN
Cohesion intercept, kN/m2
Pile Capacity Calculation at following Pile Length(s) below cut-off Level (m)
Pile Cross section :
Overburden pressure, kN/m2
Pile Diameter ,D : Circle Pile cut-off Level (COL) :
Nc, Nq, N=
Angle of wall friction between soil and pile, degrees
Qsafe=(1/FS){1 to n[(c+pktan)AsL]+[(cNc+pNq+0.5D ' N)Ap]}
Bored Cast in SituThe safe pile capacity is computed as :
Extension of Barauni Super Critical Coal Fired Thermal Power Station at Barauni, Bihar. M/s. STEAG Energy Services (India) Pvt. Ltd.
Project No. 215081-II Appendix-B : Plate 13 of 30

Pile Type : Loading : RCC Pile
Computation of Safe Axial Compressive Pile CapacityBy Static Analysis
IS 2911 (Part 1 / Section 2) : 2010Analysis in accordance with
Axial CompressionBored Cast in Situ
Pile Dia = 550 mm
kN/m 2 kN/m 2kN kN kN/m 2
kN kN kN MT
Safe
Pile
Capa
city
Overb
urden
Pr
essu
re
Cumu
lative
Sk
in Fri
ction
Unit S
kin
Fricti
onSk
in Fri
ction
in
Laye
r
Unit E
nd
Beari
ng
Safe
Pile
Capa
city
Total
End
Beari
ng
Ult. P
ile
Capa
city
2.0 0.0
Layer No.
Soil Parameters
c, kN
/m2
eff,
kN/m
3
1 0.00.0
(=
), de
grees
-
Depth
Below
GL
, mPil
e Len
gth
below
COL
, m
0.0
0
00
017.514.0
2.0 0.0
4.5 2.5
0.0
1
1 0.0
35.0
000
0
21
17.514.0
39.1 24 214.5 2.5
5.0 3.0
2
0.01
65.0 16.5443.3
47
21
39.1 24 21
45.2 25 265.0 3.0
2
65.05.6 3.6
2
65.0
6.5
16.54
447.2
83 130
47 45.2
25
25 2665.0
5.5
25.6 3.6
2
7.565.0 6.54
53.3
6.54
59.5
83 130
0 0
130
7.50
25
8.60.0
6.6
5.5
27.5
65.0
63.6
6.5453.3
367.8
0
0 0
130 7.5
7.50
0
13.0 11.0
38.6
0.0
0.06.6
63.63
84.3 0 130100.8
0
121 251
100.8
7.50
0.0 31 8.513.0 11.0
14.1 12.1
4
3 0.084.3 0
64
130
100.8
527
121
251
778
100.8
100.8
0.0 31
31 8.5
8.5
0.0414.1 12.1
4
18.9 16.964
64
100.8
61
527
899 594587 1486121
2471
7788.5
100.8
100.8 64
31 8.50.0
310.020.0 18.0
4
418.9 16.9
64
100.861
716961031
899 594
2989132
587 1486121 2471
1741710100.8
8.5100.8 64
0.0 9.532
310.020.0 18.0
4
19.1
5
21.169
100.8716961031 2989132 1741710100.8
0.0 9.532
19.1
5
21.169
Extension of Barauni Super Critical Coal Fired Thermal Power Station at Barauni, Bihar. M/s. STEAG Energy Services (India) Pvt. Ltd.
Project No. 215081-II Appendix-B : Plate 14 of 30

Pile Type : Loading : RCC Pile
Computation of Safe Axial Compressive Pile CapacityBy Static Analysis
IS 2911 (Part 1 / Section 2) : 2010Analysis in accordance with
Axial CompressionBored Cast in SituPile Dia = 550 mm
kN/m 2 kN/m 2kN kN kN/m 2
kN kN kN MT21.1 19.1 100.8 69 1031 2989 710 1741 696 71
Safe
Pile
Capa
city
75
Safe
Pile
Capa
city
Skin
Fricti
on in
La
yer
Ult. P
ile
Capa
city
Unit E
nd
Beari
ng
Total
End
Beari
ngSoil ParametersOv
erburd
en
Pres
sure
32
(=
), de
grees
eff,
kN/m
3
0.0 9.5
Layer No.
22.0 20.0
c, kN
/m2
5
Depth
Below
GL
, mPil
e Len
gth
below
COL
, m
1848
Cumu
lativ
e Skin
Fri
ction
100.8 739
Unit S
kin
Fricti
on69 108 1138 2989 710
100.885
75320.0
22.0
5 0.024.0
9.522.0 20.0
32 9.5
51848100.8 739
20881378
69 108 1138 2989 710
710 83569100.8 2989239100.8
95
85
0.0 9.53226.0
22.0
24.0
5 0.0
524.0
32 9.520881378 710 835
69 239 1617 2989 710 2327 931
69100.8
100.8
2989239
100.895
105
0.0
28.0 26.0
32 9.5
9.53226.0 24.0
5 0.0
5
2989
69 239 1617 2989 710 2327 931
710 2566 10261856100.8
100.8
69 239100.8
105
28.0 26.0
32 9.55 0.02989 710 2566
1026
1856
100.8
69
239
Extension of Barauni Super Critical Coal Fired Thermal Power Station at Barauni, Bihar. M/s. STEAG Energy Services (India) Pvt. Ltd.
Project No. 215081-II Appendix-B : Plate 15 of 30

whereQsafe = FS = = p = = L =c = k =' = D =n = As =W = Weight of the pile
2.0 m550 mm
1.728
COL 20 11.0 2.0 m
i.e. 13.0 0.0 m
3.00.7
From To1 0.0 4.5 0 0 14.0 1.0 0.002 4.5 7.5 65 4 16.5 1.0 0.333 7.5 13.0 0 0 17.5 1.0 0.004 13.0 20.0 0 31 18.5 1.1 0.005 20.0 30.0 0 32 19.5 1.1 0.006 30.0 40.0 0 33 20.0 1.2 0.00
#N/A #N/A #N/A #N/A #N/A #N/A #N/A #N/A #N/A #N/A #N/A #N/A
18.0 20.0 22.0 24.0 26.0
Overburden Pressure to be considered below :
Computation of Safe Axial Pullout Capacity of PileBy Static Analysis
Analysis in accordance with IS 2911 (Part 1 / Section 2) : 2010
Coefficient of earth pressurePile diameter
Consider overburden press. to become constant below :
Fine sandFine sand
m
Laye
r No
. k
Design Water Table Depth :
Sandy silt
Soil Classification
c, kN
/m2
Fine sand - liquefiable
Factor of Safety :
Pile Capacity Calculation at following Pile Length(s) below cut-off Level (m)
m below
, kN
/m3
as per IS 2911 (Part1 / Section 2) : 2010 Clause 6.3.25.0
Fine sand
(=),
degre
es
Percentage of Ultimate Shaft Resistance to be used for Ultimate Pullout Capacity:
Pile surface area per m length
Friction angle between soil and pile, degrees ( = ) Pile segment length in selected layer
Factor of safetyAdhesion factor (function of C u ) Overburden pressure, kN/m2
Qsafe=(1/FS){1 to n[(c+pktan)AsL]} + W
Safe axial pile capacity, kN
The safe uplift capacity of pile is calculated as :
Pile Type : Bored Cast in Situ RCC PileAxial Pullout (Uplift)Loading :
Depth,m
Flyash
Cohesion intercept, kN/m2
m2/m lengthPile Surface Area, As =
Pile cross section shape : circle
Effective density of soil, kN/m3
Pile Diameter ,D :Pile cut-off Level (COL) :
Number of layers
pile diameters, i.e. m below
Extension of Barauni Super Critical Coal Fired Thermal Power Station at Barauni, Bihar. M/s. STEAG Energy Services (India) Pvt. Ltd.
Project No. 215081-II Appendix-B : Plate 16 of 30

Computation of Safe Axial Pullout Capacity of PileBy Static Analysis
Analysis in accordance with IS 2911 (Part 1 / Section 2) : 2010
Pile Type : Bored Cast in Situ RCC PilePile Dia = 550 mm
kN/m 2 kN/m 2kN kN kN kN kN MT (
= ),
degre
es Overb
urden
Pr
essu
reSoil Parameters
Skin
Fricti
on in
La
yer
Layer No.
c, kN
/m2
eff,
kN/m
3
Bored Cast in Situ RCC Pile
Safe
Pullo
ut Ca
pacit
y
Weigh
t of P
ile
Depth
Below
GL ,
m
0.0
0.0
Pile L
ength
below
CO
L,m
2.0
-1 0.0
0
Cumu
lative
Sk
in Fri
ction
Unit S
kin
Fricti
on
Safe
Pullo
ut Ca
pacit
y
Ultim
atePu
llout
Capa
city
0.0
0.0
0
0.02.0
0.02.54.5
1
1
0.0 0
017.5
14.00
0
35.039.1 24.4
0.0 0
21
3.05.0
0.02.54.5
1
2 65.0 4
017.5
14.00
16.500
21
43.339.1
51.4
24.4
25.2 109 130
21
7.5 5.5
3.05.02 65.0 4
65.02
16.50
6.50421
59.551.4 25.2
109
0
130
0.0 1307.5 5.5
11.013.03 0
65.02
7.50
6.504
0.080.1
100.867
0
769
899
0.0 130
100.8 63.60.0 8.5031
11.0
20.0 18.0
413.0
3 0 7.500.080.1
277696 28100.8
67
74
769
1138
89932
100.8
239
63.6
100.89.50
0.0 8.5031
20.0
0.022.0
20.05
18.0
4
69.3
277
339
696
870
28
35100.8
74
1378 80
113832
32239100.8
100.8
9.50
9.5022.0
0.020.0
5
0.0
24.0
22.05
69.3
69.3 239
339
402
870
1045
35
41100.8
87
1378 80
1617
32100.8
32100.8
9.5022.0
0.0
0.05
524.0
24.026.0
69.39.50
239
23969.3
402
464
1045
1219
41
47100.8
1856
871617
100.8
32100.8
9.505
0.0
0.0
5
3228.0 26.0
24.026.09.50
69.3
239
239
69.3
94 5271393
4641219 47
54100.8
1856100.8
9.50
5 0.0 32
28.0 26.0
69.3 239
94 5271393
54
Extension of Barauni Super Critical Coal Fired Thermal Power Station at Barauni, Bihar. M/s. STEAG Energy Services (India) Pvt. Ltd.
Project No. 215081-II Appendix-B : Plate 17 of 30
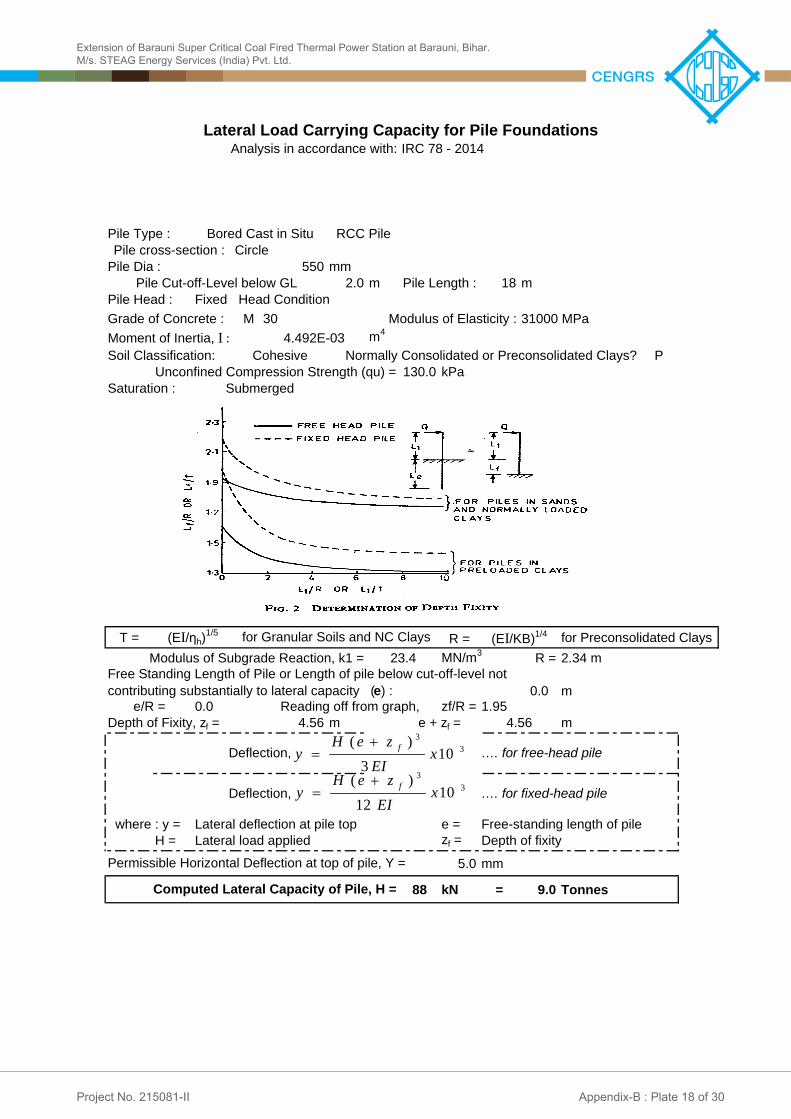
550 mm 2.0 m 18 m
FixedM 30
m4
P130.0 kPa
T = R = for Preconsolidated ClaysMN/m3 R =
m0.0 zf/R = 1.95
4.56 m m
e =H = zf =
5.0 mm88 kN = 9.0 Tonnes
IRC 78 - 2014Analysis in accordance with:
Depth of fixity
Free Standing Length of Pile or Length of pile below cut-off-level not contributing substantially to lateral capacity (e) :
Pile Dia : Pile Cut-off-Level below GL Pile Length :
Soil Classification:Moment of Inertia, I :
Head Condition
Computed Lateral Capacity of Pile, H =
Deflection,Lateral deflection at pile topLateral load applied
Permissible Horizontal Deflection at top of pile, Y =
23.4Modulus of Subgrade Reaction, k1 =
Bored Cast in Situ
where : y =
Normally Consolidated or Preconsolidated Clays?
Pile Type :
Grade of Concrete :
Free-standing length of pile…. for fixed-head pile
Depth of Fixity, zf = e + zf =Deflection, …. for free-head pile
4.56e/R =
Modulus of Elasticity :
0.0
Cohesive
Saturation :
(EI/ηh)1/5
Unconfined Compression Strength (qu) =Submerged
Reading off from graph,
Lateral Load Carrying Capacity for Pile Foundations
2.34 m
CirclePile cross-section :
4.492E-03
Pile Head :31000 MPa
RCC Pile
(EI/KB)1/4for Granular Soils and NC Clays
33
103
)(x
EIzeH
y f
33
1012
)(x
EIzeH
y f
Extension of Barauni Super Critical Coal Fired Thermal Power Station at Barauni, Bihar. M/s. STEAG Energy Services (India) Pvt. Ltd.
Project No. 215081-II Appendix-B : Plate 18 of 30

Qsafe = FS = = p = = L =c = k =' = D =
As =n = Ap =
2.0 m600 mm
1.885 0.283 m2
COL 20 12.0 2.0 m
i.e. 14.0 0.0 m
2.5 as per
From To1 0.0 4.5 0 0 14.0 1.0 0.00 2 4.5 7.5 65 4 16.5 1.0 0.33 3 7.5 13.0 0 0 17.5 1.0 0.00 4 13.0 20.0 0 31 18.5 1.1 0.00 23.93 25.995 20.0 30.0 0 32 19.5 1.1 0.00 28.88 30.216 30.0 40.0 0 33 20.0 1.2 0.00 34.86 35.19
#N/A #N/A #N/A #N/A #N/A #N/A #N/A #N/A #N/A #N/A #N/A #N/A
18.0 20.0 22.0 24.0 26.0
FlyashSandy silt
Fine sand
Fine sandFine sand
m
k
IS 2911 (Part 1 / Section 2) : 2010
, kN
/m3
(=),
degre
es
NNc Nq
pile diameters, i.e.
Design Water Table Depth:
Laye
r No
. Depth,m
5.0
Soil Classification c, kN
/m2
Factor of Safety :
Fine sand - liquefiable
m belowConsider overburden pressure to become constant below :
m2/m lengthOverburden Pressure to be considered below :
m below
Pile Surface Area, As = Pile cross-section Area, Ap =
Pile Type : Loading : RCC Pile
Computation of Safe Axial Compressive Pile CapacityBy Static Analysis
IS 2911 (Part 1 / Section 2) : 2010Analysis in accordance with
Pile surface area per m length
Adhesion factor (function of C u )
Number of layers
Axial Compression
Pile end bearing area
Effective density of soil, kN/m3
Pile segment length in selected layer
Pile diameterCoefficient of earth pressure
Factor of safetywhere :
Bearing capacity factors, which are a function of
Safe axial pile capacity, kN
Cohesion intercept, kN/m2
Pile Capacity Calculation at following Pile Length(s) below cut-off Level (m)
Pile Cross section :
Overburden pressure, kN/m2
Pile Diameter ,D : Circle Pile cut-off Level (COL) :
Nc, Nq, N=
Angle of wall friction between soil and pile, degrees
Qsafe=(1/FS){1 to n[(c+pktan)AsL]+[(cNc+pNq+0.5D ' N)Ap]}
Bored Cast in SituThe safe pile capacity is computed as :
Extension of Barauni Super Critical Coal Fired Thermal Power Station at Barauni, Bihar. M/s. STEAG Energy Services (India) Pvt. Ltd.
Project No. 215081-II Appendix-B : Plate 19 of 30

Pile Type : Loading : RCC Pile
Computation of Safe Axial Compressive Pile CapacityBy Static Analysis
IS 2911 (Part 1 / Section 2) : 2010Analysis in accordance with
Axial CompressionBored Cast in Situ
Pile Dia = 600 mm
kN/m 2 kN/m 2kN kN kN/m 2
kN kN kN MT
Safe
Pile
Capa
city
Overb
urden
Pr
essu
re
Cumu
lative
Sk
in Fri
ction
Unit S
kin
Fricti
onSk
in Fri
ction
in
Laye
r
Unit E
nd
Beari
ng
Safe
Pile
Capa
city
Total
End
Beari
ng
Ult. P
ile
Capa
city
2.0 0.0
Layer No.
Soil Parameters
c, kN
/m2
eff,
kN/m
3
1 0.00.0
(=
), de
grees
-
Depth
Below
GL
, mPil
e Len
gth
below
COL
, m
0.0
0
00
017.514.0
2.0 0.0
4.5 2.5
0.0
1
1 0.0
35.0
000
0
23
17.514.0
39.1 24 234.5 2.5
5.0 3.0
2
0.01
65.0 16.5443.3
56
23
39.1 24 23
45.5 25 335.0 3.0
2
65.05.7 3.7
2
65.0
6.5
16.54
447.8
86 142
56 45.5
25
25 3365.0
5.5
25.7 3.7
2
7.565.0 6.54
53.7
6.54
59.5
86 142
0 0
142
7.50
25
8.70.0
6.7
5.5
27.5
65.0
64.0
6.5453.7
368.5
0
0 0
142 7.5
7.50
0
13.0 11.0
38.7
0.0
0.06.7
64.03
84.6 0 142100.8
0
125 267
105.0
7.50
0.0 31 8.513.0 11.0
14.0 12.0
4
3 0.084.6 0
66
142
109.3
26
125
267
293
105.0
109.3
0.0 31
31 8.5
8.5
0.0414.0 12.0
4
14.2 12.269
66
109.3
26
890 598
2938.5
109.3
109.3 69
31 8.50.0
310.018.8 16.8
4
414.2 12.2
69
109.3747221046
890
2680156
598
1804758109.3
8.5109.3 69
0.0 8.531
310.018.8 16.8
4
18.0
4
20.069
109.3747221046 2680156 1804758109.3
0.0 8.531
18.0
4
20.069
Extension of Barauni Super Critical Coal Fired Thermal Power Station at Barauni, Bihar. M/s. STEAG Energy Services (India) Pvt. Ltd.
Project No. 215081-II Appendix-B : Plate 20 of 30

Pile Type : Loading : RCC Pile
Computation of Safe Axial Compressive Pile CapacityBy Static Analysis
IS 2911 (Part 1 / Section 2) : 2010Analysis in accordance with
Axial CompressionBored Cast in SituPile Dia = 600 mm
kN/m 2 kN/m 2kN kN kN/m 2
kN kN kN MT20.0 18.0 109.3 75 1046 2680 758 1804 722 74
Safe
Pile
Capa
city
87
Safe
Pile
Capa
city
Skin
Fricti
on in
La
yer
Ult. P
ile
Capa
city
Unit E
nd
Beari
ng
Total
End
Beari
ngSoil ParametersOv
erburd
en
Pres
sure
32
(=
), de
grees
eff,
kN/m
3
0.0 9.5
Layer No.
21.2 19.2
c, kN
/m2
5
Depth
Below
GL
, mPil
e Len
gth
below
COL
, m
2133
Cumu
lativ
e Skin
Fri
ction
109.3 853
Unit S
kin
Fricti
on75 170 1216 3241 916
109.392
87320.0
20.0
5 0.022.0
9.521.2 19.2
32 9.5
52133109.3 853
22461329
75 170 1216 3241 916
916 89875109.3 3241113109.3
103
92
0.0 9.53224.0
20.0
22.0
5 0.0
522.0
32 9.522461329 916 898
75 283 1613 3241 916 2529 1012
75109.3
109.3
3241113
109.3103
115
0.0
26.0 24.0
32 9.5
9.53224.0 22.0
5 0.0
5
3241
75 283 1613 3241 916 2529 1012
916 2812 11251896109.3
109.3
75 283109.3
115
1260.0 9.5325
26.0 24.0
28.0 26.0
32 9.55 0.03241 916 2812
916
1125
3095 1238
1896
2179
109.3
109.3 3241
75
75 283
283
109.3126
0.0 9.532
528.0 26.0
916
3095 1238
2179109.3
3241
75 283
Extension of Barauni Super Critical Coal Fired Thermal Power Station at Barauni, Bihar. M/s. STEAG Energy Services (India) Pvt. Ltd.
Project No. 215081-II Appendix-B : Plate 21 of 30

whereQsafe = FS = = p = = L =c = k =' = D =n = As =W = Weight of the pile
2.0 m600 mm
1.885
COL 20 12.0 2.0 m
i.e. 14.0 0.0 m
3.00.7
From To1 0.0 4.5 0 0 14.0 1.0 0.002 4.5 7.5 65 4 16.5 1.0 0.333 7.5 13.0 0 0 17.5 1.0 0.004 13.0 20.0 0 31 18.5 1.1 0.005 20.0 30.0 0 32 19.5 1.1 0.006 30.0 40.0 0 33 20.0 1.2 0.00
#N/A #N/A #N/A #N/A #N/A #N/A #N/A #N/A #N/A #N/A #N/A #N/A
18.0 20.0 22.0 24.0 26.0
Overburden Pressure to be considered below :
Computation of Safe Axial Pullout Capacity of PileBy Static Analysis
Analysis in accordance with IS 2911 (Part 1 / Section 2) : 2010
Coefficient of earth pressurePile diameter
Consider overburden press. to become constant below :
Fine sandFine sand
m
Laye
r No
. k
Design Water Table Depth :
Sandy silt
Soil Classification
c, kN
/m2
Fine sand - liquefiable
Factor of Safety :
Pile Capacity Calculation at following Pile Length(s) below cut-off Level (m)
m below
, kN
/m3
as per IS 2911 (Part1 / Section 2) : 2010 Clause 6.3.25.0
Fine sand
(=),
degre
es
Percentage of Ultimate Shaft Resistance to be used for Ultimate Pullout Capacity:
Pile surface area per m length
Friction angle between soil and pile, degrees ( = ) Pile segment length in selected layer
Factor of safetyAdhesion factor (function of C u ) Overburden pressure, kN/m2
Qsafe=(1/FS){1 to n[(c+pktan)AsL]} + W
Safe axial pile capacity, kN
The safe uplift capacity of pile is calculated as :
Pile Type : Bored Cast in Situ RCC PileAxial Pullout (Uplift)Loading :
Depth,m
Flyash
Cohesion intercept, kN/m2
m2/m lengthPile Surface Area, As =
Pile cross section shape : circle
Effective density of soil, kN/m3
Pile Diameter ,D :Pile cut-off Level (COL) :
Number of layers
pile diameters, i.e. m below
Extension of Barauni Super Critical Coal Fired Thermal Power Station at Barauni, Bihar. M/s. STEAG Energy Services (India) Pvt. Ltd.
Project No. 215081-II Appendix-B : Plate 22 of 30

Computation of Safe Axial Pullout Capacity of PileBy Static Analysis
Analysis in accordance with IS 2911 (Part 1 / Section 2) : 2010
Pile Type : Bored Cast in Situ RCC PilePile Dia = 600 mm
kN/m 2 kN/m 2kN kN kN kN kN MT (
= ),
degre
es Overb
urden
Pr
essu
reSoil Parameters
Skin
Fricti
on in
La
yer
Layer No.
c, kN
/m2
eff,
kN/m
3
Bored Cast in Situ RCC Pile
Safe
Pullo
ut Ca
pacit
y
Weigh
t of P
ile
Depth
Below
GL ,
m
0.0
0.0
Pile L
ength
below
CO
L,m
2.0
-1 0.0
0
Cumu
lative
Sk
in Fri
ction
Unit S
kin
Fricti
on
Safe
Pullo
ut Ca
pacit
y
Ultim
atePu
llout
Capa
city
0.0
0.0
0
0.02.0
0.02.54.5
1
1
0.0 0
017.5
14.00
0
35.039.1 24.4
0.0 0
23
3.05.0
0.02.54.5
1
2 65.0 4
017.5
14.00
16.500
23
43.339.1
51.4
24.4
25.2 119 142
23
7.5 5.5
3.05.02 65.0 4
65.02
16.50
6.50423
59.551.4 25.2
119
0
142
0.0 1427.5 5.5
11.013.03 0
65.02
7.50
6.504
0.080.1
100.8
0
125
267
0.0 142
105.0 66.20.0 8.5031
11.0
14.0 12.0
413.0
3 0 7.500.080.1
109.3
80
125
1046
26731
105.0
780
66.2
109.38.50
0.0 8.5031
18.0
0.020.0
14.04
12.0
4
68.9
324
812 33109.3
80
1329 88
104631
32780109.3
109.3
8.50
9.5020.0
0.018.0
5
0.0
22.0
20.04
68.9
75.1 283
324
398
812
1018
33
41109.3
96
1329 88
1613
32109.3
32109.3
9.5020.0
0.0
0.05
522.0
22.024.0
75.19.50
283
28375.1
398
472
1018
1224
41
48109.3
1896
961613
109.3
32109.3
9.505
0.0
0.0
5
3226.0 24.0
22.024.09.50
75.1
283
283
75.1
103 5461430
4721224 48
56109.3
1896109.3
109.332
9.50
9.50
5 0.0 32
28.0
26.0 24.00.0
26.0
575.1 283
217975.1 283 111
103 5461430
1636 620 63
56
109.3
109.332 9.50
28.00.0
26.0
5
217975.1 283
111 1636 620 63
Extension of Barauni Super Critical Coal Fired Thermal Power Station at Barauni, Bihar. M/s. STEAG Energy Services (India) Pvt. Ltd.
Project No. 215081-II Appendix-B : Plate 23 of 30

600 mm 2.0 m 18 m
FixedM 30
m4
P130.0 kPa
T = R = for Preconsolidated ClaysMN/m3 R =
m0.0 zf/R = 1.95
4.97 m m
e =H = zf =
5.0 mm96 kN = 9.8 Tonnes
Lateral Load Carrying Capacity for Pile Foundations
2.55 m
CirclePile cross-section :
6.362E-03
Pile Head :31000 MPa
RCC Pile
(EI/KB)1/4for Granular Soils and NC Clays
e/R =
Modulus of Elasticity :
0.0
Cohesive
Saturation :
(EI/ηh)1/5
Unconfined Compression Strength (qu) =Submerged
Reading off from graph,e + zf =
Deflection, …. for free-head pile
4.97
23.4Modulus of Subgrade Reaction, k1 =
Bored Cast in Situ
where : y =
Normally Consolidated or Preconsolidated Clays?
Pile Type :
Grade of Concrete :
Free-standing length of pile…. for fixed-head pile
Depth of Fixity, zf =
Computed Lateral Capacity of Pile, H =
Deflection,Lateral deflection at pile topLateral load applied
Permissible Horizontal Deflection at top of pile, Y =Depth of fixity
Free Standing Length of Pile or Length of pile below cut-off-level not contributing substantially to lateral capacity (e) :
Pile Dia : Pile Cut-off-Level below GL Pile Length :
Soil Classification:Moment of Inertia, I :
Head Condition
IRC 78 - 2014Analysis in accordance with:
33
103
)(x
EIzeH
y f
33
1012
)(x
EIzeH
y f
Extension of Barauni Super Critical Coal Fired Thermal Power Station at Barauni, Bihar. M/s. STEAG Energy Services (India) Pvt. Ltd.
Project No. 215081-II Appendix-B : Plate 24 of 30

OPEN FOUNDATION
COAL SILO SITE

c =B =
FS =
c = 0.00 T/m2 = 30.0c' = 0.00 T/m2 = 21.1
Nc = Nq = Ng = From To T/m3
Nc' = Nq
' = Ng' = 0.0 4.0 1.40
4.0 5.0 1.652.5 5.0 15.0 1.75
15.0 20.0 1.8520.0 40.0 1.95
V 0.50Y
4.0
B, m L, m zc zq zg dc dq dg dc' dq' dg
' GSF LSF
3.0 3.0 Square 5.0 0.50 1.30 1.20 0.80 1.12 1.06 1.06 74.0 6.0 6.0 Square 5.0 0.50 1.30 1.20 0.80 1.06 1.03 1.03 81.7 3.0 3.0 Square 6.0 0.50 1.30 1.20 0.80 1.23 1.12 1.12 85.0 6.0 6.0 Square 6.0 0.50 1.30 1.20 0.80 1.12 1.06 1.06 90.6
93.0
Depth
,m
qnet safe = (1/FS){cNczcdc+q(Nq-1)zqdq+0.5BgNgzgdgRw}
Gross Bearing Capacity
(Safe) T/m2
81.388.9
m
7.11
FAILURE CRITERIA :
dc, dq, dg = bearing capacity factors, which are a function of fDepth factors
Depth, mLOCAL SHEAR FAILURE
Bulk Density Profile
98.6
SHEAR FAILURE
as per IS 1904-1986
m
Design Water Table depth =
Foundation Dimensions
74.0
Rw
90.6
15.87
For computation of Depth Factor, depth below GL to be ignored to account for loose soils,poorly compacted backfill above foundation, scour etc. =
6.24Local Shear Failure :
Rw factor: Constant value(V) for worst condition or calculate(C) based on WT Depth ? :Depth factor to be considered ?
Factor of safety =
Rw =
5.0
Shape Factors Depth factors
(GSF)FOUN-DATION SHAPE
qnet safe , T/m2
Depth factors (LSF)
GENERAL
85.0
81.7
Safe Net Bearing Capacity
T/m2
30.14General Shear Failure :degrees
22.4018.40
Factor of safety
degrees
q =
The bearing capacity equation is as follows :
where:
zc, zq, zg =
Rw =
Foundation width
Bearing Capacity Analysis for Shallow FoundationsAnalysis as per IS 6403-1981
Bulk density of soil below founding level
safe net bearing capacity
GENERAL SHEAR FAILURE
Water table correction factor
Soil parameters :Shape factors
Nc, Nq, Ng =
qnet safe =overburden pressure
cohesion intercept
Extension of Barauni Super Critical Coal Fired Thermal Power Station at Barauni, Bihar. M/s. STEAG Energy Services (India) Pvt. Ltd.
Project No. 215081-II Appendix-B : Plate 25 of 30

V 0.5Y
4.0
Foun
datio
n Wi
dth,m
Foun
datio
n Le
ngth,
m
Foun
datio
n De
pth,m
Shape
Desig
n N-V
alue
Desig
n Net
Beari
ng
Pres
sure,
T/m2 Settlemen
t @ 1kg/cm2
(as read off from graph),
Rw
Fox's
Dep
th Fa
ctor, d
f
Rigidi
ty Fa
ctor,
d r
Comp
uted
Settle
ment,
mm
3.0 3.0 5.0 Square 21.0 16.5 13.3 0.50 0.91 1.0 39.86.0 6.0 5.0 Square 21.0 17.5 14.6 0.50 0.96 0.8 39.13.0 3.0 6.0 Square 26.0 24.0 10.4 0.50 0.80 1.0 39.86.0 6.0 6.0 Square 27.0 25.0 10.9 0.50 0.91 0.8 39.7
Settlement Analysis for Shallow Foundation Based on N- ValuesAnalysis as per IS:8009 (Part 1)-1976, Clause 9.1.4
mDepth to be ignored in Depth Factor Computation for loose soils, poorly compacted backfill, scour, etc.
R w factor : Calculate (C) based on water table depth or Fixed Value(V) for worst condition :
5.0
Rw factor for design :
Design Water Table Depth :
Fox's Depth Factor to be considered ?
m
Extension of Barauni Super Critical Coal Fired Thermal Power Station at Barauni, Bihar. M/s. STEAG Energy Services (India) Pvt. Ltd.
Project No. 215081-II Appendix-B : Plate 26 of 30

where B = B' = B/2 L' = L/2 =q = E =df = dr =I =
0.30 N
From To1 0.0 4.02 4.0 5.03 5.0 15.04 15.0 20.05 20.0 30.06 30.0 40.0
Y
4.0 m
3.0 3.0 5.0 16.5 1.00 0.91 1.00 10.00 0.507 1267 32.76.0 6.0 5.0 17.5 0.80 0.96 1.00 10.00 0.507 2450 30.43.0 3.0 6.0 24.0 1.00 0.80 1.00 10.00 0.507 1413 37.66.0 6.0 6.0 24.0 0.80 0.91 1.00 10.00 0.507 2567 37.6
Fine sand
Poisson's Ratio
Influence factor at corner of rectangular loaded area(B' x L'),
Fine sand
Rigidity factor
1000
Settlement at centre of footing of size B x L = 4 x Settlement at corner of area B' x L'
Modulus of Elasticity
Analysis as per IS : 8009 Part 1 - 1976, Clause 9.2
No consolidation settlement - analysis valid for granular soils,weathered rocks, hard clays & cohesive soils above water table
ELASTIC / IMMEDIATE SETTLEMENT
Fine sand
q B' (1 - 2) I
Poisson's Ratio :
Layer No.
Depth,m
E
computed from theory of elasticity using Steinbrenner's factors
df dr
Foundation Analysis & Design by J.E.Bowles
Applied Bearing Pressure
Fill (Flyash)Soil Classification Modulus of
Elasticity,T/m2
500
Foundation width
Fox's Depth factor
Settlement Analysis for Shallow FoundationsElastic Settlement Computed From Theory of Elasticity
N = H/B' Influence Factor
Applied Bearing Press. T/m2
Rigidity Factor, dr
Fox's Depth Factor
Fine sand
Depth to be ignored in Depth Factor Computation for loose soils, poorly compacted backfill, scour etc. =
Embed-ment
Depth (D), m
M = L'/B'
Fox's Depth Factor to be considered ?
Founda-tion Width
(B), m
Founda-tion
Length (L), m
4500
Elastic Settle-
ment mm
E(weigh-ted ave.)
T/m2
3200
700sandy silt
Total settlement computed as equal to elastic/immediate settlement.
fifth edition (1996)
Si =
Reference :
Is Rigid Layer met ?
1800
Extension of Barauni Super Critical Coal Fired Thermal Power Station at Barauni, Bihar. M/s. STEAG Energy Services (India) Pvt. Ltd.
Project No. 215081-II Appendix-B : Plate 27 of 30

OPEN FOUNDATION
RAW WATER STORAGE TANK SITE

c =B =
FS =
c = 0.00 T/m2 = 30.0c' = 0.00 T/m2 = 21.1
Nc = Nq = Ng = From To T/m3
Nc' = Nq
' = Ng' = 0.0 4.5 1.40
4.5 5.0 1.652.5 5.0 15.0 1.75
15.0 20.0 1.8520.0 40.0 1.95
V 0.50Y
4.5
B, m L, m zc zq zg dc dq dg dc' dq' dg
' GSF LSF
3.0 3.0 Square 6.5 0.50 1.30 1.20 0.80 1.23 1.12 1.12 87.3 6.0 6.0 Square 6.5 0.50 1.30 1.20 0.80 1.12 1.06 1.06 92.8 3.0 3.0 Square 7.5 0.50 1.30 1.20 0.80 1.35 1.17 1.17 99.2 6.0 6.0 Square 7.5 0.50 1.30 1.20 0.80 1.17 1.09 1.09 102.2
Bulk density of soil below founding level
safe net bearing capacity
GENERAL SHEAR FAILURE
Water table correction factor
Soil parameters :Shape factors
Nc, Nq, Ng =
qnet safe =overburden pressure
cohesion interceptFoundation width
Bearing Capacity Analysis for Shallow FoundationsAnalysis as per IS 6403-1981
Factor of safety
degrees
q =
The bearing capacity equation is as follows :
where:
zc, zq, zg =
Rw =
30.14General Shear Failure :degrees
22.4018.40
GENERAL
99.2
92.8
Safe Net Bearing Capacity
T/m2
Shape Factors Depth factors
(GSF)FOUN-DATION SHAPE
qnet safe , T/m2
Depth factors (LSF)
15.87
For computation of Depth Factor, depth below GL to be ignored to account for loose soils,poorly compacted backfill above foundation, scour etc. =
6.24Local Shear Failure :
Rw factor: Constant value(V) for worst condition or calculate(C) based on WT Depth ? :Depth factor to be considered ?
Factor of safety =
Rw =
5.0
Foundation Dimensions
87.3
Rw
102.2
SHEAR FAILURE
as per IS 1904-1986
m
Design Water Table depth =
111.2
dc, dq, dg = bearing capacity factors, which are a function of fDepth factors
Depth, mLOCAL SHEAR FAILURE
Bulk Density Profile
108.2
Depth
,m
qnet safe = (1/FS){cNczcdc+q(Nq-1)zqdq+0.5BgNgzgdgRw}
Gross Bearing Capacity
(Safe) T/m2
95.6101.1
m
7.11
FAILURE CRITERIA :
Extension of Barauni Super Critical Coal Fired Thermal Power Station at Barauni, Bihar. M/s. STEAG Energy Services (India) Pvt. Ltd.
Project No. 215081-II Appendix-B : Plate 28 of 30

V 0.5Y
4.5
Foun
datio
n Wi
dth,m
Foun
datio
n Le
ngth,
m
Foun
datio
n De
pth,m
Shape
Desig
n N-V
alue
Desig
n Net
Beari
ng
Pres
sure,
T/m2 Settlemen
t @ 1kg/cm2
(as read off from graph),
Rw
Fox's
Dep
th Fa
ctor, d
f
Rigidi
ty Fa
ctor,
d r
Comp
uted
Settle
ment,
mm
3.0 3.0 6.5 Square 21.0 18.5 13.3 0.50 0.80 1.0 39.36.0 6.0 6.5 Square 22.0 19.5 13.8 0.50 0.91 0.8 39.13.0 3.0 7.5 Square 26.0 26.0 10.4 0.50 0.73 1.0 39.46.0 6.0 7.5 Square 27.0 26.5 10.9 0.50 0.85 0.8 39.3
Settlement Analysis for Shallow Foundation Based on N- ValuesAnalysis as per IS:8009 (Part 1)-1976, Clause 9.1.4
mDepth to be ignored in Depth Factor Computation for loose soils, poorly compacted backfill, scour, etc.
R w factor : Calculate (C) based on water table depth or Fixed Value(V) for worst condition :
5.0
Rw factor for design :
Design Water Table Depth :
Fox's Depth Factor to be considered ?
m
Extension of Barauni Super Critical Coal Fired Thermal Power Station at Barauni, Bihar. M/s. STEAG Energy Services (India) Pvt. Ltd.
Project No. 215081-II Appendix-B : Plate 29 of 30

where B = B' = B/2 L' = L/2 =q = E =df = dr =I =
0.30 N
From To1 0.0 4.02 4.0 5.03 5.0 15.04 15.0 20.05 20.0 30.06 30.0 40.0
Y
4.5 m
3.0 3.0 5.0 18.5 1.00 0.96 1.00 10.00 0.507 1333 36.96.0 6.0 5.0 19.5 0.80 0.98 1.00 10.00 0.507 2683 31.73.0 3.0 6.0 26.0 1.00 0.85 1.00 10.00 0.507 1520 40.26.0 6.0 6.0 26.5 0.80 0.94 1.00 10.00 0.507 2800 39.2
Fine sand
Poisson's Ratio
Influence factor at corner of rectangular loaded area(B' x L'),
Fine sand
Rigidity factor
1000
Settlement at centre of footing of size B x L = 4 x Settlement at corner of area B' x L'
Modulus of Elasticity
Analysis as per IS : 8009 Part 1 - 1976, Clause 9.2
No consolidation settlement - analysis valid for granular soils,weathered rocks, hard clays & cohesive soils above water table
ELASTIC / IMMEDIATE SETTLEMENT
Fine sand
q B' (1 - 2) I
Poisson's Ratio :
Layer No.
Depth,m
E
computed from theory of elasticity using Steinbrenner's factors
df dr
Foundation Analysis & Design by J.E.Bowles
Applied Bearing Pressure
Fill (Flyash)Soil Classification Modulus of
Elasticity,T/m2
500
Foundation width
Fox's Depth factor
Settlement Analysis for Shallow FoundationsElastic Settlement Computed From Theory of Elasticity
N = H/B' Influence Factor
Applied Bearing Press. T/m2
Rigidity Factor, dr
Fox's Depth Factor
Fine sand
Depth to be ignored in Depth Factor Computation for loose soils, poorly compacted backfill, scour etc. =
Embed-ment
Depth (D), m
M = L'/B'
Fox's Depth Factor to be considered ?
Founda-tion Width
(B), m
Founda-tion
Length (L), m
4500
Elastic Settle-
ment mm
E(weigh-ted ave.)
T/m2
3800
700sandy silt
Total settlement computed as equal to elastic/immediate settlement.
fifth edition (1996)
Si =
Reference :
Is Rigid Layer met ?
2000
Extension of Barauni Super Critical Coal Fired Thermal Power Station at Barauni, Bihar. M/s. STEAG Energy Services (India) Pvt. Ltd.
Project No. 215081-II Appendix-B : Plate 30 of 30

APPENDIX-C
SITE PHOTOGRAPHS

Photo: 1 Borehole No. BH-P1
Site Photographs
Photo: 2 Borehole No. BH-P2
Extension of Barauni Super Critical Coal Fired Thermal Power Station at Barauni, Bihar. M/s. STEAG Energy Services (India) Pvt. Ltd.
Appendix-C : Plate 1 of 3Project No. 215081-II

Site Photographs
Photo: 4 Borehole No. BH-P4
Photo: 3 Borehole No. BH-P3
Extension of Barauni Super Critical Coal Fired Thermal Power Station at Barauni, Bihar. M/s. STEAG Energy Services (India) Pvt. Ltd.
Appendix-C : Plate 2 of 3Project No. 215081-II

Photo: 5 Borehole No. BH-P5
Site Photographs
Extension of Barauni Super Critical Coal Fired Thermal Power Station at Barauni, Bihar. M/s. STEAG Energy Services (India) Pvt. Ltd.
Appendix-C : Plate 3 of 3Project No. 215081-II

GEOTECHNICAL INVESTIGATION REPORT (VOLUME-3)
FOR
RAW WATER INTAKE AREA
RELATED TO
THE PREPARATORY SURVEY FOR
CONSTRUCTION OF
BARAUNI SUPER CRITICAL COAL FIRED
THERMAL POWER STATION
(UNIT#10)
OF
BIHAR STATE POWER GENERATION COMPANY LTD.
CONSULTANT
STEAG Energy Services India Pvt. Ltd. (Formerly Evonik Energy Services India Ltd.)
(A wholly owned subsidiary of Steag Energy Services GmbH, Germany) A-29, Sector-16, NOIDA-201301, India

Page 2 of 14
TABLE OF CONTENTS Sheet No.
1.0 INTRODUCTION 4 1.1 Project Description 4 1.2 Purposes of Study 4 1.3 Report Format 4 1.4 Scope of Geotechnical Investigations covered in this Report (Raw water Intake) 5
2.0 FIELD INVESTIGATIONS 5 2.1 Soil Boring 5 2.2 Groundwater 6
3.0 LABORATORY TESTS 6 4.0 GENERAL SITE CONDITIONS 6
4.1 Site Details 6 4.2 Regional Geology 6 4.3 Site Stratigraphy 7 4.4 Groundwater 7
5.0 LIQUEFACTION SUSCEPTIBILITY ASSESSMENT 7 5.1 Detailed Liquefaction Analysis as per NCEER Approach 7 5.1.1 Introduction 7
5.1.2 Calculation of Cyclic Stress Ratio (CSR) 8 5.1.3 Calculation of Cyclic Resistance Ratio (CRR) based on SPT Values 9
5.2 Results of Detailed Liquefaction Studies 10 6.0 FOUNDATION ANALYSIS AND RECOMMENDATIONS 10
6.1 General 10 6.2 Foundation Type and Depth 10 6.3 Concept for Well Foundation Analysis 11 6.4 Design Soil Parameters 11 6.5 Recommended Gross Allowable Bearing Pressures 12 6.6 Definition of Gross and Net Bearing Pressure 12
7.0 FOUNDATION CONSTRUCTION CONSIDERATION 13 7.1 Fill Placement and Compaction 13 7.2 Chemical Attack 13
8.0 VARIABILITY IN SUB-SURFACE CONDITIONS 14

Page 3 of 14
LIST OF ILLUSTRATIONS
Caption Plate Layout Plan 1 Satellite Image of Site and Test Locations 2 Engineering Description of Soils 3 Uncertainty in Laboratory Measurements 4 Soil Profiles 5 to 19 Summary of Borehole Profiles 20 Standard Penetration Test Results 21 & 22 Grain Size Analysis 23 to 28 Shear Test Results 29 to 31 Chemical Test Results 32
Appendix A: Liquefaction Susceptibility Assessment Appendix B: Typical Calculations Appendix C: Site Photographs
-------------------------------------------------------
DEFINITION OF ACRONYMS USL United Spirit Limited UTM Universal Transverse Mercator coordinates system NABL National Accreditation Board for Testing and Calibration Laboratories ISO International Standards Organization BIS Bureau of Indian Standards EGL Existing Ground Level NGL Natural Ground Level RL Reduced Level SPT Standard Penetration Test NCEER National Center for Earthquake Engineering Research UUT Unconsolidated undrained triaxial shear test DS Consolidated drained direct shear test BIS REFERENCES
Compendium of Indian Standard on Soil Engineering (Part-2, Field Testing of Soils for Civil Engineering Purposes), SP36 (Part-2:1988)-RA 2006
Compendium of Indian Standard on Soil Engineering (Part-1, Laboratory Testing of Soils for Civil Engineering Purposes), SP36 (Part-1:1987)-RA 2006.

Page 4 of 14
1.0 INTRODUCTION
1.1 Project Description
Japan International Cooperation Agency (JICA) has appointed Kyushu Electric Power Co. Inc. as a consultant, to conduct the preparatory survey for construction of the Barauni Super Critical Coal Fired Thermal Power Station. Kyushu Electric Power Co. INC has appointed M/s. STEAG Energy Services (India) Pvt. Ltd for the preparatory survey work for the project.
This report volume (Volume-III) presents field and laboratory test results along with our
geotechnical recommendations for the Raw Water Intake area. Two accompanying volumes present results of the geotechnical investigation for the Ash Pond area (Volume-I) & for the Powerhouse facilities area (Volume-II).
1.2 Purposes of Study
The overall purposes of this study are to investigate the stratigraphy at the site, and to develop
geotechnical recommendations for design and construction of foundations for the Ash Pond, Powerhouse and the Raw Water Intake structure.
To accomplish these purposes, the study was conducted in the following phases:
(i) drilling 8 boreholes to 20 m depth in the Ash Pond area, in order to evaluate the stratigraphy, and to collect soil and groundwater samples for laboratory testing;
(ii) performing seventy three (73) field permeability tests in the Ash Pond area at eight (8) borehole
locations to assess the in-situ coefficient of permeability of the strata; (iii) drilling 6 boreholes to 40 m depth in the Powerhouse area in order to evaluate the stratigraphy,
and to collect soil and groundwater samples for laboratory testing;
(iv) drilling 3 boreholes to 50 m depth at the Raw Water Intake location in order to evaluate the stratigraphy, and to collect soil and groundwater samples for laboratory testing;
(v) testing selected soil and groundwater samples in the laboratory to determine pertinent index and
engineering properties; and
(vi) analyzing all field and laboratory data to develop geotechnical recommendations for foundations.
This geotechnical investigation for the raw water intake structure has been done adjacent to the
River Ganga flowing in the vicinity of the power plant.
1.3 Report Format This report is presented in three volumes. The scope of work included in each volume is as
described below:
Report Volume Proposed Structures Scope of Work
Volume-I Ash Pond Eight (8) Boreholes Seventy three (73) field permeability tests
Volume-II Powerhouse Six (6) Boreholes Volume-III Raw Water Intake Three (3) Boreholes

Page 5 of 14
This volume, designated as Volume-III, includes field and laboratory data together with our
engineering recommendations for the proposed Raw Water Intake area. The initial sections of this volume of the report present brief descriptions of the field procedures
together with a list of various laboratory tests conducted. General site conditions, including geology and stratigraphy along the cross bridge alignment, are then presented. This is followed by our foundation analysis and recommendations.
Plates of soil profiles and various laboratory tests follow the report text. The illustrations section
includes a site plan, graphical plots of various field and laboratory test results, summary of borehole profiles, sectional profiles and other related sketches.
1.4 Scope of Geotechnical Investigations covered in this Report (Raw water Intake)
Details of boreholes drilled on site are as follows:
UTM Coordinates, m Sr. No.
Borehole Designation Easting Northing
Existing Ground Leve (RL), m
Borehole Termination Depth, m
1 BH-1 399001.29 2808360.28 38.838 50.17 2 BH-2 399026.35 2808311.37 38.231 50.18 3 BH-3 399055.13 2808256.66 38.246 50.20
• A layout plan illustrating the various test locations covered in this report volume are presented on Plate 1.
• The test locations were given to us on the ground by the client representatives at site. The locations
were marked were marked on Google earth and a satellite image illustrating the approximate test locations (as given to us) is presented on Plate 2.
2.0 FIELD INVESTIGATIONS
2.1 Soil Boring The borings were progressed using a shell and auger to the specified depth. The diameter of
the borehole was 150 mm. Casing was used for advancing boring below water table at all borehole locations. The work was in general accordance with IS: 1892-1979.
Standard Penetration Tests (SPT) were conducted in the boreholes at 1.0 m depth interval. The
test was conducted by connecting a split spoon sampler to ‘A’ rods and driving it by 45 cm using a 63.5 kg hammer falling freely from a height of 75 cm. The tests were conducted in accordance with IS: 2131-1981.
The number of blows for each 15 cm of penetration of the split spoon sampler was recorded. The blows required to penetrate the initial 15 cm of the split spoon for seating the sampler is ignored due to the possible presence of loose materials or cuttings from the drilling operation. Where refusal (N>100) to further penetration of the split spoon sampler is encountered in the first 15 cm seating penetration itself, SPT test could not be completed and "Ref" is indicated in the bore logs, along with the penetration achieved. The ‘N’ values are presented on the soil profile for each borehole.
Disturbed samples were collected from the split spoon after conducting SPT. The samples were preserved in transparent polythene bags. Undisturbed samples were collected by attaching 75 mm diameter thin walled `Shelby’ tubes and driving the sampler using a 63.5 kg hammer in accordance with
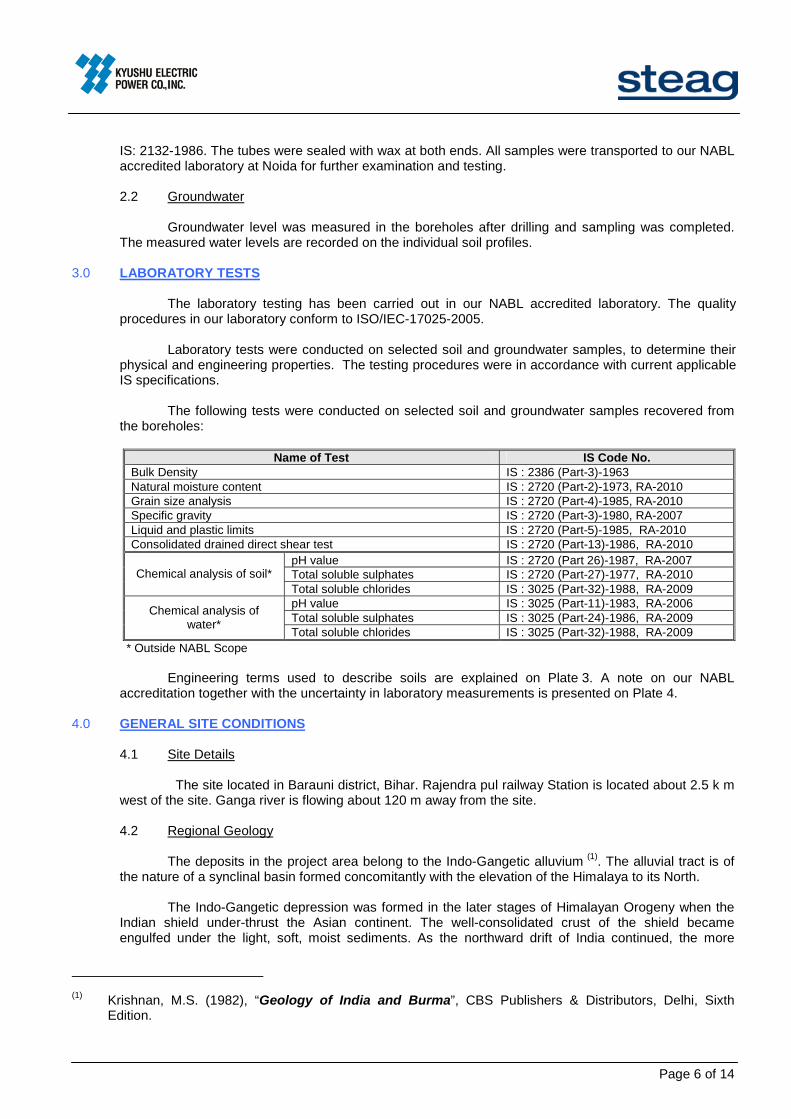
Page 6 of 14
IS: 2132-1986. The tubes were sealed with wax at both ends. All samples were transported to our NABL accredited laboratory at Noida for further examination and testing.
2.2 Groundwater
Groundwater level was measured in the boreholes after drilling and sampling was completed.
The measured water levels are recorded on the individual soil profiles. 3.0 LABORATORY TESTS
The laboratory testing has been carried out in our NABL accredited laboratory. The quality
procedures in our laboratory conform to ISO/IEC-17025-2005.
Laboratory tests were conducted on selected soil and groundwater samples, to determine their physical and engineering properties. The testing procedures were in accordance with current applicable IS specifications.
The following tests were conducted on selected soil and groundwater samples recovered from
the boreholes:
Name of Test IS Code No. Bulk Density IS : 2386 (Part-3)-1963 Natural moisture content IS : 2720 (Part-2)-1973, RA-2010 Grain size analysis IS : 2720 (Part-4)-1985, RA-2010 Specific gravity IS : 2720 (Part-3)-1980, RA-2007 Liquid and plastic limits IS : 2720 (Part-5)-1985, RA-2010 Consolidated drained direct shear test IS : 2720 (Part-13)-1986, RA-2010
pH value IS : 2720 (Part 26)-1987, RA-2007 Total soluble sulphates IS : 2720 (Part-27)-1977, RA-2010 Chemical analysis of soil* Total soluble chlorides IS : 3025 (Part-32)-1988, RA-2009 pH value IS : 3025 (Part-11)-1983, RA-2006 Total soluble sulphates IS : 3025 (Part-24)-1986, RA-2009 Chemical analysis of
water* Total soluble chlorides IS : 3025 (Part-32)-1988, RA-2009 * Outside NABL Scope
Engineering terms used to describe soils are explained on Plate 3. A note on our NABL
accreditation together with the uncertainty in laboratory measurements is presented on Plate 4. 4.0 GENERAL SITE CONDITIONS
4.1 Site Details
The site located in Barauni district, Bihar. Rajendra pul railway Station is located about 2.5 k m west of the site. Ganga river is flowing about 120 m away from the site.
4.2 Regional Geology
The deposits in the project area belong to the Indo-Gangetic alluvium (1). The alluvial tract is of
the nature of a synclinal basin formed concomitantly with the elevation of the Himalaya to its North. The Indo-Gangetic depression was formed in the later stages of Himalayan Orogeny when the
Indian shield under-thrust the Asian continent. The well-consolidated crust of the shield became engulfed under the light, soft, moist sediments. As the northward drift of India continued, the more
(1) Krishnan, M.S. (1982), “Geology of India and Burma”, CBS Publishers & Distributors, Delhi, Sixth
Edition.

Page 7 of 14
consolidated and metamorphosed older strata and the granitic magmas intrusive into them slid southwards, impelled partly by gravity and partly by compressive force.
The Pleistocene and recent deposits covering the Indo-Gangetic Basin are upto 1,000 m thick.
They are composed of gravels, sands and clays with remains of animals and plants. The older alluvium (called Bhangar) is rather dark colored and generally rich in concretions and
nodules of impure calcium carbonate (kankar). It is of Middle to Upper Pleistocene age. The Newer alluvium (called Khadar) is light colored and poor in calcareous matter. It contains
lenticular beds of sand and gravel and peat beds. It merges by insensible gradations into the recent or deltaic alluvia and should be assigned an Upper Pleistocene to Recent age.
4.3 Site Stratigraphy
The stratigraphy at site may be divided into two (2) generalized strata as described below: Stratum – I (Stiff to firm clayey silt): A stiff to firm surficial clayey silt layer is present all over the site to about 1.0-1.5 m depth (RL 36.7-37.8 m). Stratum – II (Loose to very dense silty fine sand / fine sand): Stratum-II consists of loose to very dense silty fine sand / fine sand to the maximum explored depth of 50 m (RL -12 m). SPT values in this stratum range from 5 to 16 to about 13-15 m depth (RL 23.2-25.2 m), indicating loose to medium dense soil conditions. SPT values range from 28 to 66 to about 26.5 m depth (RL 11.7 m). Below this, SPT values in this stratum range from 73 to 100+ (refusal) to about 30 m depth (RL 8.2 m). Below this, refusal (N >100) is encountered.
However in between 6.5 to 7.5 m depth, SPT value at this level is low at all three borehole locations suggesting that a loose zone (probably due to erosion of river in the past). We suggest that during the detailed investigation stage, static cone penetration tests also be done to reconfirm this loose zone.
In stratum-II, bulk density values range from 1.79 g/cm3 to 1.86 g/cm3 and moisture content values range from 24 % to 25 % to about 3.0 m depth (RL 35.2 m).
Detailed description of the soil encountered at the borehole locations are presented on the
individual soil profiles in Plate 5 to 19. A pictorial summary of the borehole profiles is illustrated on Plate 20. Plots of field and corrected SPT values versus depth are presented on Plate 21 & 22.
4.4 Groundwater
Based on the field data of three (3) completed boreholes, groundwater was met at 3.0-3.1 m depth during the period of our field investigation (July, 2015). Fluctuations may occur in the measured water levels due to seasonal variations in rainfall and surface evaporation rates as well as flow of water in the Ganga River.
5.0 LIQUEFACTION SUSCEPTIBILITY ASSESSMENT
5.1 Detailed Liquefaction Analysis as per NCEER Approach
5.1.1 Introduction
For a better evaluation of the liquefaction potential at the project site, a detailed analysis has been done as per standard procedures given in published literature. The methodology based on the
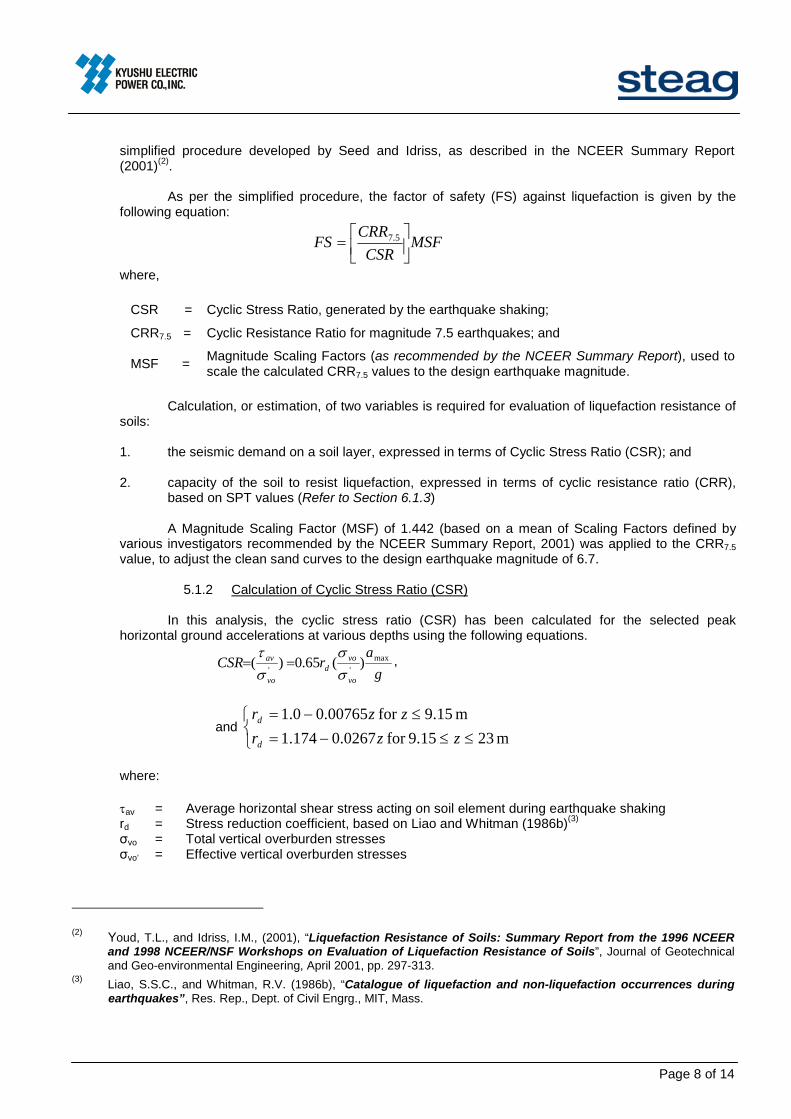
Page 8 of 14
simplified procedure developed by Seed and Idriss, as described in the NCEER Summary Report (2001)(2).
As per the simplified procedure, the factor of safety (FS) against liquefaction is given by the
following equation: MSF
CSRCRR
FS ⎥⎦⎤
⎢⎣⎡= 5.7
where,
CSR = Cyclic Stress Ratio, generated by the earthquake shaking; CRR7.5 = Cyclic Resistance Ratio for magnitude 7.5 earthquakes; and MSF = Magnitude Scaling Factors (as recommended by the NCEER Summary Report), used to
scale the calculated CRR7.5 values to the design earthquake magnitude. Calculation, or estimation, of two variables is required for evaluation of liquefaction resistance of
soils: 1. the seismic demand on a soil layer, expressed in terms of Cyclic Stress Ratio (CSR); and 2. capacity of the soil to resist liquefaction, expressed in terms of cyclic resistance ratio (CRR),
based on SPT values (Refer to Section 6.1.3)
A Magnitude Scaling Factor (MSF) of 1.442 (based on a mean of Scaling Factors defined by various investigators recommended by the NCEER Summary Report, 2001) was applied to the CRR7.5 value, to adjust the clean sand curves to the design earthquake magnitude of 6.7.
5.1.2 Calculation of Cyclic Stress Ratio (CSR)
In this analysis, the cyclic stress ratio (CSR) has been calculated for the selected peak
horizontal ground accelerations at various depths using the following equations.
ga
rCSRvo
vod
vo
av max'' )(65.0)(
σσ
στ
== ,
and ⎩⎨⎧
≤≤−=≤−=
m 239.15for 0267.0174.1m 15.9for 00765.00.1zzr
zzr
d
d
where: τav
= Average horizontal shear stress acting on soil element during earthquake shaking rd = Stress reduction coefficient, based on Liao and Whitman (1986b)(3)
σvo = Total vertical overburden stresses σvo’ = Effective vertical overburden stresses
(2) Youd, T.L., and Idriss, I.M., (2001), “Liquefaction Resistance of Soils: Summary Report from the 1996 NCEER
and 1998 NCEER/NSF Workshops on Evaluation of Liquefaction Resistance of Soils”, Journal of Geotechnical and Geo-environmental Engineering, April 2001, pp. 297-313.
(3) Liao, S.S.C., and Whitman, R.V. (1986b), “Catalogue of liquefaction and non-liquefaction occurrences during earthquakes”, Res. Rep., Dept. of Civil Engrg., MIT, Mass.
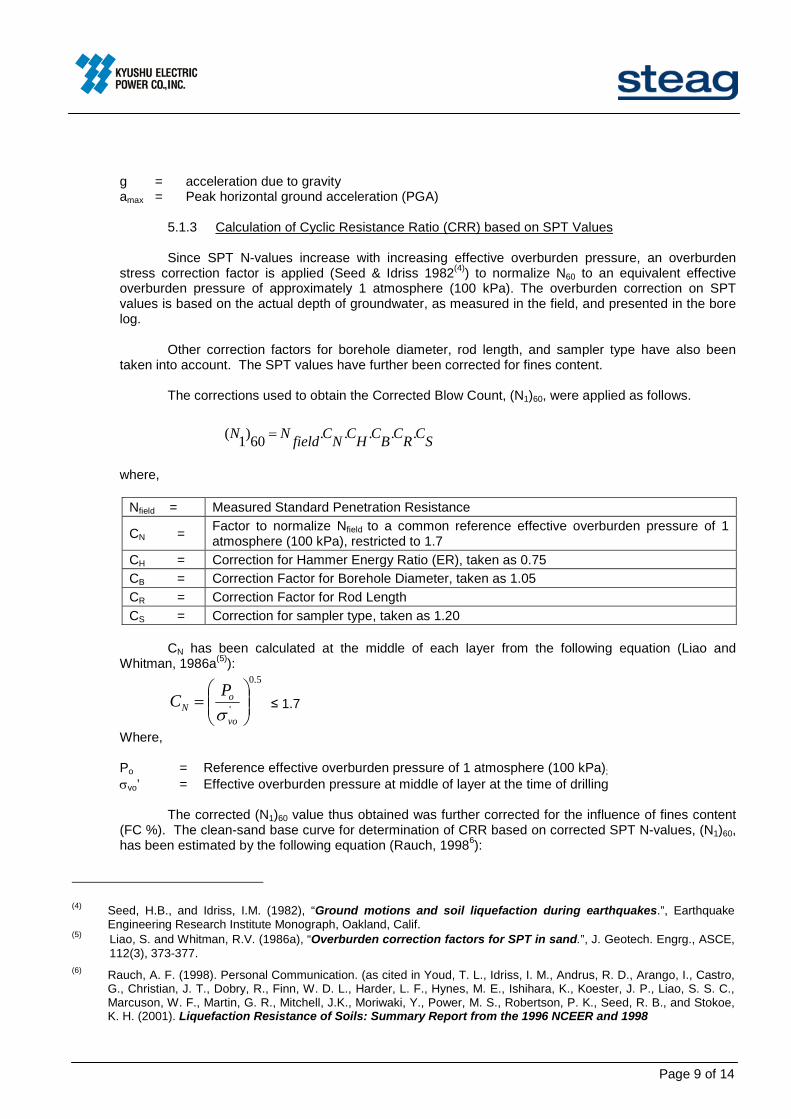
Page 9 of 14
g = acceleration due to gravity amax = Peak horizontal ground acceleration (PGA)
5.1.3 Calculation of Cyclic Resistance Ratio (CRR) based on SPT Values Since SPT N-values increase with increasing effective overburden pressure, an overburden
stress correction factor is applied (Seed & Idriss 1982(4)) to normalize N60 to an equivalent effective overburden pressure of approximately 1 atmosphere (100 kPa). The overburden correction on SPT values is based on the actual depth of groundwater, as measured in the field, and presented in the bore log.
Other correction factors for borehole diameter, rod length, and sampler type have also been
taken into account. The SPT values have further been corrected for fines content. The corrections used to obtain the Corrected Blow Count, (N1)60, were applied as follows.
(N1)60 = N field.CN .CH .CB.CR.CS
where,
Nfield = Measured Standard Penetration Resistance CN = Factor to normalize Nfield to a common reference effective overburden pressure of 1
atmosphere (100 kPa), restricted to 1.7 CH = Correction for Hammer Energy Ratio (ER), taken as 0.75 CB = Correction Factor for Borehole Diameter, taken as 1.05 CR = Correction Factor for Rod Length CS = Correction for sampler type, taken as 1.20
CN has been calculated at the middle of each layer from the following equation (Liao and
Whitman, 1986a(5)): 5.0
' ⎟⎟⎠
⎞⎜⎜⎝
⎛=
vo
oN
PCσ
≤ 1.7
Where,
Po = Reference effective overburden pressure of 1 atmosphere (100 kPa); σvo’ = Effective overburden pressure at middle of layer at the time of drilling
The corrected (N1)60 value thus obtained was further corrected for the influence of fines content
(FC %). The clean-sand base curve for determination of CRR based on corrected SPT N-values, (N1)60, has been estimated by the following equation (Rauch, 19986):
(4) Seed, H.B., and Idriss, I.M. (1982), “Ground motions and soil liquefaction during earthquakes.”, Earthquake
Engineering Research Institute Monograph, Oakland, Calif. (5) Liao, S. and Whitman, R.V. (1986a), “Overburden correction factors for SPT in sand.”, J. Geotech. Engrg., ASCE,
112(3), 373-377. (6) Rauch, A. F. (1998). Personal Communication. (as cited in Youd, T. L., Idriss, I. M., Andrus, R. D., Arango, I., Castro,
G., Christian, J. T., Dobry, R., Finn, W. D. L., Harder, L. F., Hynes, M. E., Ishihara, K., Koester, J. P., Liao, S. S. C., Marcuson, W. F., Martin, G. R., Mitchell, J.K., Moriwaki, Y., Power, M. S., Robertson, P. K., Seed, R. B., and Stokoe, K. H. (2001). Liquefaction Resistance of Soils: Summary Report from the 1996 NCEER and 1998

Page 10 of 14
5.2 Results of Detailed Liquefaction Studies
For the liquefaction analysis, the design earthquake magnitude has been taken as 6.7 on the Ritchter scale for Zone IV. The peak ground acceleration has been considered as equal to 0.24g. The results of the analysis are presented below:
Sr. No. Borehole No. Liquefaction Potential Susceptibility 1 BH-1 Liquefaction potential to 9.0 m depth (RL 29.8 m) 2 BH-2 Liquefaction potential to 12.5 m depth (RL 25.7 m) 3 BH-3 Liquefaction potential to 10.0 m depth (RL 28.2 m)
For the purpose of design, we suggest that liquefaction be considered to 12.5 m depth (RL 25.7 m).
According to Fig.1 of IS: 1893 (Part1)-2002, RA-2005 showing seismic zones the proposed site falls on earthquake Zone-IV. Therefore design should be done considering the earthquake parameters for Zone-IV.
6.0 FOUNDATION ANALYSIS AND RECOMMENDATIONS 6.1 General
A suitable foundation for any structure should have an adequate factor of safety against exceeding the bearing capacity of the supporting soils. Also the vertical movements due to compression of the soils should be within tolerable limits for the structure. We consider that foundations designed in accordance with the recommendations herein will satisfy these criteria.
6.2 Foundation Type and Depth
The following points are highlighted with reference to the well foundations:
1. As per the information provided to us, well foundations are being planned at the project site to support the structural loads of the proposed Intake well.
2. Diameter or size of well, shape of well and foundation depth of well etc were not finalized at the
time of this report preparation.
3. Hydrological details and maximum scour depth were not provided to us at the time of this report preparation. As suggested by Steag, we have considered the maximum scour depth at 20 m depth (RL 18.2 m).
4. Our recommended safe net and gross allowable bearing pressures for well foundation are
presented in Section 6.5.
5. The minimum depth of the well should be decided as per the required grip length below the maximum scour level. For initial analysis, the minimum well depth has been considered as 30 m below EGL (RL 8.2 m).
As conveyed to us, sedimentation tank shall be constructed on a 20 m thick fill. Prior to
placement of fill, the exposed soils at ground level should be watered and compacted by several passes of a 10 ton roller. The fill should be placed in layers and compacted thoroughly as given in Section 8.1 of this report. Detailed testing including boreholes and static cone penetration tests should be performed to assess the safe bearing capacity of the fill.

Page 11 of 14
6.3 Concept for Well Foundation Analysis
The bearing capacity equation used for analyzing well foundation is as follows:
qgross safe = 1 [cNc ζc dc + pNq ζq dq + 0.5 Bϒ Nγζγ dγ Rw] F where : qgross safe = safe gross bearing capacity of soil based on the shear failure criterion. c = cohesion intercept φ = angle of internal friction ϒ = bulk unit weight of soil p = overburden pressure computed below the level of maximum scour Nc, Nq, Nγ = Bearing capacity factors which are a function of φ. Rw = water table correction factor, taken as 0.5 for submerged condition F = Factor of safety ζc, ζq, ζγ = Shape factors for circular wells, ζc =1.3 ζq=1.2 ζγ = 0.6
dc, dq, dγ = Depth factors (computed below level of maximum scour) For φ <10, dc = 1+ 0.2 tan (45+ φ /2) D/B, dq = dγ = 1 For φ ≥10, dq = dγ = 1 + 0.1 tan (45 + φ /2) D/B Settlement analysis has been performed as per IS 8009 (Parts 1 & 2). As per IS 1904, the
tolerable total settlement is taken as 50 mm. Since dense sand is met at or below well tip, consolidation settlement is not likely to occur. The total settlement is equal to the immediate settlement.
The immediate settlement has been computed using the following equation [Clause 9.2.3 of IS 8009 Part 1-1976] as per the procedure given by Bowles(7). where :
Si = immediate (elastic) settlement B = foundation width, B’ = B/2 μ = Poisson’s ratio q = applied bearing pressure E = modulus of elasticity df = depth factor dr = rigidity factor I = influence factor at corner of rectangular loaded area (B’ x L’)
6.4 Design Soil Parameters
Reviewing the soil characteristics, the following soil parameters have been selected for foundation analysis:
(7) Bowles, J.E. (1996), “Foundation Analysis and Design”, International Edition, pp. 303-317.
rfi dIdE
qBS )1('2
μ−=
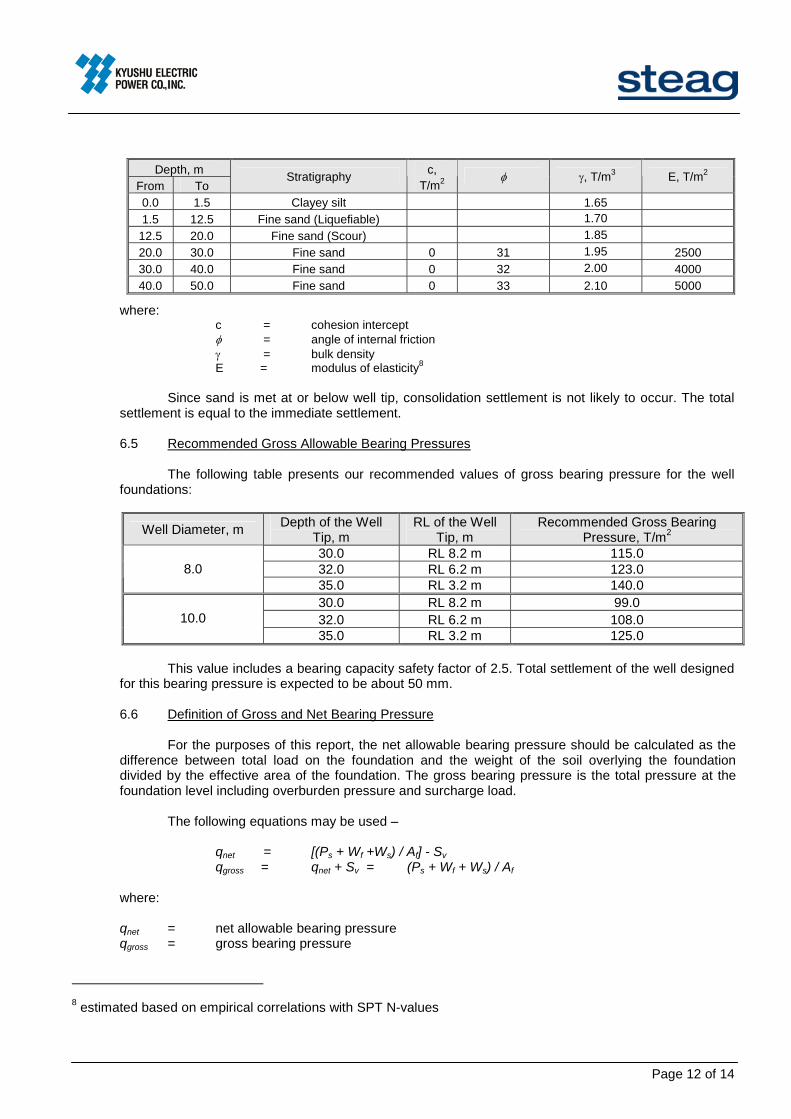
Page 12 of 14
Depth, m
From To Stratigraphy c, T/m2 φ γ, T/m3 E, T/m2
0.0 1.5 Clayey silt 1.65 1.5 12.5 Fine sand (Liquefiable) 1.70
12.5 20.0 Fine sand (Scour) 1.85 20.0 30.0 Fine sand 0 31 1.95 2500 30.0 40.0 Fine sand 0 32 2.00 4000 40.0 50.0 Fine sand 0 33 2.10 5000
where: c = cohesion intercept φ = angle of internal friction γ = bulk density E = modulus of elasticity8
Since sand is met at or below well tip, consolidation settlement is not likely to occur. The total
settlement is equal to the immediate settlement.
6.5 Recommended Gross Allowable Bearing Pressures The following table presents our recommended values of gross bearing pressure for the well
foundations:
Well Diameter, m Depth of the Well Tip, m
RL of the Well Tip, m
Recommended Gross Bearing Pressure, T/m2
30.0 RL 8.2 m 115.0 32.0 RL 6.2 m 123.0 8.0 35.0 RL 3.2 m 140.0 30.0 RL 8.2 m 99.0 32.0 RL 6.2 m 108.0 10.0 35.0 RL 3.2 m 125.0
This value includes a bearing capacity safety factor of 2.5. Total settlement of the well designed
for this bearing pressure is expected to be about 50 mm.
6.6 Definition of Gross and Net Bearing Pressure For the purposes of this report, the net allowable bearing pressure should be calculated as the
difference between total load on the foundation and the weight of the soil overlying the foundation divided by the effective area of the foundation. The gross bearing pressure is the total pressure at the foundation level including overburden pressure and surcharge load.
The following equations may be used –
qnet = [(Ps + Wf +Ws) / Af] - Sv qgross = qnet + Sv = (Ps + Wf + Ws) / Af
where: qnet = net allowable bearing pressure qgross = gross bearing pressure
8 estimated based on empirical correlations with SPT N-values

Page 13 of 14
Ps = superimposed static load on foundation Wf = weight of foundation Ws = weight of soil overlying foundation Af = effective area of foundation Sv = overburden pressure at foundation level prior to excavation for foundation.
It may please be noted that safe bearing pressures recommended in this report refer to “net
values”. Where filling is done, it should be treated as a surcharge over the foundation.
7.0 FOUNDATION CONSTRUCTION CONSIDERATION
7.1 Fill Placement and Compaction
Structural fill is defined as fill that is placed in areas of built up areas, above foundations, behind retaining walls, and beneath roads. General fill refers to fill that is placed in open areas to raise site grades and in landscaped areas that does not experience any load.
The natural soils at site are suitable for use as structural fill. However, close control of moisture
content and compactive effort is required to ensure adequate compaction. Sand / silty sand is a suitable fill material. Alternatively, good earth should be used as fill
material. Alternatively, good earth should be used as fill material. Good earth (silty sand or sandy silt of low plasticity) used as structural fill should contain less than 5 percent gravel and at least 30 percent sand sized particles. It should have a liquid limit of less than 35 percent and plasticity index material less than 8 percent. Sand may also be used as fill material.
In open areas, the fill may be placed in layers not exceeding 30 cm in thickness. In confined
areas, the layer thickness should be restricted to 15 cm. Structural fill placed in building areas and behind retaining walls should be placed at a moisture
content equal to ± 1 percent of the optimum moisture content. Compaction should be done to at least 95% of the maximum dry density determined in accordance with IS: 2720 Part 7 (Standard Proctor Compaction Test).
Fill under roads should be compacted to at least 95% of the maximum dry density (Modified
Proctor Compaction Test, IS: 2720 Part-8). The road may be designed on the basis of soaked CBR tests on specimen compacted to 95% of MDD.
General fill should be placed in layers not exceeding 40 to 50 cm in thickness and should be
compacted adequately. It should be ensured that the fill does not settle under local traffic loads or water seepage.
Permanent slopes in areas outside constructed areas should not be steeper than 1-vertical on
2.5 horizontal. In the area adjacent to the river, adequate slope protection should be done by provision of stone riprap or geotextiles. Compaction along man-made slopes should be done to at least 90 percent of the maximum dry density (IS: 2720 Part-7).
7.2 Chemical Attack
Results of chemical test on selected soil and water samples are presented on Plate 32. The
results indicate that the soils contain 0.11-0.12 percent sulphates and 0.03-0.09 percent chlorides. The groundwater contains 318-331mg / litre of sulphates and 75-102 mg / litre of chlorides. The pH value of soil is 7.5-7.9 and that of groundwater is 7.2, indicating nearly neutral condition.
IS: 456-2000 recommends that precautions should be taken against chemical degradation of
concrete if
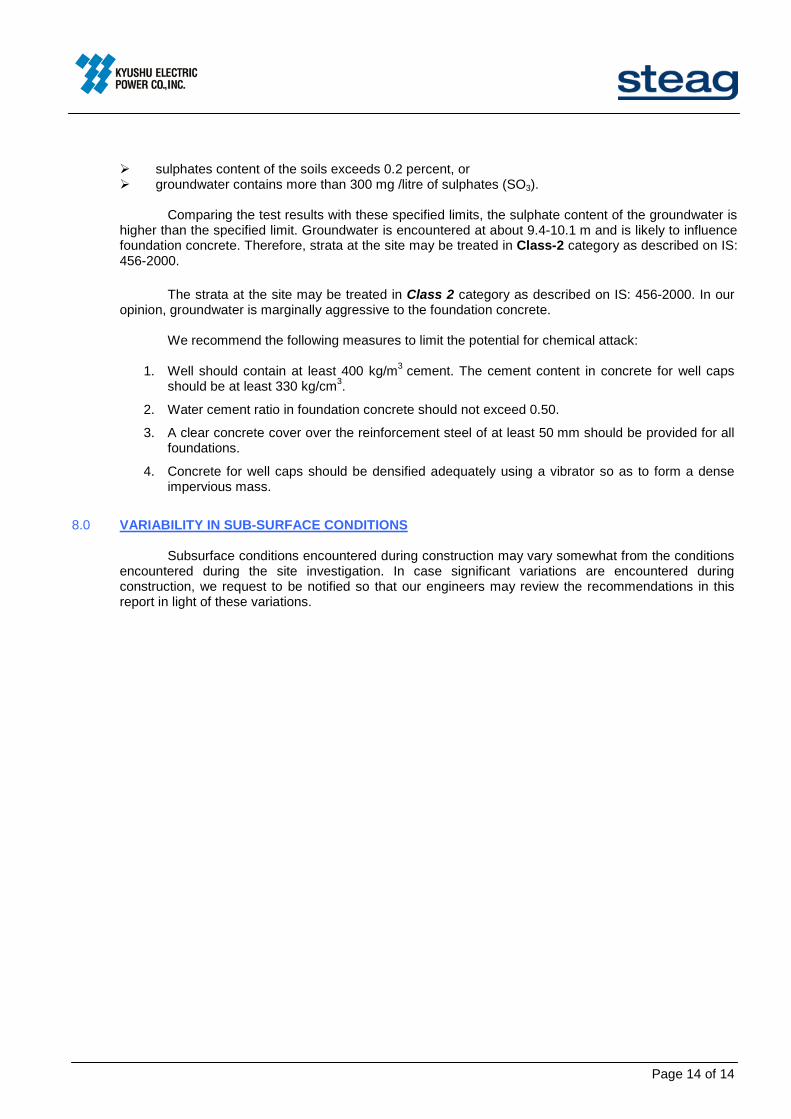
Page 14 of 14
sulphates content of the soils exceeds 0.2 percent, or groundwater contains more than 300 mg /litre of sulphates (SO3).
Comparing the test results with these specified limits, the sulphate content of the groundwater is
higher than the specified limit. Groundwater is encountered at about 9.4-10.1 m and is likely to influence foundation concrete. Therefore, strata at the site may be treated in Class-2 category as described on IS: 456-2000.
The strata at the site may be treated in Class 2 category as described on IS: 456-2000. In our
opinion, groundwater is marginally aggressive to the foundation concrete. We recommend the following measures to limit the potential for chemical attack:
1. Well should contain at least 400 kg/m3 cement. The cement content in concrete for well caps
should be at least 330 kg/cm3. 2. Water cement ratio in foundation concrete should not exceed 0.50. 3. A clear concrete cover over the reinforcement steel of at least 50 mm should be provided for all
foundations. 4. Concrete for well caps should be densified adequately using a vibrator so as to form a dense
impervious mass. 8.0 VARIABILITY IN SUB-SURFACE CONDITIONS
Subsurface conditions encountered during construction may vary somewhat from the conditions encountered during the site investigation. In case significant variations are encountered during construction, we request to be notified so that our engineers may review the recommendations in this report in light of these variations.

Location: Intake WellPlan of Field Investigations
SYMBOL TYPE OF TEST
Borehole (BH)
L E G E N D
BH-1
BH-2
BH-3
N
Geotechnical Investigation for XU-3 at HWP Manuguru Distt. Khammam, Telangana M/s. Heavy Water Board
Plate 1 of 32Plate 1 of 32Project No. 215081-III

Satellite image taken from Google Earth ®
Test Locations marked as per GPS coordinates taken on site using hand-held Garmin ® deviceAccuracy of hand-held GPS device generally ranges from 4-6m, and varies depending on the availability of satellite connection at the site
Location: Intake WellSatellite Image of Site and Test Locations
N
Geotechnical Investigation for XU-3 at HWP Manuguru Distt. Khammam, Telangana M/s. Heavy Water Board
Plate 2 of 32Plate 2 of 32Project No. 215081-III

SPT (N) Value
SPT (N) Value
0 to 2
2 to 4
4 to 8
8 to 15
15 to 30
> 30
Degree of Expansion
Low
Medium
High
Very High
35 - 50
20 - 35
Liquid Limit
< 15
15 -30
< 12
12 - 23
< 50
50 -100
100 - 200
> 200
30 - 60
Engineering Description of Soils
> 60
23 - 32
> 3270 - 90
50 - 70
Free Swell Percent
Degree of Expansion of Fine Grained Soils
> 2.0
Plasticity Index
Density Descriptor
Plasticity Chart
Static Cone Tip Resistance kg/sq.cm
Density Condition of Granular Soils
Degree of Severity
0.5 to 1.0
Hard
< 0.1
1.0 to 2.0
0.1 to 0.25
0.25 to 0.5
Shrinkage Index
Very Stiff
Stiff
Severe
Critical
Marginal
Non-critical
Plasticity of Clay
Plasticity Liquid Limit
Low Plastic
Medium Plastic
High Plastic
< 35
35 to 50
> 50
Consistency of Cohesive Soils
Firm/Medium
Soft
Consistency Cohesion Intercept, kg/sq.cm
Very SoftVery Loose
Loose
Medium Dense
Dense
Very dense
0 to 4
4 to 10
10 to 30
30 to 50
> 50
< 20
20 to 40
40 to 120
120 to 200
> 200
Geotechnical Investigation for XU-3 at HWP Manuguru Distt. Khammam, Telangana M/s. Heavy Water Board
Plate 3 of 32Plate 3 of 32Project No. 215081-III

NABL Accredited Laboratory Our laboratory is accredited to National Accreditation Board for Testing and Calibration Laboratories (NABL), New Delhi. The quality procedures in our laboratory conform to the International Standard ISO/IEC: 17025-2005. The accreditation assures our clients of work quality in conformance with international norms and practices. It authorizes us to use the NABL logo on test results. To maintain the necessary level of quality and reliability in all measurements on a continual basis, we indulge in the following:
Use of calibrated equipment, regular maintenance and good housekeeping are a part of our work culture.
Inter-laboratory comparison, proficiency testing and replicate testing, continuing education - ensure uniform quality of results.
Internal Audit of quality procedures is done by our qualified ISO 17025 auditors to maintain the requisite standards. NABL conducts external audit.
Uncertainty Every measurement entails an uncertainty. It is well known that no measuring instrument can determine the true value of any measurement. The cumulative effect of factors such as sensitivity of equipment, accuracy in calibration, human factors and environmental conditions will determine the overall uncertainty in the parameter determined from these measurements. As a part of our commitment to our clients, we have worked out the uncertainty in the parameters reported by our laboratory. Although this does not form a part of our contract agreement, we present below our statistical estimate of uncertainty of various parameters based on our most recent evaluation (Feb., 2015).
Test / Parameter Uncertainty* Test / Parameter Uncertainty*
Moisture Content 0.13 % Free Swell Index, % 2.0 %
Bulk & Dry Density 0.0015 g/cc Swell Pressure 0.43 % Specific Gravity 0.014 cc1 0.0003
Liquid Limit 0.27 % cc2 0.003 Plastic Limit 0.19 % mv 0.0003 cm2/kg
Shrinkage Limit 0.30 %
Consolidation
pc 0.15 kg/cm2 Unconfined
Compression c 0.079 kg/cm2 CD Direct Shear Test 0.29
c 0.42 % Coarse grained soils 0.6% of particle size
UU Triaxial Test 0.2 %
Soil Gradation Fine grained
soils 0.5% of particle size
MDD 0.03 g/cc Coefficient of Permeability 1.3 % of value Std/Mod Proctor Compaction OMC 0.13 % Crushing
Strength 0.80 % of value
Laboratory CBR 0.57% Rock Point Load
Strength Index 0.04 % of value
* at 95 percent confidence level for coverage factor of 2
Uncertainty in Laboratory Measurements
Geotechnical Investigation for XU-3 at HWP Manuguru Distt. Khammam, Telangana M/s. Heavy Water Board
Plate 4 of 32Plate 4 of 32Project No. 215081-III

Location : Boring Method :UTM Coordinates : Casing Depth :
Boring Start :Boring Finish :
From
To Field
Value
, Nf
Corre
cted V
alue,
N" Grav
el (%
)
Sand
(%)
Silt (
%)
Clay
(%)
Liquid
(%)
Plasti
c (%
)Pla
sticit
y Ind
ex
(%)
Bulk
Dens
ity
(gms/c
m3 )Dr
y Den
sity
(gms/c
m3 )Mo
isture
Con
tent
(%)
Type
of Te
stCo
nfinin
g Pr
essu
res,
(kg/cm
2)
Cohe
sion
Interc
ept, '
c' (kg
/cm2 )
Angle
of In
terna
l Fri
ction
,
(degre
es)
0.00 0.50 DS1 #N/A #N/A #N/A #N/A #N/A ### #N/A #N/A #N/A #N/A #N/A #N/A #N/A #N/A
0.50 1.00 DS2 #N/A 1.00 0 4 2.89 39.6 23.1 16.5 #N/A #N/A #N/A #N/A #N/A #N/A #N/A
1.00 1.45 SPT1 5 7 #N/A #N/A #N/A #N/A ### #N/A #N/A #N/A #N/A #N/A #N/A #N/A #N/A
2.00 2.45 SPT2 9 11 #N/A #N/A #N/A #N/A ### #N/A #N/A #N/A #N/A #N/A #N/A #N/A #N/A
3.00 3.30 UDS1 #N/A 0 97 3 0 0.82 ### #N/A 1.86 1.49 25.3 #N/A DS 0.5 ,1, 1.5 0.0 31.1
4.00 4.45 SPT3 9 10 #N/A #N/A #N/A #N/A ### #N/A #N/A #N/A #N/A #N/A #N/A #N/A #N/A
5.00 5.45 SPT4 33 36 #N/A #N/A #N/A #N/A ### #N/A #N/A #N/A #N/A #N/A #N/A #N/A #N/A
6.00 6.45 SPT5 42 45 #N/A #N/A #N/A #N/A ### #N/A #N/A #N/A 2.65 #N/A #N/A #N/A #N/A
7.00 7.45 SPT6 4 4 8.00 #N/A #N/A #N/A #N/A ### #N/A #N/A #N/A #N/A #N/A #N/A #N/A #N/A
8.00 8.45 SPT7 14 14 0 57 40 3 0.56 ### #N/A #N/A #N/A #N/A #N/A #N/A #N/A #N/A
9.00 9.45 SPT8 30 30 #N/A #N/A #N/A #N/A ### #N/A #N/A #N/A #N/A #N/A #N/A #N/A #N/A
10.00 10.45 SPT9 30 29 11.00 #N/A #N/A #N/A #N/A ### #N/A #N/A #N/A #N/A #N/A #N/A #N/A #N/A
Grain Size Analysis
- loose, 7.0 to 8.0 m
- dense, 5.0 to 7.0 m
Firm brown grey clayey silt, medium plastic CI)
Soil Profile (BH-1)Shell & Auger49.3 m01-Jul-1506-Jul-15
Atterberg Limits
Depth
of St
rata,
(m)
SOIL DESCRIPTION
Spec
ific G
ravity
- loose, 1.0 to 5.0 m
Loose to dense grey fine sand (SP)
Medium dense grey silty fine sand (SM)
Depth, m
Samp
le No
.
SPT (1)
Symb
olSurface Elevation :
Termination Depth :
Silt F
actor
96
50.17 m (RL -11.3 m)
38.8 m3.2 mGround Water Depth :
Ground Water Level :
Intake Well399001.29m E, 2808360.28m N
Shear TestsDensity and Moisture35.688 m
(1) SPT is outside NABL scope.
Geotechnical Investigation for XU-3 at HWP Manuguru Distt. Khammam, Telangana M/s. Heavy Water Board
Plate 5 of 32Plate 5 of 32Project No. 215081-III

Location : Boring Method :UTM Coordinates : Casing Depth :
Boring Start :Boring Finish :
From
To Field
Value
, Nf
Corre
cted V
alue,
N" Grav
el (%
)
Sand
(%)
Silt (
%)
Clay
(%)
Liquid
(%)
Plasti
c (%
)Pla
sticit
y Ind
ex
(%)
Bulk
Dens
ity
(gms/c
m3 )Dr
y Den
sity
(gms/c
m3 )Mo
isture
Con
tent
(%)
Type
of Te
stCo
nfinin
g Pr
essu
res,
(kg/cm
2)
Cohe
sion
Interc
ept, '
c' (kg
/cm2 )
Angle
of In
terna
l Fri
ction
,
(degre
es)
Grain Size Analysis
Soil Profile (BH-1)Shell & Auger49.3 m01-Jul-1506-Jul-15
Atterberg Limits
Depth
of St
rata,
(m)
SOIL DESCRIPTION
Spec
ific G
ravity
Depth, m
Samp
le No
.
SPT (1)
Symb
olSurface Elevation :
Termination Depth :
Silt F
actor
50.17 m (RL -11.3 m)
38.8 m3.2 mGround Water Depth :
Ground Water Level :
Intake Well399001.29m E, 2808360.28m N
Shear TestsDensity and Moisture35.688 m
11.00 11.45 SPT10 31 29 #N/A #N/A #N/A #N/A ### #N/A #N/A #N/A #N/A #N/A #N/A #N/A #N/A
12.00 12.45 SPT11 68 63 #N/A #N/A #N/A #N/A ### #N/A #N/A #N/A #N/A #N/A #N/A #N/A #N/A
13.00 13.45 SPT12 69 62 0 98 2 0 1.13 ### #N/A #N/A #N/A #N/A #N/A #N/A #N/A #N/A
14.00 14.45 SPT13 82 72 #N/A #N/A #N/A #N/A ### #N/A #N/A #N/A #N/A #N/A #N/A #N/A #N/A
15.00 15.45 SPT14 79 68 #N/A #N/A #N/A #N/A ### #N/A #N/A #N/A #N/A #N/A #N/A #N/A #N/A
16.00 16.45 SPT15 85 72 #N/A #N/A #N/A #N/A ### #N/A #N/A #N/A #N/A #N/A #N/A #N/A #N/A
17.00 17.45 SPT16 79 66 #N/A #N/A #N/A #N/A ### #N/A #N/A #N/A #N/A #N/A #N/A #N/A #N/A
18.00 18.45 SPT17 74 60 #N/A #N/A #N/A #N/A ### #N/A #N/A #N/A #N/A #N/A #N/A #N/A #N/A
19.00 19.45 SPT18 66 53 2 95 3 0 1.20 ### #N/A #N/A #N/A #N/A #N/A #N/A #N/A #N/A
20.00 20.45 SPT19 61 48 #N/A #N/A #N/A #N/A ### #N/A #N/A #N/A #N/A #N/A #N/A #N/A #N/A
21.00 21.45 SPT20 55 42 #N/A #N/A #N/A #N/A ### #N/A #N/A #N/A #N/A #N/A #N/A #N/A #N/A
22.00 22.45 SPT21 54 41 #N/A #N/A #N/A #N/A ### #N/A #N/A #N/A #N/A #N/A #N/A #N/A #N/A
- with traces of gravel, 19.0 to 20.0 m
Dense to very dense grey fine sand (SP)
- dense, 11.0 to 12.0 m
- very dense, 12.0 to 23.0 m
(1) SPT is outside NABL scope.
Geotechnical Investigation for XU-3 at HWP Manuguru Distt. Khammam, Telangana M/s. Heavy Water Board
Plate 6 of 32Plate 6 of 32Project No. 215081-III

Location : Boring Method :UTM Coordinates : Casing Depth :
Boring Start :Boring Finish :
From
To Field
Value
, Nf
Corre
cted V
alue,
N" Grav
el (%
)
Sand
(%)
Silt (
%)
Clay
(%)
Liquid
(%)
Plasti
c (%
)Pla
sticit
y Ind
ex
(%)
Bulk
Dens
ity
(gms/c
m3 )Dr
y Den
sity
(gms/c
m3 )Mo
isture
Con
tent
(%)
Type
of Te
stCo
nfinin
g Pr
essu
res,
(kg/cm
2)
Cohe
sion
Interc
ept, '
c' (kg
/cm2 )
Angle
of In
terna
l Fri
ction
,
(degre
es)
Grain Size Analysis
Soil Profile (BH-1)Shell & Auger49.3 m01-Jul-1506-Jul-15
Atterberg Limits
Depth
of St
rata,
(m)
SOIL DESCRIPTION
Spec
ific G
ravity
Depth, m
Samp
le No
.
SPT (1)
Symb
olSurface Elevation :
Termination Depth :
Silt F
actor
50.17 m (RL -11.3 m)
38.8 m3.2 mGround Water Depth :
Ground Water Level :
Intake Well399001.29m E, 2808360.28m N
Shear TestsDensity and Moisture35.688 m
23.00 23.45 SPT22 56 41 #N/A #N/A #N/A #N/A ### #N/A #N/A #N/A #N/A #N/A #N/A #N/A #N/A
24.00 24.45 SPT23 55 40 #N/A #N/A #N/A #N/A ### #N/A #N/A #N/A #N/A #N/A #N/A #N/A #N/A
25.00 25.45 SPT24 62 44 #N/A #N/A #N/A #N/A ### #N/A #N/A #N/A #N/A #N/A #N/A #N/A #N/A
26.00 26.45 SPT25 59 41 0 97 3 0 0.99 ### #N/A #N/A #N/A #N/A #N/A #N/A #N/A #N/A
27.00 27.45 SPT26 73 50 #N/A #N/A #N/A #N/A ### #N/A #N/A #N/A #N/A #N/A #N/A #N/A #N/A
28.00 28.45 SPT27 86 58 #N/A #N/A #N/A #N/A ### #N/A #N/A #N/A #N/A #N/A #N/A #N/A #N/A
29.00 29.45 SPT28 102 68 #N/A #N/A #N/A #N/A ### #N/A #N/A #N/A #N/A #N/A #N/A #N/A #N/A
30.00 30.45 SPT29 101 66 #N/A #N/A #N/A #N/A ### #N/A #N/A #N/A #N/A #N/A #N/A #N/A #N/A
31.00 31.40 SPT30 101/ 25cm
101/ 25cm #N/A #N/A #N/A #N/A ### #N/A #N/A #N/A #N/A #N/A #N/A #N/A #N/A
32.00 32.41 SPT31 101/ 26cm
101/ 26cm #N/A #N/A #N/A #N/A ### #N/A #N/A #N/A #N/A #N/A #N/A #N/A #N/A
33.00 33.38 SPT32 102/ 23cm
102/ 23cm #N/A #N/A #N/A #N/A ### #N/A #N/A #N/A #N/A #N/A #N/A #N/A #N/A
34.00 34.37 SPT33 103/ 22cm
103/ 22cm #N/A #N/A #N/A #N/A ### #N/A #N/A #N/A #N/A #N/A #N/A #N/A #N/A
Very dense grey fine sand (SP)
(1) SPT is outside NABL scope.
Geotechnical Investigation for XU-3 at HWP Manuguru Distt. Khammam, Telangana M/s. Heavy Water Board
Plate 7 of 32Plate 7 of 32Project No. 215081-III

Location : Boring Method :UTM Coordinates : Casing Depth :
Boring Start :Boring Finish :
From
To Field
Value
, Nf
Corre
cted V
alue,
N" Grav
el (%
)
Sand
(%)
Silt (
%)
Clay
(%)
Liquid
(%)
Plasti
c (%
)Pla
sticit
y Ind
ex
(%)
Bulk
Dens
ity
(gms/c
m3 )Dr
y Den
sity
(gms/c
m3 )Mo
isture
Con
tent
(%)
Type
of Te
stCo
nfinin
g Pr
essu
res,
(kg/cm
2)
Cohe
sion
Interc
ept, '
c' (kg
/cm2 )
Angle
of In
terna
l Fri
ction
,
(degre
es)
Grain Size Analysis
Soil Profile (BH-1)Shell & Auger49.3 m01-Jul-1506-Jul-15
Atterberg Limits
Depth
of St
rata,
(m)
SOIL DESCRIPTION
Spec
ific G
ravity
Depth, m
Samp
le No
.
SPT (1)
Symb
olSurface Elevation :
Termination Depth :
Silt F
actor
50.17 m (RL -11.3 m)
38.8 m3.2 mGround Water Depth :
Ground Water Level :
Intake Well399001.29m E, 2808360.28m N
Shear TestsDensity and Moisture35.688 m
35.00 35.35 SPT34 101/ 20cm
101/ 20cm 0 96 4 0 0.78 ### #N/A #N/A #N/A #N/A #N/A #N/A #N/A #N/A
36.00 36.34 SPT35 101/ 19cm
101/ 19cm #N/A #N/A #N/A #N/A ### #N/A #N/A #N/A #N/A #N/A #N/A #N/A #N/A
37.00 37.32 SPT36 101/ 17cm
101/ 17cm #N/A #N/A #N/A #N/A ### #N/A #N/A #N/A #N/A #N/A #N/A #N/A #N/A
38.00 38.20 SPT37 101/ 5cm
101/ 5cm #N/A #N/A #N/A #N/A ### #N/A #N/A #N/A #N/A #N/A #N/A #N/A #N/A
39.00 39.17 SPT38 100/ 2cm
100/ 2cm #N/A #N/A #N/A #N/A ### #N/A #N/A #N/A #N/A #N/A #N/A #N/A #N/A
40.00 40.14 SPT39 Ref*/ 14cm
Ref*/ 14cm #N/A #N/A #N/A #N/A ### #N/A #N/A #N/A #N/A #N/A #N/A #N/A #N/A
41.00 41.16 SPT40 100/ 1cm
100/ 1cm #N/A #N/A #N/A #N/A ### #N/A #N/A #N/A #N/A #N/A #N/A #N/A #N/A
42.00 42.15 SPT41 Ref*/ 15cm
Ref*/ 15cm #N/A #N/A #N/A #N/A ### #N/A #N/A #N/A #N/A #N/A #N/A #N/A #N/A
43.00 43.17 SPT42 101/ 2cm
101/ 2cm #N/A #N/A #N/A #N/A ### #N/A #N/A #N/A #N/A #N/A #N/A #N/A #N/A
44.00 44.17 SPT43 102/ 2cm
102/ 2cm #N/A #N/A #N/A #N/A ### #N/A #N/A #N/A #N/A #N/A #N/A #N/A #N/A
45.00 45.34 SPT44 101/ 19cm
101/ 19cm #N/A #N/A #N/A #N/A ### #N/A #N/A #N/A #N/A #N/A #N/A #N/A #N/A
46.00 46.32 SPT45 102/ 17cm
102/ 17cm #N/A #N/A #N/A #N/A ### #N/A #N/A #N/A #N/A #N/A #N/A #N/A #N/A
Very dense grey fine sand (SP)
(1) SPT is outside NABL scope.
Geotechnical Investigation for XU-3 at HWP Manuguru Distt. Khammam, Telangana M/s. Heavy Water Board
Plate 8 of 32Plate 8 of 32Project No. 215081-III

Location : Boring Method :UTM Coordinates : Casing Depth :
Boring Start :Boring Finish :
From
To Field
Value
, Nf
Corre
cted V
alue,
N" Grav
el (%
)
Sand
(%)
Silt (
%)
Clay
(%)
Liquid
(%)
Plasti
c (%
)Pla
sticit
y Ind
ex
(%)
Bulk
Dens
ity
(gms/c
m3 )Dr
y Den
sity
(gms/c
m3 )Mo
isture
Con
tent
(%)
Type
of Te
stCo
nfinin
g Pr
essu
res,
(kg/cm
2)
Cohe
sion
Interc
ept, '
c' (kg
/cm2 )
Angle
of In
terna
l Fri
ction
,
(degre
es)
Grain Size Analysis
Soil Profile (BH-1)Shell & Auger49.3 m01-Jul-1506-Jul-15
Atterberg Limits
Depth
of St
rata,
(m)
SOIL DESCRIPTION
Spec
ific G
ravity
Depth, m
Samp
le No
.
SPT (1)
Symb
olSurface Elevation :
Termination Depth :
Silt F
actor
50.17 m (RL -11.3 m)
38.8 m3.2 mGround Water Depth :
Ground Water Level :
Intake Well399001.29m E, 2808360.28m N
Shear TestsDensity and Moisture35.688 m
47.00 47.30 SPT46 101/ 15cm
101/ 15cm #N/A #N/A #N/A #N/A ### #N/A #N/A #N/A #N/A #N/A #N/A #N/A #N/A
48.00 48.28 SPT47 101/ 13cm
101/ 13cm 0 95 5 0 1.06 ### #N/A #N/A #N/A #N/A #N/A #N/A #N/A #N/A
49.00 49.22 SPT48 101/ 7cm
101/ 7cm #N/A #N/A #N/A #N/A ### #N/A #N/A #N/A #N/A #N/A #N/A #N/A #N/A
50.00 50.17 SPT49 101/ 2cm
101/ 2cm 50.17 #N/A #N/A #N/A #N/A ### #N/A #N/A #N/A #N/A #N/A #N/A #N/A #N/A
#N/A #N/A #N/A #N/A #N/A #N/A #N/A ### #N/A #N/A #N/A #N/A #N/A #N/A #N/A #N/A
#N/A #N/A #N/A #N/A #N/A #N/A #N/A ### #N/A #N/A #N/A #N/A #N/A #N/A #N/A #N/A
#N/A #N/A #N/A #N/A #N/A #N/A #N/A ### #N/A #N/A #N/A #N/A #N/A #N/A #N/A #N/A
#N/A #N/A #N/A #N/A #N/A #N/A #N/A ### #N/A #N/A #N/A #N/A #N/A #N/A #N/A #N/A
#N/A #N/A #N/A #N/A #N/A #N/A #N/A ### #N/A #N/A #N/A #N/A #N/A #N/A #N/A #N/A
#N/A #N/A #N/A #N/A #N/A #N/A #N/A ### #N/A #N/A #N/A #N/A #N/A #N/A #N/A #N/A
#N/A #N/A #N/A #N/A #N/A #N/A #N/A ### #N/A #N/A #N/A #N/A #N/A #N/A #N/A #N/A
#N/A #N/A #N/A #N/A #N/A #N/A #N/A ### #N/A #N/A #N/A #N/A #N/A #N/A #N/A #N/A
Very dense grey fine sand (SP-SM)
(1) SPT is outside NABL scope.
Geotechnical Investigation for XU-3 at HWP Manuguru Distt. Khammam, Telangana M/s. Heavy Water Board
Plate 9 of 32Plate 9 of 32Project No. 215081-III

Location : Boring Method :UTM Coordinates : Casing Depth :
Boring Start :Boring Finish :
From
To Field
Value
, Nf
Corre
cted V
alue,
N" Grav
el (%
)
Sand
(%)
Silt (
%)
Clay
(%)
Liquid
(%)
Plasti
c (%
)Pla
sticit
y Ind
ex
(%)
Bulk
Dens
ity
(gms/c
m3 )Dr
y Den
sity
(gms/c
m3 )Mo
isture
Con
tent
(%)
Type
of Te
stCo
nfinin
g Pr
essu
res,
(kg/cm
2)
Cohe
sion
Interc
ept, '
c' (kg
/cm2 )
Angle
of In
terna
l Fri
ction
, f (de
grees
)
0.00 0.50 DS1 #N/A #N/A #N/A #N/A #N/A ### #N/A #N/A #N/A #N/A #N/A #N/A #N/A #N/A
0.50 1.00 DS2 #N/A 1.50 0 5 3.10 47.3 24.8 22.5 #N/A #N/A #N/A #N/A #N/A #N/A #N/A
1.50 1.80 UDS1 #N/A #N/A #N/A #N/A #N/A ### #N/A 1.79 1.60 11.7 #N/A DS 0.5 ,1, 1.5 0.0 30.5
2.50 2.95 SPT1 11 13 #N/A #N/A #N/A #N/A ### #N/A #N/A #N/A #N/A #N/A #N/A #N/A #N/A
3.50 3.95 SPT2 11 13 #N/A #N/A #N/A #N/A ### #N/A #N/A #N/A #N/A #N/A #N/A #N/A #N/A
4.50 4.95 SPT3 14 16 0 88 12 0 0.78 ### #N/A #N/A #N/A #N/A #N/A #N/A #N/A #N/A
5.50 5.95 SPT4 16 17 #N/A #N/A #N/A #N/A ### #N/A #N/A #N/A #N/A #N/A #N/A #N/A #N/A
6.50 6.95 SPT5 5 5 #N/A #N/A #N/A #N/A ### #N/A #N/A #N/A #N/A #N/A #N/A #N/A #N/A
7.50 7.95 SPT6 15 15 #N/A #N/A #N/A #N/A ### #N/A #N/A #N/A 2.62 #N/A #N/A #N/A #N/A
8.50 8.95 SPT7 11 11 0 92 8 0 0.79 ### #N/A #N/A #N/A #N/A #N/A #N/A #N/A #N/A
9.50 9.95 SPT8 12 12 #N/A #N/A #N/A #N/A ### #N/A #N/A #N/A #N/A #N/A #N/A #N/A #N/A
10.50 10.95 SPT9 13 12 #N/A #N/A #N/A #N/A ### #N/A #N/A #N/A #N/A #N/A #N/A #N/A #N/A
Soil Profile (BH-2)Shell & Auger49.3 m08-Jul-1511-Jul-15
Ground Water Depth :
Ground Water Level :
Intake Well399026.35m E, 2808311.37m N
Spec
ific G
ravity
- medium dense, 1.5 to 6.5 m
Loose to medium dense grey fine sans (SP-SM)
95
Grain Size Analysis
- loose, 6.5 to 7.5 m
- medium dense, 7.5 to 11.5 m
Stiff grey clayey silt, medium plastic (CI)
Depth, m
Samp
le No
.
SPT (1)
Symb
olSurface Elevation :
SOIL DESCRIPTION
Atterberg Limits
Depth
of St
rata,
(m)
Silt F
actor
Termination Depth : 50.18 m (RL -11.9 m)
38.2 m3.1 m
Shear TestsDensity and Moisture35.161 m
(1) SPT is outside NABL scope.
Geotechnical Investigation for XU-3 at HWP Manuguru Distt. Khammam, Telangana M/s. Heavy Water Board
Plate 10 of 32Plate 10 of 32Project No. 215081-III

Location : Boring Method :UTM Coordinates : Casing Depth :
Boring Start :Boring Finish :
From
To Field
Value
, Nf
Corre
cted V
alue,
N" Grav
el (%
)
Sand
(%)
Silt (
%)
Clay
(%)
Liquid
(%)
Plasti
c (%
)Pla
sticit
y Ind
ex
(%)
Bulk
Dens
ity
(gms/c
m3 )Dr
y Den
sity
(gms/c
m3 )Mo
isture
Con
tent
(%)
Type
of Te
stCo
nfinin
g Pr
essu
res,
(kg/cm
2)
Cohe
sion
Interc
ept, '
c' (kg
/cm2 )
Angle
of In
terna
l Fri
ction
, f (de
grees
)
Soil Profile (BH-2)Shell & Auger49.3 m08-Jul-1511-Jul-15
Ground Water Depth :
Ground Water Level :
Intake Well399026.35m E, 2808311.37m N
Spec
ific G
ravity
Grain Size AnalysisDepth, m
Samp
le No
.
SPT (1)
Symb
olSurface Elevation :
SOIL DESCRIPTION
Atterberg Limits
Depth
of St
rata,
(m)
Silt F
actor
Termination Depth : 50.18 m (RL -11.9 m)
38.2 m3.1 m
Shear TestsDensity and Moisture35.161 m
11.50 11.95 SPT10 14 13 #N/A #N/A #N/A #N/A ### #N/A #N/A #N/A #N/A #N/A #N/A #N/A #N/A
12.50 12.95 SPT11 16 15 #N/A #N/A #N/A #N/A ### #N/A #N/A #N/A #N/A #N/A #N/A #N/A #N/A
13.50 13.95 SPT12 21 19 0 95 5 0 1.06 ### #N/A #N/A #N/A #N/A #N/A #N/A #N/A #N/A
14.50 14.95 SPT13 21 18 #N/A #N/A #N/A #N/A ### #N/A #N/A #N/A #N/A #N/A #N/A #N/A #N/A
15.50 15.95 SPT14 23 20 #N/A #N/A #N/A #N/A ### #N/A #N/A #N/A #N/A #N/A #N/A #N/A #N/A
16.50 16.95 SPT15 28 24 #N/A #N/A #N/A #N/A ### #N/A #N/A #N/A #N/A #N/A #N/A #N/A #N/A
17.50 17.95 SPT16 32 26 #N/A #N/A #N/A #N/A ### #N/A #N/A #N/A #N/A #N/A #N/A #N/A #N/A
18.50 18.95 SPT17 35 28 #N/A #N/A #N/A #N/A ### #N/A #N/A #N/A #N/A #N/A #N/A #N/A #N/A
19.50 19.95 SPT18 40 32 4 88 8 0 1.53 ### #N/A #N/A #N/A #N/A #N/A #N/A #N/A #N/A
20.50 20.95 SPT19 47 37 #N/A #N/A #N/A #N/A ### #N/A #N/A #N/A #N/A #N/A #N/A #N/A #N/A
21.50 21.95 SPT20 47 36 #N/A #N/A #N/A #N/A ### #N/A #N/A #N/A #N/A #N/A #N/A #N/A #N/A
22.50 22.95 SPT21 53 40 #N/A #N/A #N/A #N/A ### #N/A #N/A #N/A #N/A #N/A #N/A #N/A #N/A
- with traces of gravel, 19.5 to 20.5 m
- very dense, 22.5 to 23.5 m
Medium dense to very dense grey fine sand (SP-SM) - medium dense, 11.5 to 22.5 m
(1) SPT is outside NABL scope.
Geotechnical Investigation for XU-3 at HWP Manuguru Distt. Khammam, Telangana M/s. Heavy Water Board
Plate 11 of 32Plate 11 of 32Project No. 215081-III
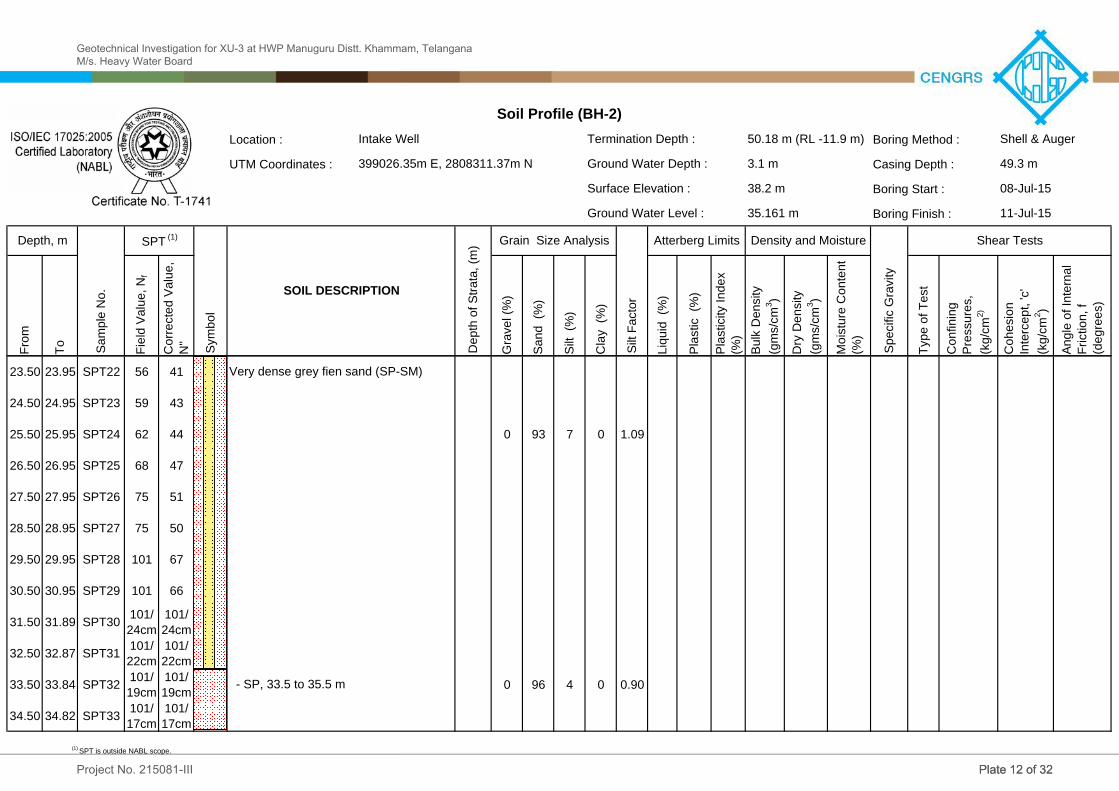
Location : Boring Method :UTM Coordinates : Casing Depth :
Boring Start :Boring Finish :
From
To Field
Value
, Nf
Corre
cted V
alue,
N" Grav
el (%
)
Sand
(%)
Silt (
%)
Clay
(%)
Liquid
(%)
Plasti
c (%
)Pla
sticit
y Ind
ex
(%)
Bulk
Dens
ity
(gms/c
m3 )Dr
y Den
sity
(gms/c
m3 )Mo
isture
Con
tent
(%)
Type
of Te
stCo
nfinin
g Pr
essu
res,
(kg/cm
2)
Cohe
sion
Interc
ept, '
c' (kg
/cm2 )
Angle
of In
terna
l Fri
ction
, f (de
grees
)
Soil Profile (BH-2)Shell & Auger49.3 m08-Jul-1511-Jul-15
Ground Water Depth :
Ground Water Level :
Intake Well399026.35m E, 2808311.37m N
Spec
ific G
ravity
Grain Size AnalysisDepth, m
Samp
le No
.
SPT (1)
Symb
olSurface Elevation :
SOIL DESCRIPTION
Atterberg Limits
Depth
of St
rata,
(m)
Silt F
actor
Termination Depth : 50.18 m (RL -11.9 m)
38.2 m3.1 m
Shear TestsDensity and Moisture35.161 m
23.50 23.95 SPT22 56 41 #N/A #N/A #N/A #N/A ### #N/A #N/A #N/A #N/A #N/A #N/A #N/A #N/A
24.50 24.95 SPT23 59 43 #N/A #N/A #N/A #N/A ### #N/A #N/A #N/A #N/A #N/A #N/A #N/A #N/A
25.50 25.95 SPT24 62 44 0 93 7 0 1.09 ### #N/A #N/A #N/A #N/A #N/A #N/A #N/A #N/A
26.50 26.95 SPT25 68 47 #N/A #N/A #N/A #N/A ### #N/A #N/A #N/A #N/A #N/A #N/A #N/A #N/A
27.50 27.95 SPT26 75 51 #N/A #N/A #N/A #N/A ### #N/A #N/A #N/A #N/A #N/A #N/A #N/A #N/A
28.50 28.95 SPT27 75 50 #N/A #N/A #N/A #N/A ### #N/A #N/A #N/A #N/A #N/A #N/A #N/A #N/A
29.50 29.95 SPT28 101 67 #N/A #N/A #N/A #N/A ### #N/A #N/A #N/A #N/A #N/A #N/A #N/A #N/A
30.50 30.95 SPT29 101 66 #N/A #N/A #N/A #N/A ### #N/A #N/A #N/A #N/A #N/A #N/A #N/A #N/A
31.50 31.89 SPT30 101/ 24cm
101/ 24cm #N/A #N/A #N/A #N/A ### #N/A #N/A #N/A #N/A #N/A #N/A #N/A #N/A
32.50 32.87 SPT31 101/ 22cm
101/ 22cm #N/A #N/A #N/A #N/A ### #N/A #N/A #N/A #N/A #N/A #N/A #N/A #N/A
33.50 33.84 SPT32 101/ 19cm
101/ 19cm 0 96 4 0 0.90 ### #N/A #N/A #N/A #N/A #N/A #N/A #N/A #N/A
34.50 34.82 SPT33 101/ 17cm
101/ 17cm #N/A #N/A #N/A #N/A ### #N/A #N/A #N/A #N/A #N/A #N/A #N/A #N/A
Very dense grey fien sand (SP-SM)
- SP, 33.5 to 35.5 m
(1) SPT is outside NABL scope.
Geotechnical Investigation for XU-3 at HWP Manuguru Distt. Khammam, Telangana M/s. Heavy Water Board
Plate 12 of 32Plate 12 of 32Project No. 215081-III

Location : Boring Method :UTM Coordinates : Casing Depth :
Boring Start :Boring Finish :
From
To Field
Value
, Nf
Corre
cted V
alue,
N" Grav
el (%
)
Sand
(%)
Silt (
%)
Clay
(%)
Liquid
(%)
Plasti
c (%
)Pla
sticit
y Ind
ex
(%)
Bulk
Dens
ity
(gms/c
m3 )Dr
y Den
sity
(gms/c
m3 )Mo
isture
Con
tent
(%)
Type
of Te
stCo
nfinin
g Pr
essu
res,
(kg/cm
2)
Cohe
sion
Interc
ept, '
c' (kg
/cm2 )
Angle
of In
terna
l Fri
ction
, f (de
grees
)
Soil Profile (BH-2)Shell & Auger49.3 m08-Jul-1511-Jul-15
Ground Water Depth :
Ground Water Level :
Intake Well399026.35m E, 2808311.37m N
Spec
ific G
ravity
Grain Size AnalysisDepth, m
Samp
le No
.
SPT (1)
Symb
olSurface Elevation :
SOIL DESCRIPTION
Atterberg Limits
Depth
of St
rata,
(m)
Silt F
actor
Termination Depth : 50.18 m (RL -11.9 m)
38.2 m3.1 m
Shear TestsDensity and Moisture35.161 m
35.50 35.80 SPT34 101/ 15cm
101/ 15cm #N/A #N/A #N/A #N/A ### #N/A #N/A #N/A #N/A #N/A #N/A #N/A #N/A
36.50 36.77 SPT35 102/ 12cm
102/ 12cm #N/A #N/A #N/A #N/A ### #N/A #N/A #N/A #N/A #N/A #N/A #N/A #N/A
37.50 37.70 SPT36 100/ 5cm
100/ 5cm #N/A #N/A #N/A #N/A ### #N/A #N/A #N/A #N/A #N/A #N/A #N/A #N/A
38.50 38.67 SPT37 101/ 2cm
101/ 2cm #N/A #N/A #N/A #N/A ### #N/A #N/A #N/A #N/A #N/A #N/A #N/A #N/A
39.50 39.66 SPT38 101/ 1cm
101/ 1cm #N/A #N/A #N/A #N/A ### #N/A #N/A #N/A #N/A #N/A #N/A #N/A #N/A
40.50 40.65 SPT39 Ref*/ 7cm
Ref*/ 7cm #N/A #N/A #N/A #N/A ### #N/A #N/A #N/A #N/A #N/A #N/A #N/A #N/A
41.50 41.63 SPT40 Ref*/ 13cm
Ref*/ 13cm #N/A #N/A #N/A #N/A ### #N/A #N/A #N/A #N/A #N/A #N/A #N/A #N/A
42.50 42.59 SPT41 Ref*/ 9cm
Ref*/ 9cm #N/A #N/A #N/A #N/A ### #N/A #N/A #N/A #N/A #N/A #N/A #N/A #N/A
43.50 43.57 SPT42 Ref*/ 7cm
Ref*/ 7cm #N/A #N/A #N/A #N/A ### #N/A #N/A #N/A #N/A #N/A #N/A #N/A #N/A
44.50 44.83 SPT43 101/ 18cm
101/ 18cm #N/A #N/A #N/A #N/A ### #N/A #N/A #N/A #N/A #N/A #N/A #N/A #N/A
45.50 45.83 SPT44 101/ 18cm
101/ 18cm #N/A #N/A #N/A #N/A ### #N/A #N/A #N/A #N/A #N/A #N/A #N/A #N/A
46.50 46.82 SPT45 102/ 17cm
102/ 17cm #N/A #N/A #N/A #N/A ### #N/A #N/A #N/A #N/A #N/A #N/A #N/A #N/A
Very dense grey fine sand (SP)
(1) SPT is outside NABL scope.
Geotechnical Investigation for XU-3 at HWP Manuguru Distt. Khammam, Telangana M/s. Heavy Water Board
Plate 13 of 32Plate 13 of 32Project No. 215081-III

Location : Boring Method :UTM Coordinates : Casing Depth :
Boring Start :Boring Finish :
From
To Field
Value
, Nf
Corre
cted V
alue,
N" Grav
el (%
)
Sand
(%)
Silt (
%)
Clay
(%)
Liquid
(%)
Plasti
c (%
)Pla
sticit
y Ind
ex
(%)
Bulk
Dens
ity
(gms/c
m3 )Dr
y Den
sity
(gms/c
m3 )Mo
isture
Con
tent
(%)
Type
of Te
stCo
nfinin
g Pr
essu
res,
(kg/cm
2)
Cohe
sion
Interc
ept, '
c' (kg
/cm2 )
Angle
of In
terna
l Fri
ction
, f (de
grees
)
Soil Profile (BH-2)Shell & Auger49.3 m08-Jul-1511-Jul-15
Ground Water Depth :
Ground Water Level :
Intake Well399026.35m E, 2808311.37m N
Spec
ific G
ravity
Grain Size AnalysisDepth, m
Samp
le No
.
SPT (1)
Symb
olSurface Elevation :
SOIL DESCRIPTION
Atterberg Limits
Depth
of St
rata,
(m)
Silt F
actor
Termination Depth : 50.18 m (RL -11.9 m)
38.2 m3.1 m
Shear TestsDensity and Moisture35.161 m
47.50 47.78 SPT46 101/ 13cm
101/ 13cm 0 95 5 0 1.06 ### #N/A #N/A #N/A #N/A #N/A #N/A #N/A #N/A
48.50 48.75 SPT47 101/ 20cm
101/ 20cm #N/A #N/A #N/A #N/A ### #N/A #N/A #N/A #N/A #N/A #N/A #N/A #N/A
49.50 49.72 SPT48 102/ 17cm
102/ 17cm #N/A #N/A #N/A #N/A ### #N/A #N/A #N/A #N/A #N/A #N/A #N/A #N/A
50.00 50.18 SPT49 101/ 3cm
101/ 3cm 50.18 #N/A #N/A #N/A #N/A ### #N/A #N/A #N/A #N/A #N/A #N/A #N/A #N/A
#N/A #N/A #N/A #N/A #N/A ### #N/A #N/A #N/A #N/A #N/A #N/A #N/A #N/A
#N/A #N/A #N/A #N/A #N/A ### #N/A #N/A #N/A #N/A #N/A #N/A #N/A #N/A
#N/A #N/A #N/A #N/A #N/A ### #N/A #N/A #N/A #N/A #N/A #N/A #N/A #N/A
#N/A #N/A #N/A #N/A #N/A ### #N/A #N/A #N/A #N/A #N/A #N/A #N/A #N/A
#N/A #N/A #N/A #N/A #N/A ### #N/A #N/A #N/A #N/A #N/A #N/A #N/A #N/A
#N/A #N/A #N/A #N/A #N/A ### #N/A #N/A #N/A #N/A #N/A #N/A #N/A #N/A
#N/A #N/A #N/A #N/A #N/A ### #N/A #N/A #N/A #N/A #N/A #N/A #N/A #N/A
#N/A #N/A #N/A #N/A #N/A #N/A #N/A ### #N/A #N/A #N/A #N/A #N/A #N/A #N/A #N/A
Very dense grey fine sand (SP-SM)
(1) SPT is outside NABL scope.
Geotechnical Investigation for XU-3 at HWP Manuguru Distt. Khammam, Telangana M/s. Heavy Water Board
Plate 14 of 32Plate 14 of 32Project No. 215081-III

Location : Boring Method :UTM Coordinates : Casing Depth :
Boring Start :Boring Finish :
From
To Field
Value
, Nf
Corre
cted V
alue,
N" Grav
el (%
)
Sand
(%)
Silt (
%)
Clay
(%)
Liquid
(%)
Plasti
c (%
)Pla
sticit
y Ind
ex
(%)
Bulk
Dens
ity
(gms/c
m3 )Dr
y Den
sity
(gms/c
m3 )Mo
isture
Con
tent
(%)
Type
of Te
stCo
nfinin
g Pr
essu
res,
(kg/cm
2)
Cohe
sion
Interc
ept, '
c' (kg
/cm2 )
Angle
of In
terna
l Fri
ction
,
(degre
es)
0.00 0.50 DS1 #N/A #N/A #N/A #N/A #N/A ### #N/A #N/A #N/A #N/A #N/A #N/A #N/A #N/A
0.50 1.00 DS2 #N/A 1.00 0 21 52 27 2.89 38.9 21.8 17.1 #N/A #N/A #N/A #N/A #N/A #N/A #N/A
1.00 1.45 SPT1 6 9 #N/A #N/A #N/A #N/A ### #N/A #N/A #N/A #N/A #N/A #N/A #N/A #N/A
2.00 2.45 SPT2 7 9 0 97 3 0 0.78 ### #N/A #N/A #N/A #N/A #N/A #N/A #N/A #N/A
3.00 3.30 UDS1 #N/A #N/A #N/A #N/A #N/A ### #N/A 1.84 1.49 24.0 #N/A DS 0.5 ,1, 1.5 0.0 31.9
4.00 4.45 SPT3 8 9 #N/A #N/A #N/A #N/A ### #N/A #N/A #N/A #N/A #N/A #N/A #N/A #N/A
5.00 5.45 SPT4 13 14 #N/A #N/A #N/A #N/A ### #N/A #N/A #N/A #N/A #N/A #N/A #N/A #N/A
6.00 6.45 SPT5 15 16 0 91 9 0 0.80 ### #N/A #N/A #N/A #N/A #N/A #N/A #N/A #N/A
7.00 7.45 SPT6 5 5 #N/A #N/A #N/A #N/A ### #N/A #N/A #N/A 2.67 #N/A #N/A #N/A #N/A
8.00 8.45 SPT7 16 16 #N/A #N/A #N/A #N/A ### #N/A #N/A #N/A #N/A #N/A #N/A #N/A #N/A
9.00 9.45 SPT8 16 16 10.00 #N/A #N/A #N/A #N/A ### #N/A #N/A #N/A #N/A #N/A #N/A #N/A #N/A
10.00 10.45 SPT9 16 16 0 61 36 3 0.59 ### #N/A #N/A #N/A #N/A #N/A #N/A #N/A #N/A
Soil Profile (BH-3)Shell & Auger49.5 m13-Jul-1515-Jul-15
Ground Water Depth :
Ground Water Level :
Intake Well399055.13m E, 2808256.66m N
Spec
ific G
ravity
- loose, 1.0 to 5.0 m
Loose to medium dense grey fine sand (SP)
- medium dense, 8.0 to 10.0 mSil
t Fac
tor
Grain Size Analysis
- SP-SM, 6.0 to 10.0 m
- loose, 7.0 to 8.0 m
Medium dense grey silty fine sand (SM)
- medium dense, 5.0 to 7.0 m
Firm grey clayey silt, medium plastic (CI)
Depth, m
Samp
le No
.
SPT (1)
Symb
olSurface Elevation :
SOIL DESCRIPTION
Atterberg Limits
Depth
of St
rata,
(m)
Termination Depth : 50.2 m (RL -12 m)
38.2 m3.0 m
Shear TestsDensity and Moisture35.296 m
(1) SPT is outside NABL scope.
Geotechnical Investigation for XU-3 at HWP Manuguru Distt. Khammam, Telangana M/s. Heavy Water Board
Plate 15 of 32Plate 15 of 32Project No. 215081-III

Location : Boring Method :UTM Coordinates : Casing Depth :
Boring Start :Boring Finish :
From
To Field
Value
, Nf
Corre
cted V
alue,
N" Grav
el (%
)
Sand
(%)
Silt (
%)
Clay
(%)
Liquid
(%)
Plasti
c (%
)Pla
sticit
y Ind
ex
(%)
Bulk
Dens
ity
(gms/c
m3 )Dr
y Den
sity
(gms/c
m3 )Mo
isture
Con
tent
(%)
Type
of Te
stCo
nfinin
g Pr
essu
res,
(kg/cm
2)
Cohe
sion
Interc
ept, '
c' (kg
/cm2 )
Angle
of In
terna
l Fri
ction
,
(degre
es)
Soil Profile (BH-3)Shell & Auger49.5 m13-Jul-1515-Jul-15
Ground Water Depth :
Ground Water Level :
Intake Well399055.13m E, 2808256.66m N
Spec
ific G
ravity
Silt F
actor
Grain Size AnalysisDepth, m
Samp
le No
.
SPT (1)
Symb
olSurface Elevation :
SOIL DESCRIPTION
Atterberg Limits
Depth
of St
rata,
(m)
Termination Depth : 50.2 m (RL -12 m)
38.2 m3.0 m
Shear TestsDensity and Moisture35.296 m
11.00 11.45 SPT10 16 15 #N/A #N/A #N/A #N/A ### #N/A #N/A #N/A #N/A #N/A #N/A #N/A #N/A
12.00 12.45 SPT11 17 16 13.00 #N/A #N/A #N/A #N/A ### #N/A #N/A #N/A #N/A #N/A #N/A #N/A #N/A
13.00 13.45 SPT12 18 16 #N/A #N/A #N/A #N/A ### #N/A #N/A #N/A #N/A #N/A #N/A #N/A #N/A
14.00 14.45 SPT13 16 14 #N/A #N/A #N/A #N/A ### #N/A #N/A #N/A #N/A #N/A #N/A #N/A #N/A
15.00 15.45 SPT14 21 18 #N/A #N/A #N/A #N/A ### #N/A #N/A #N/A #N/A #N/A #N/A #N/A #N/A
16.00 16.45 SPT15 19 16 #N/A #N/A #N/A #N/A ### #N/A #N/A #N/A #N/A #N/A #N/A #N/A #N/A
17.00 17.45 SPT16 22 18 #N/A #N/A #N/A #N/A ### #N/A #N/A #N/A #N/A #N/A #N/A #N/A #N/A
18.00 18.45 SPT17 26 21 0 96 4 0 0.90 ### #N/A #N/A #N/A #N/A #N/A #N/A #N/A #N/A
19.00 19.45 SPT18 33 26 #N/A #N/A #N/A #N/A ### #N/A #N/A #N/A 2.63 #N/A #N/A #N/A #N/A
20.00 20.45 SPT19 43 34 #N/A #N/A #N/A #N/A ### #N/A #N/A #N/A #N/A #N/A #N/A #N/A #N/A
21.00 21.45 SPT20 55 42 #N/A #N/A #N/A #N/A ### #N/A #N/A #N/A #N/A #N/A #N/A #N/A #N/A
22.00 22.45 SPT21 58 44 #N/A #N/A #N/A #N/A ### #N/A #N/A #N/A #N/A #N/A #N/A #N/A #N/A
- dense, 19.0 to 23.0 m
Medium dense grey silty fine sand (SM)
Medium dense to very dense grey fine sand (SP) - medium dense, 13.0 to 19.0 m
(1) SPT is outside NABL scope.
Geotechnical Investigation for XU-3 at HWP Manuguru Distt. Khammam, Telangana M/s. Heavy Water Board
Plate 16 of 32Plate 16 of 32Project No. 215081-III

Location : Boring Method :UTM Coordinates : Casing Depth :
Boring Start :Boring Finish :
From
To Field
Value
, Nf
Corre
cted V
alue,
N" Grav
el (%
)
Sand
(%)
Silt (
%)
Clay
(%)
Liquid
(%)
Plasti
c (%
)Pla
sticit
y Ind
ex
(%)
Bulk
Dens
ity
(gms/c
m3 )Dr
y Den
sity
(gms/c
m3 )Mo
isture
Con
tent
(%)
Type
of Te
stCo
nfinin
g Pr
essu
res,
(kg/cm
2)
Cohe
sion
Interc
ept, '
c' (kg
/cm2 )
Angle
of In
terna
l Fri
ction
,
(degre
es)
Soil Profile (BH-3)Shell & Auger49.5 m13-Jul-1515-Jul-15
Ground Water Depth :
Ground Water Level :
Intake Well399055.13m E, 2808256.66m N
Spec
ific G
ravity
Silt F
actor
Grain Size AnalysisDepth, m
Samp
le No
.
SPT (1)
Symb
olSurface Elevation :
SOIL DESCRIPTION
Atterberg Limits
Depth
of St
rata,
(m)
Termination Depth : 50.2 m (RL -12 m)
38.2 m3.0 m
Shear TestsDensity and Moisture35.296 m
23.00 23.45 SPT22 63 47 0 98 2 0 0.91 ### #N/A #N/A #N/A #N/A #N/A #N/A #N/A #N/A
24.00 24.45 SPT23 70 51 #N/A #N/A #N/A #N/A ### #N/A #N/A #N/A #N/A #N/A #N/A #N/A #N/A
25.00 25.45 SPT24 66 47 #N/A #N/A #N/A #N/A ### #N/A #N/A #N/A #N/A #N/A #N/A #N/A #N/A
26.00 26.45 SPT25 66 46 #N/A #N/A #N/A #N/A ### #N/A #N/A #N/A #N/A #N/A #N/A #N/A #N/A
27.00 27.45 SPT26 69 48 #N/A #N/A #N/A #N/A ### #N/A #N/A #N/A #N/A #N/A #N/A #N/A #N/A
28.00 28.45 SPT27 80 54 #N/A #N/A #N/A #N/A ### #N/A #N/A #N/A #N/A #N/A #N/A #N/A #N/A
29.00 29.45 SPT28 91 61 #N/A #N/A #N/A #N/A ### #N/A #N/A #N/A #N/A #N/A #N/A #N/A #N/A
30.00 30.45 SPT29 102 67 #N/A #N/A #N/A #N/A ### #N/A #N/A #N/A #N/A #N/A #N/A #N/A #N/A
31.00 31.42 SPT30 101/ 27cm
101/ 27cm #N/A #N/A #N/A #N/A ### #N/A #N/A #N/A #N/A #N/A #N/A #N/A #N/A
32.00 32.40 SPT31 101/ 25cm
101/ 25cm #N/A #N/A #N/A #N/A ### #N/A #N/A #N/A #N/A #N/A #N/A #N/A #N/A
33.00 33.37 SPT32 101/ 22cm
101/ 22cm #N/A #N/A #N/A #N/A ### #N/A #N/A #N/A #N/A #N/A #N/A #N/A #N/A
34.00 34.36 SPT33 101/ 21cm
101/ 21cm #N/A #N/A #N/A #N/A ### #N/A #N/A #N/A #N/A #N/A #N/A #N/A #N/A
Very dens grey fine san (SP)
(1) SPT is outside NABL scope.
Geotechnical Investigation for XU-3 at HWP Manuguru Distt. Khammam, Telangana M/s. Heavy Water Board
Plate 17 of 32Plate 17 of 32Project No. 215081-III

Location : Boring Method :UTM Coordinates : Casing Depth :
Boring Start :Boring Finish :
From
To Field
Value
, Nf
Corre
cted V
alue,
N" Grav
el (%
)
Sand
(%)
Silt (
%)
Clay
(%)
Liquid
(%)
Plasti
c (%
)Pla
sticit
y Ind
ex
(%)
Bulk
Dens
ity
(gms/c
m3 )Dr
y Den
sity
(gms/c
m3 )Mo
isture
Con
tent
(%)
Type
of Te
stCo
nfinin
g Pr
essu
res,
(kg/cm
2)
Cohe
sion
Interc
ept, '
c' (kg
/cm2 )
Angle
of In
terna
l Fri
ction
,
(degre
es)
Soil Profile (BH-3)Shell & Auger49.5 m13-Jul-1515-Jul-15
Ground Water Depth :
Ground Water Level :
Intake Well399055.13m E, 2808256.66m N
Spec
ific G
ravity
Silt F
actor
Grain Size AnalysisDepth, m
Samp
le No
.
SPT (1)
Symb
olSurface Elevation :
SOIL DESCRIPTION
Atterberg Limits
Depth
of St
rata,
(m)
Termination Depth : 50.2 m (RL -12 m)
38.2 m3.0 m
Shear TestsDensity and Moisture35.296 m
35.00 35.33 SPT34 101/ 18cm
101/ 18cm #N/A #N/A #N/A #N/A ### #N/A #N/A #N/A #N/A #N/A #N/A #N/A #N/A
36.00 36.30 SPT35 102/ 15cm
102/ 15cm 1 94 5 0 1.15 ### #N/A #N/A #N/A #N/A #N/A #N/A #N/A #N/A
37.00 37.27 SPT36 101/ 12cm
101/ 12cm #N/A #N/A #N/A #N/A ### #N/A #N/A #N/A #N/A #N/A #N/A #N/A #N/A
38.00 38.25 SPT37 101/ 10cm
101/ 10cm #N/A #N/A #N/A #N/A ### #N/A #N/A #N/A #N/A #N/A #N/A #N/A #N/A
39.00 39.23 SPT38 101/ 8cm
101/ 8cm #N/A #N/A #N/A #N/A ### #N/A #N/A #N/A #N/A #N/A #N/A #N/A #N/A
40.00 40.23 SPT39 101/ 8cm
101/ 8cm #N/A #N/A #N/A #N/A ### #N/A #N/A #N/A #N/A #N/A #N/A #N/A #N/A
41.00 41.20 SPT40 101/ 5cm
101/ 5cm #N/A #N/A #N/A #N/A ### #N/A #N/A #N/A #N/A #N/A #N/A #N/A #N/A
42.00 42.17 SPT41 101/ 2cm
101/ 2cm #N/A #N/A #N/A #N/A ### #N/A #N/A #N/A #N/A #N/A #N/A #N/A #N/A
43.00 43.13 SPT42 Ref*/ 13cm
Ref*/ 13cm #N/A #N/A #N/A #N/A ### #N/A #N/A #N/A #N/A #N/A #N/A #N/A #N/A
44.00 44.10 SPT43 Ref*/ 10cm
Ref*/ 10cm #N/A #N/A #N/A #N/A ### #N/A #N/A #N/A #N/A #N/A #N/A #N/A #N/A
45.00 45.08 SPT44 Ref*/ 8cm
Ref*/ 8cm #N/A #N/A #N/A #N/A ### #N/A #N/A #N/A #N/A #N/A #N/A #N/A #N/A
46.00 46.43 SPT45 101/ 28cm
101/ 28cm #N/A #N/A #N/A #N/A ### #N/A #N/A #N/A #N/A #N/A #N/A #N/A #N/A
Very dense grey fine sand with traces of gravel (SP-SM)
(1) SPT is outside NABL scope.
Geotechnical Investigation for XU-3 at HWP Manuguru Distt. Khammam, Telangana M/s. Heavy Water Board
Plate 18 of 32Plate 18 of 32Project No. 215081-III

Location : Boring Method :UTM Coordinates : Casing Depth :
Boring Start :Boring Finish :
From
To Field
Value
, Nf
Corre
cted V
alue,
N" Grav
el (%
)
Sand
(%)
Silt (
%)
Clay
(%)
Liquid
(%)
Plasti
c (%
)Pla
sticit
y Ind
ex
(%)
Bulk
Dens
ity
(gms/c
m3 )Dr
y Den
sity
(gms/c
m3 )Mo
isture
Con
tent
(%)
Type
of Te
stCo
nfinin
g Pr
essu
res,
(kg/cm
2)
Cohe
sion
Interc
ept, '
c' (kg
/cm2 )
Angle
of In
terna
l Fri
ction
,
(degre
es)
Soil Profile (BH-3)Shell & Auger49.5 m13-Jul-1515-Jul-15
Ground Water Depth :
Ground Water Level :
Intake Well399055.13m E, 2808256.66m N
Spec
ific G
ravity
Silt F
actor
Grain Size AnalysisDepth, m
Samp
le No
.
SPT (1)
Symb
olSurface Elevation :
SOIL DESCRIPTION
Atterberg Limits
Depth
of St
rata,
(m)
Termination Depth : 50.2 m (RL -12 m)
38.2 m3.0 m
Shear TestsDensity and Moisture35.296 m
47.00 47.40 SPT46 101/ 25cm
101/ 25cm 0 98 2 0 1.13 ### #N/A #N/A #N/A #N/A #N/A #N/A #N/A #N/A
48.00 48.36 SPT47 101/ 21cm
101/ 21cm #N/A #N/A #N/A #N/A ### #N/A #N/A #N/A #N/A #N/A #N/A #N/A #N/A
49.00 49.32 SPT48 101/ 17cm
101/ 17cm #N/A #N/A #N/A #N/A ### #N/A #N/A #N/A #N/A #N/A #N/A #N/A #N/A
50.00 50.20 SPT49 101/ 5cm
101/ 5cm 50.20 #N/A #N/A #N/A #N/A ### #N/A #N/A #N/A #N/A #N/A #N/A #N/A #N/A
#N/A #N/A #N/A #N/A #N/A ### #N/A #N/A #N/A #N/A #N/A #N/A #N/A #N/A
#N/A #N/A #N/A #N/A #N/A ### #N/A #N/A #N/A #N/A #N/A #N/A #N/A #N/A
#N/A #N/A #N/A #N/A #N/A ### #N/A #N/A #N/A #N/A #N/A #N/A #N/A #N/A
#N/A #N/A #N/A #N/A #N/A ### #N/A #N/A #N/A #N/A #N/A #N/A #N/A #N/A
#N/A #N/A #N/A #N/A #N/A ### #N/A #N/A #N/A #N/A #N/A #N/A #N/A #N/A
#N/A #N/A #N/A #N/A #N/A ### #N/A #N/A #N/A #N/A #N/A #N/A #N/A #N/A
#N/A #N/A #N/A #N/A #N/A ### #N/A #N/A #N/A #N/A #N/A #N/A #N/A #N/A
#N/A #N/A #N/A #N/A #N/A ### #N/A #N/A #N/A #N/A #N/A #N/A #N/A #N/A
Very dense grey fine sand (SP)
(1) SPT is outside NABL scope.
Geotechnical Investigation for XU-3 at HWP Manuguru Distt. Khammam, Telangana M/s. Heavy Water Board
Plate 19 of 32Plate 19 of 32Project No. 215081-III

Note: * 'Ref' refers to refusal (N>100) within the first 15 cm of seating penetration.
SYMBOL
Fine sand (SP-SM)
L E G E N DDESCRIPTION
Clayey silt (CI)Silty sand (SM)
Location: Intake Well
Fine sand (SP)Water table
Summary of Borehole Profiles
40
36
32
28
24
20
16
12
8
4
0
Redu
ced L
evel,
m
-4
-8
-12
-16
-20
1.0
BH-1RL: 38.8m
50.17m
9
339
14
3030
31
74
68
N-Value
4
5
6982798579
6661
42
555456
6255
597386102101101/25cm101/26cm102/23cm103/22cm101/20cm
101/17cm101/19cm
101/5cm101/2cmRef*/14cm100/1cmRef*/15cm101/2cm102/2cm101/19cm102/17cm101/15cm101/13cm101/7cm101/2cm
8.0
11.0
47.0
1.5
BH-2RL: 38.2m
50.18m
11
1411
11
1312
1416
N-Value
15
21212328
165
323540474753565962687575101101101/24cm101/22cm101/19cm101/17cm101/15cm102/12cm100/15cm101/2cm101/1cmRef*/15cmRef*/13cmRef*/9cmRef*/7cm101/18cm101/18cm102/17cm101/13cm101/10cm102/7cm101/3cm
33.5
47.5
1.0
BH-3RL: 38.2m
50.20 m
7
138
16
1616
16
26
17
N-Value
5
6
1816211922
3343
15
555863
6670
66698091102101/27cm101/25cm101/22cm101/21cm101/18cm
101/12cm102/15cm
101/10cm101/8cm101/8cm101/5cm101/2cmRef*/13cmRef*/10cmRef*/8cm101/28cm101/25cm101/21cm101/17cm101/5cm
6.0
10.0
13.0
35.0
47.0
Geotechnical Investigation for XU-3 at HWP Manuguru Distt. Khammam, Telangana M/s. Heavy Water Board
Plate 20 of 32Plate 20 of 32Project No. 215081-III

Symbol
Intake WellBH-2BH-1
Field SPT Values versus Reduced Level
BH-3
Standard Penetration Test
38.238.2
Reduced Level,m38.8
IS : 2131-1981, RA-2007
LocationBorehole Details
Borehole Number
-16
-12
-8
-4
0
4
8
12
16
20
24
28
32
36
400 10 20 30 40 50 60 70 80 90 100
Field SPT Value (N)
Redu
ced L
evel,
m
101/25cm101/24cm101/27cm
Geotechnical Investigation for XU-3 at HWP Manuguru Distt. Khammam, Telangana M/s. Heavy Water Board
Plate 21 of 32Plate 21 of 32Project No. 215081-III

Symbol
BH-1 38.8BH-2 38.2
Corrected SPT Values versus Reduced Level
Standard Penetration Test IS : 2131-1981, RA-2007
Borehole DetailsLocationBorehole Number Reduced Level,m
Intake Well38.2BH-3
-16
-12
-8
-4
0
4
8
12
16
20
24
28
32
36
400 10 20 30 40 50 60 70 80 90 100
Corrected SPT Value (N")
Redu
ced L
evel,
m
mm
100/1cm
101/2cm
101/2cm
101/2cm
101/8cm
Ref/8cm
Geotechnical Investigation for XU-3 at HWP Manuguru Distt. Khammam, Telangana M/s. Heavy Water Board
Plate 22 of 32Plate 22 of 32Project No. 215081-III

Borehole Number
Sample Depth, m
% Gravel
% Sand % Silt %
Clay D60 D30 D10 Cu Cc
BH-1 0.50 0 4 0.047 0.023
BH-1 3.00 0 97 3 0 0.236 0.184 0.145 1.6 0.99
BH-1 8.00 0 57 40 3 0.107 0.039 0.015 7.1 0.95
BH-1 13.00 0 98 2 0 0.392 0.252 0.171 2.3 0.95
BH-1 19.00 2 95 3 0 0.275 0.201 0.151 1.8 0.97
Grain Size Distribution Curve
Fine sand with traces of gravel (SP)
Fine sand (SP)
Fine sand (SP)
Silty fine sand (SM)
96
IS : 2720 (Part 4) - 1985, RA-2010Grain Size Analysis
Test ResultsSample Details
Sample Description
Clayey silt (CI)
0
10
20
30
40
50
60
70
80
90
100
0.001 0.010 0.100 1.000 10.000Particle Size, mm
% Fin
er by
Weig
ht
Borehole No: 1 , Depth: 0.5 mBorehole No: 1 , Depth: 3 mBorehole No: 1 , Depth: 8 mBorehole No: 1 , Depth: 13 mBorehole No: 1 , Depth: 19 m
GRAVELCOARSEFINE MEDIUM S A N DS I L TCLAY
Hydrometer Analysis Sieve Analysis
Geotechnical Investigation for XU-3 at HWP Manuguru Distt. Khammam, Telangana M/s. Heavy Water Board
Plate 23 of 32Plate 23 of 32Project No. 215081-III

Borehole Number
Sample Depth, m
% Gravel
% Sand % Silt %
Clay D60 D30 D10 Cu Cc
BH-1 26.00 0 97 3 0 0.272 0.202 0.155 1.8 0.97
BH-1 35.00 0 96 4 0 0.223 0.164 0.099 2.3 1.22
BH-1 48.00 0 95 5 0 0.366 0.233 0.152 2.4 0.98
Grain Size Distribution Curve
Fine sand (SP)
Fine sand (SP-SM)
IS : 2720 (Part 4) - 1985, RA-2010Grain Size Analysis
Test ResultsSample Details
Sample Description
Fine sand (SP)
0
10
20
30
40
50
60
70
80
90
100
0.001 0.010 0.100 1.000 10.000Particle Size, mm
% Fin
er by
Weig
ht
Borehole No: 1 , Depth: 26 m
Borehole No: 1 , Depth: 35 m
Borehole No: 1 , Depth: 48 m
GRAVELCOARSEFINE MEDIUM S A N DS I L TCLAY
Hydrometer Analysis Sieve Analysis
Geotechnical Investigation for XU-3 at HWP Manuguru Distt. Khammam, Telangana M/s. Heavy Water Board
Plate 24 of 32Plate 24 of 32Project No. 215081-III

Borehole Number
Sample Depth, m
% Gravel
% Sand % Silt %
Clay D60 D30 D10 Cu Cc
BH-2 0.50 0 5 0.047 0.024
BH-2 4.50 0 88 12 0 0.225 0.164
BH-2 8.50 0 92 8 0 0.228 0.166 0.085 2.7 1.42
BH-2 13.50 0 95 5 0 0.366 0.233 0.152 2.4 0.98
BH-2 19.50 4 88 8 0 0.377 0.221 0.137 2.8 0.95
Grain Size Distribution Curve
Fine sand with traces of gravel (SP-SM)
Fine sand (SP-SM)
Fine sand (SP-SM)
Fine sand (SP-SM)
95
IS : 2720 (Part 4) - 1985, RA-2010Grain Size Analysis
Test ResultsSample Details
Sample Description
Clayey silt (CI)
0
10
20
30
40
50
60
70
80
90
100
0.001 0.010 0.100 1.000 10.000Particle Size, mm
% Fin
er by
Weig
ht
Borehole No: 2 , Depth: 0.5 mBorehole No: 2 , Depth: 4.5 mBorehole No: 2 , Depth: 8.5 mBorehole No: 2 , Depth: 13.5 mBorehole No: 2 , Depth: 19.5 m
GRAVELCOARSEFINE MEDIUM S A N DS I L TCLAY
Hydrometer Analysis Sieve Analysis
Geotechnical Investigation for XU-3 at HWP Manuguru Distt. Khammam, Telangana M/s. Heavy Water Board
Plate 25 of 32Plate 25 of 32Project No. 215081-III

Borehole Number
Sample Depth, m
% Gravel
% Sand % Silt %
Clay D60 D30 D10 Cu Cc
BH-2 25.50 0 93 7 0 0.300 0.207 0.128 2.3 1.12
BH-2 33.50 0 96 4 0 0.251 0.186 0.123 2.0 1.12
BH-2 47.50 0 95 5 0 0.366 0.233 0.152 2.4 0.98
Grain Size Distribution Curve
Fine sand (SP)
Fine sand (SP-SM)
IS : 2720 (Part 4) - 1985, RA-2010Grain Size Analysis
Test ResultsSample Details
Sample Description
Fine sand (SP-SM)
0
10
20
30
40
50
60
70
80
90
100
0.001 0.010 0.100 1.000 10.000Particle Size, mm
% Fin
er by
Weig
ht
Borehole No: 2 , Depth: 25.5 m
Borehole No: 2 , Depth: 33.5 m
Borehole No: 2 , Depth: 47.5 m
GRAVELCOARSEFINE MEDIUM S A N DS I L TCLAY
Hydrometer Analysis Sieve Analysis
Geotechnical Investigation for XU-3 at HWP Manuguru Distt. Khammam, Telangana M/s. Heavy Water Board
Plate 26 of 32Plate 26 of 32Project No. 215081-III

Borehole Number
Sample Depth, m
% Gravel
% Sand % Silt %
Clay D60 D30 D10 Cu Cc
BH-3 0.50 0 21 52 27 0.007 0.003
BH-3 2.00 0 97 3 0 0.223 0.165 0.102 2.2 1.20
BH-3 6.00 0 91 9 0 0.231 0.169 0.082 2.8 1.51
BH-3 10.00 0 61 36 3 0.115 0.053 0.019 6.1 1.29
BH-3 18.00 0 96 4 0 0.252 0.188 0.129 2.0 1.09
Grain Size Distribution Curve
Fine sand (SP)
Silty fine sand (SM)
Fine sand (SP)
Fine sand (SP-SM)
IS : 2720 (Part 4) - 1985, RA-2010Grain Size Analysis
Test ResultsSample Details
Sample Description
Clayey silt (CI)
0
10
20
30
40
50
60
70
80
90
100
0.001 0.010 0.100 1.000 10.000Particle Size, mm
% Fin
er by
Weig
ht
Borehole No: 3 , Depth: 0.5 mBorehole No: 3 , Depth: 2 mBorehole No: 3 , Depth: 6 mBorehole No: 3 , Depth: 10 mBorehole No: 3 , Depth: 18 m
GRAVELCOARSEFINE MEDIUM S A N DS I L TCLAY
Hydrometer Analysis Sieve Analysis
Geotechnical Investigation for XU-3 at HWP Manuguru Distt. Khammam, Telangana M/s. Heavy Water Board
Plate 27 of 32Plate 27 of 32Project No. 215081-III

Borehole Number
Sample Depth, m
% Gravel
% Sand % Silt %
Clay D60 D30 D10 Cu Cc
BH-3 23.00 0 98 2 0 0.263 0.203 0.163 1.6 0.96
BH-3 36.00 1 94 5 0 0.370 0.235 0.155 2.4 0.96
BH-3 47.00 0 98 2 0 0.392 0.252 0.171 2.3 0.95
Grain Size Distribution Curve
Fine sand with traces of gravel (SP-SM)Fine sand (SP)
IS : 2720 (Part 4) - 1985, RA-2010Grain Size Analysis
Test ResultsSample Details
Sample Description
Fine sand (SP)
0
10
20
30
40
50
60
70
80
90
100
0.001 0.010 0.100 1.000 10.000Particle Size, mm
% Fin
er by
Weig
ht
Borehole No: 3 , Depth: 23 m
Borehole No: 3 , Depth: 36 m
Borehole No: 3 , Depth: 47 m
GRAVELCOARSEFINE MEDIUM S A N DS I L TCLAY
Hydrometer Analysis Sieve Analysis
Geotechnical Investigation for XU-3 at HWP Manuguru Distt. Khammam, Telangana M/s. Heavy Water Board
Plate 28 of 32Plate 28 of 32Project No. 215081-III

0.00 kg/cm2
31.1 degreesTest
Resu
lts
Remoulded1.49Saturated
Angle of Internal Friction, :
Cohesion Intercept, c :
Moisture Content (%):Dry Density of Soil (g/cm3):
Sample Description: Fine sandSample Depth: 3 m
Sample No.: UDS1Borehole No.: BH-1
Type of Sample:
Samp
le De
tails
Drained Direct Shear TestIS : 2720 (Part-13)-1986, RA-2010
Mohr-Coulomb Failure Envelope
y = 0.603xR2 = 1
0.0
0.5
1.0
1.5
2.0
2.5
0.0 0.5 1.0 1.5 2.0 2.5Normal Stress sff, kg/cm2
Shea
r Stre
ss t ff,
kg/cm
2
Geotechnical Investigation for XU-3 at HWP Manuguru Distt. Khammam, Telangana M/s. Heavy Water Board
Plate 29 of 32Plate 29 of 32Project No. 215081-III

0.00 kg/cm2
30.5 degreesTest
Resu
lts
Remoulded1.60Saturated
Angle of Internal Friction, :
Cohesion Intercept, c :
Moisture Content (%):Dry Density of Soil (g/cm3):
Sample Description: Fine sandSample Depth: 1.5 m
Sample No.: UDS1Borehole No.: BH-2
Type of Sample:
Samp
le De
tails
Drained Direct Shear TestIS : 2720 (Part-13)-1986, RA-2010
Mohr-Coulomb Failure Envelope
y = 0.59xR2 = 1
0.0
0.5
1.0
1.5
2.0
2.5
0.0 0.5 1.0 1.5 2.0 2.5Normal Stress sff, kg/cm2
Shea
r Stre
ss t ff,
kg/cm
2
Geotechnical Investigation for XU-3 at HWP Manuguru Distt. Khammam, Telangana M/s. Heavy Water Board
Plate 30 of 32Plate 30 of 32Project No. 215081-III

0.00 kg/cm2
31.9 degreesTest
Resu
lts
Remoulded1.49Saturated
Angle of Internal Friction, :
Cohesion Intercept, c :
Moisture Content (%):Dry Density of Soil (g/cm3):
Sample Description: Silty Fine SandSample Depth: 3 m
Sample No.: UDS1Borehole No.: BH-3
Type of Sample:
Samp
le De
tails
Drained Direct Shear TestIS : 2720 (Part-13)-1986, RA-2010
Mohr-Coulomb Failure Envelope
y = 0.6217xR2 = 0.9995
0.0
0.5
1.0
1.5
2.0
2.5
0.0 0.5 1.0 1.5 2.0 2.5Normal Stress sff, kg/cm2
Shea
r Stre
ss t ff,
kg/cm
2
Geotechnical Investigation for XU-3 at HWP Manuguru Distt. Khammam, Telangana M/s. Heavy Water Board
Plate 31 of 32Plate 31 of 32Project No. 215081-III

Borehole No. Depth, (m)
0.503.000.502.500.504.00
Borehole No.
BH-1BH-2
12345
NegligibleModerate
HighVery High
0.12 0.04 7.5
BH-1
BH-2
BH-3
0.11 0.03 7.80.11 0.06 7.7
TEST RESULTS
IS : 456-2000, SPECIFICATIONS
Chemical Test Results
75 7.2
0.11 0.09 7.7
Groundwater Test Results
Sulphate Content (SO3), mg/l
318
pH Value
Only if considerably in excess of 20,000 ppm
Classification
331
2000-20,000 ppm
300-1200Less than 300
Classification of Chloride Conditions in Groundwater*
1.0 to 2.01200-25002500-5000
2000-10,000 ppm
Tropical Climate
> 5000
Temperate ClimateChloride Limits
Requirements for Concrete Exposed to Sulphate Attack as per IS : 456-2000, Clauses 8.2.2.4 and 9.1.2, Table 4, Page-19
Concentration of Sulphates, expressed as SO 3 In-Soil-Water Extract (Total) Percent
Traces (<0.2)Class
Soil-Water Extract Test Results
*Source : Institution of Civil Engineers, London (1979)
Not Applicable
0.2 to 0.5
0-2000 ppm0-2000 ppm
0.5 to 1.0
Generally not applicableMore than 10,000 ppm
In Groundwater (mg/l)
pH Value
7.9
> 2.0
Sulphate Content (SO3), %
Chloride Content (Cl), %
0.11 0.040.060.11 7.9
Chloride Content (Cl), mg/l102 7.2
Geotechnical Investigation for XU-3 at HWP Manuguru Distt. Khammam, Telangana M/s. Heavy Water Board
Plate 32 of 32Plate 32 of 32Project No. 215081-III

APPENDIX-A
LIQUEFACTION SUSCEPTIBILITY ASSESSMENT

Several corrections are applied to the field N value:(N1)60 = Nm.CN.CE.CB.CR.CS(N1)60,cs = + (N1)60
FOS = Factor of safety against liquefaction (N1)60 = Corrected SPT N valueCRR7.5 = Cyclic Resistance Ratio Nm = Measured (field) SPT N value
CSR = Cyclic Stress Ratio Coefficients based on fines contentIV 38.8 N amax = Peak horizontal acceleration CN= Factor to normalize Nm to reference overburden stress6.7 3.2 WT g = Acceleration of gravity CE = Correction for hammer energy ratio (ER)0.24 0.0 150 'vo = Effective vertical overburden stress CR = correction for rod length1.0 38.8 0.75 rd = Stress reduction coefficient CS = correction for samplers with or without liners
Laye
r
Soil
Des
crip
tion
Dep
th to
Top
of
Laye
r (m
)
Laye
r Thi
ckne
ss (m
)
Uni
t wei
ght
(T/m
3 )
Tota
l Ove
rbur
den
Pres
sure
at M
iddl
e of
Lay
er (T
/m2 )
Effe
ctiv
e St
ress
at
Mid
dle
of L
ayer
, ba
sed
on d
esig
n G
WT
(T/m
2 )
Effe
ctiv
e St
ress
at
Mid
dle
of L
ayer
, ba
sed
on a
ctua
l G
WT
(T/m
2 )
Nm
Fine
s C
onte
nt (%
)
CN
CE
CB
CR
CS
(N1)
60,c
s
CR
R(7
.5)
Stre
ss R
educ
tion
Fact
or (r
d)
CSR
Mag
nitu
de S
calin
g Fa
ctor
CSR
7.5
Com
pute
d FO
S ag
ains
t liq
uefa
ctio
n
Plas
ticity
Inde
x (%
)
1 Clayey silt 0.0 1.0 1.70 0.9 0.4 0.850 5 96 1.70 0.75 1.05 0.75 1.20 5.00 1.20 12 0.13 1.00 0.37 1.442 0.25 NL 16.52 Fine sand 1.0 1.0 1.70 2.6 1.1 2.6 5 4 1.70 0.75 1.05 0.75 1.20 0.00 1.00 6 0.08 0.99 0.36 1.442 0.25 0.323 Fine sand 2.0 2.0 1.70 5.1 2.2 5.1 9 2 1.40 0.75 1.05 0.75 1.20 0.00 1.00 9 0.10 0.98 0.36 1.442 0.25 0.424 Fine sand 4.0 1.0 1.70 7.7 3.2 6.3 9 3 1.26 0.75 1.05 0.85 1.20 0.00 1.00 9 0.11 0.97 0.36 1.442 0.25 0.435 Fine sand 5.0 1.0 1.75 9.4 4.0 7.1 33 3 1.19 0.75 1.05 0.85 1.20 0.00 1.00 32 0.96 0.35 1.442 0.24 NL6 Fine sand 6.0 1.0 1.75 11.1 4.7 7.8 42 4 1.13 0.75 1.05 0.95 1.20 0.00 1.00 43 0.95 0.35 1.442 0.24 NL7 Fine sand 7.0 1.0 1.75 12.9 5.5 8.6 4 3 1.08 0.75 1.05 0.95 1.20 0.00 1.00 4 0.06 0.94 0.34 1.442 0.24 0.278 Silty fine sand 8.0 1.0 1.75 14.6 6.3 9.4 14 43 1.03 0.75 1.05 0.95 1.20 5.00 1.20 21 0.22 0.93 0.34 1.442 0.24 0.959 Silty fine sand 9.0 1.75 30 25 NL
10 11
MSF= Magnitude Scaling Factors
Conclusion: Liquefaction potential to 9.0 m depth
Calculations
PGA (g): Design GW Depth (m): Borehole Diameter (mm):Critical Factor of Safety (FS): Design GW Level (m): SPT Energy Correction (CE) :
Seismic Zone: Existing Ground Level, EGL (m): Sampler with liner?Earthquake Magnitude: Actual GW Depth (m): Hammer Type:
Surcharge Load, if any: 0 T/m2
Design Earthquake Site Levels Boring Details
Block N/A
Structure Intake Well
Existing Ground Level (EGL) 38.8Corrected SPT 'N' Value:
Influence of Fines Content:
Liquefaction Susceptibility Assessment
Symbols and Abbreviations-
Project Details
Borehole No. BH-1As per Seed and Idriss Approach, as described in the NCEER Summary Report (2001) -
Theory
N/A : Not Applicable (as in the case of unsaturated soils)NL : Not Liquefiable, e.g. if (N1)60,cs>30, PI>15%, or Fines Content>50%
:,5.7 whereCSR
CRRFOS
2001
]45)(10[50
135)(
)(341
2601
601
6015.7
NN
NCRR
dvo
vo
vo
av rg
aCSR
'
max' 65.0
MSF
Construction of Underpass at Belaire Junction of Sector 43/44 and Sector 53/54 in Gurgaon M/s.B&S Engineering Consultants Pvt.Ltd
Appendix-A: A- 1 of 3Project No. 215081-III

Several corrections are applied to the field N value:(N1)60 = Nm.CN.CE.CB.CR.CS(N1)60,cs = + (N1)60
FOS = Factor of safety against liquefaction (N1)60 = Corrected SPT N valueCRR7.5 = Cyclic Resistance Ratio Nm = Measured (field) SPT N value
CSR = Cyclic Stress Ratio Coefficients based on fines contentIV 38.2 N amax = Peak horizontal acceleration CN= Factor to normalize Nm to reference overburden stress6.7 3.1 WT g = Acceleration of gravity CE = Correction for hammer energy ratio (ER)0.24 0.0 150 'vo = Effective vertical overburden stress CR = correction for rod length1.0 38.2 0.75 rd = Stress reduction coefficient CS = correction for samplers with or without liners
Laye
r
Soil
Des
crip
tion
Dep
th to
Top
of
Laye
r (m
)
Laye
r Thi
ckne
ss (m
)
Uni
t wei
ght
(T/m
3 )
Tota
l Ove
rbur
den
Pres
sure
at M
iddl
e of
Lay
er (T
/m2 )
Effe
ctiv
e St
ress
at
Mid
dle
of L
ayer
, ba
sed
on d
esig
n G
WT
(T/m
2 )
Effe
ctiv
e St
ress
at
Mid
dle
of L
ayer
, ba
sed
on a
ctua
l G
WT
(T/m
2 )
Nm
Fine
s C
onte
nt (%
)
CN
CE
CB
CR
CS
(N1)
60,c
s
CR
R(7
.5)
Stre
ss R
educ
tion
Fact
or (r
d)
CSR
Mag
nitu
de S
calin
g Fa
ctor
CSR
7.5
Com
pute
d FO
S ag
ains
t liq
uefa
ctio
n
Plas
ticity
Inde
x (%
)
1 Clayey silt 0.0 2.5 1.70 2.1 0.9 2.125 8 95 1.70 0.75 1.05 0.75 1.20 5.00 1.20 17 0.18 0.99 0.37 1.442 0.25 NL 22.52 Fine sand 2.5 1.0 1.70 5.1 2.2 5.1 11 7 1.40 0.75 1.05 0.75 1.20 0.12 1.01 11 0.12 0.98 0.36 1.442 0.25 0.493 Fine sand 3.5 1.0 1.70 6.8 2.9 5.9 11 8 1.30 0.75 1.05 0.85 1.20 0.30 1.01 12 0.13 0.97 0.36 1.442 0.25 0.534 Fine sand 4.5 1.0 1.70 8.5 3.6 6.6 14 12 1.23 0.75 1.05 0.85 1.20 1.55 1.03 16 0.17 0.96 0.35 1.442 0.25 0.685 Fine sand 5.5 1.0 1.75 10.2 4.3 7.4 16 11 1.17 0.75 1.05 0.95 1.20 1.21 1.03 18 0.20 0.95 0.35 1.442 0.24 0.816 Fine sand 6.5 1.0 1.75 12.0 5.1 8.1 5 8 1.11 0.75 1.05 0.95 1.20 0.30 1.01 5 0.07 0.95 0.35 1.442 0.24 0.317 Fine sand 7.5 1.0 1.75 13.7 5.9 8.9 15 9 1.06 0.75 1.05 0.95 1.20 0.56 1.02 15 0.16 0.94 0.34 1.442 0.24 0.688 Fine sand 8.5 1.0 1.75 15.5 6.6 9.7 11 8 1.02 0.75 1.05 0.95 1.20 0.30 1.01 10 0.12 0.93 0.34 1.442 0.23 0.509 Fine sand 9.5 1.0 1.75 17.2 7.4 10.4 12 8 0.98 0.75 1.05 1.00 1.20 0.30 1.01 12 0.13 0.91 0.33 1.442 0.23 0.56
10 Fine sand 10.5 1.0 1.80 19.0 8.2 11.2 13 7 0.94 0.75 1.05 1.00 1.20 0.12 1.01 12 0.13 0.88 0.32 1.442 0.22 0.5911 Fine sand 11.5 1.0 1.8 20.8 9.0 12.0 14 9 0.91 0.75 1.05 1.00 1.20 0.56 1.02 13 0.14 0.85 0.31 1.442 0.21 0.6512 Fine sand 12.5 1.8 16 5 NL
MSF= Magnitude Scaling FactorsSymbols and Abbreviations-
Project Details
Borehole No. BH-2As per Seed and Idriss Approach, as described in the NCEER Summary Report (2001) -
Theory
Influence of Fines Content:
Surcharge Load, if any: 0
Liquefaction Susceptibility Assessment
Boring Details
Block N/A
Structure Intake Well
Existing Ground Level (EGL) 38.2Corrected SPT 'N' Value:
T/m2
Design Earthquake Site Levels
Seismic Zone: Existing Ground Level, EGL (m): Sampler with liner?Earthquake Magnitude: Actual GW Depth (m): Hammer Type:
PGA (g): Design GW Depth (m): Borehole Diameter (mm):Critical Factor of Safety (FS): Design GW Level (m): SPT Energy Correction (CE) :
Calculations
Conclusion: Liquefaction potential to 12.5 m depth
N/A : Not Applicable (as in the case of unsaturated soils)NL : Not Liquefiable, e.g. if (N1)60,cs>30, PI>15%, or Fines Content>50%
:,5.7 whereCSR
CRRFOS
2001
]45)(10[50
135)(
)(341
2601
601
6015.7
NN
NCRR
dvo
vo
vo
av rg
aCSR
'
max' 65.0
MSF
Construction of Underpass at Belaire Junction of Sector 43/44 and Sector 53/54 in Gurgaon M/s.B&S Engineering Consultants Pvt.Ltd
Appendix-A: A- 2 of 3Project No. 215081-III

Several corrections are applied to the field N value:(N1)60 = Nm.CN.CE.CB.CR.CS(N1)60,cs = + (N1)60
FOS = Factor of safety against liquefaction (N1)60 = Corrected SPT N valueCRR7.5 = Cyclic Resistance Ratio Nm = Measured (field) SPT N value
CSR = Cyclic Stress Ratio Coefficients based on fines contentIV 38.2 N amax = Peak horizontal acceleration CN= Factor to normalize Nm to reference overburden stress6.7 3.0 WT g = Acceleration of gravity CE = Correction for hammer energy ratio (ER)0.24 0.0 150 'vo = Effective vertical overburden stress CR = correction for rod length1.0 38.2 0.75 rd = Stress reduction coefficient CS = correction for samplers with or without liners
Laye
r
Soil
Des
crip
tion
Dep
th to
Top
of
Laye
r (m
)
Laye
r Thi
ckne
ss (m
)
Uni
t wei
ght
(T/m
3 )
Tota
l Ove
rbur
den
Pres
sure
at M
iddl
e of
Lay
er (T
/m2 )
Effe
ctiv
e St
ress
at
Mid
dle
of L
ayer
, ba
sed
on d
esig
n G
WT
(T/m
2 )
Effe
ctiv
e St
ress
at
Mid
dle
of L
ayer
, ba
sed
on a
ctua
l G
WT
(T/m
2 )
Nm
Fine
s C
onte
nt (%
)
CN
CE
CB
CR
CS
(N1)
60,c
s
CR
R(7
.5)
Stre
ss R
educ
tion
Fact
or (r
d)
CSR
Mag
nitu
de S
calin
g Fa
ctor
CSR
7.5
Com
pute
d FO
S ag
ains
t liq
uefa
ctio
n
Plas
ticity
Inde
x (%
)
1 Clayey silt 0.0 1.0 1.70 0.9 0.4 0.850 5 79 1.70 0.75 1.05 0.75 1.20 5.00 1.20 12 0.13 1.00 0.37 1.442 0.25 NL 17.12 Fine sand 1.0 1.0 1.70 2.6 1.1 2.6 6 4 1.70 0.75 1.05 0.75 1.20 0.00 1.00 7 0.09 0.99 0.36 1.442 0.25 0.353 Fine sand 2.0 2.0 1.70 5.1 2.2 5.1 7 3 1.40 0.75 1.05 0.75 1.20 0.00 1.00 7 0.09 0.98 0.36 1.442 0.25 0.354 Fine sand 4.0 1.0 1.70 7.7 3.2 6.1 8 4 1.28 0.75 1.05 0.85 1.20 0.00 1.00 8 0.10 0.97 0.36 1.442 0.25 0.405 Fine sand 5.0 1.0 1.75 9.4 4.0 6.9 13 3 1.21 0.75 1.05 0.85 1.20 0.00 1.00 13 0.14 0.96 0.35 1.442 0.24 0.566 Fine sand 6.0 1.0 1.75 11.1 4.7 7.6 15 9 1.14 0.75 1.05 0.95 1.20 0.56 1.02 16 0.17 0.95 0.35 1.442 0.24 0.727 Fine sand 7.0 1.0 1.75 12.9 5.5 8.4 5 10 1.09 0.75 1.05 0.95 1.20 0.87 1.02 6 0.08 0.94 0.34 1.442 0.24 0.338 Fine sand 8.0 1.0 1.75 14.6 6.3 9.2 16 11 1.04 0.75 1.05 0.95 1.20 1.21 1.03 17 0.18 0.93 0.34 1.442 0.24 0.759 Fine sand 9.0 1.0 1.75 16.4 7.1 9.9 16 12 1.00 0.75 1.05 0.95 1.20 1.55 1.03 16 0.17 0.92 0.33 1.442 0.23 0.76
10 Silty fine sand 10.0 1.0 1.75 18.1 7.8 10.7 16 39 0.97 0.75 1.05 1.00 1.20 5.00 1.20 23 0.25 0.89 0.32 1.442 0.22 1.1111 Silty fine sand 11.0 1.0 1.75 19.9 8.6 11.5 16 31 0.93 0.75 1.05 1.00 1.20 4.77 1.16 21 0.23 0.87 0.31 1.442 0.22 1.0612 Silty fine sand 12.0 17 25 NL
Liquefaction Susceptibility Assessment
Calculations
MSF= Magnitude Scaling FactorsSymbols and Abbreviations-
As per Seed and Idriss Approach, as described in the NCEER Summary Report (2001) -
Influence of Fines Content:Existing Ground Level (EGL)
Intake WellStructure
Block N/A
Liquefaction potential to 10.0 m depthConclusion:
Project Details
Corrected SPT 'N' Value:
Borehole No. BH-3
38.2
Theory
Surcharge Load, if any:
Critical Factor of Safety (FS): Design GW Level (m):
Design Earthquake
Seismic Zone: Actual GW Depth (m):
PGA (g): Design GW Depth (m):Earthquake Magnitude:
Site Levels
0 T/m2
SPT Energy Correction (CE) :
Hammer Type:Borehole Diameter (mm):
Boring Details
Sampler with liner?Existing Ground Level, EGL (m):
N/A : Not Applicable (as in the case of unsaturated soils)NL : Not Liquefiable, e.g. if (N1)60,cs>30, PI>15%, or Fines Content>50%
:,5.7 whereCSR
CRRFOS
2001
]45)(10[50
135)(
)(341
2601
601
6015.7
NN
NCRR
dvo
vo
vo
av rg
aCSR
'
max' 65.0
MSF
Construction of Underpass at Belaire Junction of Sector 43/44 and Sector 53/54 in Gurgaon M/s.B&S Engineering Consultants Pvt.Ltd
Appendix-A: A- 3 of 3Project No. 215081-III

APPENDIX-B
TYPICAL CALCULATIONS

c =
c = 0.0 T/m = 32.0 From To T/m3
Nc = Nq = N = 0.0 1.5 Scour1.5 12.512.5 20.0
2.5 20.0 30.0 1.9530.0 40.0 2.0040.0 50.0 2.1
C
c q dc dq d
8.0 30.0 0.50 1.30 1.20 0.60 1.00 1.23 1.238.0 32.0 0.50 1.30 1.20 0.60 1.00 1.27 1.278.0 35.0 0.50 1.30 1.20 0.60 1.00 1.34 1.3410.0 30.0 0.50 1.30 1.20 0.60 1.00 1.18 1.1810.0 32.0 0.50 1.30 1.20 0.60 1.00 1.22 1.2210.0 35.0 0.50 1.30 1.20 0.60 1.00 1.27 1.27
Bulk density of soil below founding level
bearing capacity factors, which are a function of
qgross safe = cohesion interceptsafe gross bearing capacity
Analysis as per IS 6403-1981
Intake Well
Well Diameter
where: qgross safe = (1/FS){cNccdc+qNqqdq+0.5BNdRw}
The bearing capacity equation for well foundations is as follows :
Bearing Capacity Analysis for Well Foundations
FS = Factor of safety
Shape factors
q =
=B =
overburden pressure below scour level
Water table correction factor
Depth,mSoil Parameters :
Circle Bulk Density Profile
Well Foundation Shape:
30.2123.18
Rw factor: Constant value(V) for worst condition or calculate(C) based on WT Depth ? :
Water Table Depth =
Factor of safety =
Scour Depth below Bed Level =
Bearing Capacity Factors
Rw
as per IS 1904-1986
GL
m
Safe Gross Bearing Capacity
T/m2
165.1199.5255.4167.5
Depth factors dc, dq, d =
Rw =Nc, Nq, N =
251.1
c, q, =
degrees35.49
Well
Diam
eter,
m
Shape Factors Depth factors
20.0
199.7
Depth
,m
Project No. 215081-III Appendix-B : Plate 1 of 3
Extension of Barauni Super Critical Coal Fired Thermal Power Station at Barauni, Bihar. M/s. STEAG Energy Services (India) Pvt. Ltd.
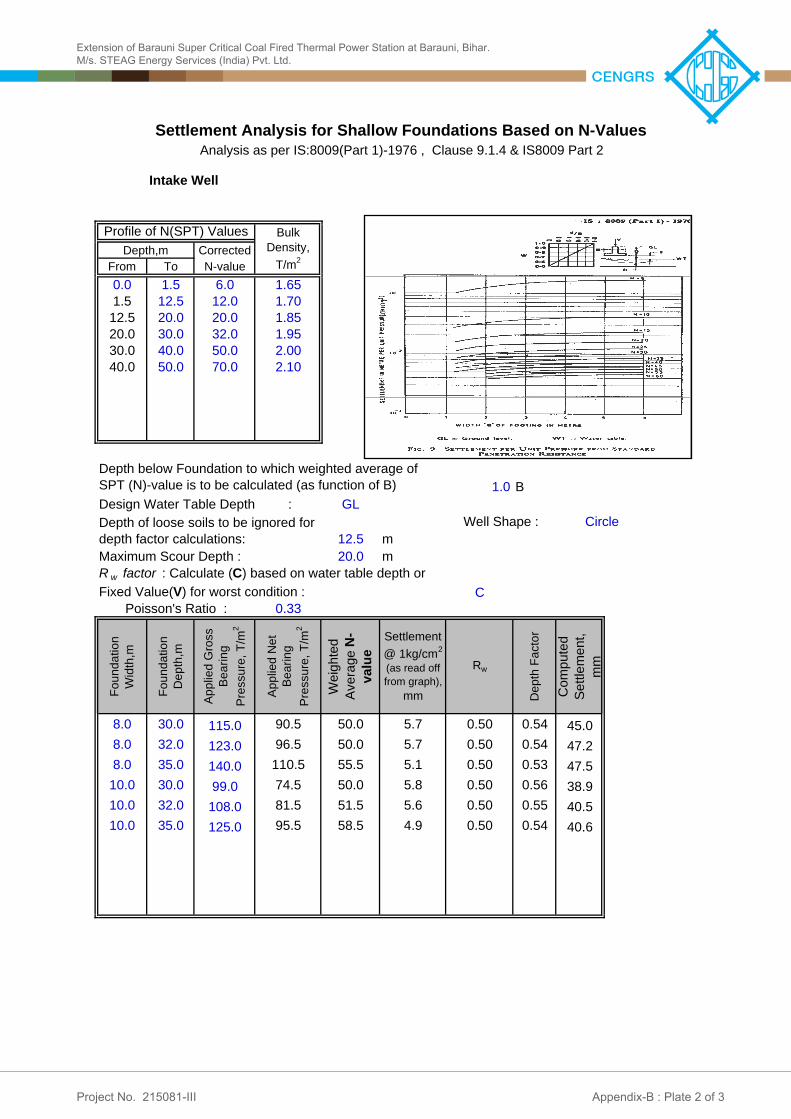
CorrectedFrom To N-value0.0 1.5 6.0 1.651.5 12.5 12.0 1.7012.5 20.0 20.0 1.8520.0 30.0 32.0 1.9530.0 40.0 50.0 2.0040.0 50.0 70.0 2.10
1.0 BGL
m20.0 m
C0.33
Foun
datio
n Wi
dth,m
Foun
datio
n De
pth,m
Appli
ed G
ross
Beari
ng
Pres
sure,
T/m2
Appli
ed N
et Be
aring
Pr
essu
re, T/
m2
Weigh
ted
Avera
ge N
-va
lue
Settlement @ 1kg/cm2
(as read off from graph),
mm
Rw
Depth
Facto
r
Comp
uted
Settle
ment,
mm
8.0 30.0 115.0 90.5 50.0 5.7 0.50 0.54 45.08.0 32.0 123.0 96.5 50.0 5.7 0.50 0.54 47.28.0 35.0 140.0 110.5 55.5 5.1 0.50 0.53 47.510.0 30.0 99.0 74.5 50.0 5.8 0.50 0.56 38.910.0 32.0 108.0 81.5 51.5 5.6 0.50 0.55 40.510.0 35.0 125.0 95.5 58.5 4.9 0.50 0.54 40.6
Depth,m
Well Shape :
Maximum Scour Depth :
Circle
Depth of loose soils to be ignored for depth factor calculations: 12.5
Settlement Analysis for Shallow Foundations Based on N-ValuesAnalysis as per IS:8009(Part 1)-1976 , Clause 9.1.4 & IS8009 Part 2
Poisson's Ratio :
Depth below Foundation to which weighted average of SPT (N)-value is to be calculated (as function of B)
R w factor : Calculate (C) based on water table depth or Fixed Value(V) for worst condition :
Design Water Table Depth :
Intake Well
Bulk Density,
T/m2
Profile of N(SPT) Values
Project No. 215081-III Appendix-B : Plate 2 of 3
Extension of Barauni Super Critical Coal Fired Thermal Power Station at Barauni, Bihar. M/s. STEAG Energy Services (India) Pvt. Ltd.

where B = B' = B/2 =
q = E =df = dr =I =
0.33 Y 45.0
From To1 0.0 1.5 1.652 1.5 12.5 1.703 12.5 20.0 1.854 20.0 30.0 2500 1.955 30.0 40.0 4000 2.006 40.0 50.0 5000 2.10
12.5
8.0 30.0 115.0 90.5 0.54 1.00 4.23 0.434 4333 49.88.0 32.0 123.0 96.5 0.54 1.00 3.67 0.416 4385 49.68.0 35.0 140.0 110.5 0.53 1.00 2.82 0.378 4500 49.310.0 30.0 99.0 74.5 0.56 1.00 3.39 0.405 4333 49.610.0 32.0 108.0 81.5 0.55 1.00 2.93 0.384 4385 49.910.0 35.0 125.0 95.5 0.54 1.00 2.26 0.340 4500 49.4
Settlement Analysis for Well FoundationsElastic Settlement Computed from Theory of Elasticity
Analysis as per IS : 8009 Parts 1 & 2 - 1976
Intake Well
Settlement at centre of well of equivalent dimensions B x L = 4 x Settlement at corner of area B' x L' (for circular well B = Side of square of same area)
Poisson's Ratio
Influence factor at corner of rectangular loaded area(B' x L'), computed
Poisson's Ratio :
Well Shape : Circle
Clayey silt
Layer No.
Depth,m
Equivalent width of wellE
Is Rigid Layer met ?
from theory of elasticity using Steinbrenner's factors
df dr
Rigid Layer atModulus of Elasti-city,T/m2
hard clays which are not likely to consolidate
Fine sand (Scour)
Fine sandFine sand
Fine sand (Liquefiable)
Fine sand
ELASTIC / IMMEDIATE SETTLEMENT
Fox's Depth factor
Bulk Density,
T/m3Soil Classification
m depth
Rigidity factor, taken as 0.8
Total setllement computed as equal to elastic/immediate settlement. No consolidation settlement - analysis valid for granular soils,weathered rocks,
Modulus of Elasticity
q B' (1 - 2) I Reference : Si =
Net Bearing Pressure = qgross - D
Foundation Analysis & Design by J.E.Bowles, fifth edition (1996)
Design Water Table Depth : GL
Net Bearing Press. T/m2
N = H/B'Gross
Bearing Press. T/m2
m
M = L'/B'
Depth To be ignored in computation of Depth Factor for loose soils, fill, scour etc. :
Well T
ip De
pth, m
Well
Diame
ter
m
Elastic Settle-ment mm
Depth Factor
Influe
nce
Facto
r , I
E (we
ighted
av
erage
) T/m
2
Project No. 215081-III Appendix-B : Plate 3 of 3
Extension of Barauni Super Critical Coal Fired Thermal Power Station at Barauni, Bihar. M/s. STEAG Energy Services (India) Pvt. Ltd.

APPENDIX-C
SITE PHOTOGRAPHS

Photo: 1 Borehole No. BH-2
Site Photographs
Photo: 2 Borehole No. BH-3
Extension of Barauni Super Critical Coal Fired Thermal Power Station at Barauni, Bihar.M/s. STEAG Energy Services (India) Pvt. Ltd.
Project No. 215081-III Appendix-C : Plate 1 of 1


