

SANDIA REPORTSAND2001-1642Unlimited ReleasePrinted June 2001
LIST/BMI Turbines Instrumentation andInfrastructure
Perry L. Jones, Herbert J. Sutherland, and Byron A. Neal
Prepared bySandia National LaboratoriesAlbuquerque, New Mexico 87185 and Livermore, California 94550
Sandia is a multiprogram laboratory operated by SandiaCorporation,a Lockheed Martin Company, for the United States Department ofEnergy under Contract DE-AC04-94AL85000.
Approved for public release; further dissemination unlimited.

Issued by Sandia National Laboratories, operated for the United States Departmentof Energy by Sandia Corporation.
NOTICE: This report was prepared as an account of work sponsored by an agency ofthe United States Government. Neither the United States Government, nor anyagency thereof, nor any of their employees, nor any of their contractors, subcontractors,or their employees, make any warranty, express or implied, or assume any legalliability or responsibility for the accuracy, completeness, or usefulness of anyinformation, apparatus, product, or process disclosed, or represent that its use wouldnot infringe privately owned rights. Reference herein to any specific commercialproduct, process, or service by trade name, trademark, manufacturer, or otherwise,does not necessarily constitute or imply its endorsement, recommendation, or favoringby the United States Government, any agency thereof, or any of their contractors orsubcontractors. The views and opinions expressed herein do not necessarily state orreflect those of the United States Government, any agency thereof, or any of theircontractors.
Printed in the United States of America. This report has been reproduced directly fromthe best available copy.
Available to DOE and DOE contractors fromU.S. Department of EnergyOffice of Scientific and Technical InformationP.O. Box 62Oak Ridge, TN 37831
Telephone: (865)576-8401Facsimile: (865)576-5728E-Mail: [email protected] ordering: http://www.doe.gov/bridge
Available to the public fromU.S. Department of CommerceNational Technical Information Service5285 Port Royal RdSpringfield, VA 22161
Telephone: (800)553-6847Facsimile: (703)605-6900E-Mail: [email protected] order: http://www.ntis.gov/ordering.htm
SAND2001-1642Unlimited ReleasePrinted June 2001
3
LIST/BMI TurbinesInstrumentation and Infrastructure
Perry L. Jones and Herbert J. SutherlandWind Energy Technology Department
Sandia National LaboratoriesP.O. Box 5800
Albuquerque, NM 87185-0708
Byron A. NealUSDA-Agriculture Research Service
Conservation and Production Research LaboratoryBushland, TX 79012-0010
ABSTRACT
In support of two major SNL programs, the Long-term Inflow and Structural Test (LIST)program and the Blade Manufacturing Initiative (BMI), three Micon 65/13M wind turbines havebeen erected at the USDA Agriculture Research Service (ARS) center in Bushland, Texas. Theinflow and structural response of these turbines are being monitored with an array of 60instruments: 34 to characterize the inflow, 19 to characterize structural response and 7 tocharacterize the time-varying state of the turbine. The primary characterization of the inflowinto the LIST turbine relies upon an array of five sonic anemometers. Primary characterizationof the structural response of the turbine uses several sets of strain gauges to measure bendingloads on the blades and the tower and two accelerometers to measure the motion of the nacelle.Data are sampled at a rate of 30 Hz using a newly developed data acquisition system. Thesystem features a time-synchronized continuous data stream and telemetered data from theturbine rotor. This paper documents the instruments and infrastructure that have been developedto monitor these turbines and their inflow.

TABLE OF CONTENTS
Page
Abstract ......................................................................................................................................3
Table of Contents.......................................................................................................................4
List of Tables .............................................................................................................................7
List of Figures ............................................................................................................................8
Introduction..............................................................................................................................10
Test Site ...................................................................................................................................11
Site Plan ............................................................................................................................. 12
Buildings ............................................................................................................................ 12
The Turbines ............................................................................................................................14
The LIST Turbine .............................................................................................................. 15
Sister Turbines ................................................................................................................... 15
Instrumentation ........................................................................................................................16
Instrumentation Summary and Nomenclature ................................................................... 16
Inflow Instrumentation....................................................................................................... 19Cup Anemometer ...........................................................................................................20Wind Vane......................................................................................................................20Sonic Anemometers .......................................................................................................20Temperature....................................................................................................................21Differential Temperature................................................................................................21Barometric Pressure .......................................................................................................22
Structural Instrumentation.................................................................................................. 22Strain Gauge Circuits .....................................................................................................22
Blade Strain Gauges ...............................................................................................................................22Hub Strain Gauges .................................................................................................................................22Main Shaft Strain Gauges ......................................................................................................................22Tower Strain Gauges..............................................................................................................................23
Nacelle Acceleration ......................................................................................................23
Additional Instrumentation ................................................................................................ 23Yaw Position ..................................................................................................................24Rotor Azimuth and Velocity ..........................................................................................24Turbine Monitor .............................................................................................................24Power Production ...........................................................................................................25
Data Acquisition System..........................................................................................................25
ATLAS............................................................................................................................... 25
ADAS II ............................................................................................................................. 27

5
Data Archival ..................................................................................................................... 27
Wiring Diagrams......................................................................................................................28
Instrument Enclosure ......................................................................................................... 28
Lightening Protection......................................................................................................... 28
Cables................................................................................................................................. 29
Junction Boxes ................................................................................................................... 31
Ground Grid ....................................................................................................................... 31
Concluding Remarks................................................................................................................31
References................................................................................................................................32
Appendix A..............................................................................................................................33
Detailed Diagrams of the Meteorological Towers...................................................................33
Center Meteorological Tower ............................................................................................ 34
North & South Meteorological Towers.............................................................................. 35
Far-North, Far-South and Off-Axis Meteorological Towers ............................................. 36
Appendix B ..............................................................................................................................37
Instrumentation Specifications.................................................................................................37
Met One Instrumentation ................................................................................................... 37Cup-and-Vane Anemometry ..........................................................................................37
Cup Anemometer ...................................................................................................................................37Wind Vane .............................................................................................................................................37Mounting Hardware ...............................................................................................................................37
Temperature Measurements ...........................................................................................38Absolute Temperature ............................................................................................................................38Differential Temperature........................................................................................................................38Mounting Hardware ...............................................................................................................................38
Barometric Pressure .......................................................................................................38
Sonic Anemometer............................................................................................................. 39
Strain Gauges ..................................................................................................................... 39Blade Gauges..................................................................................................................40Hub Gauges ....................................................................................................................40Main Shaft ......................................................................................................................41Tower Bending...............................................................................................................41Accelerometers...............................................................................................................41
Additional Instruments....................................................................................................... 42Yaw Position ..................................................................................................................42Rotor Azimuth and Velocity ..........................................................................................42Power..............................................................................................................................42Control Switch................................................................................................................43
Appendix C ..............................................................................................................................44

6
Wiring Diagrams......................................................................................................................44
Instrument Enclosure ......................................................................................................... 44AC Power Supply...........................................................................................................44DC Power Supplies ........................................................................................................44Lightning Protection.......................................................................................................45Instrument Rack .............................................................................................................46
Turbine Junction Boxes and Wiring .................................................................................. 49Turbine A Junction Box .................................................................................................51Turbine B Junction Box .................................................................................................51Turbine C Junction Box .................................................................................................54
Met Tower Junction Boxes and Wiring ............................................................................. 56Center Met Tower Junction Box ....................................................................................56North Met Tower Junction Box .....................................................................................57South Met Tower Junction Box .....................................................................................58Far South Met Tower Junction Box ...............................................................................59Far North Met Tower Junction Box ...............................................................................60Off Axis Met Tower Junction Box.................................................................................61Wiring Diagram for the Accelerometers ........................................................................62Wiring Diagram for the Met One Back Panel...............................................................63Instrumentation Enclosure Wiring Diagram ..................................................................64Lightning Protection.......................................................................................................64Sonic Anemometers .......................................................................................................67Cups & Vanes.................................................................................................................68Strain Gauges .................................................................................................................69Data Acquisition.............................................................................................................70
Appendix D..............................................................................................................................71
Infrastructure............................................................................................................................71Meteorological tower cable types, lengths, and junction boxes.....................................73Turbine instrument wires and junction boxes ................................................................76AC Transformer Power ..................................................................................................79Grounding Grid ..............................................................................................................81AC Power in Instrument Building..................................................................................82

7
LIST OF TABLES
Page
Table I. Inflow Instrumentation ..............................................................................................17
Table II. Turbine Instrumentation...........................................................................................18
Table III. Rotor Instrumentation .............................................................................................18
Table IV. Strain Gauge Circuits.............................................................................................23
Table V. Turbine Instrument Cables.......................................................................................28
Table VI. Inflow Instrumentation Cables ................................................................................29
Table VII. Data Acquisition and Turbine Control Cables. .....................................................29
Table VIII. AC Power Cables. .................................................................................................29

8
LIST OF FIGURES
Page
Fig. 1. Topographical Map of the USDA-ARS Site in Bushland , TX...................................11
Fig. 2. A Schematic Overview of the Test Site.......................................................................12
Fig. 3. Site Plan with Detailed Dimensions ............................................................................13
Fig. 4. The Test Turbines at the USDA-ARS Site in Bushland, TX ......................................14
Fig. 5. The LIST Turbine........................................................................................................15
Fig. 6. Schematic Diagram of the Inflow Instrumentation for the LIST Turbine...................16
Fig. 7. Schematic Diagram of the Structural Instrumentation for the LIST Turbine..............16
Fig. 8. Mounting of the Inflow Instrumentation on an Extension Arm ..................................20
Fig. 8a. Front View ........................................................................................................... 20
Fig. 8b. Side View............................................................................................................. 20
Fig. 9. Tower-Top Mounting of a Sonic .................................................................................21
Fig. 10. Tower-Top Mounting of a Cup and Vane .................................................................21
Fig. 11. Mounting of the Temperature & Delta Temperature Probes.....................................21
Fig. 12. Rotor Azimuth, Velocity and Nacelle Yaw Position.................................................24
Fig. 13. Instrument Enclosure. ................................................................................................27
Fig. A-1. Symbols used on the Diagrams of the Meteorological Towers...............................32
Fig. A-2. Center Meteorological Tower. ................................................................................33
Fig. A-3. North and South Meteorological Towers ................................................................34
Fig. A-4. Far-North, Far-South and Off-Axis Meteorological Towers ..................................35
Fig. B-1. Blade Strain Gauges ................................................................................................39
Fig. B-2. Hub Strain Gauges...................................................................................................39
Fig. B-3. Accelerometers & Main Shaft Strain Gauges..........................................................40
Fig. B-4. Strain Gauges Main Shaft........................................................................................40
Fig. B-5. Tower Strain Gauges ...............................................................................................41
Fig. C-1. Power Supplies & Back Panel of the Instrument Enclosure. ..................................43
Fig. C-2. AC Power Distribution in the Instrument Enclosure...............................................43
Fig. C-3. Lightning Protection Panels in the Instrument Enclosure. ......................................44
Fig. C-4. Typical Lightning Protection Circuit Board............................................................44
Fig. C-5. Front View of the Instrument Rack. ........................................................................45
Fig. C-6. Rear view of the Instrument Rack. ..........................................................................45

9
Fig. C-7. Junction Box for Turbine A.....................................................................................46
Fig. C-8. Junction Box for Turbine B. ....................................................................................47
Fig. C-9. Junction Box for Turbine C. ....................................................................................48
Fig. C-10. Junction Box on the Center Met Tower.................................................................49
Fig. C-11. North Met Tower Junction Box.............................................................................50
Fig. C-12. South Met Tower Junction Box.............................................................................51
Fig. C-13. Far South Met Tower Junction Box ......................................................................52
Fig. C-14. Far North Met Tower Junction Box ......................................................................53
Fig. C-15. Off Axis Met Tower Junction Box ........................................................................54
Fig. C-16. Accelerometer Wiring Diagram ............................................................................55
Fig. C-17. Wiring Diagram for the Met One Back Panel .......................................................56
Fig. C-18. Lightning Protection Wiring Diagram...................................................................57
Fig. C-18a. Panel 1 : Lightning Protection Wiring Diagram............................................57
Fig. C-18b. Panel 2: Lightning Protection Wiring Diagram..............................................58
Fig. C-18c. Panel 3: Lightning Protection Wiring Diagram.............................................59
Fig. C-19. Sonic Anemometers Wiring Diagram ...................................................................60
Fig. C-20. Cup and Vane Wiring Diagram.............................................................................61
Fig. C-21. Accelerometer, Strain Gauge Wiring Diagram .....................................................62
Fig. C-22. Data Acquisition Wiring Diagram.........................................................................63
Fig. D-1. Conduit Schedule for the Site..................................................................................64
Fig. D-2. Instrumentation Wires from the Met Towers ..........................................................65
Fig. D-3. Instrument Wires from the Towers. ........................................................................66
Fig. D-4. Grid Connections and Auxillary AC Power............................................................67
Fig. D-5. Ground Grid ............................................................................................................68
Fig. D-6. AC-Power Wiring Diagram for the Instrument Building and Enclosure. ...............69

10
INTRODUCTION
In support of two major SNL programs, three Micon 65/13M wind turbines have beenerected at the USDA Agriculture Research Service (ARS) center in Bushland, Texas. The inflowand structural response of these turbines are being monitored in support of the Long-term Inflowand Structural Test (LIST) program and the Blade Manufacturing Initiative (BMI). The formeris collecting long-term, continuous inflow and structural response data to characterize theextreme loads on wind turbines.1 The latter is developing new design and manufacturingtechniques for reducing costs and increasing reliability of wind turbine blades.2 As BMI bladesare produced, they will be tested at this site.
The inflow and structural response of these turbines are being monitored with an array of 60instruments: 34 to characterize the inflow, 19 to characterize structural response and 7 tocharacterize the time-varying state of the turbine. The primary characterization of the inflowinto the LIST turbine relies upon an array of five sonic anemometers. Primary characterizationof the structural response of the turbine uses several sets of strain gauges to measure bendingloads on the blades and the tower and two accelerometers to measure the motion of the nacelle.Data from the various instruments are sampled at a rate of 30 Hz using a newly developed dataacquisition system that features a time-synchronized continuous data stream that includes datatelemetered from the turbine rotor.
This paper documents the instruments and infrastructure that has been developed at this sitein support of LIST and BMI projects.
11
TEST SITE
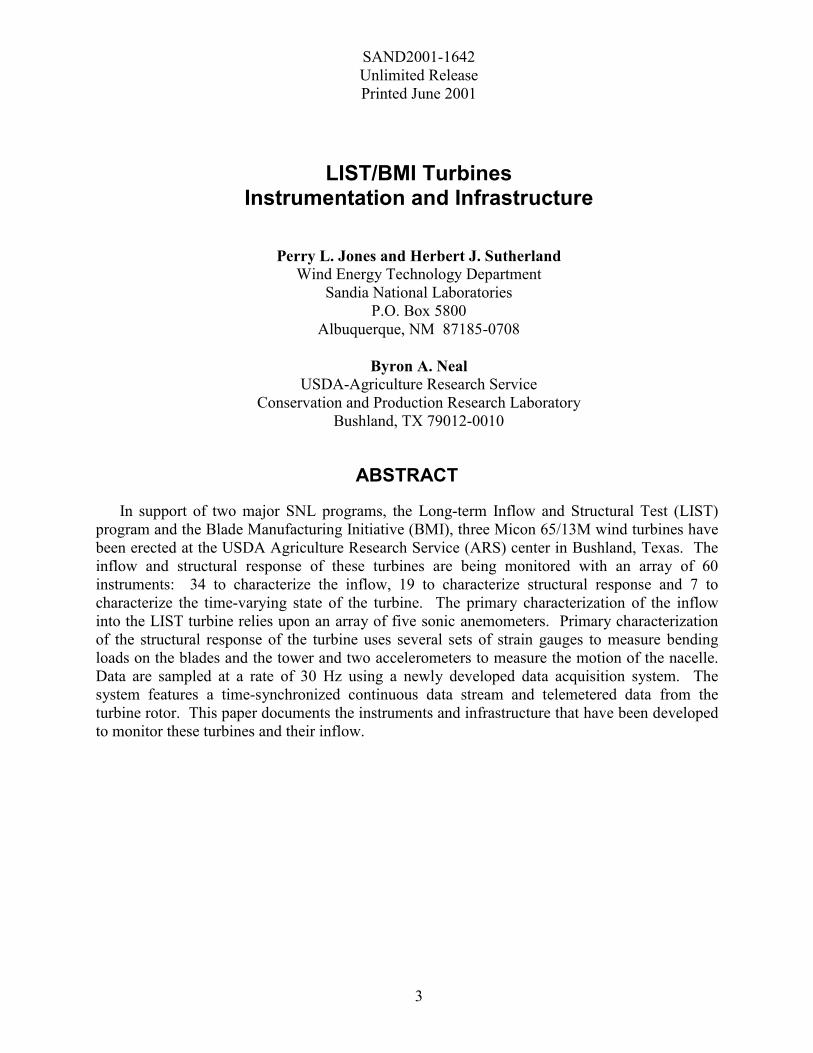
The three turbines used in this experiment are located on the USDA-ARS site in Bushland,TX. This site is characteristic of a Great Plains site with essentially flat terrain. The test site issurrounded by farmland. On the NNW corner of the site is a reservoir with an approximately 1.2m (4 ft) berm. As illustrated in the topographic map shown in Fig. 1, the site slopes downapproximately 1 m (3 ft) to the SSE across the span of the turbine bases.
The primary wind direction at the site is from 215� with-respect-to True North.* The windrosette for this site shows a secondary peak for winds from approximately due North.
* All compass headings are given with-respect- to True North.
Fig. 1. Topographical Map of the USDA-ARS Site in Bushland , TX.
12
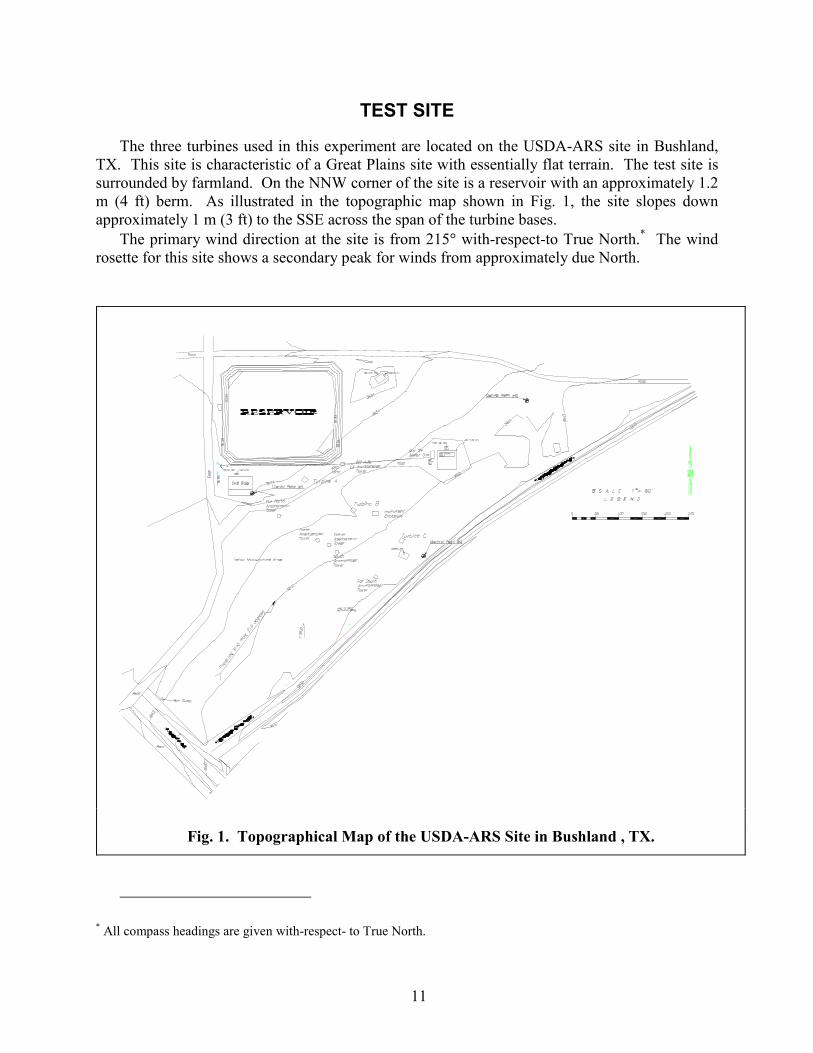
Site PlanAs shown in Fig. 2, the three turbines have been placed on this site in a straight line across
the prevailing wind direction of 215�. The turbines are labeled A, B and C for convenience. Themost heavily instrumented turbine is B. This turbine is the primary test turbine for the LISTportion of this experimental campaign.
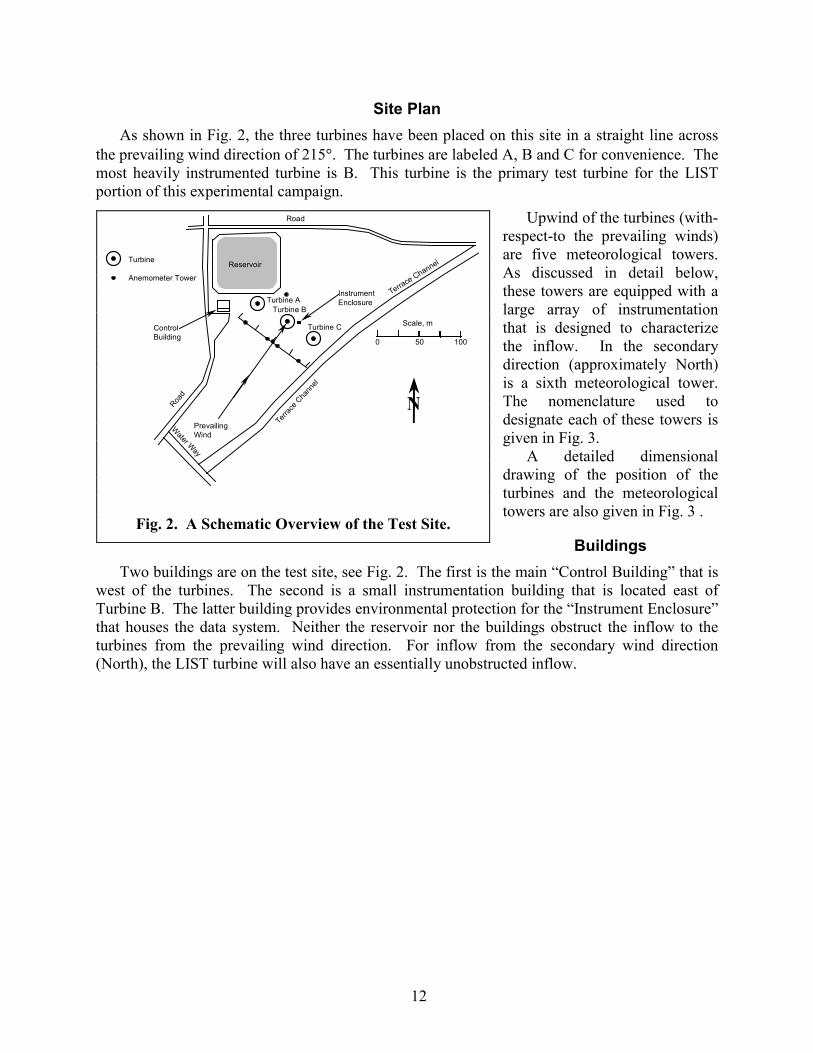
Upwind of the turbines (with-respect-to the prevailing winds)are five meteorological towers.As discussed in detail below,these towers are equipped with alarge array of instrumentationthat is designed to characterizethe inflow. In the secondarydirection (approximately North)is a sixth meteorological tower.The nomenclature used todesignate each of these towers isgiven in Fig. 3.
A detailed dimensionaldrawing of the position of theturbines and the meteorologicaltowers are also given in Fig. 3 .
BuildingsTwo buildings are on the test site, see Fig. 2. The first is the main “Control Building” that is
west of the turbines. The second is a small instrumentation building that is located east ofTurbine B. The latter building provides environmental protection for the “Instrument Enclosure”that houses the data system. Neither the reservoir nor the buildings obstruct the inflow to theturbines from the prevailing wind direction. For inflow from the secondary wind direction(North), the LIST turbine will also have an essentially unobstructed inflow.
Fig. 2. A Schematic Overview of the Test Site.
ControlBuilding
Reservoir
Turbine C
Turbine BTurbine A
InstrumentEnclosure
PrevailingWind
Terra
ce C
hann
el
Terrace Channel
Water Way
0 50 100
Scale, m
N
Road
Road
Turbine
Anemometer Tower
13
Fig. 3. Site Plan with Detailed Dimensions.
14
THE TURBINES
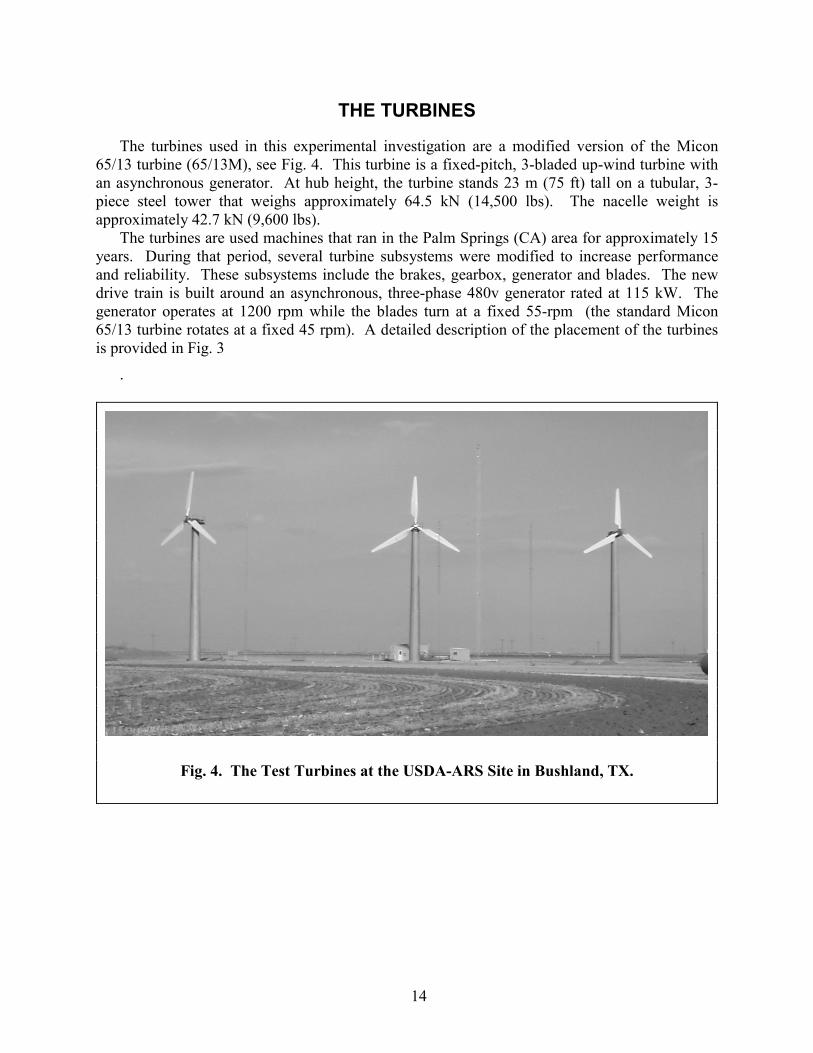
The turbines used in this experimental investigation are a modified version of the Micon65/13 turbine (65/13M), see Fig. 4. This turbine is a fixed-pitch, 3-bladed up-wind turbine withan asynchronous generator. At hub height, the turbine stands 23 m (75 ft) tall on a tubular, 3-piece steel tower that weighs approximately 64.5 kN (14,500 lbs). The nacelle weight isapproximately 42.7 kN (9,600 lbs).
The turbines are used machines that ran in the Palm Springs (CA) area for approximately 15years. During that period, several turbine subsystems were modified to increase performanceand reliability. These subsystems include the brakes, gearbox, generator and blades. The newdrive train is built around an asynchronous, three-phase 480v generator rated at 115 kW. Thegenerator operates at 1200 rpm while the blades turn at a fixed 55-rpm (the standard Micon65/13 turbine rotates at a fixed 45 rpm). A detailed description of the placement of the turbinesis provided in Fig. 3
.
Fig. 4. The Test Turbines at the USDA-ARS Site in Bushland, TX.
15
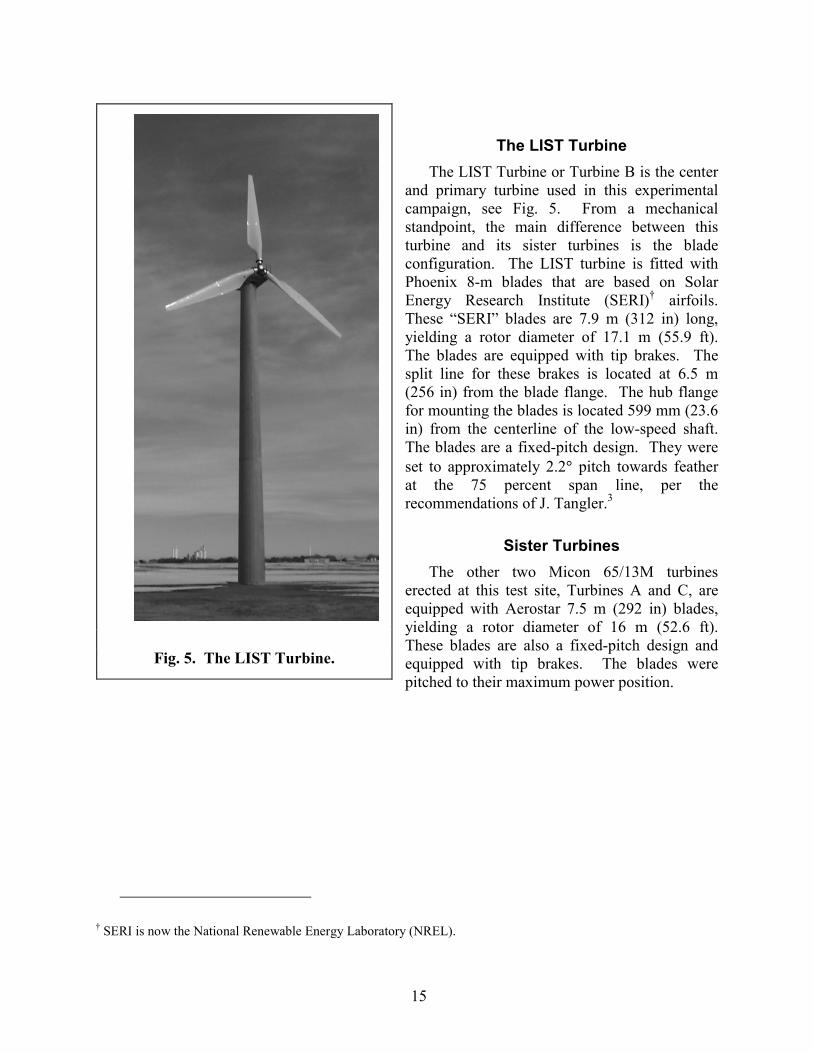
The LIST TurbineThe LIST Turbine or Turbine B is the center
and primary turbine used in this experimentalcampaign, see Fig. 5. From a mechanicalstandpoint, the main difference between thisturbine and its sister turbines is the bladeconfiguration. The LIST turbine is fitted withPhoenix 8-m blades that are based on SolarEnergy Research Institute (SERI)† airfoils.These “SERI” blades are 7.9 m (312 in) long,yielding a rotor diameter of 17.1 m (55.9 ft).The blades are equipped with tip brakes. Thesplit line for these brakes is located at 6.5 m(256 in) from the blade flange. The hub flangefor mounting the blades is located 599 mm (23.6in) from the centerline of the low-speed shaft.The blades are a fixed-pitch design. They wereset to approximately 2.2� pitch towards featherat the 75 percent span line, per therecommendations of J. Tangler.3
Sister TurbinesThe other two Micon 65/13M turbines
erected at this test site, Turbines A and C, areequipped with Aerostar 7.5 m (292 in) blades,yielding a rotor diameter of 16 m (52.6 ft).These blades are also a fixed-pitch design andequipped with tip brakes. The blades werepitched to their maximum power position.
† SERI is now the National Renewable Energy Laboratory (NREL).
Fig. 5. The LIST Turbine.
16
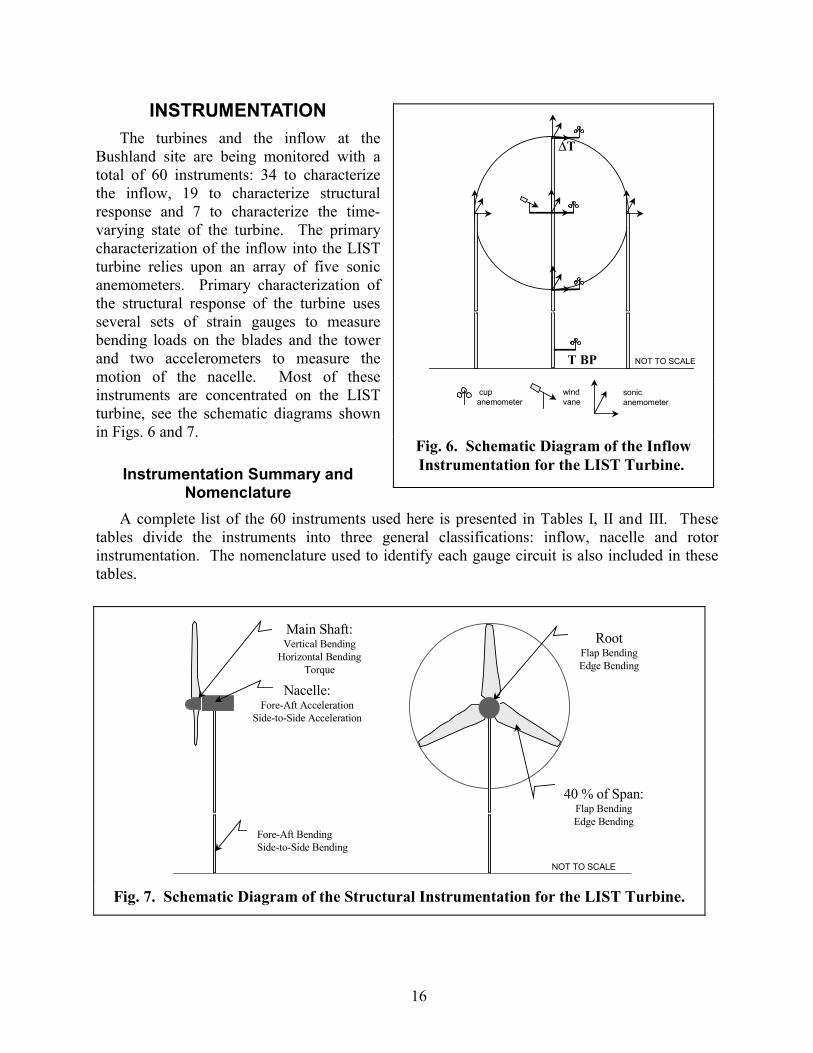
INSTRUMENTATIONThe turbines and the inflow at the
Bushland site are being monitored with atotal of 60 instruments: 34 to characterizethe inflow, 19 to characterize structuralresponse and 7 to characterize the time-varying state of the turbine. The primarycharacterization of the inflow into the LISTturbine relies upon an array of five sonicanemometers. Primary characterization ofthe structural response of the turbine usesseveral sets of strain gauges to measurebending loads on the blades and the towerand two accelerometers to measure themotion of the nacelle. Most of theseinstruments are concentrated on the LISTturbine, see the schematic diagrams shownin Figs. 6 and 7.
Instrumentation Summary andNomenclature
A complete list of the 60 instruments used here is presented in Tables I, II and III. Thesetables divide the instruments into three general classifications: inflow, nacelle and rotorinstrumentation. The nomenclature used to identify each gauge circuit is also included in thesetables.
T
�T
BP NOT TO SCALE
sonicanemometer
cupanemometer
windvane
Fig. 6. Schematic Diagram of the InflowInstrumentation for the LIST Turbine.
Fore-Aft BendingSide-to-Side Bending
40 % of Span:Flap BendingEdge Bending
RootFlap BendingEdge Bending
Main Shaft:Vertical Bending
Horizontal BendingTorque
Nacelle:Fore-Aft Acceleration
Side-to-Side Acceleration
NOT TO SCALE
Fig. 7. Schematic Diagram of the Structural Instrumentation for the LIST Turbine.
17
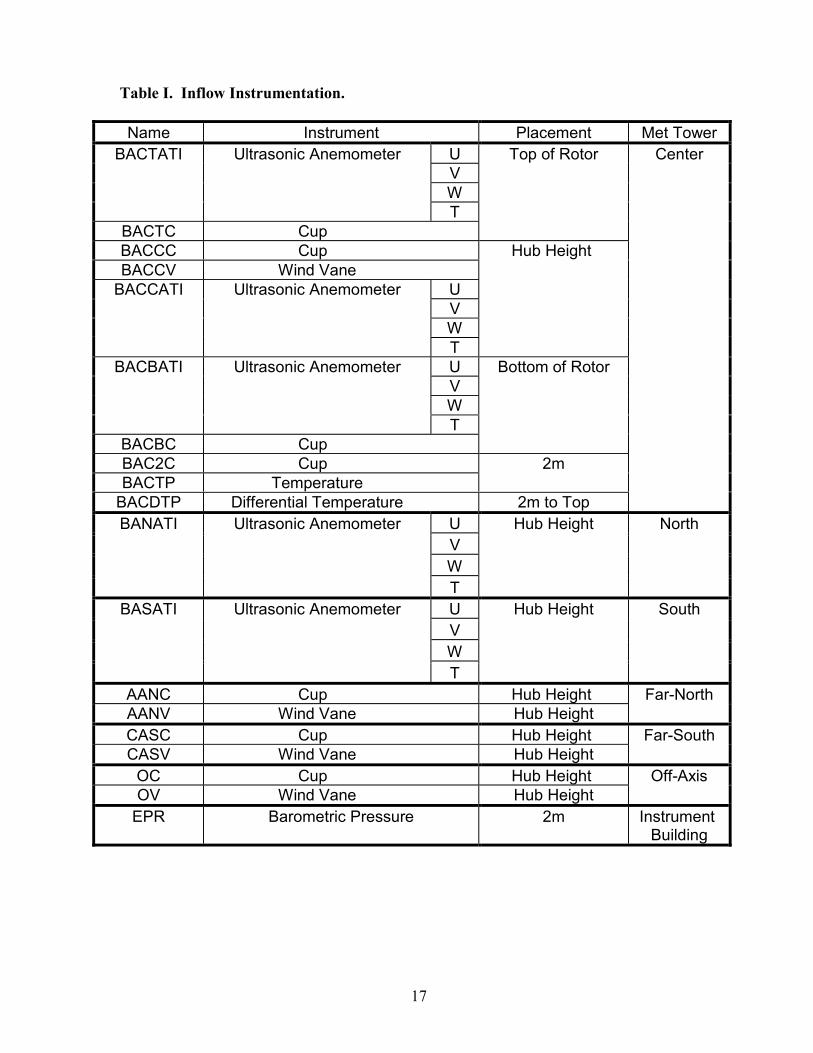
Table I. Inflow Instrumentation.
Name Instrument Placement Met TowerUVW
BACTATI Ultrasonic Anemometer
TBACTC Cup
Top of Rotor
BACCC Cup BACCV Wind Vane
UVW
BACCATI Ultrasonic Anemometer
T
Hub Height
UVW
BACBATI Ultrasonic Anemometer
TBACBC Cup
Bottom of Rotor
BAC2C Cup BACTP Temperature
2m
BACDTP Differential Temperature 2m to Top
Center
UVW
BANATI Ultrasonic Anemometer
T
Hub Height North
UVW
BASATI Ultrasonic Anemometer
T
Hub Height South
AANC Cup Hub Height AANV Wind Vane Hub Height
Far-North
CASC Cup Hub Height CASV Wind Vane Hub Height
Far-South
OC Cup Hub Height OV Wind Vane Hub Height
Off-Axis
EPR Barometric Pressure 2m Instrument Building
18
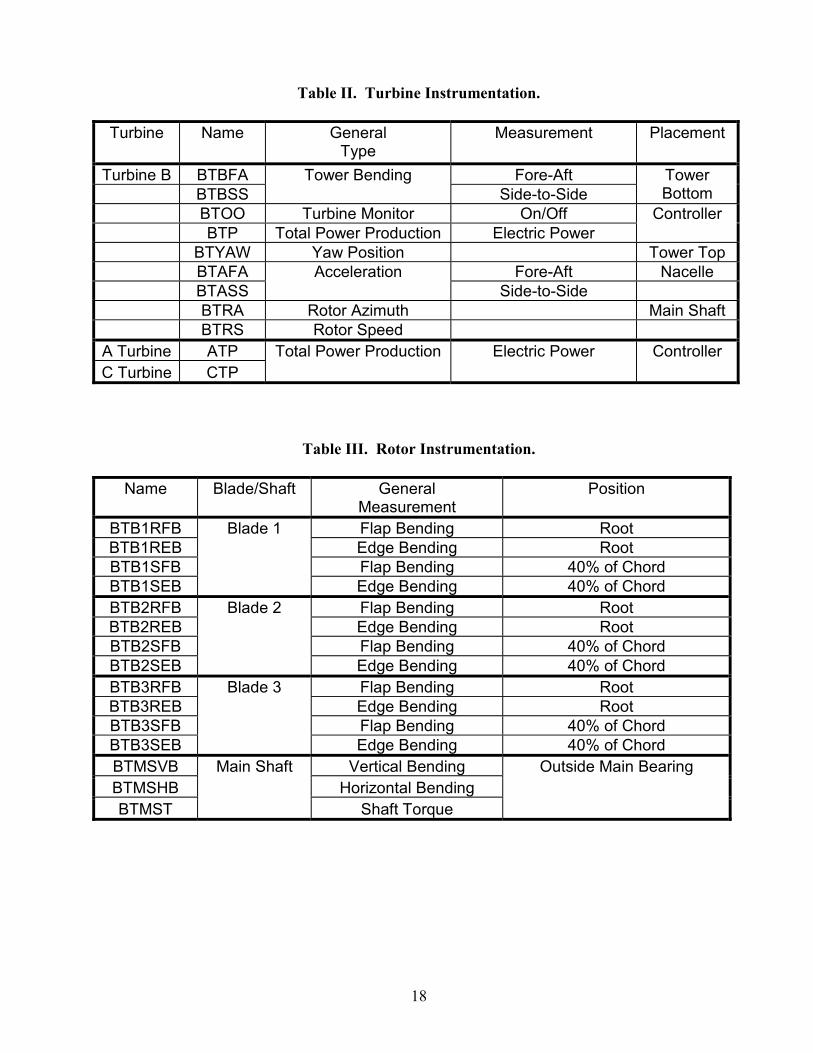
Table II. Turbine Instrumentation.
Turbine Name GeneralType
Measurement Placement
Turbine B BTBFA Fore-AftBTBSS
Tower BendingSide-to-Side
TowerBottom
BTOO Turbine Monitor On/OffBTP Total Power Production Electric Power
Controller
BTYAW Yaw Position Tower TopBTAFA Fore-Aft NacelleBTASS
AccelerationSide-to-Side
BTRA Rotor Azimuth Main ShaftBTRS Rotor Speed
A Turbine ATPC Turbine CTP
Total Power Production Electric Power Controller
Table III. Rotor Instrumentation.
Name Blade/Shaft GeneralMeasurement
Position
BTB1RFB Flap Bending RootBTB1REB Edge Bending RootBTB1SFB Flap Bending 40% of ChordBTB1SEB
Blade 1
Edge Bending 40% of ChordBTB2RFB Flap Bending RootBTB2REB Edge Bending RootBTB2SFB Flap Bending 40% of ChordBTB2SEB
Blade 2
Edge Bending 40% of ChordBTB3RFB Flap Bending RootBTB3REB Edge Bending RootBTB3SFB Flap Bending 40% of ChordBTB3SEB
Blade 3
Edge Bending 40% of ChordBTMSVB Vertical BendingBTMSHB Horizontal BendingBTMST
Main Shaft
Shaft Torque
Outside Main Bearing

19
Inflow InstrumentationThe inflow into the three turbines is heavily monitored with both sonic and cup anemometers
and with wind vanes, see Fig. 6. As noted above, this instrumentation is mounted on sixmeteorological towers. Figure 3 provides a detailed description of the position of eachmeteorological tower and its nomenclature. Appendix A provides a detailed diagram of eachtower.
Most of the anemometry is located at approximately 30.7 m (101 ft) upwind (with respect tothe prevailing wind) of the turbines. This dimension is equivalent to 1.9 diameters for thestandard Aerostar blade set and 1.8 diameters for the SERI blade set.
There are three towers directly in front of the LIST turbine, see Fig. 6. The center tower isdirectly upwind, with-respect-to the prevailing wind, of the LIST turbine. The other two towersare one rotor-disk radius to the left and right, respectively, of the center tower. Four cupanemometers are mounted to the center tower (designated the “Center Met Tower”): one ismounted at the height of the top of the rotor circle (hub height plus one rotor-disk radius), thesecond at the bottom of the rotor circle (hub height minus one rotor-disk radius), the third at hubheight and the fourth at approximately 1.6 m (5.1 ft) above ground level. A wind vane ismounted to this tower at hub height. Five sonic anemometers are also mounted to the threetowers. On the center tower, one each is mounted at the top, middle (hub height) and bottom ofthe rotor circle. On the other two towers, the anemometers are mounted at hub height. Thus, thesonic anemometers are mounted in a circular pattern equal to that of the turbine rotor 1.8diameters in front of the LIST turbine.
The inflow into the other two turbines is monitored with hub-height cup anemometers andwind vanes. They are located 1.9 rotor diameters, 30.5 m (102.6 ft), upwind of each turbine.
To monitor the secondary wind direction, a cup anemometer is mounted at hub height on atower that is located at approximately 30.3 m from the LIST turbine, see Fig. 3.
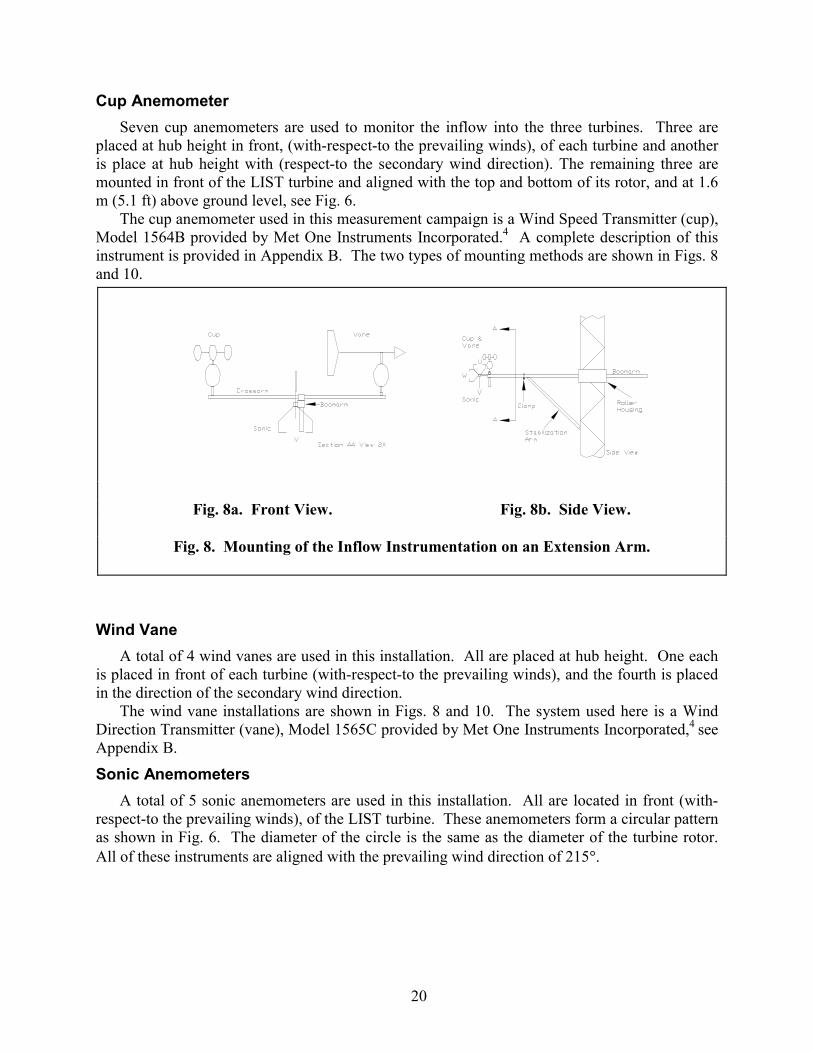
On the center meteorological tower, the inflow instrumentation is mounted on the end of anextension arm to preclude blockage effects of the tower, see Fig. 8. This extension or boom armholds the instrumentation approximately 2.4 m (7.9 ft), in front of the meteorological tower,with-respect-to the prevailing winds. This is equivalent to 5 anemometer tower diameters. Thearm is mounted in a roller support housing that permits the instrumentation to be rolled to thetower for maintenance. The arm is stabilized vertically and horizontally with 2 supportingbrackets. To place all of the anemometry in the same plane with-respect-to the prevailing winds,the center tower is set back to compensate for the extension provided by this boom, see Fig. 3.The inflow instrumentation on the other towers are mounted on the top of the tower, andtherefore no extension arms are required, see Figs. 9 and 10 for diagrams of typical installations.
20
Cup AnemometerSeven cup anemometers are used to monitor the inflow into the three turbines. Three are
placed at hub height in front, (with-respect-to the prevailing winds), of each turbine and anotheris place at hub height with (respect-to the secondary wind direction). The remaining three aremounted in front of the LIST turbine and aligned with the top and bottom of its rotor, and at 1.6m (5.1 ft) above ground level, see Fig. 6.
The cup anemometer used in this measurement campaign is a Wind Speed Transmitter (cup),Model 1564B provided by Met One Instruments Incorporated.4 A complete description of thisinstrument is provided in Appendix B. The two types of mounting methods are shown in Figs. 8and 10.
Wind VaneA total of 4 wind vanes are used in this installation. All are placed at hub height. One each
is placed in front of each turbine (with-respect-to the prevailing winds), and the fourth is placedin the direction of the secondary wind direction.
The wind vane installations are shown in Figs. 8 and 10. The system used here is a WindDirection Transmitter (vane), Model 1565C provided by Met One Instruments Incorporated,4 seeAppendix B.
Sonic AnemometersA total of 5 sonic anemometers are used in this installation. All are located in front (with-
respect-to the prevailing winds), of the LIST turbine. These anemometers form a circular patternas shown in Fig. 6. The diameter of the circle is the same as the diameter of the turbine rotor.All of these instruments are aligned with the prevailing wind direction of 215�.
Fig. 8a. Front View. Fig. 8b. Side View.
Fig. 8. Mounting of the Inflow Instrumentation on an Extension Arm.
21
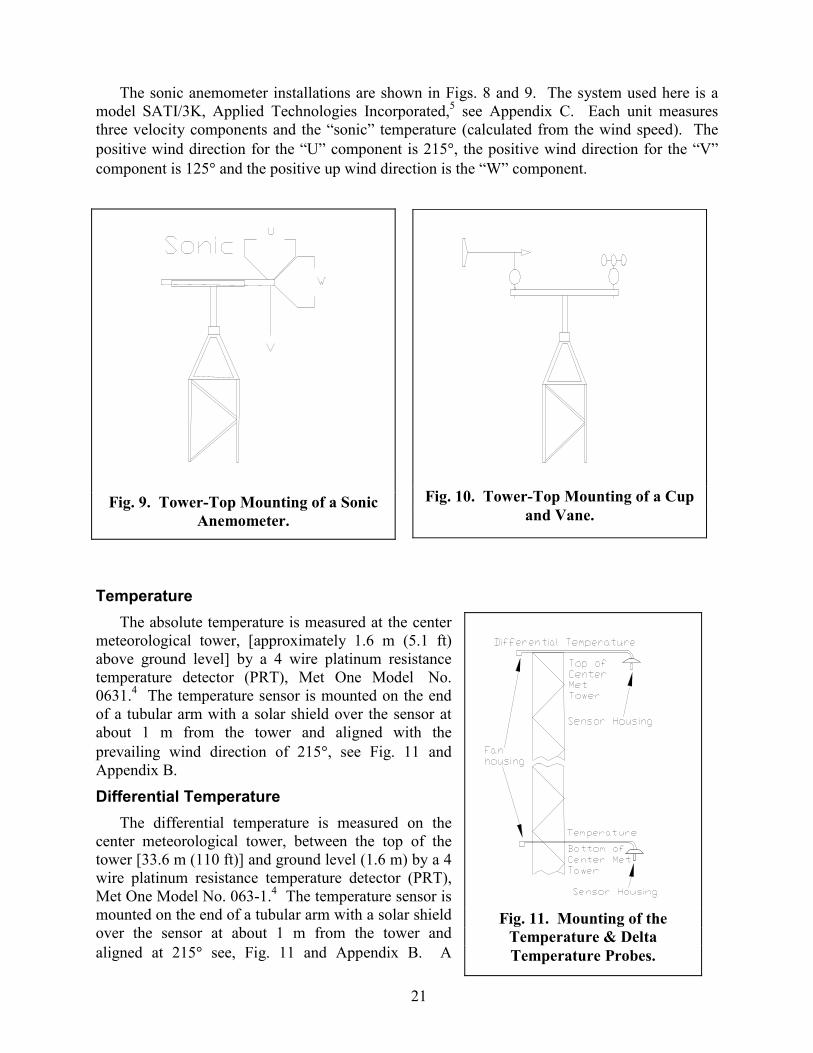
The sonic anemometer installations are shown in Figs. 8 and 9. The system used here is amodel SATI/3K, Applied Technologies Incorporated,5 see Appendix C. Each unit measuresthree velocity components and the “sonic” temperature (calculated from the wind speed). Thepositive wind direction for the “U” component is 215�, the positive wind direction for the “V”component is 125� and the positive up wind direction is the “W” component.
TemperatureThe absolute temperature is measured at the center
meteorological tower, [approximately 1.6 m (5.1 ft)above ground level] by a 4 wire platinum resistancetemperature detector (PRT), Met One Model No.0631.4 The temperature sensor is mounted on the endof a tubular arm with a solar shield over the sensor atabout 1 m from the tower and aligned with theprevailing wind direction of 215�, see Fig. 11 andAppendix B.
Differential TemperatureThe differential temperature is measured on the
center meteorological tower, between the top of thetower [33.6 m (110 ft)] and ground level (1.6 m) by a 4wire platinum resistance temperature detector (PRT),Met One Model No. 063-1.4 The temperature sensor ismounted on the end of a tubular arm with a solar shieldover the sensor at about 1 m from the tower andaligned at 215� see, Fig. 11 and Appendix B. A
Fig. 10. Tower-Top Mounting of a Cupand Vane.
Fig. 9. Tower-Top Mounting of a SonicAnemometer.
Fig. 11. Mounting of theTemperature & DeltaTemperature Probes.

22
positive differential temperature reading indicates that the temperature at the top of the rotor ishigher than the temperature at ground level.
Barometric PressureThe barometric pressure is measured at approximately 2.13 m (7 ft) above ground level,
inside the Instrument Building, see Appendix B, using a sensor manufactured by Yellow SpringInstruments.6
Structural InstrumentationThe structural response of the turbine is measured with a variety of gauges, primarily strain
gauges. A schematic of the structural gauges and their placement is shown in Fig. 7.Most of the strain gauge circuits are placed on the rotor. Each blade is instrumented at its
root and at the 40 percent span station with strain gauge sets that measure flap and edgewisebending. The tower is instrumented with bending gauge sets located approximately 3.9 m (154in) above the turbine base. These gauge sets measure tower bending fore-and-aft (along theprevailing wind direction) and side-to-side bending (across the prevailing wind direction). Themain shaft is instrumented with gauges that measure vertical and horizontal bending and torque.In addition two accelerometers are mounted in the nacelle to measure motion along and acrossthe primary axis of the nacelle.
All strain gauges were calibrated using static loading.
Strain Gauge CircuitsA total of 17 strain gauge circuits are used here, see Fig. 7. A complete list of these circuits
is given in Table IV. All circuits used here are full-bridges.
Blade Strain GaugesThe strain gauges are dual element encapsulated 1000-ohm gauges (Micro Measurements
WK-06-250PD-10C)7 located at 40% of span on each blade, see Fig. 7 and Appendix B.
Hub Strain GaugesThe strain gauges are dual element encapsulated 350-ohm gauges (Micro Measurements
WK-06-250PD-350)7 located on each arm of the hub, see Fig. 7. and Appendix B.
Main Shaft Strain GaugesThe strain gauges on the main shaft are single element 350 ohm encapsulated weldable
gauges. The bending circuits use Micro Measurements LWK-06-250B-350 and the torquecircuit use LWK-06-250D-350.7 The bending gauges were orientated on the main shaft toprovide vertical and horizontal bending with-respect-to Blade 1 in the vertical position, see Fig.7, see Appendix B.
A problem was encountered with the main shaft gauges. When the three turbines weremodified to their current configurations, the diameter of the main shaft was increased using asleeve. When strain gauges were placed on the sleeve, they did not provide consistent readingsbecause the sleeve has some motion relative to the underlying (original) main shaft. Thus,accurate measurements of shaft bending are not provided by this instrumentation. However,these gauges are in place and are being monitored to demonstrate capabilities and to ascertain ifuseful data may be obtained from them.
23
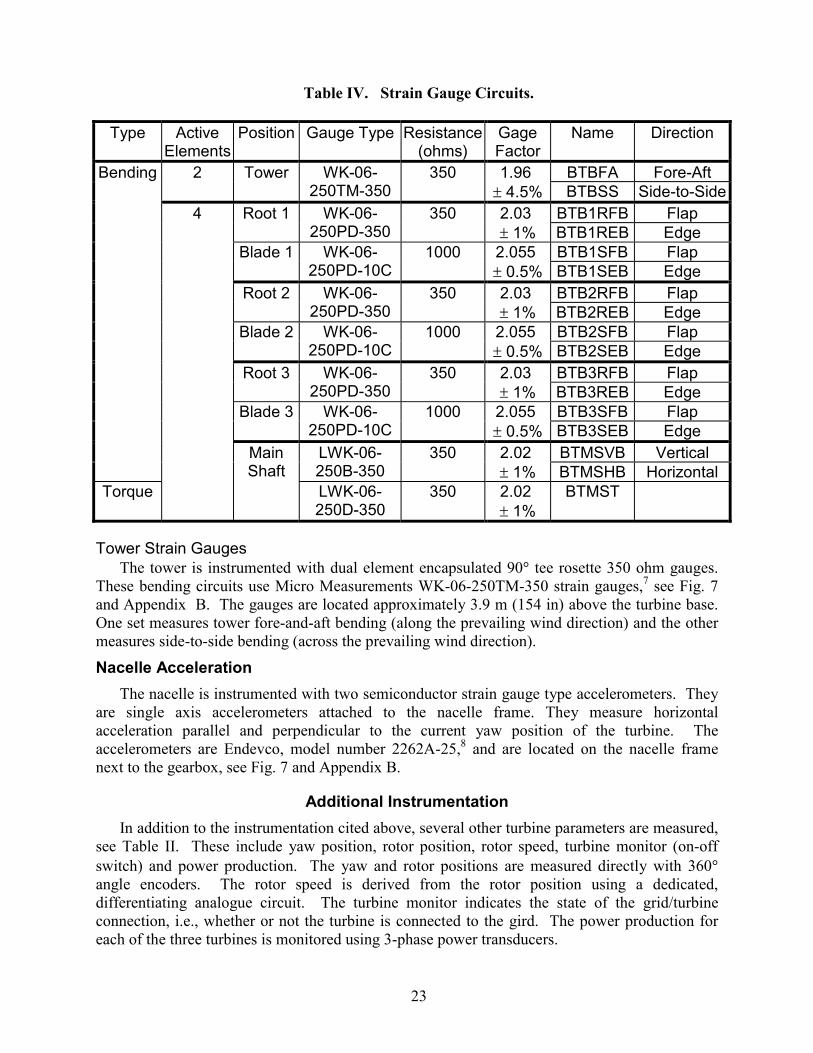
Table IV. Strain Gauge Circuits.
Type ActiveElements
Position Gauge Type Resistance(ohms)
GageFactor
Name Direction
2 BTBFA Fore-AftTower WK-06-250TM-350
350 1.96 � 4.5% BTBSS Side-to-Side
BTB1RFB FlapRoot 1 WK-06-250PD-350
350 2.03 � 1% BTB1REB Edge
BTB1SFB FlapBlade 1 WK-06-250PD-10C
1000 2.055 � 0.5% BTB1SEB Edge
BTB2RFB FlapRoot 2 WK-06-250PD-350
350 2.03 � 1% BTB2REB Edge
BTB2SFB FlapBlade 2 WK-06-250PD-10C
1000 2.055 � 0.5% BTB2SEB Edge
BTB3RFB FlapRoot 3 WK-06-250PD-350
350 2.03 � 1% BTB3REB Edge
BTB3SFB FlapBlade 3 WK-06-250PD-10C
1000 2.055 � 0.5% BTB3SEB Edge
BTMSVB Vertical
Bending
LWK-06-250B-350
350 2.02 � 1% BTMSHB Horizontal
Torque
4
MainShaft
LWK-06-250D-350
350 2.02 � 1%
BTMST
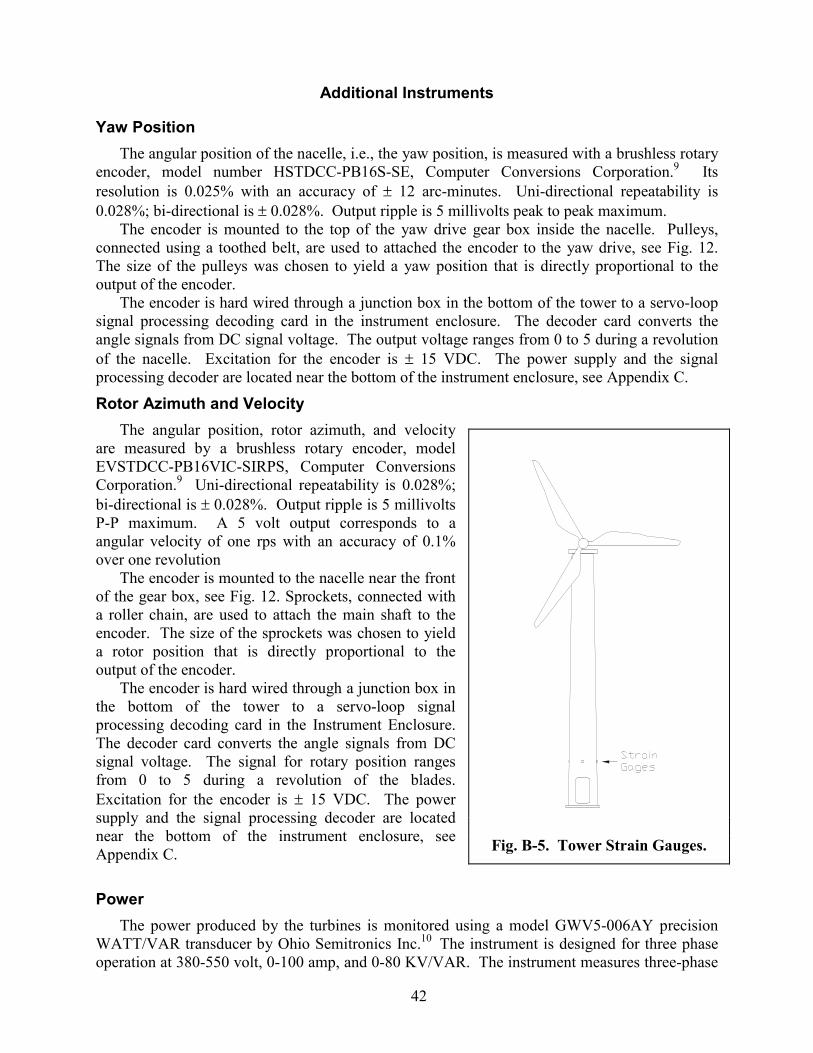
Tower Strain GaugesThe tower is instrumented with dual element encapsulated 90� tee rosette 350 ohm gauges.
These bending circuits use Micro Measurements WK-06-250TM-350 strain gauges,7 see Fig. 7and Appendix B. The gauges are located approximately 3.9 m (154 in) above the turbine base.One set measures tower fore-and-aft bending (along the prevailing wind direction) and the othermeasures side-to-side bending (across the prevailing wind direction).
Nacelle AccelerationThe nacelle is instrumented with two semiconductor strain gauge type accelerometers. They
are single axis accelerometers attached to the nacelle frame. They measure horizontalacceleration parallel and perpendicular to the current yaw position of the turbine. Theaccelerometers are Endevco, model number 2262A-25,8 and are located on the nacelle framenext to the gearbox, see Fig. 7 and Appendix B.
Additional InstrumentationIn addition to the instrumentation cited above, several other turbine parameters are measured,
see Table II. These include yaw position, rotor position, rotor speed, turbine monitor (on-offswitch) and power production. The yaw and rotor positions are measured directly with 360�angle encoders. The rotor speed is derived from the rotor position using a dedicated,differentiating analogue circuit. The turbine monitor indicates the state of the grid/turbineconnection, i.e., whether or not the turbine is connected to the gird. The power production foreach of the three turbines is monitored using 3-phase power transducers.
24
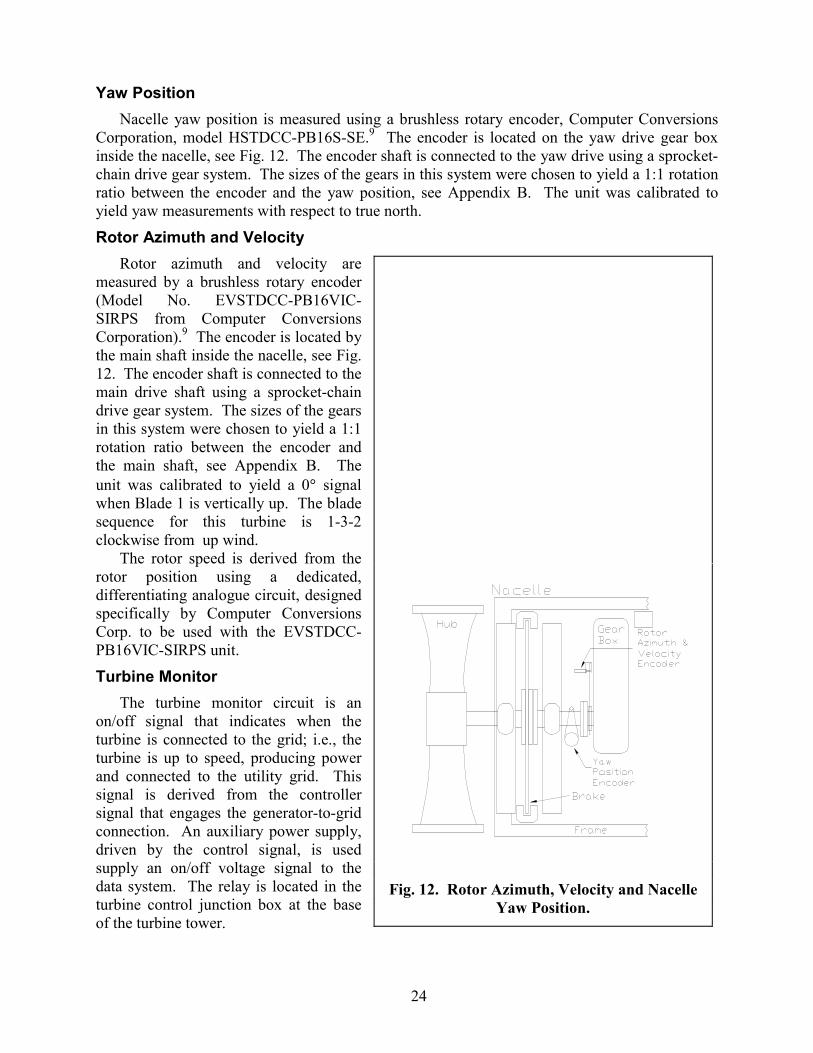
Yaw PositionNacelle yaw position is measured using a brushless rotary encoder, Computer Conversions
Corporation, model HSTDCC-PB16S-SE.9 The encoder is located on the yaw drive gear boxinside the nacelle, see Fig. 12. The encoder shaft is connected to the yaw drive using a sprocket-chain drive gear system. The sizes of the gears in this system were chosen to yield a 1:1 rotationratio between the encoder and the yaw position, see Appendix B. The unit was calibrated toyield yaw measurements with respect to true north.
Rotor Azimuth and VelocityRotor azimuth and velocity are
measured by a brushless rotary encoder(Model No. EVSTDCC-PB16VIC-SIRPS from Computer ConversionsCorporation).9 The encoder is located bythe main shaft inside the nacelle, see Fig.12. The encoder shaft is connected to themain drive shaft using a sprocket-chaindrive gear system. The sizes of the gearsin this system were chosen to yield a 1:1rotation ratio between the encoder andthe main shaft, see Appendix B. Theunit was calibrated to yield a 0� signalwhen Blade 1 is vertically up. The bladesequence for this turbine is 1-3-2clockwise from up wind.
The rotor speed is derived from therotor position using a dedicated,differentiating analogue circuit, designedspecifically by Computer ConversionsCorp. to be used with the EVSTDCC-PB16VIC-SIRPS unit.
Turbine MonitorThe turbine monitor circuit is an
on/off signal that indicates when theturbine is connected to the grid; i.e., theturbine is up to speed, producing powerand connected to the utility grid. Thissignal is derived from the controllersignal that engages the generator-to-gridconnection. An auxiliary power supply,driven by the control signal, is usedsupply an on/off voltage signal to thedata system. The relay is located in theturbine control junction box at the baseof the turbine tower.
Fig. 12. Rotor Azimuth, Velocity and NacelleYaw Position.
25
Power ProductionThe power produced by each of the three turbines is monitored using precision self-powered
voltage, watt VAR, and current tranducers from Ohio Semitronics.10 For this installation, onlythe total power (3-phase) is being recorded. However, current instrumentation also permitsmeasurement of the power and voltage on the individual phases, the current and the VARS. Aswarranted, additional measurements may or may not be added to the data record. One each ofthese instruments is located in the turbine control junction boxes at the base of each turbinetower, see Appendix B.
DATA ACQUISITION SYSTEM
Berg, Rumsey and Zayas11 have developed the unique data acquisition and analysis systemused on these turbines. The hardware system, called ATLAS, (Accurate, Time-Linked DataAcquisition System), is designed to acquire long-term, continuous, time synchronized, multi-channel time series data from an operating wind turbine. The 16-bit data stream from theATLAS hardware system is acquired and recorded using the Advanced Data Acquisition System(ADAS) II software. ADAS II segments the data into 10-minute blocks, converts the data toengineering units, and stores them for future processing. The final step in the acquisition ofcontinuous data is handled by the Smart Data Acquisition System (SDAS) which automaticallyarchives the data and provides the researcher with the tools needed to organize and process thedata.
For this series of experiments, the data rate was chosen to be 30 Hz. This yields a Nyquistfrequency of 15 Hz, which is sufficient for capturing the behavior of the inflow and the structuralresponse of the turbine.
ATLASFor this experiment, 3 data acquisition units are used in the ATLAS. The first two are
ground-based units (GBU’s) that are hard-wired together. These units are located in theInstrument Enclosure near the base of Turbine B, see Fig. 2. The third is a rotor-based unit(RBU) that is mounted to the rotor.
The GBU’s are mounted to the top of the “Instrumentation Rack” inside the InstrumentEnclosure, see Appendix C. These two units are wired in a master/slave combination. Theymonitor the instrument circuits cited in Tables I and II; i.e., all instruments except the straingauge circuits on the rotor. For this test series, the slave unit is sampling all of the analog dataand the master unit is sampling the strain gauge and accelerometer data. The former is filled tocapacity with five 8-channel analog cards, and the latter contains a single 8-channel bridgecircuit card. The bridge and analog circuits use a second-order anti-aliasing active filterfollowed by a programmable fifth-order Butterworth filter. The cut-off frequency for the latterfilter was set to 15 Hz, the Nyquist frequency.
The rotor strain gauges are monitored with the RBU. This unit, called “WINDY,” containsthree 8-channel bridge circuit cards that monitor the strain gauge circuits described in Table III.These cards are identical to the one used in the master GBU. Data from the RBU are telemeteredto the master GBU. The GBU integrates the RBU data stream into the main data stream to forma single data stream that is then transmitted to the system computer (running ADAS II software).
All three units are timed using GPS synchronized clocks. This timing technique insures thatthe clocks in the RBU and the GBU’s are maintained within 1 microsecond of each other.

26
A total of 75 channels (timing, measurement and synchronizing channels) is monitored withthis system.
All of these units are programmed using ATLAS software package developed by Berg,Rumsey and Zayas.11 The ATLAS program is run on the main PC that downloads the dataacquisition program to the ATLAS units over a fiber optic connection. The RBU has anadditional capability that permits it to be programmed via a telemetry link.

27
ADAS IIThe data stream from ATLAS is acquired by the ADAS II data acquisition system. This
system is run on a dedicated PC using a specialized version of the original code developed forNREL. The current version is designed to acquire and store continuous time-series data from theATLAS hardware.
The PC is located in the Control Building, see Fig. 2. It was originally hard wired to themaster GBU. However, to provide additional lightening protection, the hard-wired connectionhas been replaced with a fiber optic link.
ADAS II acquires the data from the ATLAS system in a PCM format. It then decodes thesedata, converts them into engineering units via a user-defined calibration table, and records thedata to hard disk. Each data file is assigned a unique name based upon the date and time the datawas acquired. All data files are stored in a collimated ASCII format. A header file is includedwith each data file and contains all of the pertinent information, including the calibration tablethat belongs to that specific data file.
The ADAS II system is takes a continuous stream that is divided into 10-minute blocks forconvenience. All data acquisition and data archival activities are accomplished with no loss ofdata between the data blocks.
Data ArchivalThe ADAS PC is networked to a data archival PC, also located in the Control Building. This
PC automatically reads each 10-minute ADAS II data file, after it has been stored to disk. It then“zips” the file and stores it on a large hard disk. When the process is completed, the original fileis removed from the ADAS PC to free space for forthcoming data files.
Approximately once a week the site engineer downloads the zipped data files to C-DR’s forpermanent storage and analysis. When complete, the archived files are removed from the harddisk to free space for the next set of data files.
28
WIRING DIAGRAMS
The 60 instrument channels that are monitored in this measurement campaign are hardwiredto one of the three ATLAS units. The myriad of cables and function boxes that are required topower and monitor the instrumentation are described here. Appendix C presents a complete setof the wiring diagrams for each cable and junction box.
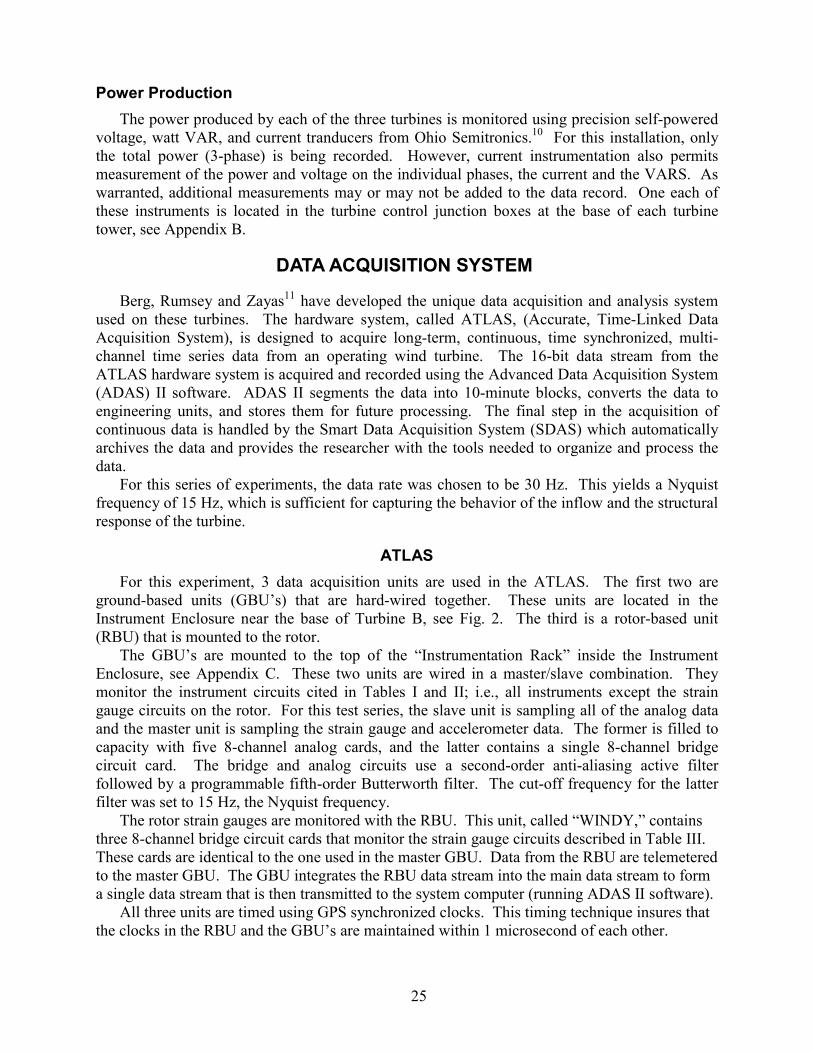
Instrument EnclosureThe confluence of the wires, “black boxes,” power supplies, lightening protection, terminal
strips and telemetry signals takes place in the Instrument Enclosure, see Fig. 13. To insuremaximum protection of the instrumentation, this enclosure is sealed to protect the instrumentsfrom rain, dust, rodents, etc. Most of the hard-wired circuits into and out of the enclosure areprotected with lightening protection. The instrument enclosure is a large electrical junction box1.83 m (6 ft) wide by 1.83 m (6 ft) high by 0.61 m (2 ft) deep with circulation fans andenvironment seals around its doors.
The enclosure is located in a small metal shed near the base of Turbine B, see Fig. 2. Theshed is heated and cooled by a wall-mounted heat pump.
The enclosure is divided into two primary sections. The left side contains a slide-outinstrument rack for mounting the data system and associated black boxes (converters) and powersupplies. The rack is mounted on slides to permit the rack to be pulled out for easy access tofront and rear control panels and wiring connections. The right side contains connection boardsand the lightening protection.
The enclosure also houses auxiliary power supplies and the uninterruptible power supply(UPS) unit that supplies ACpower to all of theinstrumentation and datasystems.
The instrument rack,instrument enclosure and theinstrument building all aregrounded through a groundinggrid that is connected to theturbine towers, meteorologicaltowers, guy wires, and test sitebuildings, see Appendix D.
Lightening ProtectionBecause the Bushland site is
often subject to severe lightningstorms, particular attention waspaid to protecting the systemfrom lightning damage. Thefirst line of defense was theplacement of an extensiveground grid that circled the siteand each piece of equipment,see Appendix D. All grounds Fig. 13. Instrument Enclosure.

29
and shields are connected to this ground grid.Almost all of the electrical leads into and out of the enclosure are protected with commercial
high-speed gas tube/diode lightning protection circuits (Citel Inc.).12 The specifications for thesecircuits are in Appendix C. The only circuit without lightning protection is a low-power datareception antenna lead connected to the data system.
The data acquisition system (located in the Instrument Enclosure) was originally connectedto its controlling computer (located in the Control Building, see Fig. 2) via a hard wireconnection. However, this link proved susceptible to lightning. To alleviate this problem and togain added electrical isolation for the instruments inside the enclosure and for the computers inthe control room, the hard wire connection was replaced with a fiber optic link (Fiberplex).13
All circuits in the data acquisition system on the rotor are protected using commercial high-speed gas tube/diode lightning protection circuits (Citel Inc.).
CablesA large array of cables is used to power and monitor the various instruments. These cables
were laid in conduits that range over the site, see Appendix D. All of the instrumentation cablesare 18-gauge twisted-pair cables with an overall shield and ground wires. In addition to thecables used for this measurement campaign, additional cables were laid in selected conduits tosupport future measurement campaigns on these turbines. A complete list of the instrumentcables is provided in Tables V, VI and VII. Wiring diagrams for these cables is provided inAppendix C.
Power cables used to connect the instrument building, center meteorological tower, and theturbines to the grid are laid in conduit separate from the conduit used for the instrumentationcables. The AC power cables are listed in Table VIII. Wiring diagrams and specifications areprovided in Appendix D.
Appendix D also provides conduit schedules for the cable system.
Table V. Turbine Instrument Cables.
Turbine Instrument CablesTurbine Name Description Routing
ATI1 15 Pair cable Turbine A to Instrument EnclosureATI2 15 Pair cable (spare) Turbine A to Instrument Enclosure
Turbine A
ATI3 15 Pair cable (spare) Turbine A to Instrument EnclosureBTI1 15 Pair cable Turbine B to Instrument EnclosureBTI2 15 Pair cable (spare) Turbine B to Instrument Enclosure
Turbine B
BTI3 15 Pair cable (spare) Turbine B to Instrument EnclosureCTI1 15 Pair cable Turbine C to Instrument EnclosureCTI2 15 Pair cable (spare) Turbine C to Instrument Enclosure
Turbine C
CTI3 15 Pair cable (spare) Turbine C to Instrument Enclosure
30
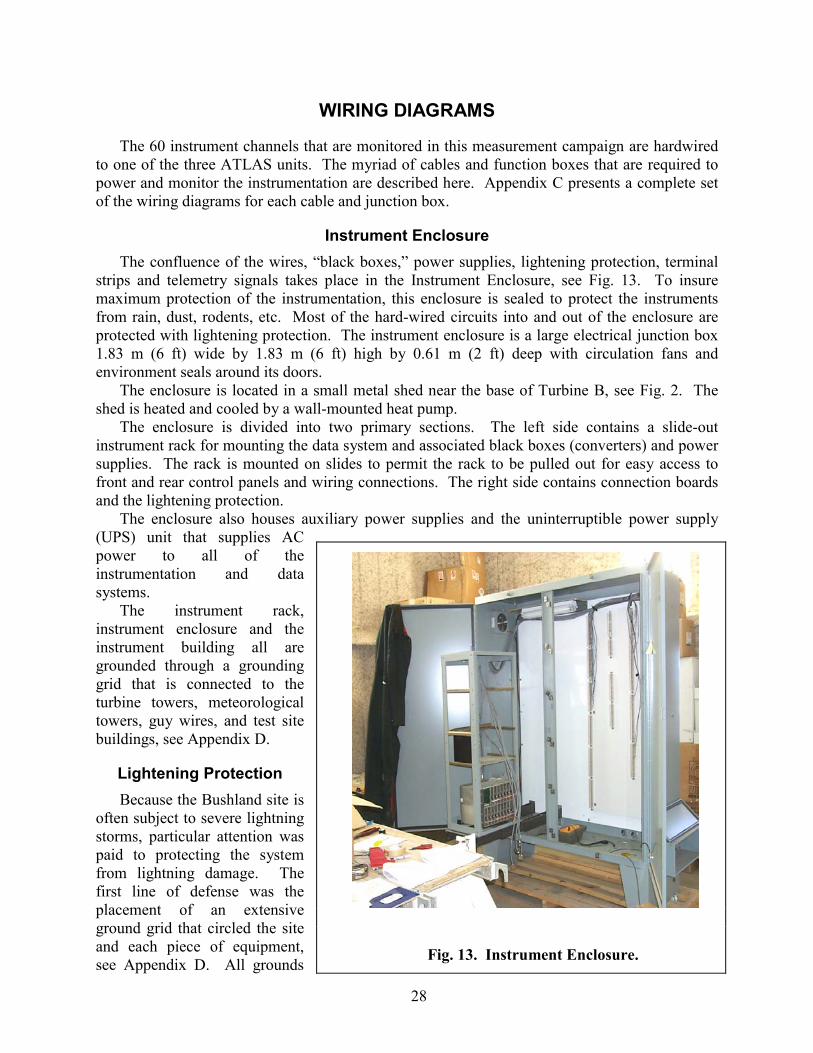
Table VI. Inflow Instrumentation Cables.
Inflow Instrument CablesMet Tower Name Description Routing
BACI1 15 Pair cable Center Met Tower to Instrument EnclosureBACI2 15 Pair cable Center Met Tower to Instrument Enclosure
Center MetTower
BACI3 15 Pair cable (spare) Center Met Tower to Instrument EnclosureNorth Met
TowerBANI 9 Pair cable North Met Tower to Center Met. Tower
South MetTower
BASI 9 Pair cable South Met Tower to Center Met. Tower
Far NorthMet Tower
AANI 9 Pair cable Far North Met Tower to Instrument Enclosure
Far SouthMet Tower
CASI 9 Pair cable Far South Met Tower to InstrumentEnclosure
Off Axis Met Tower
OANI 9 Pair cable Off Axis Met Tower to Instrument Enclosure
Table VII. Data Acquisition and Turbine Control Cables.
Data Acquisition CablesControl Building Name Description Routing
Junction. Box ECI1 15 Pair cableJunction. Box ECI2 15 Pair cableJunction. Box ECI3 15 Pair cableJunction. Box ECI4 9 Pair cable (spare)
Control Building to InstrumentEnclosure
Junction. Box ECI5 6 Pair cableJunction. Box ECIO1 Fiber OpticJunction. Box ECIO2 Fiber Optic (spare)
Table VIII. AC Power Cables.
AC Power CablesTurbine Name Description Routing
Turbine A ATP 4 ea. # 1 & 3 ea. # 10 Main Switch to Turbine ATurbine B BTP 4 ea. # 1 & 3 ea. # 10 Main Switch to Turbine BTurbine B BEP 6 ea. # 10 Transformer in Turbine B to Inst. Bldg.Turbine B BACP 3 ea. # 10 Transformer in Turbine B to Center
Met TowerTurbine C CTP 4 ea. # 1 and 3 ea. # 10 Main Switch to Turbine C

31
Junction BoxesAt intermediate junctions, the instrumentation cables were connected to one another at
various junction boxes typically placed at the base of the towers. The location of these boxes isoutlined in Appendix D and a wiring diagram for each is provided in Appendix C.
Ground GridAn extensive ground grid was placed about the site. Each turbine, each meteorological tower
and its top guy-wires, the control building and the instrument enclosure are all tied to this grid.The ground for the power grid is also tied to this grid. A diagram of this grid is presented inAppendix D.
CONCLUDING REMARKS
This report describes the instrumentation and infrastructure that has been developed tomonitor the LIST & BMI turbines and their inflow at the Bushland test site. It also provides adetailed reference manual for those who choose to use these data in their studies of wind turbinebehavior.

32
REFERENCES
1. Sutherland, H.J., P.L Jones, and B. Neal, “The Long-Term Inflow and Structural TestProgram,” 2001 ASME Wind Energy Symposium, 2001, in publication.
2. BMI, Blade Manufacturing Initiative, Sandia National Laboratories, Albuquerque, NM.
3. Tangler, J., National Renewable Energy Laboratory, National Wind Technology Center,private communication.
4. Met One, Met One Instruments Inc., Grants Pass, Oregon
5. Applied Technologies, Applied Technologies Inc., Longmont, Co.
6. Yellow Springs Instrument, Inc., Yellow Spring, OH.
7. Micro Measurements, Vishay Measurements Group Inc., Micro Measurements Division,Raleigh NC.
8. Endevco, Endevco Corporation, San Juan Capistrano, Ca.
9. Computer Conversions, Computer Conversions Corporation, East Northport, NY.
10. Ohio Semitronics, Ohio Semitronics Inc., Hilliard, Ohio
11. Berg, D.E., M.A. Rumsey and J.R. Zayas, “Hardware and Software Developments for theAccurate Time-Linked Data Acquisition System,” 2000ASME Wind Energy Symposium, 200, p.306.
12. Citel Inc. Citel Inc., Miami, Fl.
13. Fiberplex, Fiberplex Inc,. Annapolis, Md.
14. Tower Systems, Watertown, South Dakota.
33
APPENDIX A
DETAILED DIAGRAMS OF THE METEOROLOGICAL TOWERS
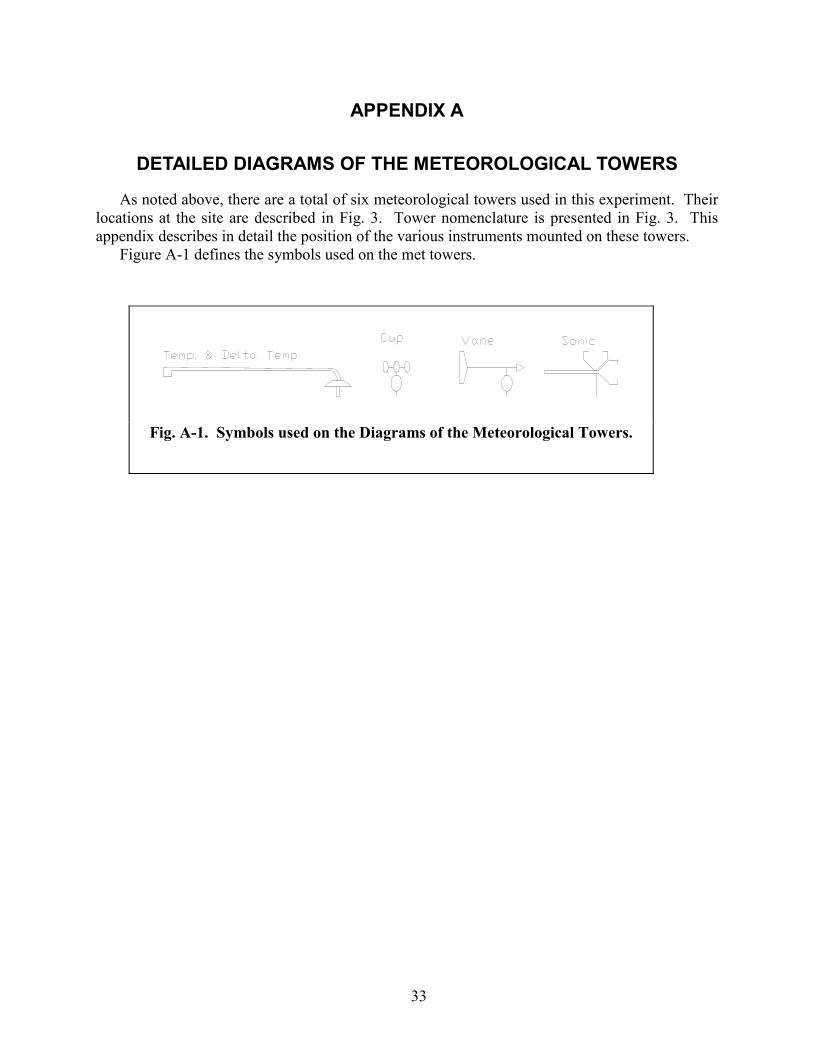
As noted above, there are a total of six meteorological towers used in this experiment. Theirlocations at the site are described in Fig. 3. Tower nomenclature is presented in Fig. 3. Thisappendix describes in detail the position of the various instruments mounted on these towers.
Figure A-1 defines the symbols used on the met towers.
Fig. A-1. Symbols used on the Diagrams of the Meteorological Towers.
34
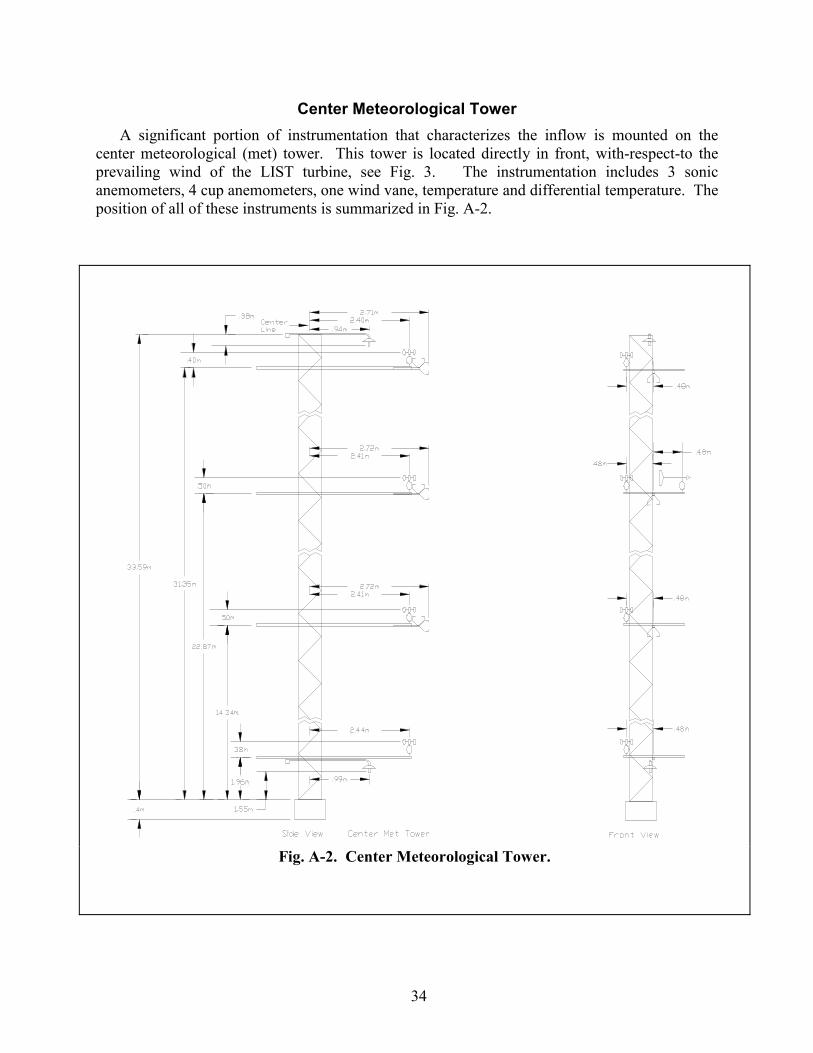
Center Meteorological TowerA significant portion of instrumentation that characterizes the inflow is mounted on the
center meteorological (met) tower. This tower is located directly in front, with-respect-to theprevailing wind of the LIST turbine, see Fig. 3. The instrumentation includes 3 sonicanemometers, 4 cup anemometers, one wind vane, temperature and differential temperature. Theposition of all of these instruments is summarized in Fig. A-2.
Fig. A-2. Center Meteorological Tower.
35
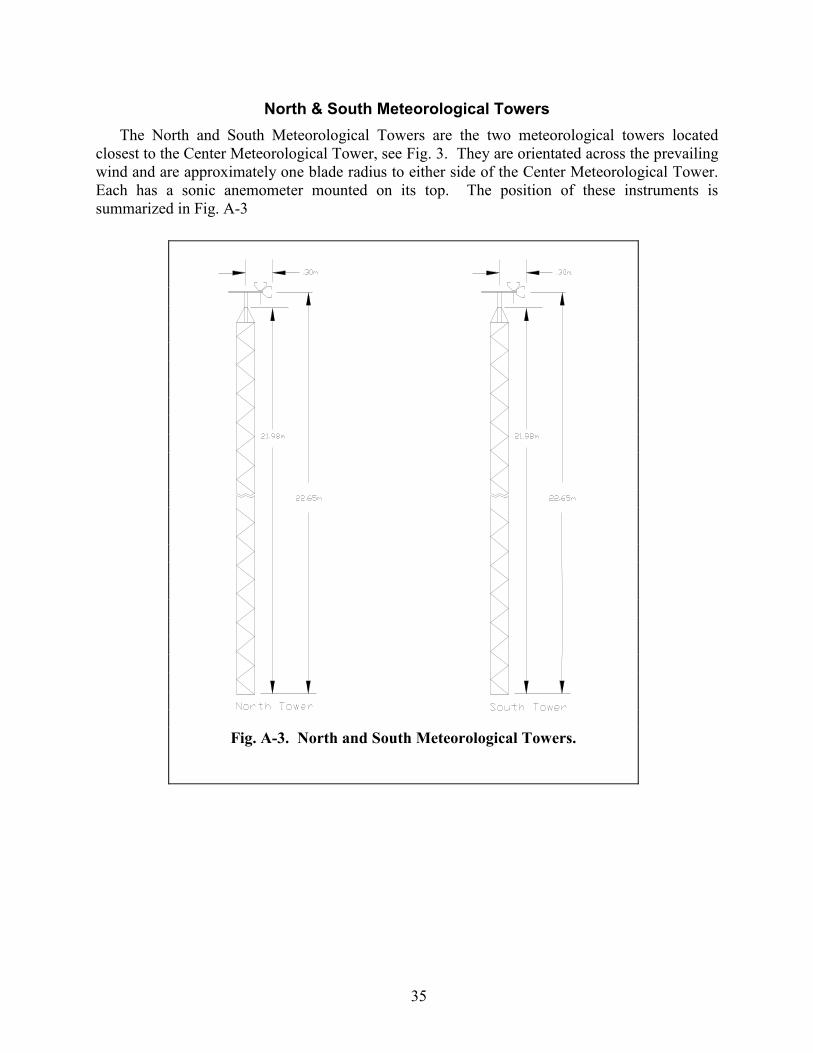
North & South Meteorological TowersThe North and South Meteorological Towers are the two meteorological towers located
closest to the Center Meteorological Tower, see Fig. 3. They are orientated across the prevailingwind and are approximately one blade radius to either side of the Center Meteorological Tower.Each has a sonic anemometer mounted on its top. The position of these instruments issummarized in Fig. A-3
Fig. A-3. North and South Meteorological Towers.
36
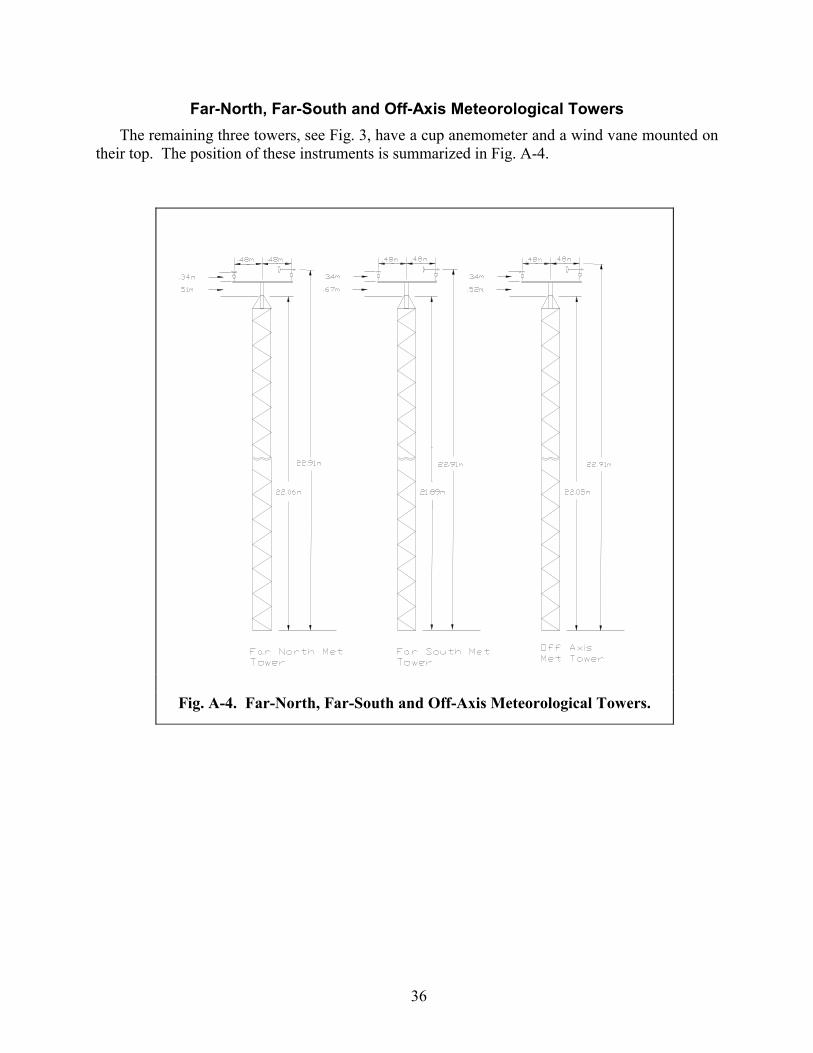
Far-North, Far-South and Off-Axis Meteorological TowersThe remaining three towers, see Fig. 3, have a cup anemometer and a wind vane mounted on
their top. The position of these instruments is summarized in Fig. A-4.
Fig. A-4. Far-North, Far-South and Off-Axis Meteorological Towers.

37
APPENDIX B
INSTRUMENTATION SPECIFICATIONS
A complete list of the instrumentation circuits is given in Tables I, II and III. This appendixdescribes the instruments, their specification and their placement.
Met One InstrumentationMet One Instruments Incorporated4 wind speed, wind direction, temperature, differential
temperature and atmospheric pressure sensors are used here for the “standard” characterizationof the inflow. The electronic packages that drive and process these sensors are rack mountedunits that are located in the Instrument Enclosure, see Appendix C.
The accuracy of the wind speed processor is � 0.1� of full scale and the accuracy of thewind direction processor is � 0.1� of full scale.
Cup-and-Vane AnemometryCup Anemometer
Met One Model 1564B Wind Speed Transmitters4 (cup) are used here for standard horizontalwind speed measurements. The accuracy of the instrument is � 0.067 m/s or 1� whichever isgreater. The wind speed sensor uses highly reliable solid state optical sensing that ispermanently aligned. The output of the sensor, a variable frequency signal is sent to the signalprocessor. The output of the signal processor is an analog 0 to 5 VDC signal. For thisinstallation, a 5 VDC output calibrates to a corresponding wind speed of 44.7 m/s (100 mph).
The cup anemometers are hard wired through junction boxes at the base of the met towers tothe instrument enclosure. The signal processors for all of the cup anemometers are mounted inthe bottom section of the instrumentation rack in the instrument enclosure inside theinstrumentation building, see Appendix C.
Wind VaneMet One Model 1565C Wind Direction Transmitters4 (vane) are used for the standard
horizontal wind direction measurements. The accuracy of the instrument is � 2 �. The outputof the sensor is a constant amplitude variable phase signal that is sent to the signal processor.The output of the signal processor is an analog 0 to 5 VDC signal, with 5 VDC corresponding toa full rotation of the probe.
The vanes are hard wired through junction boxes at the base of the met towers to theinstrument enclosure. The signal processors for all of the cup anemometers are mounted in thebottom section of the instrumentation rack in the instrument enclosure inside the instrumentationbuilding, see Appendix C.
Mounting HardwareOn the Center Tower, the cups and vanes are mounted on cross arms that rotate 360�
horizontally and adjust 0.52 m (1.5 ft.) vertically. The cross arms are mounted at the endextendable boom arms made of aluminum tubing 5.08 cm (2 inches)square by 0.635 cm (0.25inch) wall by 3.048 m (10 ft.) long. The boom arms are mounted on the tower end in a rollerhousing (Tower Systems Inc.)14 that allows the boom arm to roll in and out of the roller housing.
38
The arm is braced with 5.08 cm (2-inch) aluminum angle attached at the tower and clamped atabout 1.22 m (4 ft.) out on the arm, see Fig. 8.
On the other towers (Far-North, Far-South and Off-Axis), the cup and vane cross-arms aremounted directly to the top of the tower, see Fig. 10.
Temperature MeasurementsAbsolute Temperature
The temperature is measured at approximately 1.6 m (5.1 ft) above ground level by a 4-wireplatinum resistance temperature detector (PRT), Met One Model No. 063-1.4 The PRT producesa large output resistance change for a small input temperature change. The range of the PRT is�50�C with a quoted linearity of �0.15�C and an accuracy of �0.1�C. The output of the signalprocessor is an analog 0 to 5 VDC signal, with 0 volts corresponding to -50�C and 5 VDCcorresponding to 50�C.
The temperature sensor is hard wired through a junction box at the base of the Center Towerto the instrument enclosure. The signal processor is mounted in the bottom section of theinstrumentation rack in the instrument enclosure inside the instrumentation building, seeAppendix C.
Differential TemperatureThe differential temperature is measured between the top of the rotor [33.6 m (110 ft)], and
the ground level temperature [1.6 m (5.1 ft.)], with two 4 wire platinum resistance temperaturedetectors (PRT), Met One Model No. 063-1,4 see the discussion above (the lower differentialtemperature sensor is also the temperature sensor). The two signals are processed using adifferential signal processor. The output of the signal processor is an analog 0 to 5 VDC signal,with 0 volts corresponding to -5�C and 5 VDC corresponding to 15�C.
The temperature sensors are hard wired through a junction box at the base of the CenterTower to the instrument enclosure. The signal processor is mounted in the bottom section of theinstrumentation rack in the instrument enclosure inside the instrumentation building, seeAppendix C.
Mounting HardwareThe temperature sensors are mounted on the end a tubular arm with a solar shield over the
sensor at about 1 m from the tower and aligned with the prevailing wind direction of 215�, seeFig. 11. The temperature sensor is kept at ambient temperature by a 110 VAC fan at the oppositeend of the tubular arm. Air is drawn over the sensor and exits at the fan end. The tubular arm isheld in place by “U” bolts that attach it to the tower. The PRT is hard wired to a junction box atthe base of the met tower and then wired to the instrument enclosure.
Barometric PressureThe barometric pressure is measured at approximately 2.13 m (7 ft) above ground level,
inside the instrument building. The instrument is a Yellow Springs Instrument Inc. Model 2014-75/1050.6 The instrument range is 74.5 to 105 kPa with an accuracy of � 0.125% of full scale.
The sensor is hard wired directly to the instrument enclosure. A Met One4 signal processor isused to monitor this gauge. The processor is mounted in the bottom section of theinstrumentation rack in the instrument enclosure inside the instrumentation building, seeAppendix C.
39
Sonic AnemometerFive each Applied Technologies Incorporated Sonic Anemometer/thermometers5 model
SATI/3K, are used here for the “detailed” inflow measurements. Each of these units measuresthree velocity components (two horizontal, U and V, and one vertical, W) and the sonictemperature. Their accuracy is � 0.05 m/sec on wind velocity and � 1� above 2 m/sec on winddirection, � 0.05� C on sonic temperature, and �2� absolute temperature. Resolution is 0.01m/sec on wind velocity, 0.1� on wind direction, and 0.01� C on temperature. The sample rate is200 Hz with 12 bit resolution digital output. The output of its analogue signal processor rangesfrom -5 VDC to +5 VDC. For the U and V components of wind speed, 5 volts corresponds to a50 m/s (111.85 mph) wind speed. For W, it corresponds to 15 m/s (33.55 mph).
The sonic anemometers are hard wired through junction boxes at the base of the met towersto the instrument enclosure. The signal processors for the sonic anemometers are mounted in themiddle of the instrumentation rack, see Appendix C.
The sonic anemometers on the Center Tower are mounted on extendable boom arms made ofaluminum tubing 5.08 cm (2 inches) square by 0.635 cm (0.25 inch) wall by 3.048 m (10 ft.)long. The boom arms are mounted at the tower in a roller housing (Tower Systems Inc.)14
allowing for the arm to freely roll in and out. The arm is braced with 5.08 cm (2-inch) aluminumangle attached at the tower with “U” bolts and clamped at about 1.22 m (4 ft.) out on the armwith a toggle clamp, see Fig. 8. The sonic anemometers on the North and South Towers aremounted on the top of the tower on 2-inch steel angle and held in place with “U” bolts, see Fig.9.
Strain GaugesA total of 17 strain gauge circuits and two accelerometers are used here to monitor the
structural performance of the LIST turbine, see Fig. 7. A complete list of the strain gaugecircuits is given in Table IX. All of these circuits use full bridges built from strain gaugesmanufactured by Micro Measurements (Measurements Group).7 The accelerometers, Endevcomodel number 2262A-25,8 use bridge circuits to monitor the acceleration of the nacelle.
The strain gauge circuits use internal bridge card circuitry in the ATLAS units.11 Thiscircuitry supplies both the excitation voltages and the balancing circuits for the strain gaugebridges. For the circuits used here, excitation voltages are � 5, � 3.75 or � 2.5 VDC. Themonitoring circuits used multipliers of 2000, 1000 or 50. The choice of excitation voltage andmultiplier for each circuit was based on the excited output of that circuit. Offsets for themonitoring circuits were set individually.
All strain-gauge circuits were calibrated using static pull tests with ATLAS reading thecircuit output. Back-up calibrations were conducted using a Micro Measurements Digital StrainIndicator, Model P-3500.7
The strain-gauge circuits that are mounted to components of the rotor were hard wired toWINDY, the rotor-based unit of ATLAS.11 Wire runs for gauges on the hub and the main shaftwere approximately one meter long. For the blade gauges, the runs were approximately of 4.5 m(14.76 ft). As these distances are relatively short, the excitation voltage was monitored atWINDY, rather than at the bridge. The gauges mounted to the tower are hard-wired to one of theGBU’s in the Instrument Enclosure. As this run is approximately of 35 m (114.84 ft), theexcitation voltage to each bridge was monitored at the “completion tabs” for the bridge, using the“6-wire” bridge circuit capabilities of the ATLAS bridge circuit cards.
The accelerometers are also strain-gauge circuitry. The two used here are hard-wired to oneof the GBU’s in the Instrument Enclosure. As this run is approximately 45 m (147.65 ft), the
40
excitation voltage was monitored using the “6-wire” bridge circuit configuration. An excitationvoltage of 2.5 VDC with a 500 multiplier was used for these instruments.
Blade GaugesEach turbine blade on the LIST turbine was instrumented with two bending strain circuits
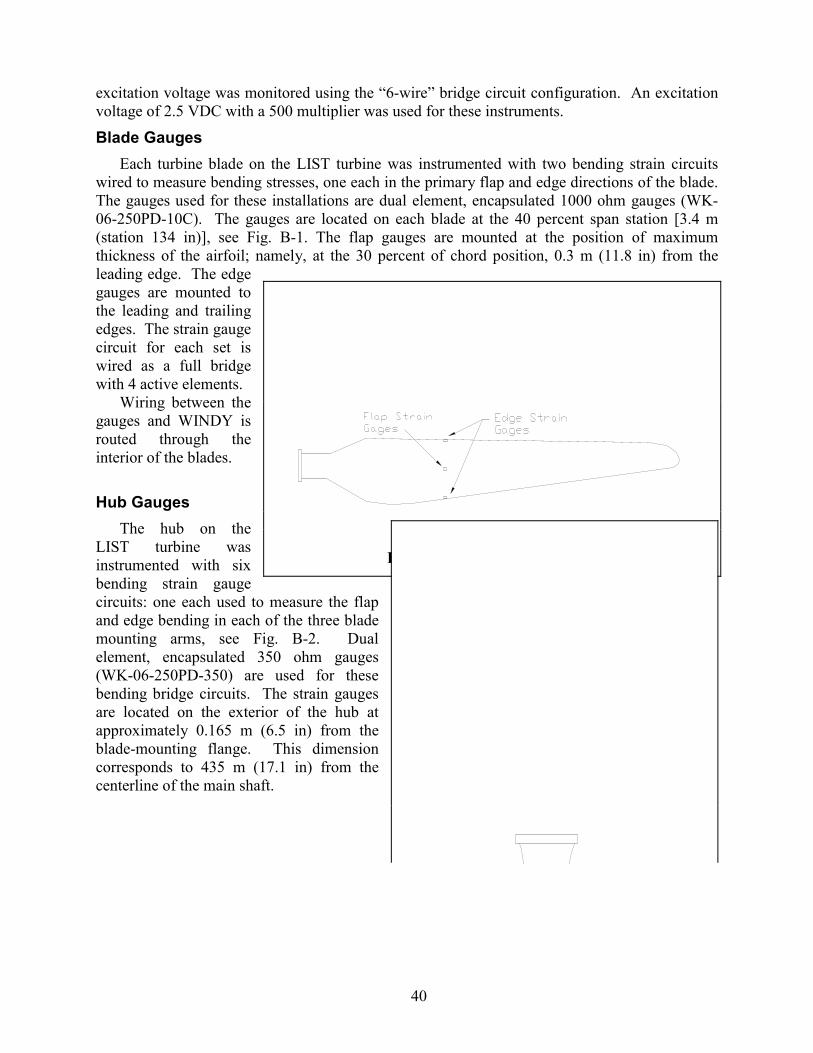
wired to measure bending stresses, one each in the primary flap and edge directions of the blade.The gauges used for these installations are dual element, encapsulated 1000 ohm gauges (WK-06-250PD-10C). The gauges are located on each blade at the 40 percent span station [3.4 m(station 134 in)], see Fig. B-1. The flap gauges are mounted at the position of maximumthickness of the airfoil; namely, at the 30 percent of chord position, 0.3 m (11.8 in) from theleading edge. The edgegauges are mounted tothe leading and trailingedges. The strain gaugecircuit for each set iswired as a full bridgewith 4 active elements.
Wiring between thegauges and WINDY isrouted through theinterior of the blades.
Hub GaugesThe hub on the
LIST turbine wasinstrumented with sixbending strain gaugecircuits: one each used to measure the flapand edge bending in each of the three blademounting arms, see Fig. B-2. Dualelement, encapsulated 350 ohm gauges(WK-06-250PD-350) are used for thesebending bridge circuits. The strain gaugesare located on the exterior of the hub atapproximately 0.165 m (6.5 in) from theblade-mounting flange. This dimensioncorresponds to 435 m (17.1 in) from thecenterline of the main shaft.
Fig. B-1. Blade Strain Gauges.
41
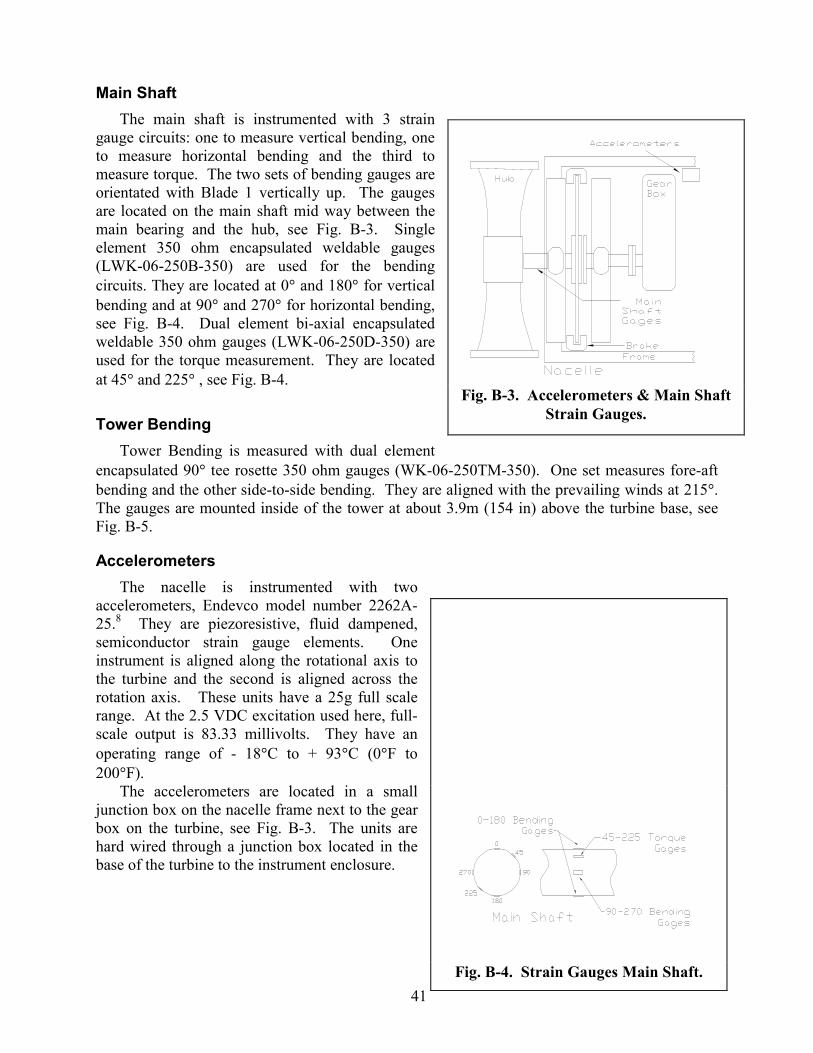
Main ShaftThe main shaft is instrumented with 3 strain
gauge circuits: one to measure vertical bending, oneto measure horizontal bending and the third tomeasure torque. The two sets of bending gauges areorientated with Blade 1 vertically up. The gaugesare located on the main shaft mid way between themain bearing and the hub, see Fig. B-3. Singleelement 350 ohm encapsulated weldable gauges(LWK-06-250B-350) are used for the bendingcircuits. They are located at 0� and 180� for verticalbending and at 90� and 270� for horizontal bending,see Fig. B-4. Dual element bi-axial encapsulatedweldable 350 ohm gauges (LWK-06-250D-350) areused for the torque measurement. They are locatedat 45� and 225� , see Fig. B-4.
Tower BendingTower Bending is measured with dual element
encapsulated 90� tee rosette 350 ohm gauges (WK-06-250TM-350). One set measures fore-aftbending and the other side-to-side bending. They are aligned with the prevailing winds at 215�.The gauges are mounted inside of the tower at about 3.9m (154 in) above the turbine base, seeFig. B-5.
AccelerometersThe nacelle is instrumented with two
accelerometers, Endevco model number 2262A-25.8 They are piezoresistive, fluid dampened,semiconductor strain gauge elements. Oneinstrument is aligned along the rotational axis tothe turbine and the second is aligned across therotation axis. These units have a 25g full scalerange. At the 2.5 VDC excitation used here, full-scale output is 83.33 millivolts. They have anoperating range of - 18�C to + 93�C (0�F to200�F).
The accelerometers are located in a smalljunction box on the nacelle frame next to the gearbox on the turbine, see Fig. B-3. The units arehard wired through a junction box located in thebase of the turbine to the instrument enclosure.
Fig. B-3. Accelerometers & Main ShaftStrain Gauges.
Fig. B-4. Strain Gauges Main Shaft.
42
Additional Instruments
Yaw PositionThe angular position of the nacelle, i.e., the yaw position, is measured with a brushless rotary
encoder, model number HSTDCC-PB16S-SE, Computer Conversions Corporation.9 Itsresolution is 0.025% with an accuracy of � 12 arc-minutes. Uni-directional repeatability is0.028%; bi-directional is � 0.028%. Output ripple is 5 millivolts peak to peak maximum.
The encoder is mounted to the top of the yaw drive gear box inside the nacelle. Pulleys,connected using a toothed belt, are used to attached the encoder to the yaw drive, see Fig. 12.The size of the pulleys was chosen to yield a yaw position that is directly proportional to theoutput of the encoder.
The encoder is hard wired through a junction box in the bottom of the tower to a servo-loopsignal processing decoding card in the instrument enclosure. The decoder card converts theangle signals from DC signal voltage. The output voltage ranges from 0 to 5 during a revolutionof the nacelle. Excitation for the encoder is � 15 VDC. The power supply and the signalprocessing decoder are located near the bottom of the instrument enclosure, see Appendix C.
Rotor Azimuth and VelocityThe angular position, rotor azimuth, and velocity
are measured by a brushless rotary encoder, modelEVSTDCC-PB16VIC-SIRPS, Computer ConversionsCorporation.9 Uni-directional repeatability is 0.028%;bi-directional is � 0.028%. Output ripple is 5 millivoltsP-P maximum. A 5 volt output corresponds to aangular velocity of one rps with an accuracy of 0.1%over one revolution
The encoder is mounted to the nacelle near the frontof the gear box, see Fig. 12. Sprockets, connected witha roller chain, are used to attach the main shaft to theencoder. The size of the sprockets was chosen to yielda rotor position that is directly proportional to theoutput of the encoder.
The encoder is hard wired through a junction box inthe bottom of the tower to a servo-loop signalprocessing decoding card in the Instrument Enclosure.The decoder card converts the angle signals from DCsignal voltage. The signal for rotary position rangesfrom 0 to 5 during a revolution of the blades.Excitation for the encoder is � 15 VDC. The powersupply and the signal processing decoder are locatednear the bottom of the instrument enclosure, seeAppendix C.
PowerThe power produced by the turbines is monitored using a model GWV5-006AY precision
WATT/VAR transducer by Ohio Semitronics Inc.10 The instrument is designed for three phaseoperation at 380-550 volt, 0-100 amp, and 0-80 KV/VAR. The instrument measures three-phase
Fig. B-5. Tower Strain Gauges.

43
voltage and current and total power and VAR (Volts Amps Reactive). For this installation, theunit is only used to monitor the total power produced by the turbine. A 5 VDC output from thetransducer is equal to 600 VAC and 4000 WATT/VAR with an accuracy of � 0.2% of readingand � 0.05% full scale.
The non-contact current transformers (coils), the primary sensors used by this instrument, areplaced around the 3-phase, 480-volt power wires that connect the turbine generator to the grid.The coils, located inside the turbine control panel at the base of the turbine, are hard wired to amonitoring unit also located inside the control panel. The units are hard wired through thejunction box in the base turbine to the Instrument Enclosure.
Control SwitchThe Control Switch is a signal that indicates when the turbine is up to speed, producing
power and connected to the utility grid. Using the controller signal that connects the generator tothe grid, an auxiliary relay is used supply an on/off signal. A 5 VDC power supply output isswitched through the relay to provide the on/off signal to the data acquisition system. The relayand the power supply are located in the turbine control junction box in the base of the turbinetower.
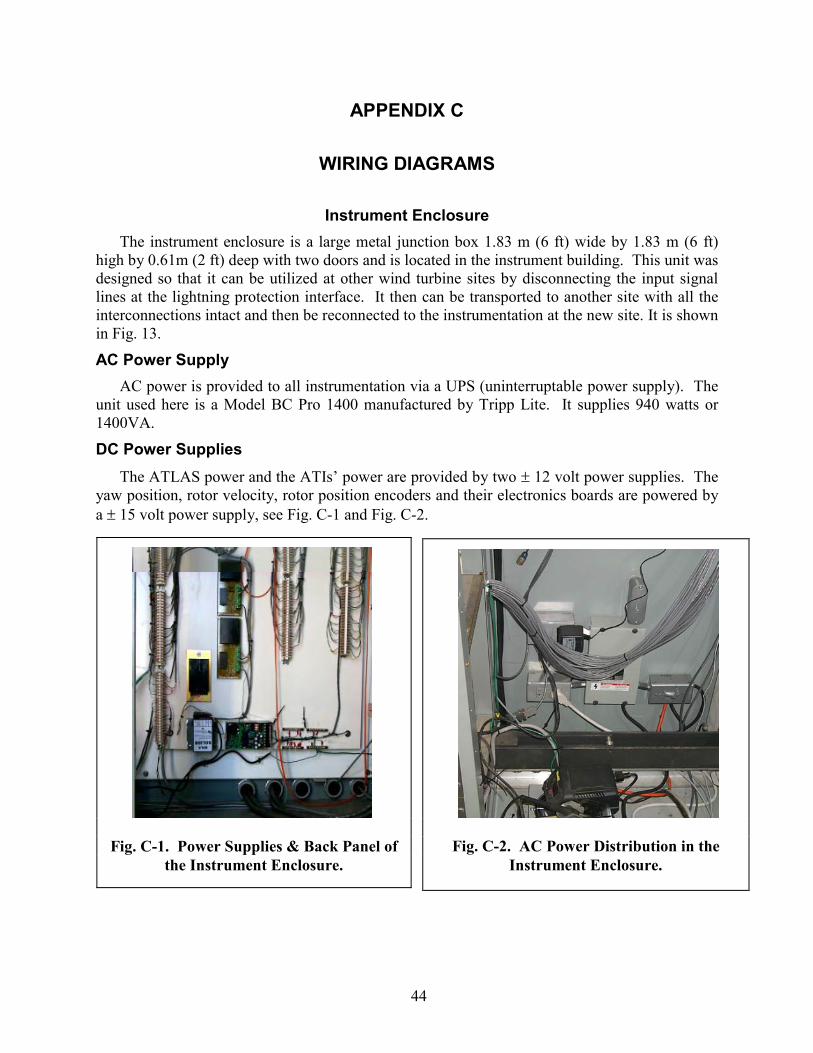
44
APPENDIX C
WIRING DIAGRAMS
Instrument EnclosureThe instrument enclosure is a large metal junction box 1.83 m (6 ft) wide by 1.83 m (6 ft)
high by 0.61m (2 ft) deep with two doors and is located in the instrument building. This unit wasdesigned so that it can be utilized at other wind turbine sites by disconnecting the input signallines at the lightning protection interface. It then can be transported to another site with all theinterconnections intact and then be reconnected to the instrumentation at the new site. It is shownin Fig. 13.
AC Power SupplyAC power is provided to all instrumentation via a UPS (uninterruptable power supply). The
unit used here is a Model BC Pro 1400 manufactured by Tripp Lite. It supplies 940 watts or1400VA.
DC Power SuppliesThe ATLAS power and the ATIs’ power are provided by two � 12 volt power supplies. The
yaw position, rotor velocity, rotor position encoders and their electronics boards are powered bya � 15 volt power supply, see Fig. C-1 and Fig. C-2.
Fig. C-2. AC Power Distribution in theInstrument Enclosure.
Fig. C-1. Power Supplies & Back Panel ofthe Instrument Enclosure.
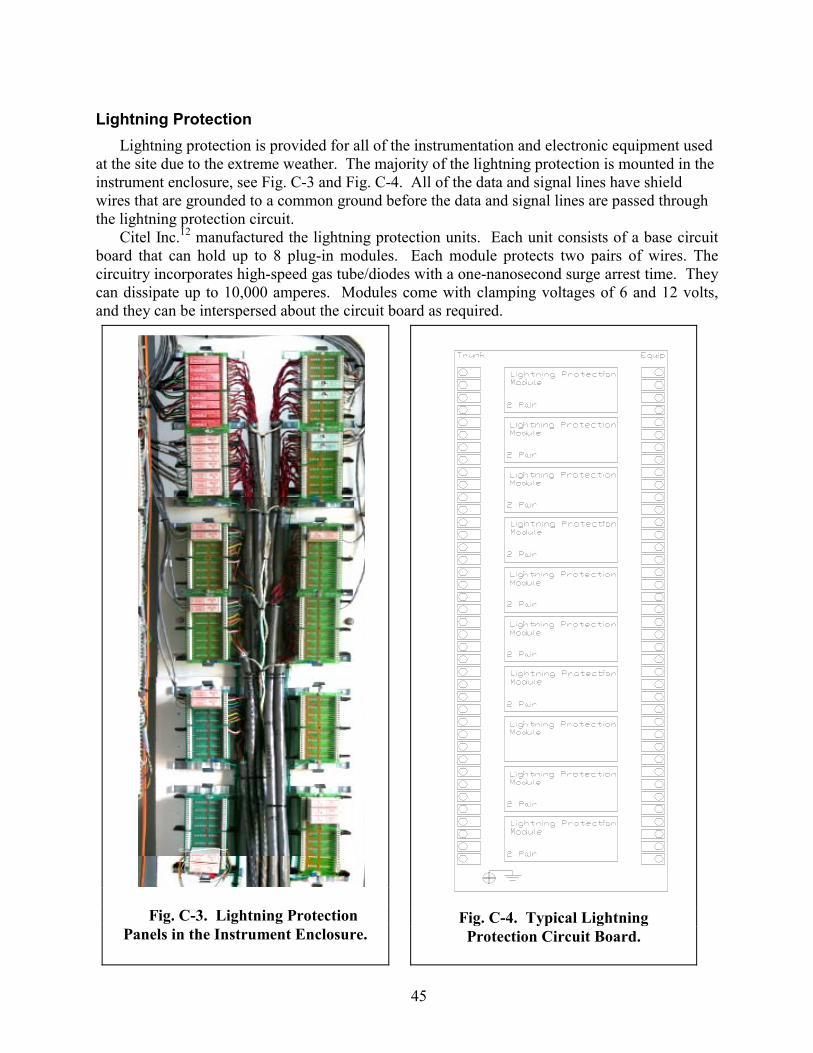
45
Lightning ProtectionLightning protection is provided for all of the instrumentation and electronic equipment used
at the site due to the extreme weather. The majority of the lightning protection is mounted in theinstrument enclosure, see Fig. C-3 and Fig. C-4. All of the data and signal lines have shieldwires that are grounded to a common ground before the data and signal lines are passed throughthe lightning protection circuit.
Citel Inc.12 manufactured the lightning protection units. Each unit consists of a base circuitboard that can hold up to 8 plug-in modules. Each module protects two pairs of wires. Thecircuitry incorporates high-speed gas tube/diodes with a one-nanosecond surge arrest time. Theycan dissipate up to 10,000 amperes. Modules come with clamping voltages of 6 and 12 volts,and they can be interspersed about the circuit board as required.
Fig. C-4. Typical LightningProtection Circuit Board.
Fig. C-3. Lightning ProtectionPanels in the Instrument Enclosure.

46
Instrument Rack
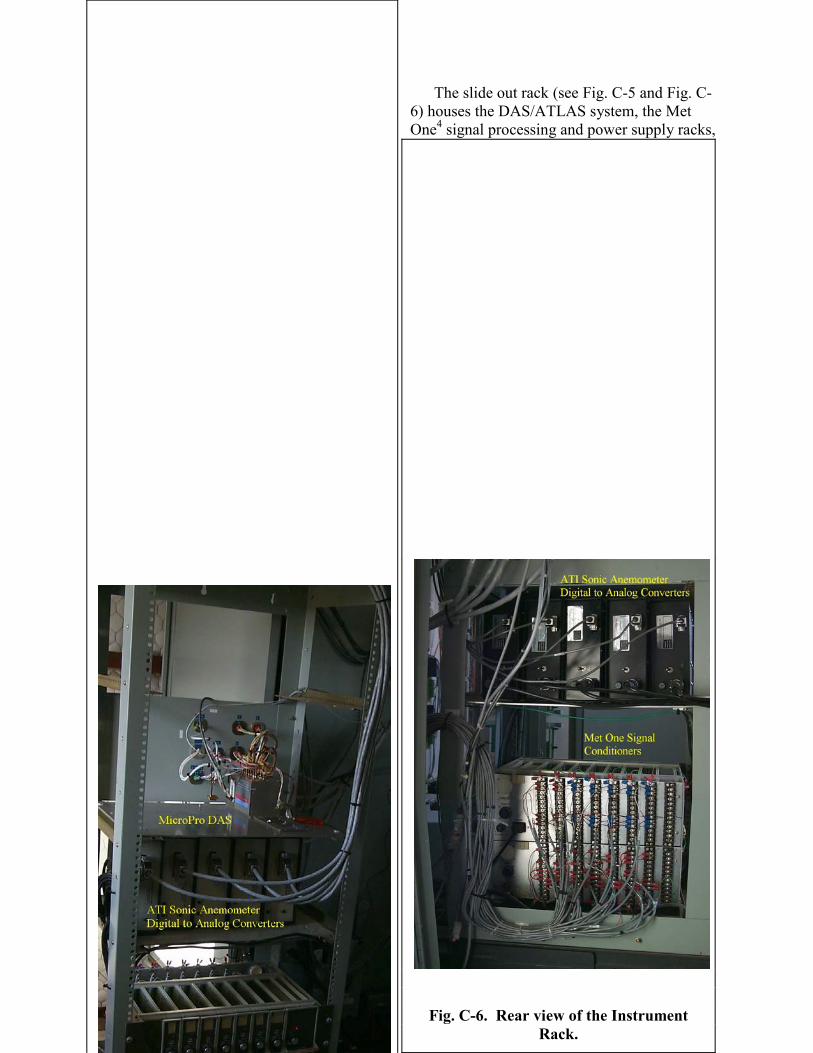
47
The slide out rack (see Fig. C-5 and Fig. C-6) houses the DAS/ATLAS system, the MetOne4 signal processing and power supply racks,
Fig. C-6. Rear view of the InstrumentRack.

48
and the ATI sonic anemometers digital-to-analog converters. Power strips located in the bottomof the rack provide AC power. The rack is on slides that allow the rack to move in and out 24inches to gain access to the front and back of the rack and the AC power distribution located onthe left wall of the enclosure.

49
Turbine Junction Boxes and Wiring
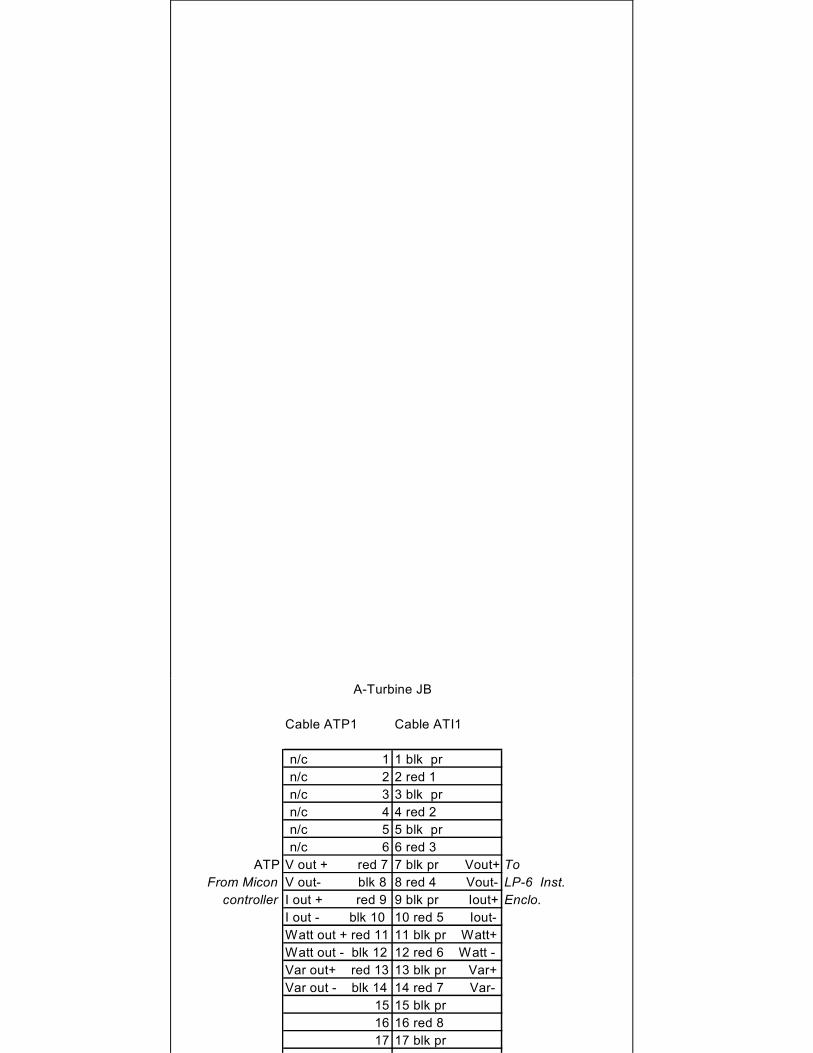
50
Cable ATP1 Cable ATI1
n/c 1 1 blk prn/c 2 2 red 1n/c 3 3 blk prn/c 4 4 red 2n/c 5 5 blk prn/c 6 6 red 3
ATP V out + red 7 7 blk pr Vout+ ToFrom Micon V out- blk 8 8 red 4 Vout- LP-6 Inst.
controller I out + red 9 9 blk pr Iout+ Enclo.I out - blk 10 10 red 5 Iout-Watt out + red 11 11 blk pr Watt+Watt out - blk 12 12 red 6 Watt -Var out+ red 13 13 blk pr Var+Var out - blk 14 14 red 7 Var-
15 15 blk pr16 16 red 817 17 blk pr
A-Turbine JB

51
Turbine A Junction BoxThe junction box at the base of Turbine A connects the instrument that monitors the power
produced by this turbine to the Instrument Enclosure. Cable ATP1 is connected to cable ATI1 inthis junction box. Cable ATI1 is connected to the lightning protection in the InstrumentEnclosure, see Fig. C-7. Spare wires in the cables are terminated on the terminal strips.
Turbine B Junction Box
The junction box for Turbine B contains the turbine power monitoring wiring, yaw nacelleposition, rotor velocity & position, nacelle accelerations fore-and-aft and side-to-side, towerstrain fore-and-aft and side-to-side, and turbine-state (on/off), see Fig. C-8. Cables BTI1 andBTI2 connect this junction box to the lightning protection in the Instrument Enclosure.
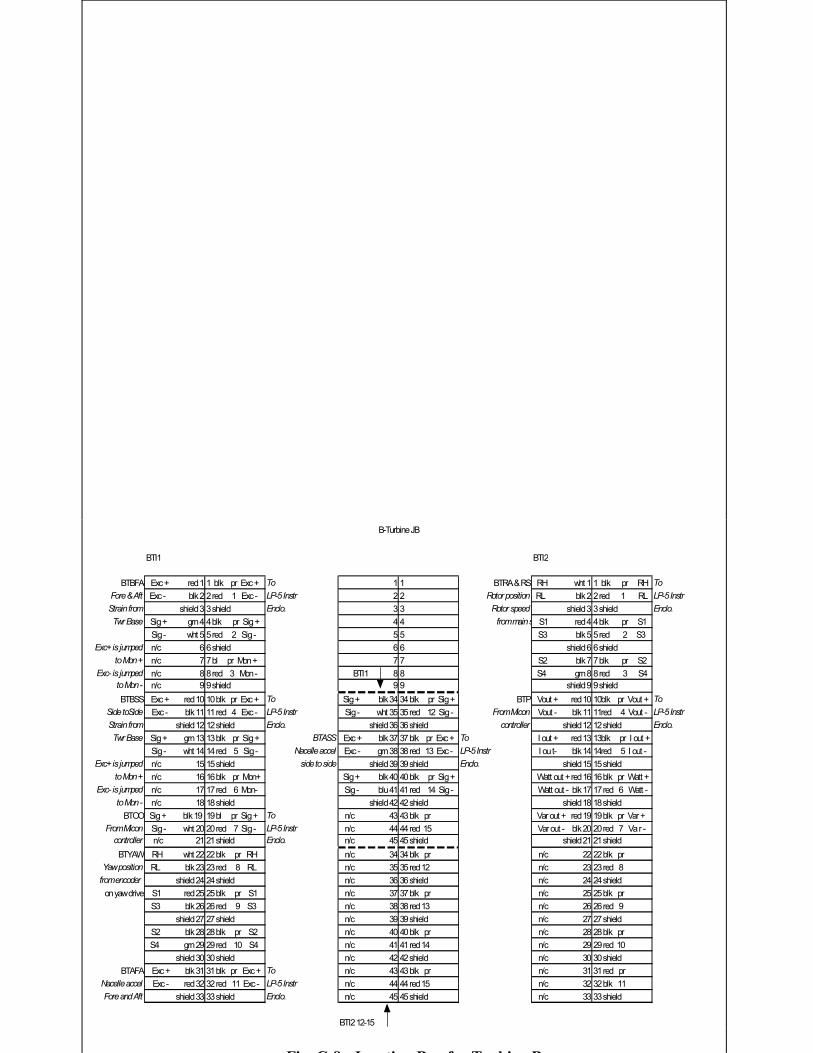
52
BTBFA Exc + red 1 1 blk pr Exc + To 1 1 BTRA & RS RH wht 1 1 blk pr RH To
Fore & Aft Exc - blk 2 2 red 1 Exc - LP-5 Instr 2 2 Rotor position RL blk 2 2 red 1 RL LP-5 Instr
Strain from shield 3 3 shield Enclo. 3 3 Rotor speed shield 3 3 shield Enclo.
Twr Base Sig + grn 4 4 blk pr Sig + 4 4 from main s S1 red 4 4 blk pr S1Sig - wht 5 5 red 2 Sig - 5 5 S3 blk 5 5 red 2 S3
Exc+ is jumped n/c 6 6 shield 6 6 shield 6 6 shieldto Mon + n/c 7 7 bl pr Mon + 7 7 S2 blk 7 7 blk pr S2
Exc- is jumped n/c 8 8 red 3 Mon - BTI1 8 8 S4 grn 8 8 red 3 S4to Mon - n/c 9 9 shield 9 9 shield 9 9 shieldBTBSS Exc + red 10 10 blk pr Exc + To Sig + blk 34 34 blk pr Sig + BTP Vout + red 10 10blk pr Vout + To
Side toSide Exc - blk 11 11 red 4 Exc - LP-5 Instr Sig - wht 35 35 red 12 Sig - From Micon Vout - blk 11 11red 4 Vout - LP-5 Instr
Strain from shield 12 12 shield Enclo. shield 36 36 shield controller shield 12 12 shield Enclo.
Twr Base Sig + grn 13 13 blk pr Sig + BTASS Exc + blk 37 37 blk pr Exc + To I out + red 13 13blk pr I out +Sig - wht 14 14 red 5 Sig - Nacelle accel Exc - grn 38 38 red 13 Exc - LP-5 Instr I ou t- blk 14 14red 5 I out -
Exc+ is jumped n/c 15 15 shield side to side shield 39 39 shield Enclo. shield 15 15 shieldto Mon + n/c 16 16 blk pr Mon+ Sig + blk 40 40 blk pr Sig + Watt out + red 16 16 blk pr Watt +
Exc- is jumped n/c 17 17 red 6 Mon- Sig - blu 41 41 red 14 Sig - Watt out - blk 17 17 red 6 Watt -to Mon - n/c 18 18 shield shield 42 42 shield shield 18 18 shield
BTOO Sig + blk 19 19 bl pr Sig + To n/c 43 43 blk pr Var out + red 19 19 blk pr Var +From Micon Sig - wht 20 20 red 7 Sig - LP-5 Instr n/c 44 44 red 15 Var out - blk 20 20 red 7 Va r -
controller n/c 21 21 shield Enclo. n/c 45 45 shield shield 21 21 shieldBTYAW RH wht 22 22 blk pr RH n/c 34 34 blk pr n/c 22 22 blk pr
Yaw position RL blk 23 23 red 8 RL n/c 35 35 red 12 n/c 23 23 red 8 from encoder shield 24 24 shield n/c 36 36 shield n/c 24 24 shield
on yaw drive S1 red 25 25 blk pr S1 n/c 37 37 blk pr n/c 25 25 blk pr S3 blk 26 26 red 9 S3 n/c 38 38 red 13 n/c 26 26 red 9
shield 27 27 shield n/c 39 39 shield n/c 27 27 shieldS2 blk 28 28 blk pr S2 n/c 40 40 blk pr n/c 28 28 blk pr S4 grn 29 29 red 10 S4 n/c 41 41 red 14 n/c 29 29 red 10
shield 30 30 shield n/c 42 42 shield n/c 30 30 shieldBTAFA Exc + blk 31 31 blk pr Exc + To n/c 43 43 blk pr n/c 31 31 red pr
Nacelle accel Exc - red 32 32 red 11 Exc - LP-5 Instr n/c 44 44 red 15 n/c 32 32 blk 11 Fore and Aft shield 33 33 shield Enclo. n/c 45 45 shield n/c 33 33 shield
BTI2 12-15
B-Turbine JB
BTI1 BTI2
Fi C 8 J ti B f T bi B

53

54
Turbine C Junction Box
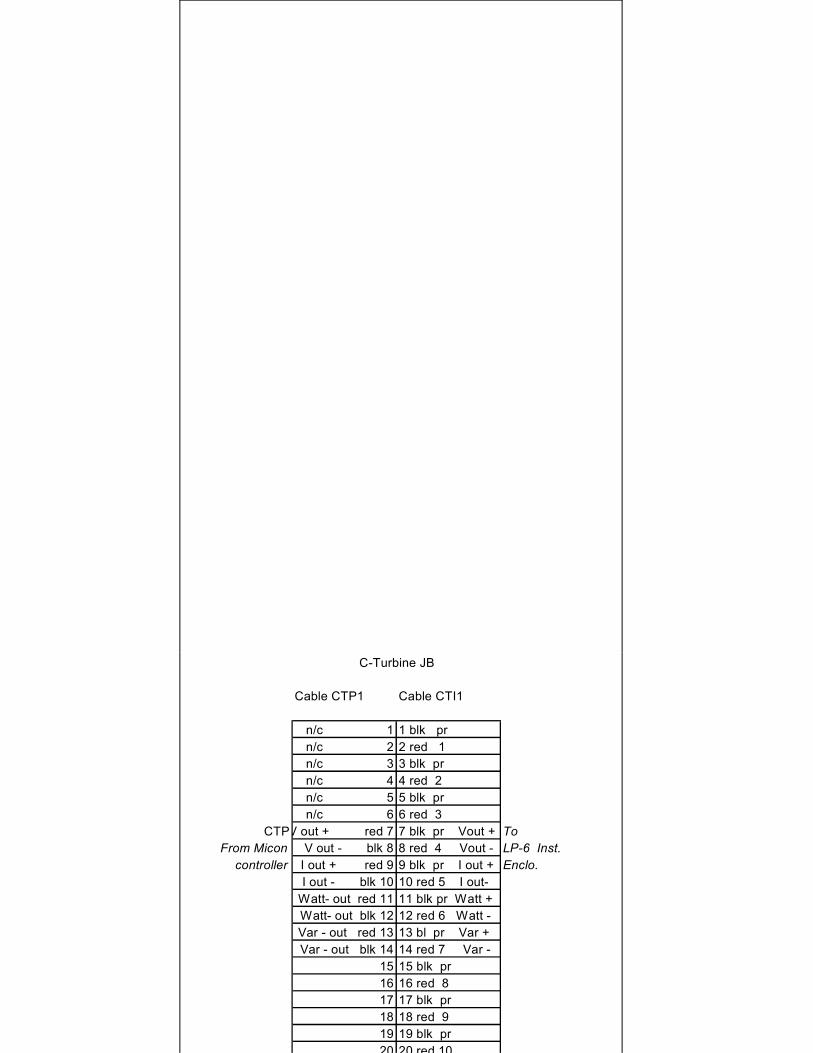
55
Cable CTP1 Cable CTI1
n/c 1 1 blk prn/c 2 2 red 1n/c 3 3 blk prn/c 4 4 red 2n/c 5 5 blk prn/c 6 6 red 3
CTPV out + red 7 7 blk pr Vout + ToFrom Micon V out - blk 8 8 red 4 Vout - LP-6 Inst.
controller I out + red 9 9 blk pr I out + Enclo.I out - blk 10 10 red 5 I out-
Watt- out red 11 11 blk pr Watt +Watt- out blk 12 12 red 6 Watt -Var - out red 13 13 bl pr Var +Var - out blk 14 14 red 7 Var -
15 15 blk pr16 16 red 817 17 blk pr18 18 red 919 19 blk pr20 20 red 10
C-Turbine JB

56
The junction box at the base of Turbine C connects the instrument that monitors the powerproduced by this turbine to the Instrument Enclosure. Cable CTP1 is connected to cable CTI1 inthis junction box. Cable CTI1 is connected to the lightning protection in the InstrumentEnclosure, see Fig, C-9.
Met Tower Junction Boxes and Wiring
Center Met Tower Junction BoxThe junction box at the base of the center meteorological (called met for short) tower
contains the wiring from the sonic anemometers on the north, south and center met towers. Thecup anemometers, wind direction vanes, temperature and delta temperature wiring from thecenter met tower are also connected in this junction box. Cables BACI1 and BACI2 connect thisjunction box to the lightning protection in the Instrument Enclosure, see Fig. C-10.
TB-1 Cable BACI1 TB-2 Cable BACI2
BACTATI 12 volts red 1 1 blk pair BACTATI BACTC pair blk 1 1 red Exc+ BACTCInstrument gnd blk 2 2 red 1 Cable Cable 1 red 2 2 wht Sig+ InstrumentFrom ATI receive blk 3 3 blk pair To Instrument To Instrument pair blk 3 3 blk Sig com From Cup
Top of Rotor transmit wht 4 4 red 2 Enclosure LP-1 Enclosure LP-1 2 red 4 4 grn n/c Top of Rotorsignal gnd grn 5 5 blk pair BACCC pair blk 5 5 red Exc+ BACCCn/c blk 6 6 red 3 Cable 3 red 6 6 wht Sig+ Instrument
BACCATI 12 volts red 7 7 blk pair BACCATI To Instrument pair blk 7 7 blk Sig com From CupInstrument gnd blk 8 8 red 4 Cable Enclosure LP-1 4 red 8 8 brn n/c Hub HeightFrom ATI receive blk 9 9 blk pair To Instrument BACBC pair blk 9 9 red Exc+ BACBC
Hub Height transmit wht 10 10 red 5 Enclosure LP-1 Cable 5 red 10 10 wht Sig+ InstrumentSig gnd grn 11 11 blk pair To Instrument pair blk 11 11 blk Sig com From Cupn/c blk 12 12 red 6 Enclosure LP-1 6 red 12 12 grn n/c Bottom of Rot
BACBATI 12 volts red 13 13 blk pair BACBATI BAC2C pairblk 13 13 red Exc+ BAC2CInstrument gnd blk 14 14 red 7 Cable Cable 7 red 14 14 wht Sig+ InstrumentFrom ATI receive blk 15 15 blk pair To Instrument To Instrument pair blk 15 15 blk Sig com From CupBottom of transmit wht 16 16 red 8 Enclosure LP-1 Enclosure LP-1 8 red 16 16 grn n/c 2-Meter
Rotor sig gnd grn 17 17 blk pair BACCV pair blk 17 17 red Exc+ BACCVn/c blk 18 18 red 9 Cable 9 red 18 18 wht Sig+ Instrument
BANATI 12 volts blk 19 19 blk pair BANATI To Instrument pair blk 19 19 blk Sig com From VaneInstrument gnd red 20 20 red 10 Cable Enclosure LP-1 10 red 20 20 brn n/c Hub HeightFrom ATI receive blk 21 21 blk pair To Instrument BACTP pair blk 21 21 red I+ BACTP
N. Met Twr transmit wht 22 22 red 11 Enclosure LP-1 Cable 11 red 22 22 blk E- InstrumentHub Height sig gnd blk 23 23 blk pair To Instrument pair blk 23 23 wht I- From Temp
n/c grn 24 24 red 12 Enclosure LP-1 12 red 24 24 grn E+ 2-MeterBASATI 12 volts blk 25 25 blk pair BASATI BACDTP pair blk 25 25 red I+ BACDTP
Instrument gnd red 26 26 red 13 Cable Cable 13 red 26 26 blk E- InstrumentFrom ATI receive blk 27 27 blk pair To Instrument To Instrument pair blk 27 27 wht I- From D-Temp
S. Met Twr transmit wht 28 28 red 14 Enclosure LP-1 Enclosure LP-1 14 red 28 28 grn E+ Twr TopHub Height sig gnd blk 29 29 blk pair pair blk 29
n/c grn 30 30 red 15 15 red 3031 31 31 3132 32 32 32
Center Met Tower JB
Fig. C-10. Junction Box on the Center Met Tower.
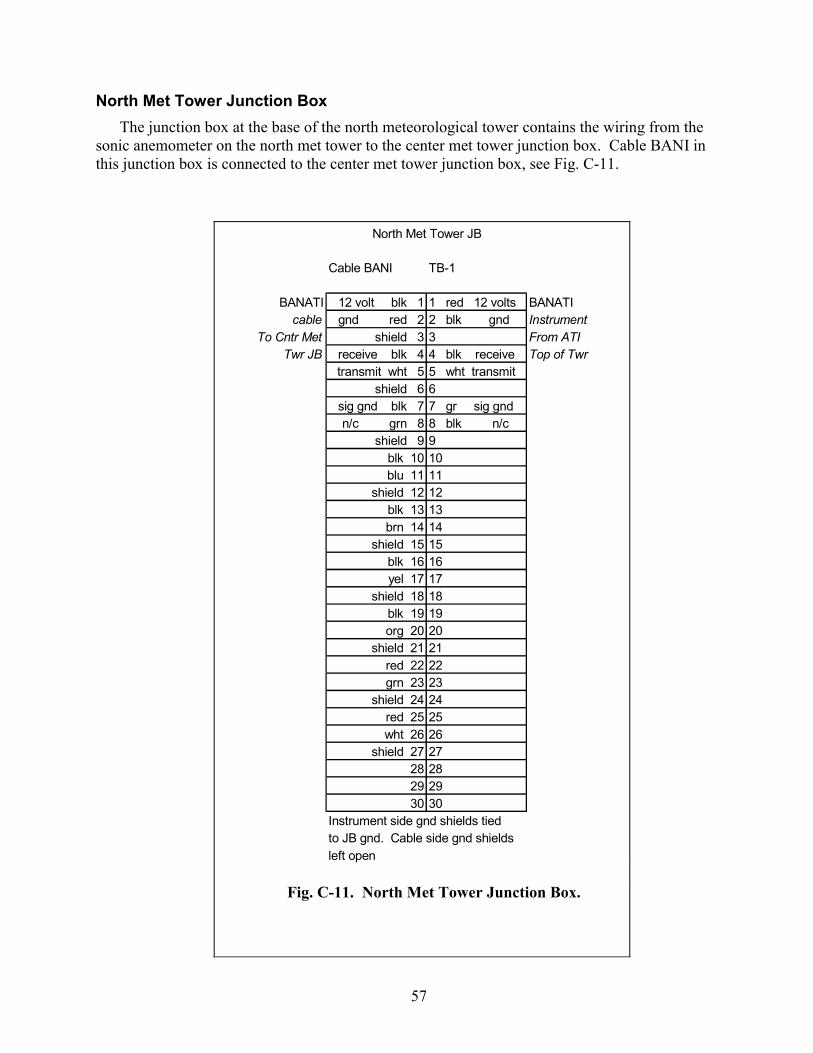
57
North Met Tower Junction BoxThe junction box at the base of the north meteorological tower contains the wiring from the
sonic anemometer on the north met tower to the center met tower junction box. Cable BANI inthis junction box is connected to the center met tower junction box, see Fig. C-11.
Cable BANI TB-1
BANATI 12 volt blk 1 1 red 12 volts BANATIcable gnd red 2 2 blk gnd Instrument
To Cntr Met shield 3 3 From ATITwr JB receive blk 4 4 blk receive Top of Twr
transmit wht 5 5 wht transmitshield 6 6
sig gnd blk 7 7 gr sig gnd n/c grn 8 8 blk n/c
shield 9 9blk 10 10
blu 11 11shield 12 12
blk 13 13brn 14 14
shield 15 15blk 16 16yel 17 17
shield 18 18blk 19 19org 20 20
shield 21 21 red 22 22grn 23 23
shield 24 24 red 25 25 wht 26 26
shield 27 2728 2829 2930 30
Instrument side gnd shields tiedto JB gnd. Cable side gnd shieldsleft open
North Met Tower JB
Fig. C-11. North Met Tower Junction Box.
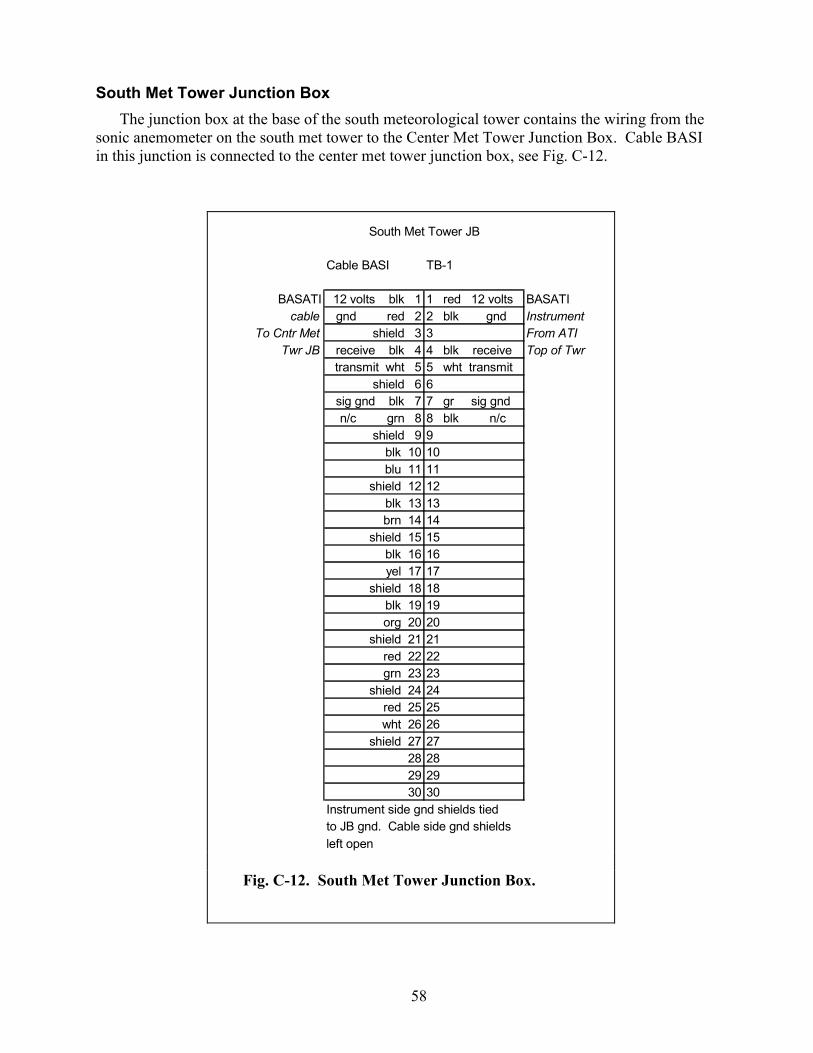
58
South Met Tower Junction BoxThe junction box at the base of the south meteorological tower contains the wiring from the
sonic anemometer on the south met tower to the Center Met Tower Junction Box. Cable BASIin this junction is connected to the center met tower junction box, see Fig. C-12.
Cable BASI TB-1
BASATI 12 volts blk 1 1 red 12 volts BASATIcable gnd red 2 2 blk gnd Instrument
To Cntr Met shield 3 3 From ATITwr JB receive blk 4 4 blk receive Top of Twr
transmit wht 5 5 wht transmitshield 6 6
sig gnd blk 7 7 gr sig gnd n/c grn 8 8 blk n/c
shield 9 9blk 10 10
blu 11 11shield 12 12
blk 13 13brn 14 14
shield 15 15blk 16 16yel 17 17
shield 18 18blk 19 19org 20 20
shield 21 21 red 22 22grn 23 23
shield 24 24 red 25 25 wht 26 26
shield 27 2728 2829 2930 30
Instrument side gnd shields tiedto JB gnd. Cable side gnd shieldsleft open
South Met Tower JB
Fig. C-12. South Met Tower Junction Box.
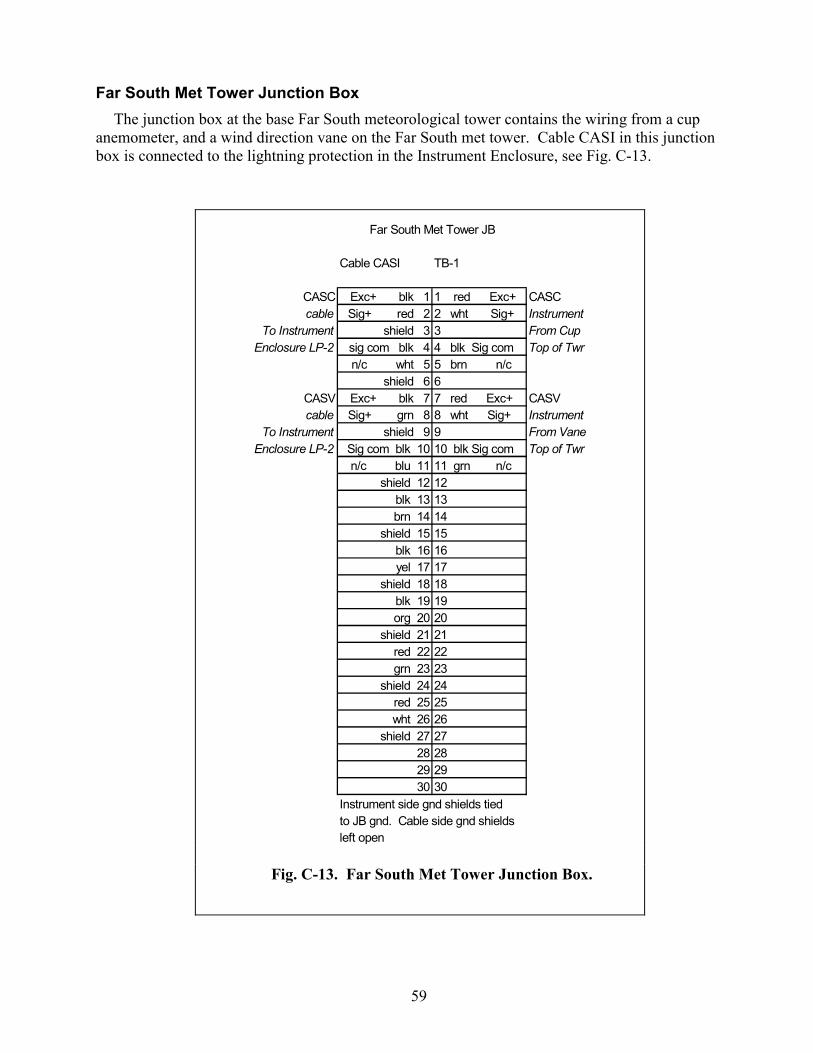
59
Far South Met Tower Junction BoxThe junction box at the base Far South meteorological tower contains the wiring from a cup
anemometer, and a wind direction vane on the Far South met tower. Cable CASI in this junctionbox is connected to the lightning protection in the Instrument Enclosure, see Fig. C-13.
Cable CASI TB-1
CASC Exc+ blk 1 1 red Exc+ CASCcable Sig+ red 2 2 wht Sig+ Instrument
To Instrument shield 3 3 From CupEnclosure LP-2 sig com blk 4 4 blk Sig com Top of Twr
n/c wht 5 5 brn n/cshield 6 6
CASV Exc+ blk 7 7 red Exc+ CASVcable Sig+ grn 8 8 wht Sig+ Instrument
To Instrument shield 9 9 From VaneEnclosure LP-2 Sig com blk 10 10 blk Sig com Top of Twr
n/c blu 11 11 grn n/cshield 12 12
blk 13 13brn 14 14
shield 15 15blk 16 16yel 17 17
shield 18 18blk 19 19org 20 20
shield 21 21 red 22 22grn 23 23
shield 24 24 red 25 25 wht 26 26
shield 27 2728 2829 2930 30
left open
Far South Met Tower JB
Instrument side gnd shields tiedto JB gnd. Cable side gnd shields
Fig. C-13. Far South Met Tower Junction Box.
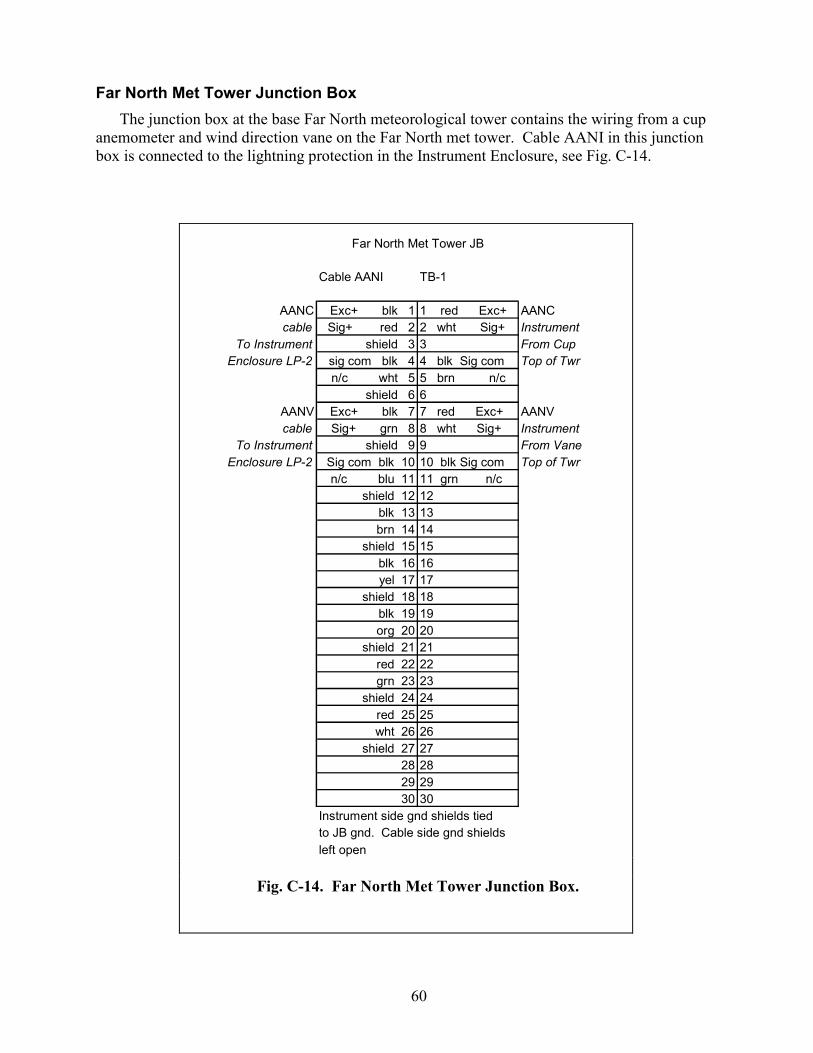
60
Far North Met Tower Junction BoxThe junction box at the base Far North meteorological tower contains the wiring from a cup
anemometer and wind direction vane on the Far North met tower. Cable AANI in this junctionbox is connected to the lightning protection in the Instrument Enclosure, see Fig. C-14.
Cable AANI TB-1
AANC Exc+ blk 1 1 red Exc+ AANCcable Sig+ red 2 2 wht Sig+ Instrument
To Instrument shield 3 3 From CupEnclosure LP-2 sig com blk 4 4 blk Sig com Top of Twr
n/c wht 5 5 brn n/cshield 6 6
AANV Exc+ blk 7 7 red Exc+ AANVcable Sig+ grn 8 8 wht Sig+ Instrument
To Instrument shield 9 9 From VaneEnclosure LP-2 Sig com blk 10 10 blk Sig com Top of Twr
n/c blu 11 11 grn n/cshield 12 12
blk 13 13brn 14 14
shield 15 15blk 16 16yel 17 17
shield 18 18blk 19 19org 20 20
shield 21 21 red 22 22grn 23 23
shield 24 24 red 25 25 wht 26 26
shield 27 2728 2829 2930 30
Instrument side gnd shields tiedto JB gnd. Cable side gnd shieldsleft open
Far North Met Tower JB
Fig. C-14. Far North Met Tower Junction Box.
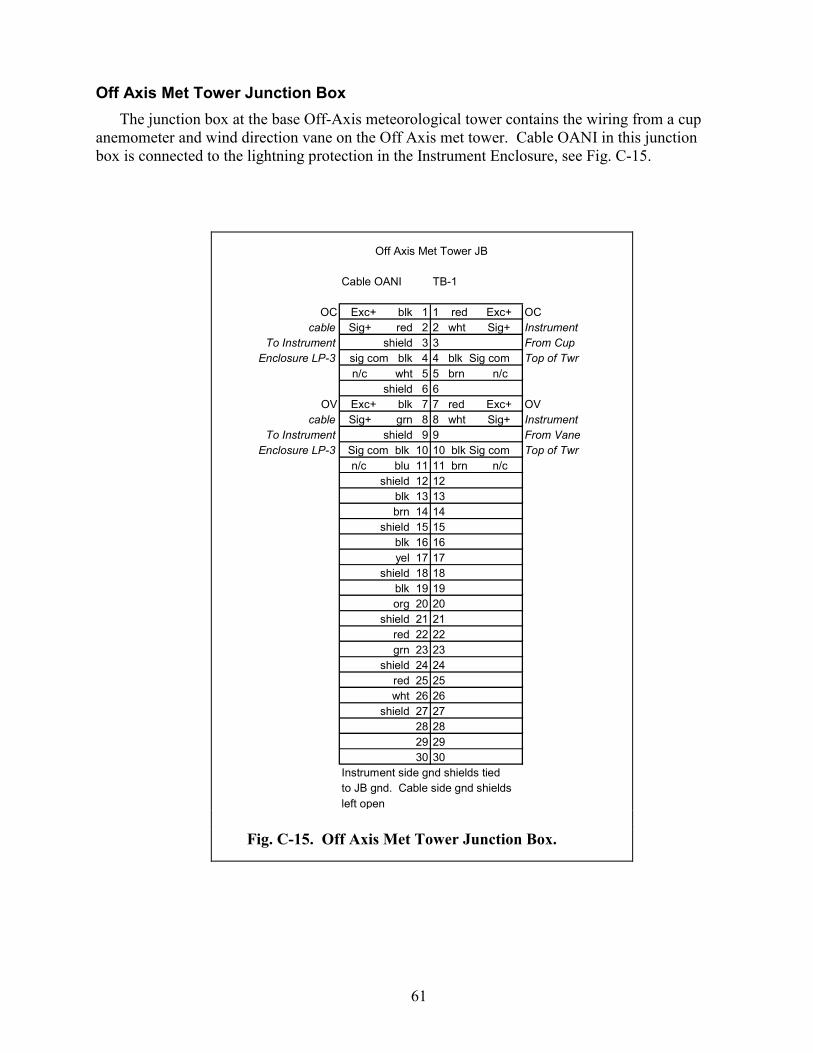
61
Off Axis Met Tower Junction BoxThe junction box at the base Off-Axis meteorological tower contains the wiring from a cup
anemometer and wind direction vane on the Off Axis met tower. Cable OANI in this junctionbox is connected to the lightning protection in the Instrument Enclosure, see Fig. C-15.
Cable OANI TB-1
OC Exc+ blk 1 1 red Exc+ OCcable Sig+ red 2 2 wht Sig+ Instrument
To Instrument shield 3 3 From CupEnclosure LP-3 sig com blk 4 4 blk Sig com Top of Twr
n/c wht 5 5 brn n/cshield 6 6
OV Exc+ blk 7 7 red Exc+ OVcable Sig+ grn 8 8 wht Sig+ Instrument
To Instrument shield 9 9 From VaneEnclosure LP-3 Sig com blk 10 10 blk Sig com Top of Twr
n/c blu 11 11 brn n/cshield 12 12
blk 13 13brn 14 14
shield 15 15blk 16 16yel 17 17
shield 18 18blk 19 19org 20 20
shield 21 21 red 22 22grn 23 23
shield 24 24 red 25 25 wht 26 26
shield 27 2728 2829 2930 30
Instrument side gnd shields tiedto JB gnd. Cable side gnd shieldsleft open
Off Axis Met Tower JB
Fig. C-15. Off Axis Met Tower Junction Box.

62
Wiring Diagram for the Accelerometers This wire list covers the wiring from the accelerometers to the DAS in the Instrument
Enclosure, see Fig. C-16.
NameBTAFA
DC + 5 Red Red Red A Black 31 Black pair 1 Black Exc + Black Exc + Black Exc +DC -5 Black Black Black B Red 32 Red pair 1 Red Exc- Red Exc- Red Exc-Gnd Gnd Gnd Gnd E Gnd 33 Gnd Black Sig + Gnd shield Gnd shieldSig (+) Green White White C Black 34 Black pair2 Wht Sig - Black Sig + Black Sig +Sig (-) Wht Black Black D White 35 Red pair 2 Black Mon + Wht Sig - Wht Sig -
Gnd E Gnd 36 Gnd Grn Mon- Gnd shield Gnd shieldBlack Mon + Black Mon +
Grn Mon- Grn Mon-Gnd shield Gnd shield
NameBTASS
DC + 5 Red Brn Green F Black 37 Black pair 1 Black Exc + Black Exc + Black Exc +DC -5 Black Black Black G Green 38 Red pair 1 Red Exc- Red Exc- Red Exc-Gnd Gnd Gnd Gnd K Gnd 39 Gnd Black Sig + Gnd shield Gnd shieldSig (+) Green Blue Blue H Black 40 Black pair2 Wht Sig - Black Sig + Black Sig +Sig (-) Wht Black Black J Blue 41 Red pair2 Black Mon + Wht Sig - Wht Sig -
Gnd K Gnd 42 Gnd Grn Mon- Gnd shield Gnd shieldBlack Mon + Black Mon +
Grn Mon- Grn Mon-Gnd shield Gnd shield
Inst Encl/LP-5-in Inst Encl/LP-5-out
Inst Encl/LP-5-out
Accel Cable Nacelle JB/TB-1 Nacelle JB/Conn Turb base JB/TB1 Inst Encl/Strain-in Inst Encl/Strn-upro
Nacelle JB/TB-1 Nacelle JB/Conn Turb base JB/TB1 Inst Encl/LP-5-in
Jumction Box on Nacelle
Jumction Box on Nacelle
B Turbine Accelerometer Fore-Aft
B Turbine Accelerometer Side-Side
2262-25G SN KL03
2262-25G SN TJ45
Accel Cable Inst Encl/Strn-uproInst Encl/Strain-in
Fig. C-16. Accelerometer Wiring Diagram.

63
Wiring Diagram for the Met One Back PanelThe Met One back panel has all the wiring associated with the cups, vanes, temperature, delta temperature, and barometric
pressure, see Fig. C-17.
OC CASC BAC2C BACBC BACCC BACTC AANC
From 1 blk sig In From 1 blk sig In From 1 blk sig In From 1 blk sig In From 1 blk sig In From 1 blk sig In From 1 blk sig InTB-CV-1 2 wht ga com TB-CV-1 2 wht ga com TB-CV-1 2 wht ga com TB-CV-1 2 wht ga com TB-CV-1 2 wht ga com TB-CV-1 2 wht ga com TB-CV-1 2 wht ga com
3 n/c 3 n/c 3 n/c 3 n/c 3 n/c 3 n/c 3 n/c4 n/c 4 n/c 4 n/c 4 n/c 4 n/c 4 n/c 4 n/c5 n/c 5 n/c 5 n/c 5 n/c 5 n/c 5 n/c 5 n/c6 n/c 6 n/c 6 n/c 6 n/c 6 n/c 6 n/c 6 n/c7 red ga pwr 7 red ga pwr 7 red ga pwr 7 red ga pwr 7 red ga pwr 7 red ga pwr 7 red ga pwr8 red com To 8 red com To 8 red com To 8 red com To 8 red com To 8 red com To 8 red com To9 blk sig out ANA-4 9 blk sig out ANA-4 9 blk sig out ANA-3 9 blk sig out ANA-3 9 blk sig out ANA-3 9 blk sig out ANA-3 9 blk sig out ANA-410 n/c 10 n/c 10 n/c 10 n/c 10 n/c 10 n/c 10 n/c11 n/c 11 n/c 11 n/c 11 n/c 11 n/c 11 n/c 11 n/c12 n/c 12 n/c 12 n/c 12 n/c 12 n/c 12 n/c 12 n/c
EPR BACDTP BACTP OV CASV BACCV AANV
From 1 blk sig In From 1 jmp to temp 4 From 1 n/c From 1 blk ref From 1 blk ref From 1 blk ref From 1 blk refTB-CV-3 2 blk ga com TB-CV-3 2 blk gage E- TB-CV-3 2 blk gage E- TB-CV-2 2 n/c TB-CV-2 2 n/c TB-CV-2 2 n/c TB-CV-2 2 n/c
3 n/c 3 grn gage E+ 3 grn gage E+ 3 jmp 6 com 3 jmp 6 com 3 jmp 6 com 3 jmp 6 com4 n/c 4 n/c 4 jmp to T- 1 4 wht phase 4 wht phase 4 wht phase 4 wht phase5 n/c 5 wht gage I- 5 wht gage I- 5 n/c 5 n/c 5 n/c 5 n/c6 n/c 6 red gage I+ 6 red gage I+ 6 jmp 3-8 com 6 jmp 3-8 6 jmp 3-8 com 6 jmp 3-8 com7 red ga pwr 7 7 7 red ga pwr 7 red ga pwr 7 red ga pwr 7 red ga pwr8 red com To 8 red com To 8 red com To 8 red com To 8 red com To 8 red com To 8 red com To9 blk sig out ANA-5 9 blk sig out ANA-5 9 blk sig out ANA-5 9 blk sig out ANA-4 9 blk sig out ANA-4 9 blk sig out ANA-4 9 blk sig out ANA-410 n/c 10 n/c 10 n/c 10 n/c 10 n/c 10 n/c 10 n/c11 n/c 11 n/c 11 n/c 11 n/c 11 n/c 11 n/c 11 n/c12 n/c 12 n/c 12 n/c 12 n/c 12 n/c 12 n/c 12 n/c
Met One Racks
Top Rack Cup AnemometersSlot 1 BlankSlot 2 OC Off Axis Met Tower Cup
Slot 7 BACCV Center Met Tower Vane
Slot 3 CASC South Met Tower CupSlot 4 BAC2C Center Met Tower 2 Meter CupSlot 5 BACBC Center Met Tower Bottom of Rotor CupSlot 6 BACCC Center Met Tower Center Of Rotor Cup
Slot 8 AANV North Met Tower VaneSlot 7 BACTC Center Met Tower Top of Rotor CupSlot 8 AANC North Met Tower Cup
Bottom Rack Vanes, Temps, PressureSlot 1 BlankSlot 2 EPR Barometric PressureSlot 3 BACDTP Delta Temp.Slot 4 BACTP Temp.Slot 5 OV Off Axis Met Tower VaneSlot 6 CASV South Met Tower Vane
Fig. C-17. Wiring Diagram for the Met One Back Panel.

64
Instrumentation Enclosure Wiring Diagram
Lightning ProtectionThe cables from the instrumentation are routed in the center of lightning protection boards.
The signals are then passed through the lightning protection and on to the data acquisition system(DAS), see Fig. C-18a, C-18b and C-18c.
L igh tn ing Prot. L igh tn ing P ro t.LP -1 LP -5
B A C T A T I 12 vo lts b lk 1 1 b lk pa ir B A C I1 B T I1 pa ir b lk 1 1 b lk Exc+ B T B FAT o gnd red 2 2 red 1 1 red 2 2 red Exc- T o
TB -A T I-1 rece ive b lk 3 3 b lk pa ir pa ir b lk 3 3 b lk S ig+ S tra in -1transm it wh t 4 4 red 2 2 red 4 4 wh t S ig -s igna l gnd b lk 5 5 b lk pa ir pa ir b lk 5 5 b lk M on+
n /c g rn 6 6 red 3 3 red 6 6 g rn M on-B A C C A TI 12 vo lts b lk 7 7 b lk pa ir pa ir b lk 7 7 b lk E xc+ B T B S S
T o gnd red 8 8 red 4 4 red 8 8 red E xc-TB -A T I-2 rece ive b lk 9 9 b lk pa ir pa ir b lk 9 9 b lk S ig+
transm it wh t 10 10 red 5 5 red 10 10 wh t S ig -S ig gnd b lk 11 11 b lk pa ir pa ir b lk 11 11 b lk M on+
n /c g rn 12 12 red 6 6 red 12 12 g rn M on-B AC B A TI 12 vo lts b lk 13 13 b lk pa ir pa ir b lk 13 13 b lk S ig + B T O O
T o gnd red 14 14 red 7 7 red 14 14 red S ig -TB -A T I-3 rece ive b lk 15 15 b lk pa ir pa ir b lk 15 15 red R H B T Y A W
transm it wh t 16 16 red 8 8 red 16 16 b lk R L T O -B Bsig gnd b lk 17 17 b lk pa ir pa ir b lk 17 17 red S 1
n /c g rn 18 18 red 9 9 red 18 18 wh t S 3BA N A TI 12 vo lts b lk 19 19 b lk pa ir pa ir b lk 19 19 red S 2
T o gnd red 20 20 red 10 10 red 20 20 g rn S4TB -A T I-4 rece ive b lk 21 21 b lk pa ir pa ir b lk 21 21 red Exc+ B T A FA
transm it wh t 22 22 red 11 11 red 22 22 b lk E xc-s ig gnd b lk 23 23 b lk pa ir pa ir b lk 23 23 wh t S ig+
n /c g rn 24 24 red 12 12 red 24 24 g rn S ig -B A S A T I 12 vo lts b lk 25 25 b lk pa ir pa ir b lk 25 25 red E xc+ B T A S S
T o gnd red 26 26 red 13 13 red 26 26 b lk Exc-TB -A T I-5 rece ive b lk 27 27 b lk pa ir pa ir b lk 27 27 wh t S ig+
transm it wh t 28 28 red 14 14 red 28 28 g rn S ig -s ig gnd b lk 29 29 b lk pa ir pa ir b lk 29 29
n /c g rn 30 30 red 15 15 red 30 3031 31 31 3132 32 32 32
BA C TC E xc+ red 1 1 b lk pa ir B A C I2 B T I2 pa ir b lk 1 1 b lk R H B T R AT o S ig+ b lk 2 2 red 1 1 red 2 2 red R L &
TB -C /V -1 com m on wh t 3 3 b lk pa ir pa ir b lk 3 3 b lk S1 B T R Sn/c g rn 4 4 red 2 2 red 4 4 wh t S 3 T O -B B
BA C C C E xc+ red 5 5 b lk pa ir pa ir b lk 5 5 b lk S2T o S ig+ b lk 6 6 red 3 3 red 6 6 g rn S4
TB -C /V -1 com m on wh t 7 7 b lk pa ir pa ir b lk 7 7 b lk S ig+ B T Pn/c g rn 8 8 red 4 4 red 8 8 red S ig -
B A C B C E xc+ red 9 9 b lk pa ir pa ir b lk 9 9T o S ig+ b lk 10 10 red 5 5 red 10 10
TB -C /V -1 com m on wh t 11 11 b lk pa ir pa ir b lk 11 11n /c g rn 12 12 red 6 6 red 12 12
B A C 2C E xc+ red 13 13 b lk pa ir pa ir b lk 13 13T o S ig+ b lk 14 14 red 7 7 red 14 14
TB -C /V -1 com m on wh t 15 15 b lk pa ir pa ir b lk 15 15n /c g rn 16 16 red 8 8 red 16 16
B A C C V E xc+ red 17 17 b lk pa ir pa ir b lk 17 17T o S ig+ b lk 18 18 red 9 9 red 18 18
TB -C /V -2 com m on wh t 19 19 b lk pa ir pa ir b lk 19 19n /c g rn 20 20 red 10 10 red 20 20
B A C T P I+ red 21 21 b lk pa ir pa ir b lk 21 21T o E - b lk 22 22 red 11 11 red 22 22
T B -TP -1 I- wh t 23 23 b lk pa ir pa ir b lk 23 23E + g rn 24 24 red 12 12 red 24 24
B AC D T P I+ red 25 25 b lk pa ir pa ir b lk 25 25T o E - b lk 26 26 red 13 13 red 26 26
T B -TP -1 I- wh t 27 27 b lk pa ir pa ir b lk 27 27E + g rn 28 28 red 14 14 red 28 28
29 29 b lk pa ir pa ir b lk 29 2930 30 red 15 15 red 30 3031 31 3132 32 32
T o D A S T o D ASFrom Ins trum en ts
Fig. C-18a. Panel 1 : Lightning Protection Wiring Diagram.
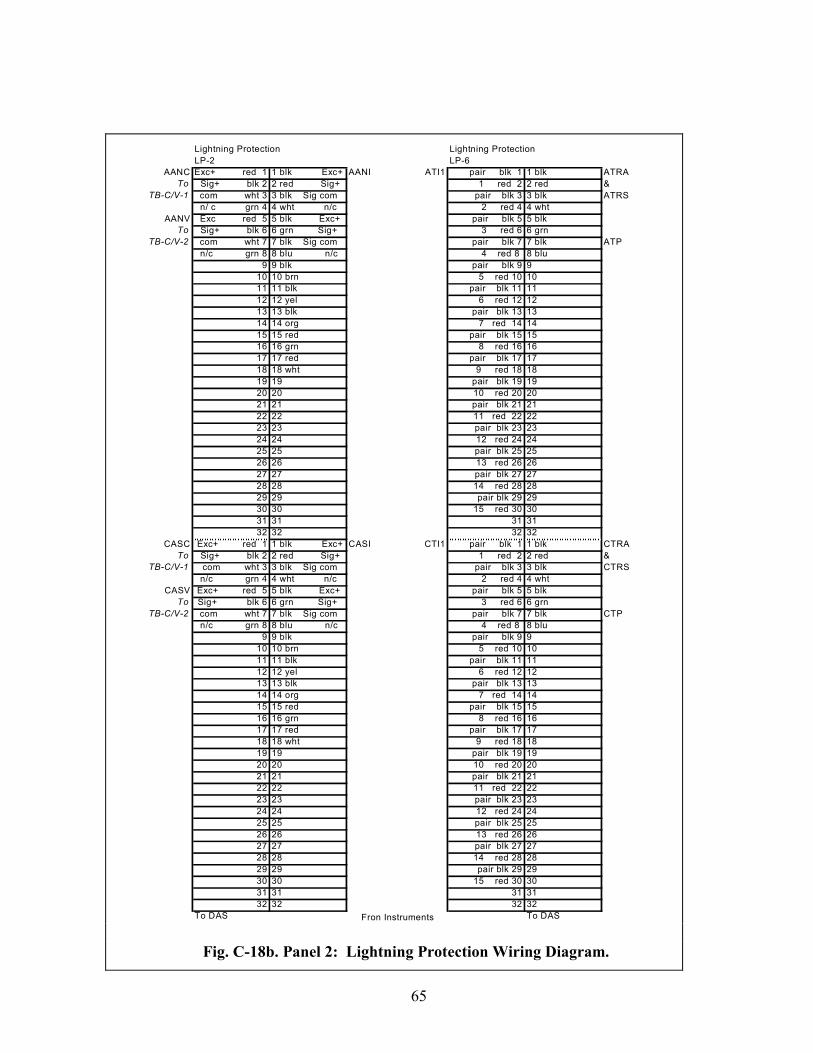
65
Lightning Protection Lightning ProtectionLP-2 LP-6
AANC Exc+ red 1 1 blk Exc+ AANI ATI1 pair blk 1 1 blk ATRATo Sig+ blk 2 2 red Sig+ 1 red 2 2 red &
TB-C/V-1 com wht 3 3 blk Sig com pair blk 3 3 blk ATRSn/ c grn 4 4 wht n/c 2 red 4 4 wht
AANV Exc red 5 5 blk Exc+ pair blk 5 5 blkTo Sig+ blk 6 6 grn Sig+ 3 red 6 6 grn
TB-C/V-2 com wht 7 7 blk Sig com pair blk 7 7 blk ATPn/c grn 8 8 blu n/c 4 red 8 8 blu
9 9 blk pair blk 9 910 10 brn 5 red 10 1011 11 blk pair blk 11 1112 12 yel 6 red 12 1213 13 blk pair blk 13 1314 14 org 7 red 14 1415 15 red pair blk 15 1516 16 grn 8 red 16 1617 17 red pair blk 17 1718 18 wht 9 red 18 1819 19 pair blk 19 1920 20 10 red 20 2021 21 pair blk 21 2122 22 11 red 22 2223 23 pair blk 23 2324 24 12 red 24 2425 25 pair blk 25 2526 26 13 red 26 2627 27 pair blk 27 2728 28 14 red 28 2829 29 pair blk 29 2930 30 15 red 30 3031 31 31 3132 32 32 32
CASC Exc+ red 1 1 blk Exc+ CASI CTI1 pair blk 1 1 blk CTRATo Sig+ blk 2 2 red Sig+ 1 red 2 2 red &
TB-C/V-1 com wht 3 3 blk Sig com pair blk 3 3 blk CTRSn/c grn 4 4 wht n/c 2 red 4 4 wht
CASV Exc+ red 5 5 blk Exc+ pair blk 5 5 blkTo Sig+ blk 6 6 grn Sig+ 3 red 6 6 grn
TB-C/V-2 com wht 7 7 blk Sig com pair blk 7 7 blk CTPn/c grn 8 8 blu n/c 4 red 8 8 blu
9 9 blk pair blk 9 910 10 brn 5 red 10 1011 11 blk pair blk 11 1112 12 yel 6 red 12 1213 13 blk pair blk 13 1314 14 org 7 red 14 1415 15 red pair blk 15 1516 16 grn 8 red 16 1617 17 red pair blk 17 1718 18 wht 9 red 18 1819 19 pair blk 19 1920 20 10 red 20 2021 21 pair blk 21 2122 22 11 red 22 2223 23 pair blk 23 2324 24 12 red 24 2425 25 pair blk 25 2526 26 13 red 26 2627 27 pair blk 27 2728 28 14 red 28 2829 29 pair blk 29 2930 30 15 red 30 3031 31 31 3132 32 32 32
To DAS To DASFron Instruments
Fig. C-18b. Panel 2: Lightning Protection Wiring Diagram.
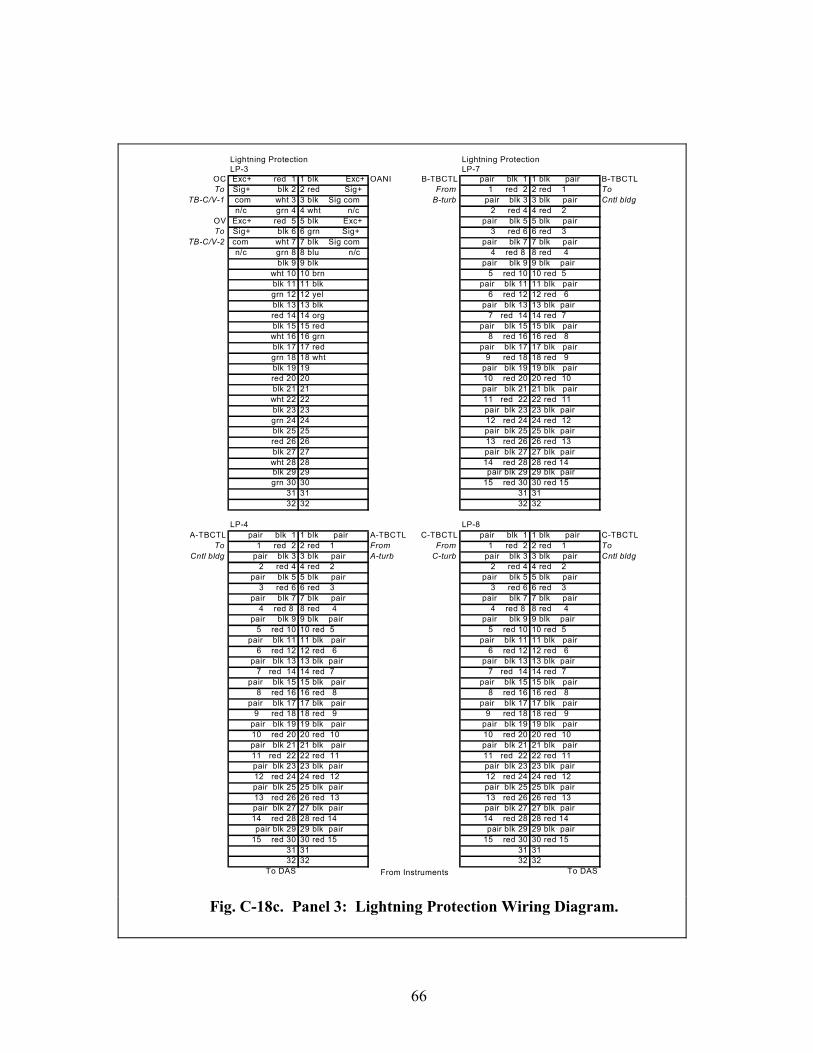
66
Lightning Protection Lightning ProtectionLP-3 LP-7
OC Exc+ red 1 1 blk Exc+ OANI B-TBCTL pair blk 1 1 blk pair B-TBCTLTo Sig+ blk 2 2 red Sig+ From 1 red 2 2 red 1 To
TB-C/V-1 com wht 3 3 blk Sig com B-turb pair blk 3 3 blk pair Cntl bldgn/c grn 4 4 wht n/c 2 red 4 4 red 2
OV Exc+ red 5 5 blk Exc+ pair blk 5 5 blk pairTo Sig+ blk 6 6 grn Sig+ 3 red 6 6 red 3
TB-C/V-2 com wht 7 7 blk Sig com pair blk 7 7 blk pairn/c grn 8 8 blu n/c 4 red 8 8 red 4
blk 9 9 blk pair blk 9 9 blk pairwht 10 10 brn 5 red 10 10 red 5blk 11 11 blk pair blk 11 11 blk pairgrn 12 12 yel 6 red 12 12 red 6blk 13 13 blk pair blk 13 13 blk pairred 14 14 org 7 red 14 14 red 7blk 15 15 red pair blk 15 15 blk pairwht 16 16 grn 8 red 16 16 red 8blk 17 17 red pair blk 17 17 blk pairgrn 18 18 wht 9 red 18 18 red 9blk 19 19 pair blk 19 19 blk pairred 20 20 10 red 20 20 red 10blk 21 21 pair blk 21 21 blk pairwht 22 22 11 red 22 22 red 11blk 23 23 pair blk 23 23 blk pairgrn 24 24 12 red 24 24 red 12blk 25 25 pair blk 25 25 blk pairred 26 26 13 red 26 26 red 13blk 27 27 pair blk 27 27 blk pairwht 28 28 14 red 28 28 red 14blk 29 29 pair blk 29 29 blk pairgrn 30 30 15 red 30 30 red 15
31 31 31 3132 32 32 32
LP-4 LP-8A-TBCTL pair blk 1 1 blk pair A-TBCTL C-TBCTL pair blk 1 1 blk pair C-TBCTL
To 1 red 2 2 red 1 From From 1 red 2 2 red 1 ToCntl bldg pair blk 3 3 blk pair A-turb C-turb pair blk 3 3 blk pair Cntl bldg
2 red 4 4 red 2 2 red 4 4 red 2pair blk 5 5 blk pair pair blk 5 5 blk pair
3 red 6 6 red 3 3 red 6 6 red 3pair blk 7 7 blk pair pair blk 7 7 blk pair
4 red 8 8 red 4 4 red 8 8 red 4pair blk 9 9 blk pair pair blk 9 9 blk pair
5 red 10 10 red 5 5 red 10 10 red 5pair blk 11 11 blk pair pair blk 11 11 blk pair
6 red 12 12 red 6 6 red 12 12 red 6pair blk 13 13 blk pair pair blk 13 13 blk pair
7 red 14 14 red 7 7 red 14 14 red 7pair blk 15 15 blk pair pair blk 15 15 blk pair
8 red 16 16 red 8 8 red 16 16 red 8pair blk 17 17 blk pair pair blk 17 17 blk pair
9 red 18 18 red 9 9 red 18 18 red 9pair blk 19 19 blk pair pair blk 19 19 blk pair10 red 20 20 red 10 10 red 20 20 red 10pair blk 21 21 blk pair pair blk 21 21 blk pair11 red 22 22 red 11 11 red 22 22 red 11pair blk 23 23 blk pair pair blk 23 23 blk pair12 red 24 24 red 12 12 red 24 24 red 12pair blk 25 25 blk pair pair blk 25 25 blk pair13 red 26 26 red 13 13 red 26 26 red 13
pair blk 27 27 blk pair pair blk 27 27 blk pair14 red 28 28 red 14 14 red 28 28 red 14pair blk 29 29 blk pair pair blk 29 29 blk pair
15 red 30 30 red 15 15 red 30 30 red 1531 31 31 3132 32 32 32
To DAS To DASFrom Instruments
Fig. C-18c. Panel 3: Lightning Protection Wiring Diagram.

67
Sonic AnemometersThe sonic anemometers input signal wiring from the lightning protection comes in the right
side of the terminal blocks and out the left side to the signal conditioning. Then the return signalsfrom the signal conditioning come in the left side and out the right side to the data acquisitionsystem, see Fig. C-19.
ATITB-ATI-4
TB-ATI-1 BANATI 12 volts red 1 1 blk 12 volts BANATIBACTATI 12 volts red 1 1 blk 12 volts BACTATI To gnd blk 2 2 red gnd From
To gnd blk 2 2 red gnd From Pwr strip shield shield 3 3 gnd shield LP-1Pwr strip shield shield 3 3 gnd shield LP-1 To receive red 4 4 blk receive
To receive red 4 4 blk receive ATI-BB-4 transmit blk 5 5 wht transmitATI-BB-1 transmit blk 5 5 wht transmit gnd shield 6 6 gnd shield
gnd shield 6 6 gnd shield signal gndgrn 7 7 blk sig gndsig gnd grn 7 7 blk signal gnd n/c wht 8 8 grn n/cn/c wht 8 8 grn n/c n/c shield 9 9 gnd shieldn/c shield 9 9 gnd shield From U+ blk 10 10 blk U+ To
From U+ blk 10 10 blk U+ To ATI-BB-4 U- red 11 11 red U- ANA-2ATI-BB-1 U- red 11 11 red U- ANA-1 gnd shield 12 12 gnd shield
gnd shield 12 12 gnd shield V+ blk 13 13 blk V+V+ blk 13 13 blk V+ V- wht 14 14 wht V-V- wht 14 14 wht V- gnd shield 15 15 gnd shieldgnd shield 15 15 gnd shield W+ blk 16 16 blk W+W+ blk 16 16 blk W+ W- grn 17 17grn W-W- grn 17 17grn W- gnd shield 18 18 gnd shieldgnd shield 18 18 gnd shield T+ blk 19 19 blk T+T+ blk 19 19 blk T+ T- blu 20 20 blu T-T- blu 20 20 blu T- gnd shield 21 21 gnd shieldgnd shield 21 21 gnd shield blk 22 22 n/cn/c blk 22 22 n/c yel 23 23 n/cn/c yel 23 23 n/c gnd 24 24 n/cn/c gnd 24 24 n/c
TB-ATI-5TB-ATI-2 BASATI 12 volts red 1 1 blk 12 volts BASATI
BACCATI 12 volts red 1 1 blk 12 volts BACCATI To gnd blk 2 2 red gnd FromTo gnd blk 2 2 red gnd From Pwr strip shield shield 3 3 gnd shield LP-1
Pwr strip shield shield 3 3 gnd shield LP-1 To receive red 4 4 blk receiveTo receive red 4 4 blk receive ATI-BB-5 transmit blk 5 5 wht transmit
ATI-BB-2 transmit blk 5 5 wht transmit gnd shield 6 6 gnd shieldgnd shield 6 6 gnd shield sig gnd grn 7 7 blk sig gndsig gnd grn 7 7 blk signal gnd n/c wht 8 8 grn n/cn/c wht 8 8 grn n/c n/c shield 9 9 gnd shieldn/c shield 9 9 gnd shield From U+ blk 10 10 blk U+ To
From U+ blk 10 10 blk U+ To ATI-BB-5 U- red 11 11 red U- ANA-3ATI-BB-2 U- red 11 11 red U- ANA-1 gnd shield 12 12 gnd shield
gnd shield 12 12 gnd shield V+ blk 13 13 blk V+V+ blk 13 13 blk V+ V- wht 14 14 wht V-V- wht 14 14 wht V- gnd shield 15 15 gnd shieldgnd shield 15 15 gnd shield W+ blk 16 16 blk W+W+ blk 16 16 blk W+ W- grn 17 17grn W-W- grn 17 17grn W- gnd shield 18 18 gnd shieldgnd shield 18 18 gnd shield T+ blk 19 19 blk T+T+ blk 19 19 blk T+ T- blu 20 20 blu T-T- blu 20 20 blu T- gnd shield 21 21 gnd shieldgnd shield 21 21 gnd shield blk 22 22 n/cn/c blk 22 22 n/c yel 23 23 n/cn/c yel 23 23 n/c gnd 24 24 n/cn/c gnd 24 24 n/c
TB-ATI-3BACBATI 12 volts red 1 1 blk 12 volts BACBATI
To gnd blk 2 2 red gnd FromPwr strip shield shield 3 3 gnd shield LP-1
To receive red 4 4 blk receiveATI-BB-3 transmit blk 5 5 wht transmit
gnd shield 6 6 gnd shieldsig gnd grn 7 7 blk signal gndn/c wht 8 8 grn n/cn/c shield 9 9 gnd shield
From U+ blk 10 10 blk U+ ToATI-BB-3 U- red 11 11 red U- ANA-2
gnd shield 12 12 gnd shieldV+ blk 13 13 blk V+V- wht 14 14 wht V-gnd shield 15 15 gnd shieldW+ blk 16 16 blk W+W- grn 17 17grn W-gnd shield 18 18 gnd shieldT+ blk 19 19 blk T+T- blu 20 20 blu T-gnd shield 21 21 gnd shieldn/c blk 22 22 n/cn/c yel 23 23 n/cn/c gnd 24 24 n/c
Fig. C-19. Sonic Anemometers Wiring Diagram.
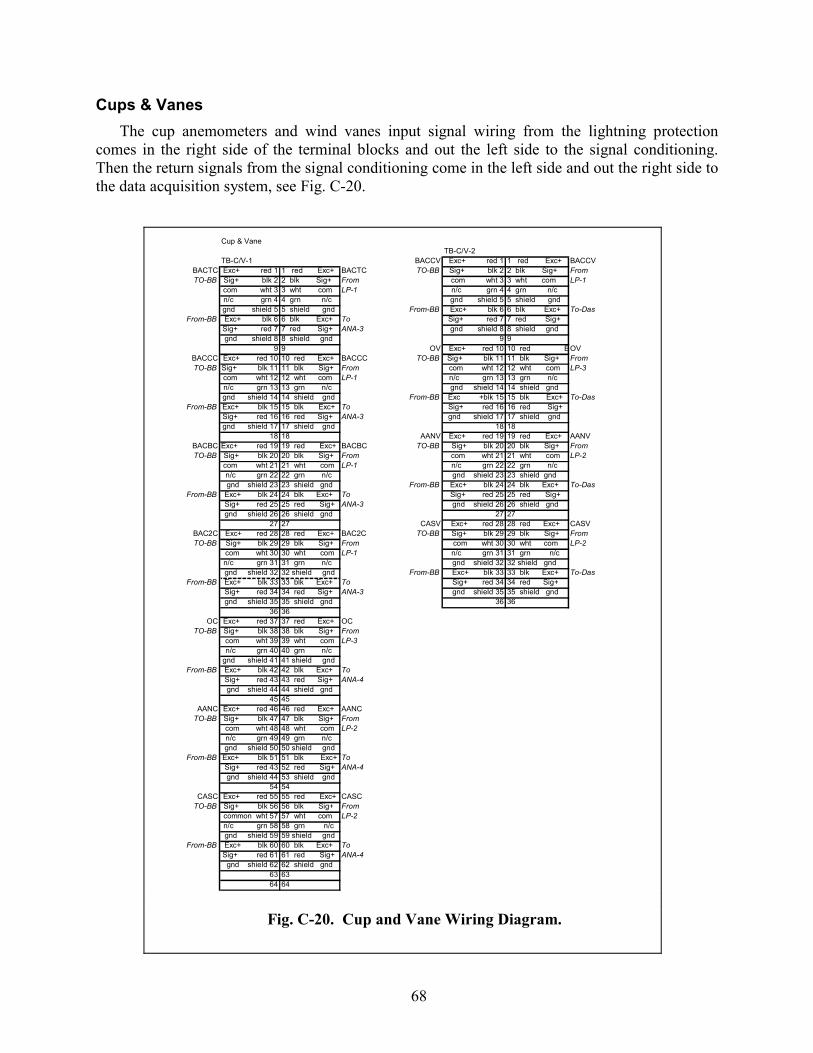
68
Cups & VanesThe cup anemometers and wind vanes input signal wiring from the lightning protection
comes in the right side of the terminal blocks and out the left side to the signal conditioning.Then the return signals from the signal conditioning come in the left side and out the right side tothe data acquisition system, see Fig. C-20.
Cup & VaneTB-C/V-2
TB-C/V-1 BACCV Exc+ red 1 1 red Exc+ BACCVBACTC Exc+ red 1 1 red Exc+ BACTC TO-BB Sig+ blk 2 2 blk Sig+ FromTO-BB Sig+ blk 2 2 blk Sig+ From com wht 3 3 wht com LP-1
com wht 3 3 wht com LP-1 n/c grn 4 4 grn n/cn/c grn 4 4 grn n/c gnd shield 5 5 shield gndgnd shield 5 5 shield gnd From-BB Exc+ blk 6 6 blk Exc+ To-Das
From-BB Exc+ blk 6 6 blk Exc+ To Sig+ red 7 7 red Sig+Sig+ red 7 7 red Sig+ ANA-3 gnd shield 8 8 shield gndgnd shield 8 8 shield gnd 9 9
9 9 OV Exc+ red 10 10 red EOVBACCC Exc+ red 10 10 red Exc+ BACCC TO-BB Sig+ blk 11 11 blk Sig+ FromTO-BB Sig+ blk 11 11 blk Sig+ From com wht 12 12 wht com LP-3
com wht 12 12 wht com LP-1 n/c grn 13 13 grn n/c n/c grn 13 13 grn n/c gnd shield 14 14 shield gndgnd shield 14 14 shield gnd From-BB Exc +blk 15 15 blk Exc+ To-Das
From-BB Exc+ blk 15 15 blk Exc+ To Sig+ red 16 16 red Sig+Sig+ red 16 16 red Sig+ ANA-3 gnd shield 17 17 shield gndgnd shield 17 17 shield gnd 18 18
18 18 AANV Exc+ red 19 19 red Exc+ AANVBACBC Exc+ red 19 19 red Exc+ BACBC TO-BB Sig+ blk 20 20 blk Sig+ FromTO-BB Sig+ blk 20 20 blk Sig+ From com wht 21 21 wht com LP-2
com wht 21 21 wht com LP-1 n/c grn 22 22 grn n/cn/c grn 22 22 grn n/c gnd shield 23 23 shield gndgnd shield 23 23 shield gnd From-BB Exc+ blk 24 24 blk Exc+ To-Das
From-BB Exc+ blk 24 24 blk Exc+ To Sig+ red 25 25 red Sig+Sig+ red 25 25 red Sig+ ANA-3 gnd shield 26 26 shield gndgnd shield 26 26 shield gnd 27 27
27 27 CASV Exc+ red 28 28 red Exc+ CASVBAC2C Exc+ red 28 28 red Exc+ BAC2C TO-BB Sig+ blk 29 29 blk Sig+ FromTO-BB Sig+ blk 29 29 blk Sig+ From com wht 30 30 wht com LP-2
com wht 30 30 wht com LP-1 n/c grn 31 31 grn n/c n/c grn 31 31 grn n/c gnd shield 32 32 shield gndgnd shield 32 32 shield gnd From-BB Exc+ blk 33 33 blk Exc+ To-Das
From-BB Exc+ blk 33 33 blk Exc+ To Sig+ red 34 34 red Sig+Sig+ red 34 34 red Sig+ ANA-3 gnd shield 35 35 shield gndgnd shield 35 35 shield gnd 36 36
36 36OC Exc+ red 37 37 red Exc+ OC
TO-BB Sig+ blk 38 38 blk Sig+ Fromcom wht 39 39 wht com LP-3n/c grn 40 40 grn n/c
gnd shield 41 41 shield gndFrom-BB Exc+ blk 42 42 blk Exc+ To
Sig+ red 43 43 red Sig+ ANA-4gnd shield 44 44 shield gnd
45 45AANC Exc+ red 46 46 red Exc+ AANC
TO-BB Sig+ blk 47 47 blk Sig+ Fromcom wht 48 48 wht com LP-2n/c grn 49 49 grn n/cgnd shield 50 50 shield gnd
From-BB Exc+ blk 51 51 blk Exc+ ToSig+ red 43 52 red Sig+ ANA-4gnd shield 44 53 shield gnd
54 54CASC Exc+ red 55 55 red Exc+ CASC
TO-BB Sig+ blk 56 56 blk Sig+ Fromcommon wht 57 57 wht com LP-2n/c grn 58 58 grn n/cgnd shield 59 59 shield gnd
From-BB Exc+ blk 60 60 blk Exc+ To Sig+ red 61 61 red Sig+ ANA-4
gnd shield 62 62 shield gnd63 6364 64
Fig. C-20. Cup and Vane Wiring Diagram.

69
Strain GaugesThe strain gauges, accelerometers, nacelle azimuth, rotor velocity/azimuth, temperature/delta
temperature, barometric pressure, and turbine power input signal wiring from the lightningprotection comes in the right side of the terminal blocks out the left side to the signalconditioning. Then the return signals from the signal conditioning come in the left side and outthe right side to the data acquisition system, see Fig. C-21.
Strain-1 TB-C/V-3Exc+ red 1 1 blk Exc+ BTBFA BACTP Exc+ red 1 1 red Exc+ BACTP
Cable-1 Exc- blk 2 2 red Exc- From TO-BB Sig+ blk 2 2 blk Sig+ Fromshield 3 3 gnd shield LP-5 common wht 3 3 wht com LP-1
Sig+ wht 4 4 blk Sig+ n/c grn 4 4 grn n/cSig- blk 5 5 wht Sig- gnd shield 5 5 shield gnd
shield 6 6 gnd shield From-BB Exc+ blk 6 6 blk Exc+ To-DasMon+ grn 7 7 blk Mon+ Sig+ red 7 7 red Sig+Mon- blk 8 8 grn Mon- gnd shield 8 8 shield gnd
shield 9 9 gnd shield 9 9Exc+ blu 10 10 blk Exc+ BTBSS BACDPT Exc+ red 10 10 red Exc+ BACDPTExc- blk 11 11 red Exc- From TO-BB Sig+ blk 11 11 blk Sig+ From
shield 12 12 gnd shield LP-5 com wht 12 12 wht com LP-1Sig+ yel 13 13 blk Sig+ n/c grn 13 13 grn n/cSig- blk 14 14 wht Sig- gnd shield 14 14 shield gnd
shield 15 15 gnd shield From-BB Exc +blk 15 15 blk Exc+ To-DasMon+ brn 16 16 blk Mon+ Sig+ red 16 16 red Sig+Mon- blk 17 17 grn Mon- gnd shield 17 17 shield gnd
shield 18 18 gnd shield 18 18Exc+ org 19 19 red Exc+ BTAFA EPR Exc+ red 19 19 red Exc+ EPRExc- blk 20 20 blk Exc- From Sig+ blk 20 20 blk Sig+
shield 21 21 gnd shield LP-5 com wht 21 21 wht comCable-6 Sig+ blu 22 22 wht Sig+ n/c grn 22 22 grn n/c
Sig- blk 23 23 grn Sig- gnd shield 23 23 shield gndCable-1 shield 24 24 gnd shield Exc+ blk 24 24 blk Exc+
Exc+ wht 25 25 red Exc+ BTASS Sig+ red 25 25 red Sig+Exc- red 26 26 blk Exc- From gnd shield 26 26 shield gnd
shield 27 27 gnd shield LP-5 27 27Cable-6 Sig+ yel 28 28 wht Sig+
Sig- blk 29 29 grn Sig-gnd red 30 30 gnd shield
31 31 n/c32 32 n/c
BTRA RH blk 1 1 blk RH BTRA& RL red 2 2 red RL &
BTRS Gnd shield 3 3 shield Gnd BTRSTO-BB S1 blk 4 4 blk S1 From
S3 wht 5 5 wht S3 LP-5 instwiremicon1 05/02/2000 page 3Gnd hield 6 6 shield Gnd
S2 blk 7 7 blk S2S4 grn 8 8 grn S4
Gnd shield 9 9 shield GndFrom-BB Azimuth blk 10 10 blk Azimuth To-Das
Speed wht 11 11 wht SpeedCom red 12 12 red ComGnd shield 13 13 shield Gnd
14 1415 1516 1617 1718 1819 1920 2021 21
BTYAW RH blk 1 1 blk RH BTYAWTO-BB RL red 2 2 red RL From
Gnd shield 3 3 shield Gnd LP-5S1 blk 4 4 blk S1S3 wht 5 5 wht S3
Gnd shield 6 6 shield GndS2 blk 7 7 blk S2S4 grn 8 8 grn S4
Gnd shield 9 9 shield GndFrom-BB Azimuth blk 10 10 blk Azimuth To-Das
Com red 11 11 red ComGnd shield 12 12 shield Gnd
13 1314 1415 1516 1617 1718 18
Fig. C-21. Accelerometer, Strain Gauge Wiring Diagram.

70
Data AcquisitionAll of the signal wiring from the sensors and the signal conditioning comes in the right side
of the terminal block and out the left side to the data acquisition system, see Fig. C-22.
ANA-4 ANA-1To Sig+ red 1 1 blk Sig+ OC To U+ red 1 1 blk U+ BACTAT1
DAS Sig- blk 2 2 red Sig- From DAS U- blk 2 2 red U- Fromgnd shield 3 3 gnd shield TB-C/V-1 gnd shield 3 3 gnd shield TB-ATI-1
To Sig+ wht 4 4 blk Sig+ AANC V+ wht 4 4 blk V+DAS Sig- blk 5 5 wht Sig- From V- blk 5 5 wht V -
gnd shield 6 6 gnd shield TB-C/V-1 gnd shield 6 6 gnd shieldTo Sig+ grn 7 7 blk Sig+ CASC W + grn 7 7 blk W +
DAS Sig- blk 8 8 grn Sig- From W - blk 8 8 grn W -gnd shield 9 9 gnd shield TB-C/V-1 gnd shield 9 9 gnd shield
10 10 n/c T+ blu 10 10 blk T+11 11 n/c T- blk 11 11 blu T-
gnd shield 12 12 gnd n/c gnd shield 12 12 gnd shieldTo Sig+ yel 13 13 blk Sig+ BACCV To U+ yel 13 13 blk U+ BACCATI
DAS Sig- blk 14 14 red Sig- From DAS U- blk 14 14 red U- Fromgnd shield 15 15 gnd shield TB-C/V-2 gnd shield 15 15 gnd shield TB-ATI-2
To Sig+ brn 16 16 blk Sig+ OV V+ brn 16 16 blk V+DAS Sig- blk 17 17 wht Sig- From V- blk 17 17 wht V-
gnd shield 18 18 gnd shield TB-C/V-2 gnd shield 18 18 gnd shieldTo Sig+ org 19 19 blk Sig+ AANV W + org 19 19 blk W +
DAS Sig- blk 20 20 grn Sig- From W - blk 20 20 grn W -gnd shield 21 21 gnd shield TB-C/V-2 gnd shield 21 21 gnd shield
To Sig+ wht 22 22 blk Sig+ CASV T+ wht 22 22 blk T+DAS Sig- red 23 23 blu Sig- From T- red 23 23 blu T-
gnd shield 24 24 gnd shield TB-C/V-2 gnd shield 24 24 gnd shield
ANA-5 ANA-2To Sig+ red 1 1 blk Sig+ BACTP To U+ red 1 1 blk U+ BACBATI
DAS Sig- blk 2 2 red Sig- From DAS U- blk 2 2 red U- Fromgnd shield 3 3 gnd shield TB-C/V-3 gnd shield 3 3 gnd shield TB-ATI-3
To Sig+ wht 4 4 blk Sig+ BACDTP V+ wht 4 4 blk V+DAS Sig- blk 5 5 wht Sig- From V- blk 5 5 wht V-
gnd shield 6 6 gnd shield TB-C/V-3 gnd shield 6 6 gnd shieldTo Sig+ grn 7 7 blk Sig+ EPR W + grn 7 7 blk W +
DAS Sig- blk 8 8 grn Sig- From W - blk 8 8 grn W -gnd shield 9 9 gnd shield TB-C/V-3 gnd shield 9 9 gnd shield
10 10 n/c T+ blu 10 10 blk T+11 11 n/c T- blk 11 11 blu T-
gnd shield 12 12 gnd n/c gnd shield 12 12 gnd shieldTo Sig+ yel 13 13 blk Sig+ BTOO To U+ yel 13 13 blk U+ BANATI
DAS Sig- blk 14 14 red Sig- DAS U- blk 14 14 red U- Fromgnd shield 15 15 gnd shield gnd shield 15 15 gnd shield TB-ATI-4
To Sig+ brn 16 16 blk Sig+ ATP V+ brn 16 16 blk V+DAS Sig- blk 17 17 wht Sig- V- blk 17 17 wht V-
gnd shield 18 18 gnd shield gnd shield 18 18 gnd shieldTo Sig+ org 19 19 blk Sig+ BTP W + org 19 19 blk W +
DAS Sig- blk 20 20 grn Sig- W - blk 20 20 grn W -gnd shield 21 21 gnd shield gnd shield 21 21 gnd shield
To Sig+ wht 22 22 blk Sig+ CTP T+ wht 22 22 blk T+DAS Sig- red 23 23 blu Sig- T- red 23 23 blu T-
gnd shield 24 24 gnd shield gnd shield 24 24 gnd shield
ANA-6 ANA-3To Sig+ red 1 1 blk Sig+ BTYAW To U+ red 1 1 blk U+ BASATI
DAS Sig- blk 2 2 red Sig- From-BB DAS U- blk 2 2 red Fromgnd shield 3 3 gnd shield gnd shield 3 3 gnd shield TB-ATI-5
To Sig+ wht 4 4 blk Sig+ BTRA V+ wht 4 4 blk V+DAS Sig- blk 5 5 wht Sig- From-BB V- blk 5 5 wht V-
gnd shield 6 6 gnd shield gnd shield 6 6 gnd shieldTo Sig+ grn 7 7 blk Sig+ BTRS W + grn 7 7 blk W +
DAS Sig- blk 8 8 grn Sig- From-BB W - blk 8 8 grn W -gnd shield 9 9 gnd shield gnd shield 9 9 gnd shield
10 10 blk pcm + RS 422 T+ blu 10 10 blk T+11 11 red pcm - to cntl T- blk 11 11 blu T-12 12 gnd n/c bldg gnd shield 12 12 gnd shield13 13 blk clk + To Sig+ yel 13 13 blk Sig+ BACTC14 14 red clk - DAS Sig- blk 14 14 red Sig- From15 15 gnd n/c gnd shield 15 15 gnd shield TB-C/V-116 16 blk xmit Sig+ brn 16 16 blk Sig+ BACCC17 17 wht rcv Sig- blk 17 17 red Sig- From18 18 gnd n/c gnd shield 18 18 gnd shield TB-C/V-119 19 blk spare Sig+ org 19 19 blk Sig+ BACBC20 20 blu spare Sig- blk 20 20 red Sig- From21 21 n/c gnd shield 21 21 gnd shield TB-C/V-122 22 n/c Sig+ wht 22 22 blk Sig+ BAC2C23 23 n/c Sig- red 23 23 red Sig- From24 24 n/c gnd shield 24 24 gnd shield TB-C/V-1
Fig. C-22. Data Acquisition Wiring Diagram.

71
APPENDIX D
INFRASTRUCTURE
The infrastructure for the test site is made up of underground and abovegroundinstrumentation cables, DC and AC electrical wiring, grounding grid, power grid, powertransformers, junction boxes, and turbine controls. The underground cables are run in PVCconduit in the pattern shown in Fig. D-1. The AC power is run in separate conduit from theinstrumentation and DC wires to limit the AC noise that could affect the instrument signals andDC power wiring. A grounding grid is connected to all of the buildings, turbines, andmeteorological towers for lightning protection and power ground.
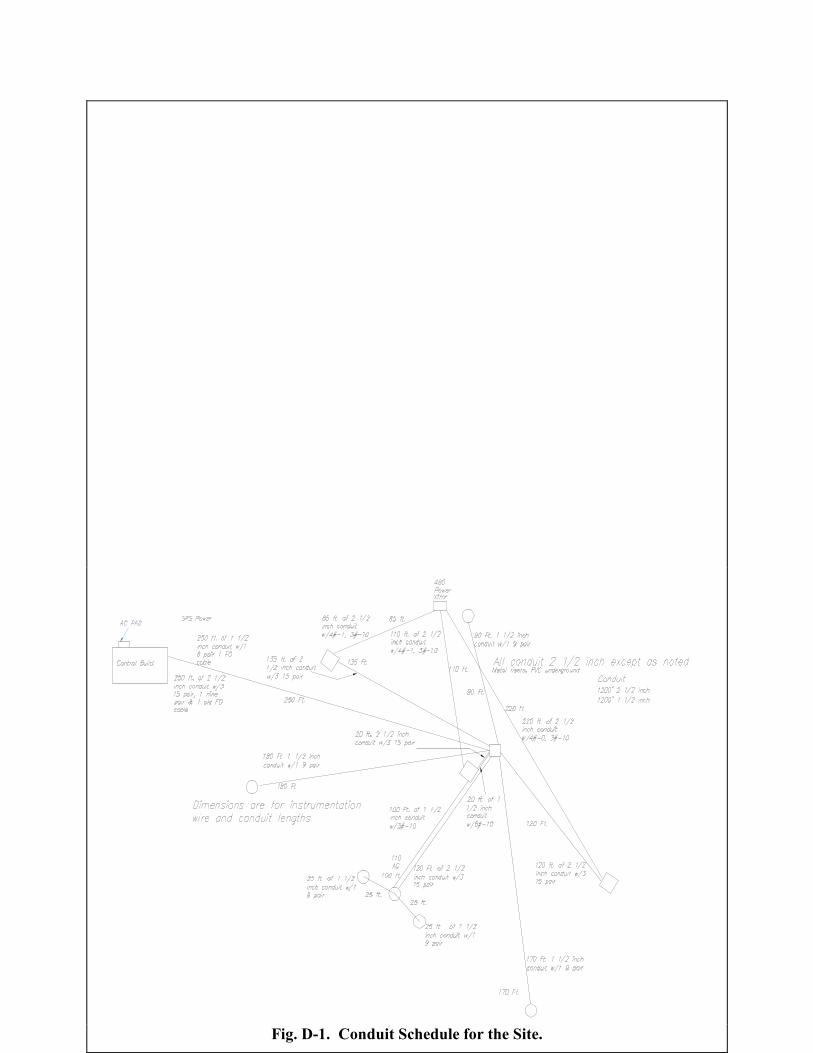
72
Fig. D-1. Conduit Schedule for the Site.

73
Meteorological tower cable types, lengths, and junction boxesA variety of cable lengths and type of cable are used to connect the meteorological
instrumentation to the data acquisition system. Wire in the cable is 18 gauge wire with anoverall shield and a bare copper ground wire. The junction boxes are utilized forinterconnections on terminal strips located in the junction boxes, see Fig. D-2.
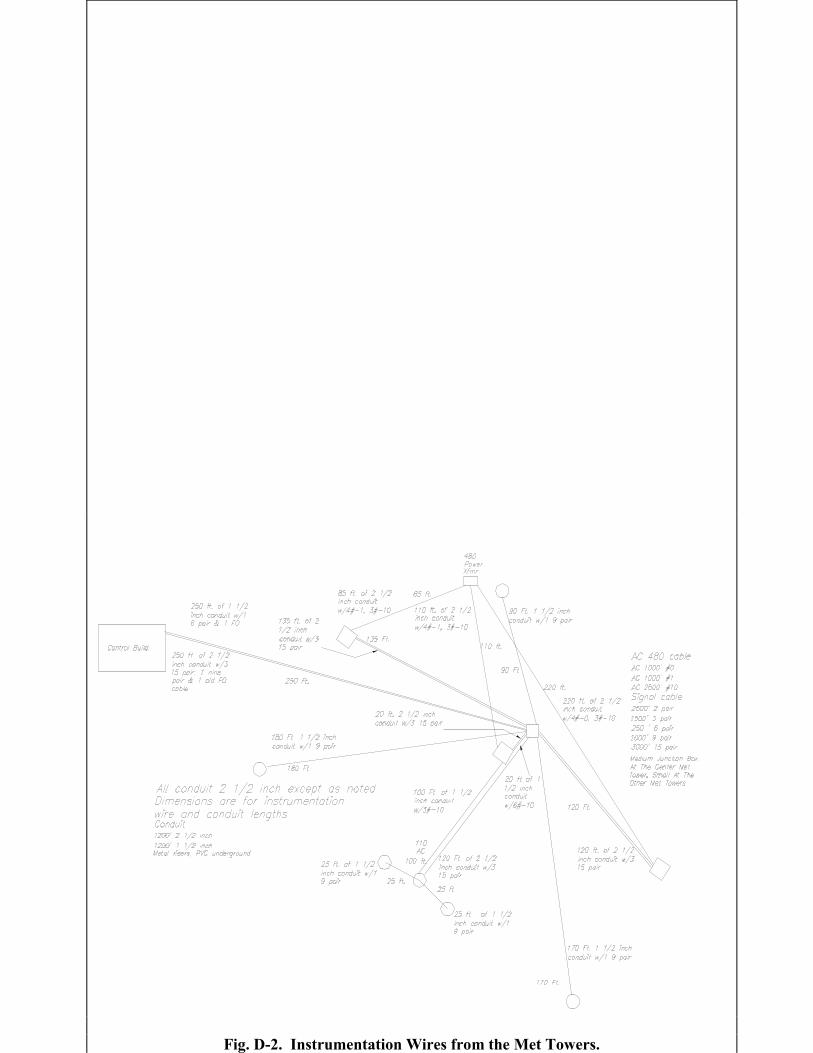
74
Fig. D-2. Instrumentation Wires from the Met Towers.

75

76
Turbine instrument wires and junction boxes
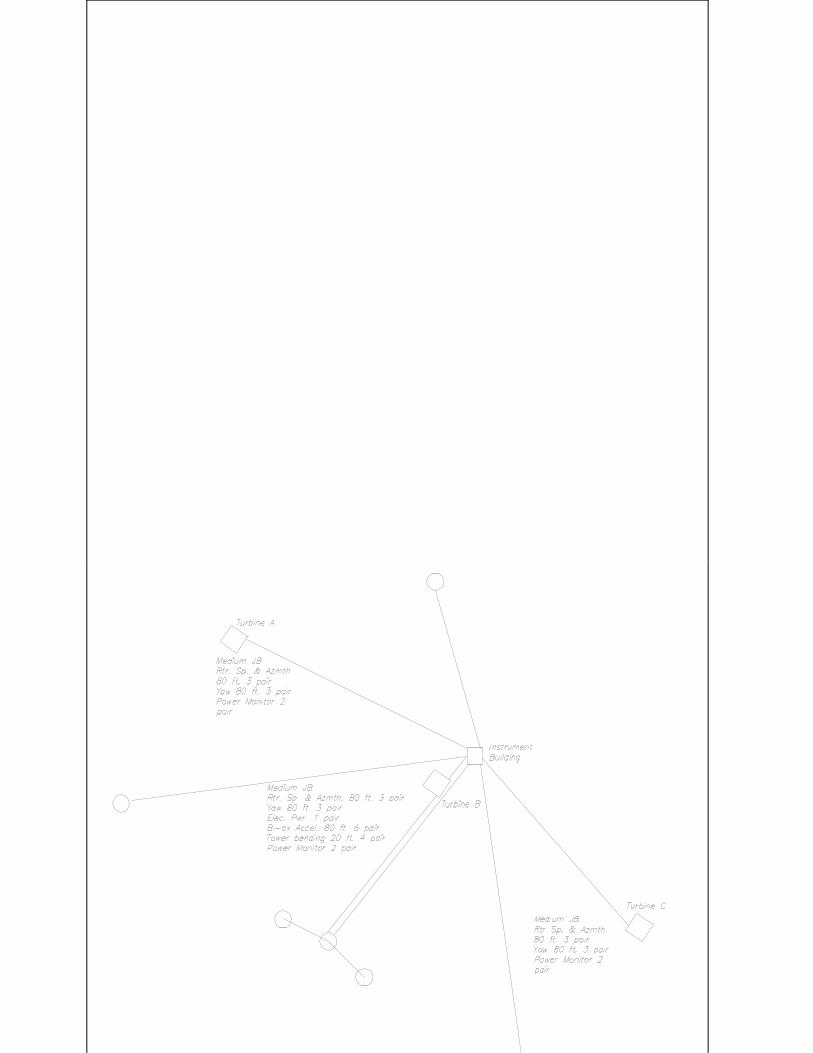
77

78
A variety of cables are used to connect the Turbine instrumentation to the data acquisitionsystem. Wire in the cable is 18 gauge wire with an overall shield and a bare copper ground wire.The junction boxes are utilized for interconnections on terminal strips located in the junctionboxes, see Fig. D-3.

79
AC Transformer PowerAC power is brought onto the site from the local utility, Southwest Public Service (SPS) and
fed into the main three-phase 480 volt transformer. Power from the 480 volt transformer to theturbine transformers, and the instrument enclosure is run in PVC conduit underground. Eachturbine has a separate transformer with a switch and breaker panel. The instrument buildingheating, and cooling are on one transformer. The instrument enclosure fans, lights, UPS,instrument power, and turbine B are on another transformer. Turbine A and turbine C are ontheir own separate transformers. Power generated by each of the turbines is sent through theturbine control junction box and then to its respective transformer and out to the SPS power grid,see Fig. D-4.
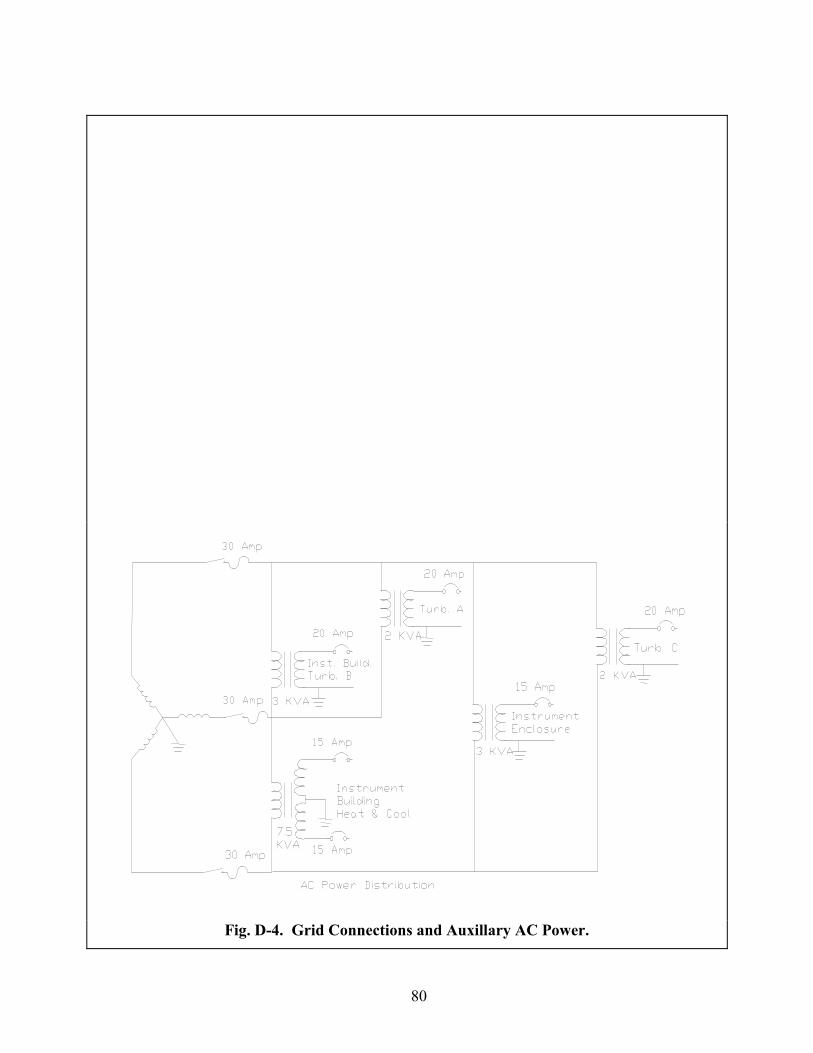
80
Fig. D-4. Grid Connections and Auxillary AC Power.
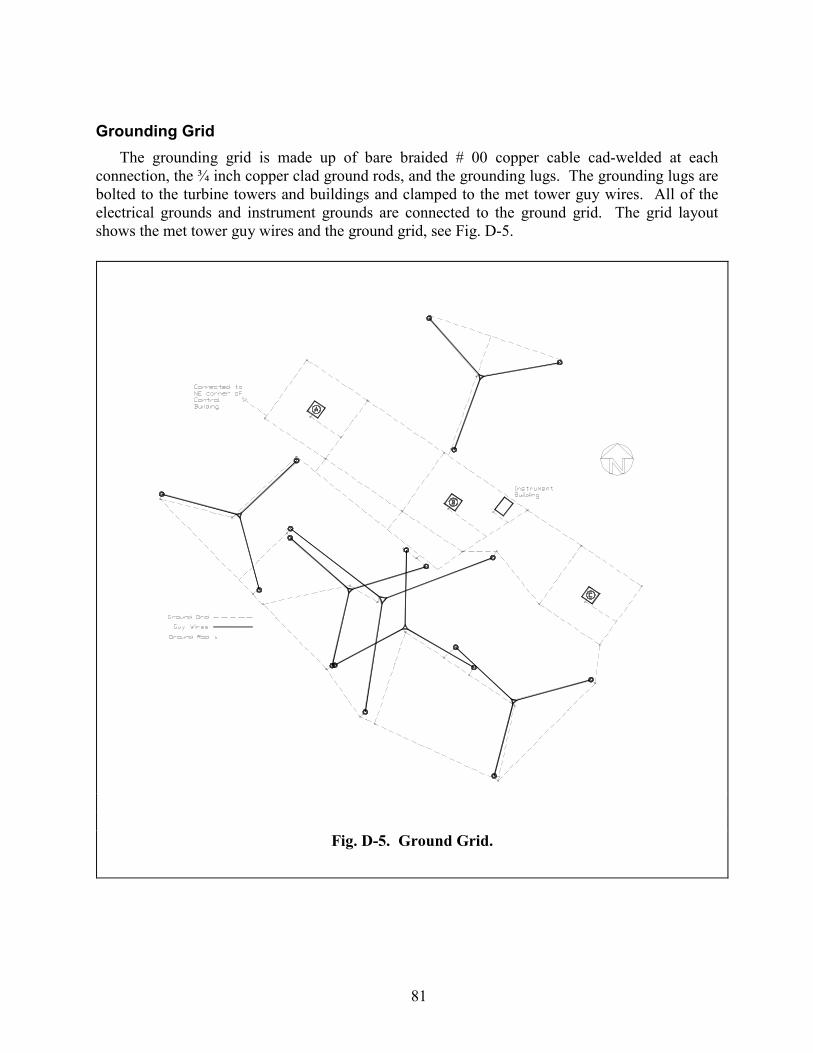
81
Grounding GridThe grounding grid is made up of bare braided # 00 copper cable cad-welded at each
connection, the ¾ inch copper clad ground rods, and the grounding lugs. The grounding lugs arebolted to the turbine towers and buildings and clamped to the met tower guy wires. All of theelectrical grounds and instrument grounds are connected to the ground grid. The grid layoutshows the met tower guy wires and the ground grid, see Fig. D-5.
Fig. D-5. Ground Grid.
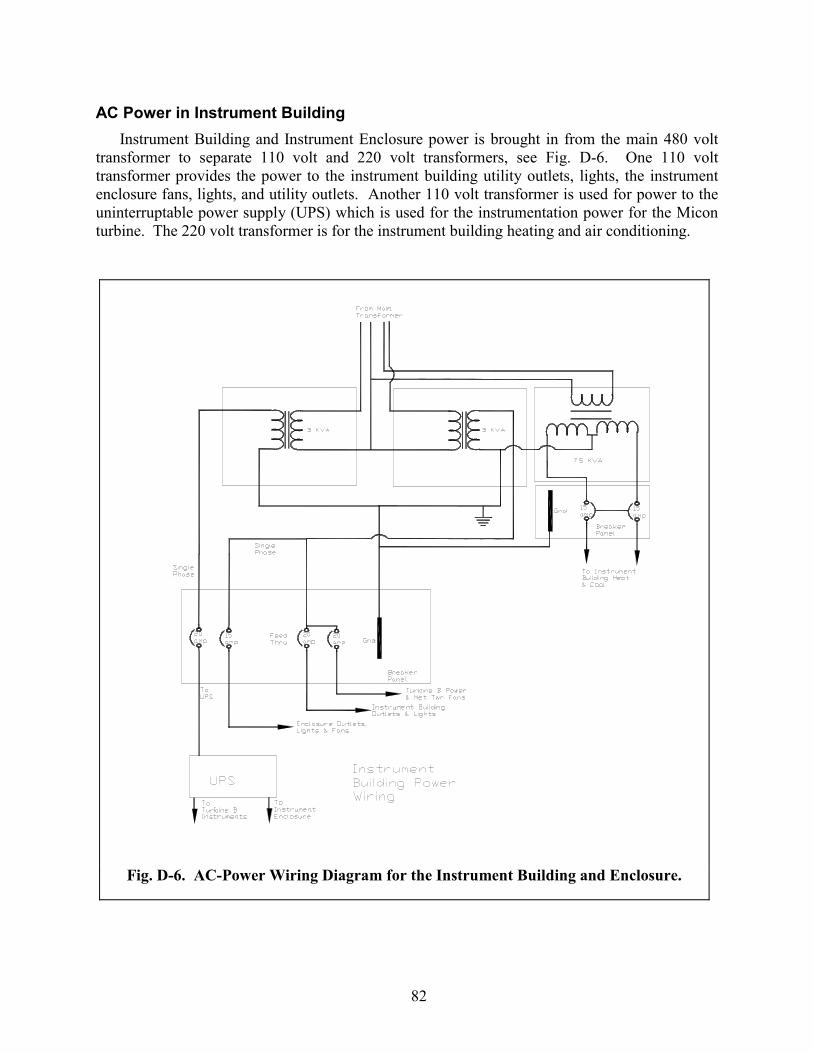
82
AC Power in Instrument BuildingInstrument Building and Instrument Enclosure power is brought in from the main 480 volt
transformer to separate 110 volt and 220 volt transformers, see Fig. D-6. One 110 volttransformer provides the power to the instrument building utility outlets, lights, the instrumentenclosure fans, lights, and utility outlets. Another 110 volt transformer is used for power to theuninterruptable power supply (UPS) which is used for the instrumentation power for the Miconturbine. The 220 volt transformer is for the instrument building heating and air conditioning.
Fig. D-6. AC-Power Wiring Diagram for the Instrument Building and Enclosure.


