

1
Logistic Modeling of University Choice among Student Migrants to
Karnataka for Higher Education
*Dr. Veena A
**Sandeep Rao
Abstract
Universities often study the broad characteristics of students who have migrated to their state for
educational purposes. This provides them with opportunities to collaborate with the state
government in order to introduce educational policies which can influence the students’ migration
decisions. While there already exist studies that focus on the determinants of student migration,
this paper uses the logistic regression model to assess the probability of choice of private
universities while using primary data collected from students who migrated to Karnataka. This
paper also tests various hypotheses and finds that the admission quota has no significant effect on
the choice of private university among migrant students.
Key Words: Migration for education, Choice of university, Higher Education, Logit Model
*Dr.Veena.A is Professor in Department of management studies, PES University, Bangalore. She
has pursued her PhD in Supply Chain Management. She has to her credit eleven research papers
published in peer reviewed national journals. She has presented several papers in national and
international conferences. Her areas of research include Supply Chain Management, Project
Management and Migration. She can be reached at [email protected]
**Sandeep Rao is a Commonwealth Doctoral Research Scholar in Finance at the Strathclyde
Business School, University of Strathclyde, Glasgow, UK. His areas of research include Financial
markets contagion, International finance and migration. He can be reached at
2
Introduction
Education migration provides useful insight for policy makers regarding the determinants, effects
of migration for education and how this may lead to regional imbalances and impede structural
economic development in certain states. Choice of education is based mainly on rational thinking.
However, irrational behaviour among student population can also sometimes influence their
migration decisions. There exists a legion of literature on determinants for push and pull factors
for both inter-state and international migration. There are two main factors influencing the decision
to migrate. One being the geographic location and the second being the choice of the type of
institution for education. Researchers have contributed significantly to the first question while
addressing the reasons for students’ migration to a specific geographic location (within the country
or abroad).This paper tries to establish whether students’ demographic factors influence their
choice of type of institution with special reference to Karnataka, India. According to the
Directorate of Economics and Statistics, Government of Karnataka, this Indian state has an annual
GSDP of Rupees 871,995 crores and a GDP of Rupees 12,165,481 crore (2016-17). 2011 census
shows that 720,385 people of the total 25,078,333 migrants were for the purpose for education,
which is an increase of more than 3800 percent over the 18,190 student migrants as per 2001
census.
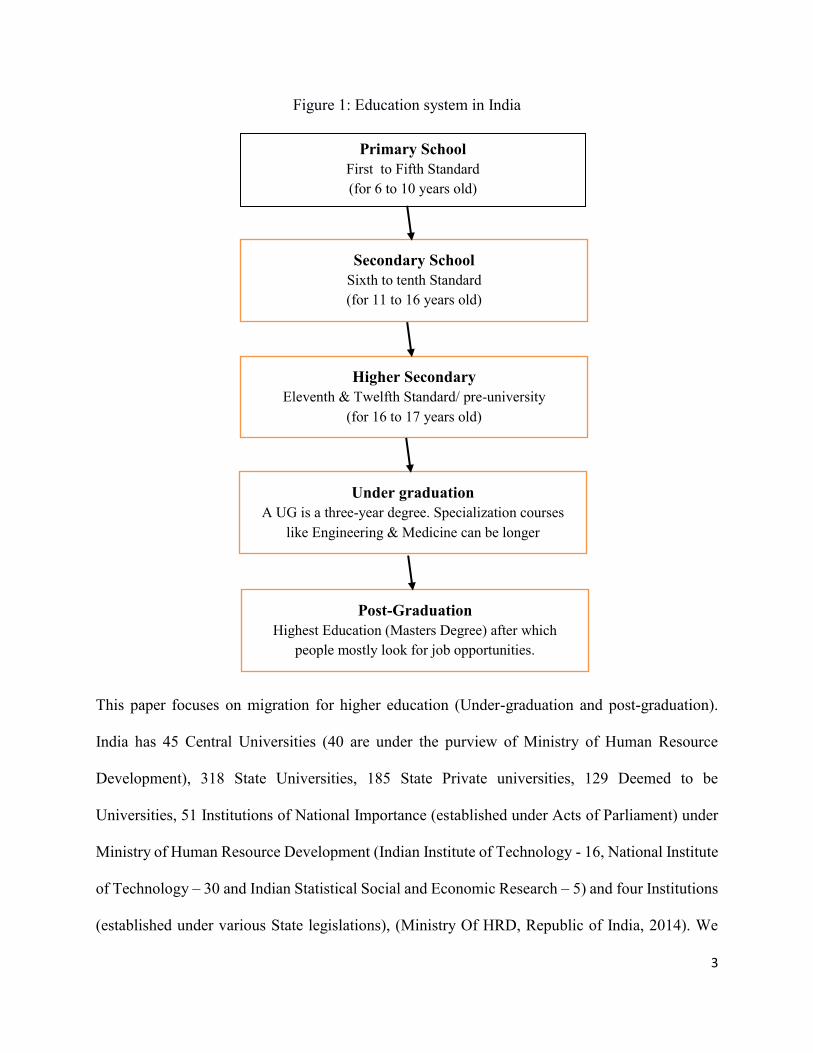
2009 Right to Education Act of the Indian constitution provides free and compulsory schooling
for all children between the ages of 6 to 14 years. The broad Indian education system stages are
shown in the figure-1 which are classified based on age group and degree into five broad categories
– primary, secondary, higher secondary, under graduation and post-graduation.
3
Figure 1: Education system in India
This paper focuses on migration for higher education (Under-graduation and post-graduation).
India has 45 Central Universities (40 are under the purview of Ministry of Human Resource
Development), 318 State Universities, 185 State Private universities, 129 Deemed to be
Universities, 51 Institutions of National Importance (established under Acts of Parliament) under
Ministry of Human Resource Development (Indian Institute of Technology - 16, National Institute
of Technology – 30 and Indian Statistical Social and Economic Research – 5) and four Institutions
(established under various State legislations), (Ministry Of HRD, Republic of India, 2014). We
Primary School
First to Fifth Standard
(for 6 to 10 years old)
Secondary School
Sixth to tenth Standard
(for 11 to 16 years old)
Higher Secondary
Eleventh & Twelfth Standard/ pre-university
(for 16 to 17 years old)
Under graduation
A UG is a three-year degree. Specialization courses
like Engineering & Medicine can be longer
Post-Graduation
Highest Education (Masters Degree) after which
people mostly look for job opportunities.

4
classify these institutes broadly into Private and Non-Private Higher Educational Institutions
(hereon called as HEI) for this study. Private HEI include private universities, deemed universities
and autonomous institutions wholly managed and run by private bodies, societies and/or trusts. All
other HEI are classified under non-private HEI.
Literature Review
The choice process has changed significantly during the past half-century as a result of changes in
student demographics as well as the development of institutional admissions and marketing
practices (Kinzie, et al., 2004). Student decision-making process is classified into three phases:
aspirations development and alternative evaluation; options consideration; and evaluation of the
remaining options and final decision (Jackson, 1982).
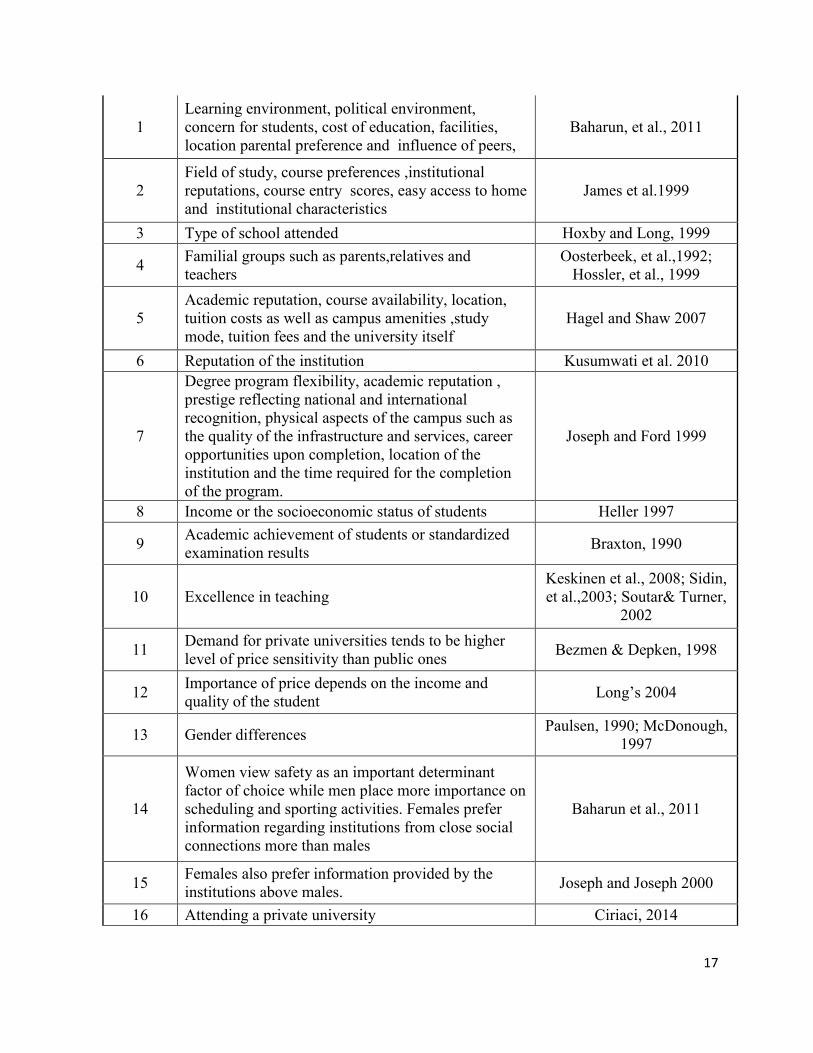
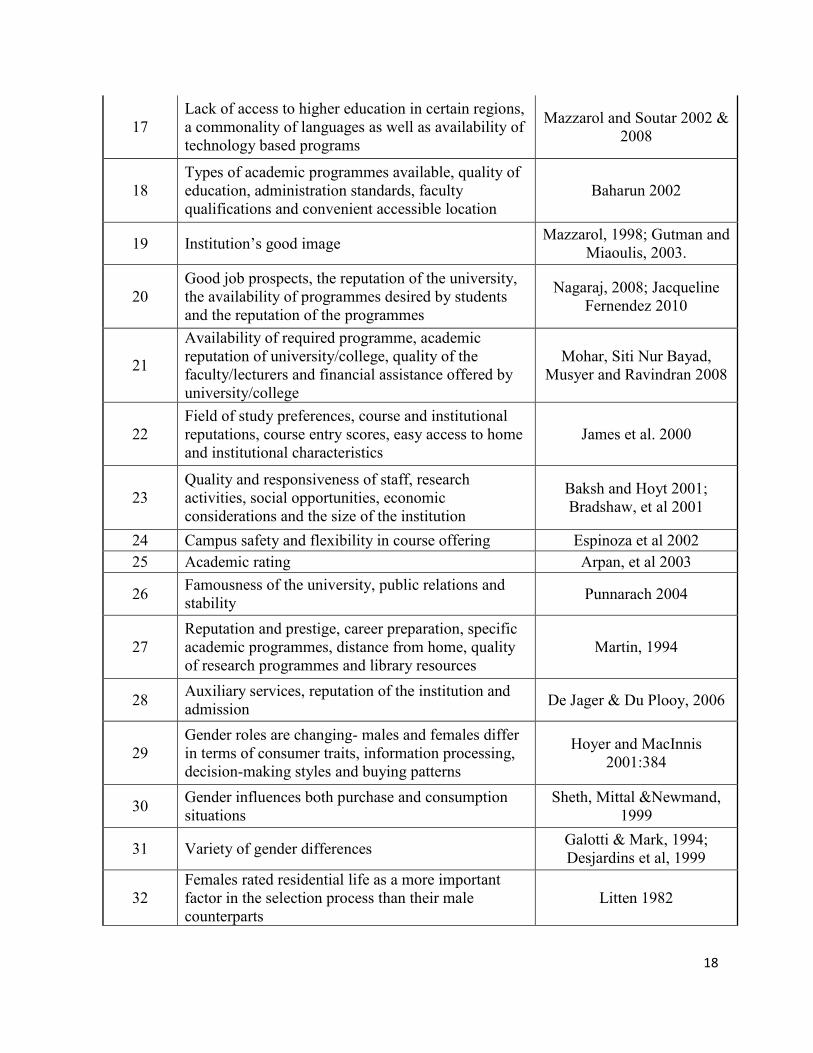
Many previous studies distinguish between the important levels of different choice factors (Sevier,
1993; Freeman, 1999; Bers & Galowich, 2002; Price Matzdorf, Shin & Milton, 2004). Some of
them are listed in the table 1.
Essentially, most of the researches have concluded that the administrators of universities and
colleges need to realize that students have become very selective and are more well-informed in
selecting the higher institutions to pursue their education. This requires more research along these
lines to better understand the needs and requirements of students.
Insert table 1 here
5
Conceptual Framework and Need for the Study
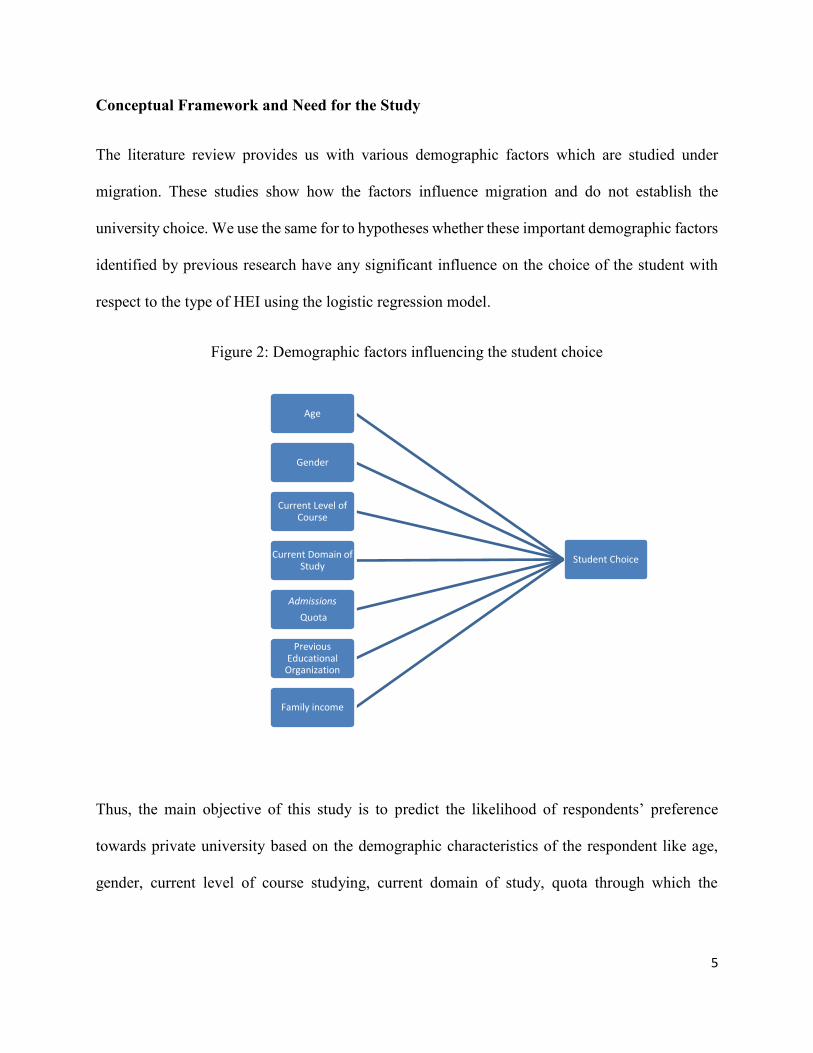
The literature review provides us with various demographic factors which are studied under
migration. These studies show how the factors influence migration and do not establish the
university choice. We use the same for to hypotheses whether these important demographic factors
identified by previous research have any significant influence on the choice of the student with
respect to the type of HEI using the logistic regression model.
Figure 2: Demographic factors influencing the student choice
Thus, the main objective of this study is to predict the likelihood of respondents’ preference
towards private university based on the demographic characteristics of the respondent like age,
gender, current level of course studying, current domain of study, quota through which the
Student Choice
Age
Gender
Current Level of Course
Current Domain of Study
Admissions
Quota
Previous Educational Organization
Family income

6
admission is sought, the current annual income of the family and the type of previous educational
organization studied.
Hypotheses for the Study
The following are the proposed Hypotheses
H1: Age has no significant effect on predicting the selection of private university for higher
education in Karnataka by migrant students.
H2: Gender has no significant effect on predicting the selection of private university for higher
education in Karnataka by migrant students.
H3: Current level of course has no significant effect on predicting the selection of private
university for higher education in Karnataka by migrant students.
H4: Current domain of study has no significant effect on predicting the selection of private
university for higher education in Karnataka by migrant students.
H5: Admission Quota has no significant effect on predicting the selection of private university
for higher education in Karnataka by migrant students.
H6: Annual income of family has no significant effect on predicting the selection of private
university for higher education in Karnataka by migrant students.
H7: Previous educational organization has no significant effect on predicting the selection of
private university for higher education in Karnataka by migrant students.
Limitations of the Study:
1. The study is limited only to the students migrated to Karnataka for education
7
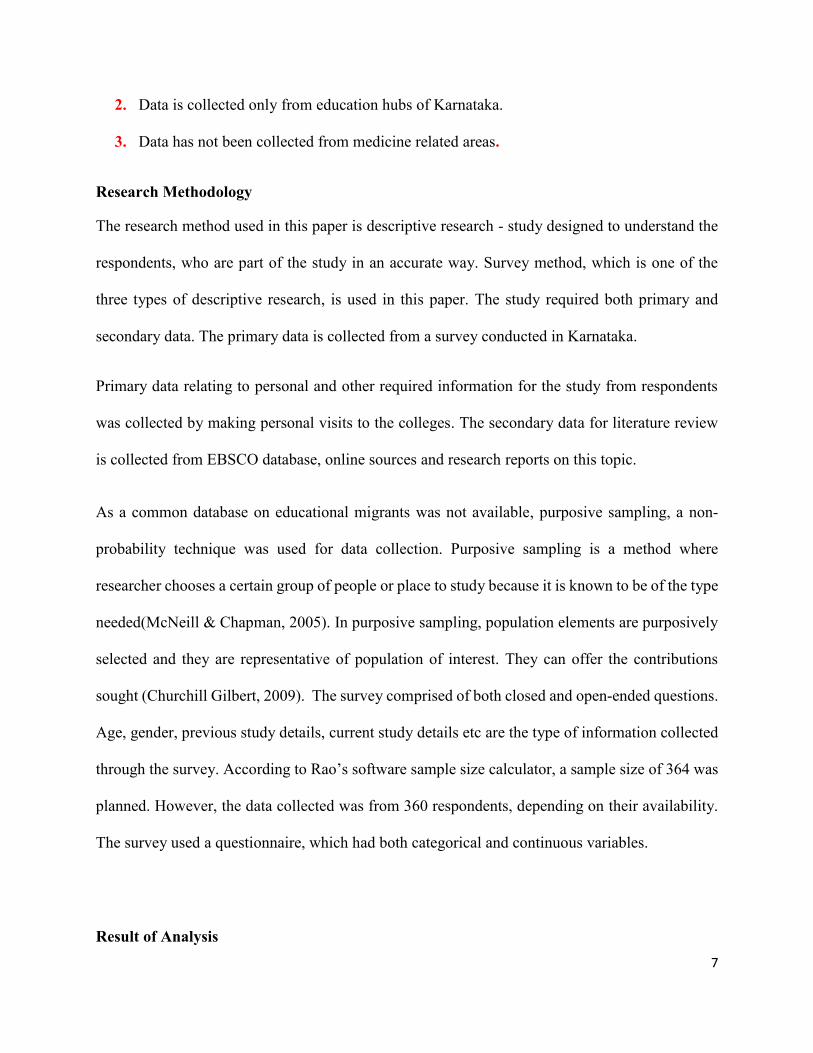
2. Data is collected only from education hubs of Karnataka.
3. Data has not been collected from medicine related areas.
Research Methodology
The research method used in this paper is descriptive research - study designed to understand the
respondents, who are part of the study in an accurate way. Survey method, which is one of the
three types of descriptive research, is used in this paper. The study required both primary and
secondary data. The primary data is collected from a survey conducted in Karnataka.
Primary data relating to personal and other required information for the study from respondents
was collected by making personal visits to the colleges. The secondary data for literature review
is collected from EBSCO database, online sources and research reports on this topic.
As a common database on educational migrants was not available, purposive sampling, a non-
probability technique was used for data collection. Purposive sampling is a method where
researcher chooses a certain group of people or place to study because it is known to be of the type
needed(McNeill & Chapman, 2005). In purposive sampling, population elements are purposively
selected and they are representative of population of interest. They can offer the contributions
sought (Churchill Gilbert, 2009). The survey comprised of both closed and open-ended questions.
Age, gender, previous study details, current study details etc are the type of information collected
through the survey. According to Rao’s software sample size calculator, a sample size of 364 was
planned. However, the data collected was from 360 respondents, depending on their availability.
The survey used a questionnaire, which had both categorical and continuous variables.
Result of Analysis

8
The study uses logistic regression for predicting the likelihood of respondents’ choice between
two outcome categories of ‘selecting private university’ or ‘not selecting private university’ when
migrating to Karnataka for higher education. Logistic regression helps to distinguish between two
groups. Using IBM SPSS-21.00, the logistic regression output was generated using ‘selecting
private university’ or ‘not selecting private university’ as dependent variable and age group,
gender, current level of course, current domain of study, admissions quota, family income and
previous educational organization as explanatory variables.
In the Logit model ‘selecting private university’ is treated as success and is coded as 1, where
as"not selecting the private university" is treated as failure with code 0.
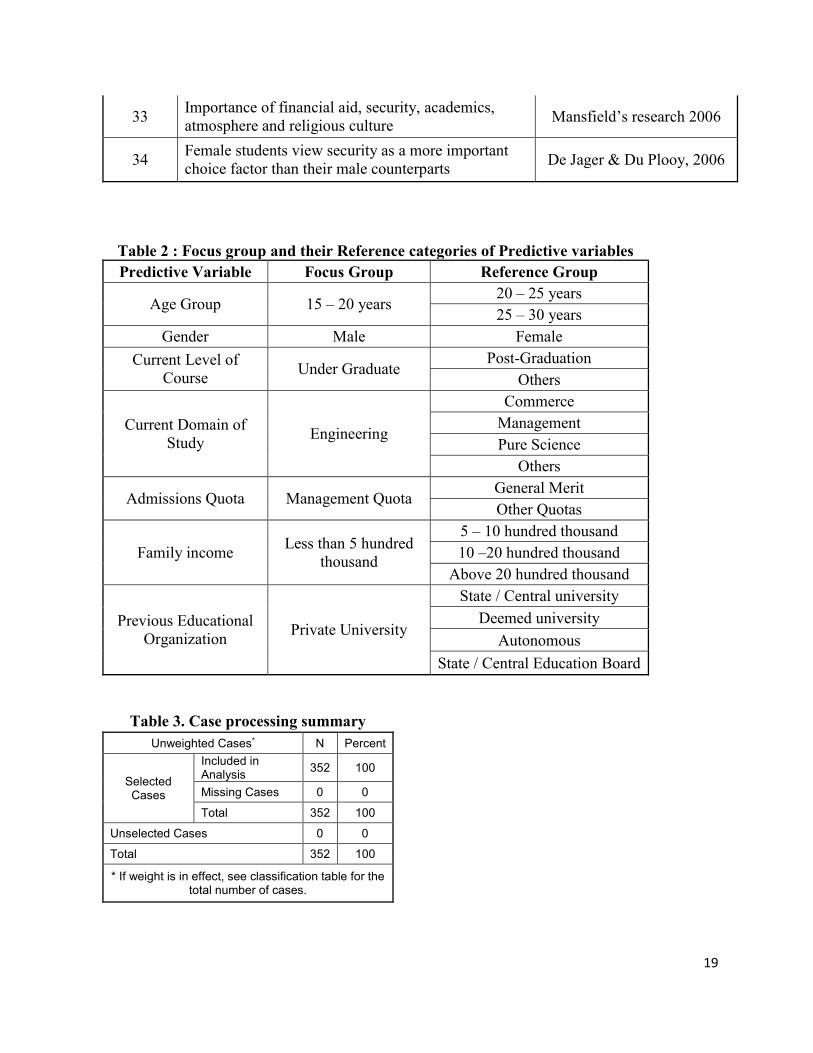
For all the predictive variables, respective focus group and their reference categories are given in
the table 2
Hosmer and Lemeshow test statistic was generated with 0.05 level of significance for odds ratio.
The classification cut-off (0.5), was used for classifying each case into reference and focus group.
The output of binary logistic regression is as follows. The table 3 and 4 shows the total number of
respondents processed for analysis and the frequencies of categorical variables.
The classification table 5 shows the intercept model without any independent variable. The table
5 shows that 52.8 percentage of students who migrate to Karnataka would have chosen the private
university for higher education in Karnataka, without further categorization of students.
Insert table 4 here
Insert table 3 here
Insert table 2 here
9
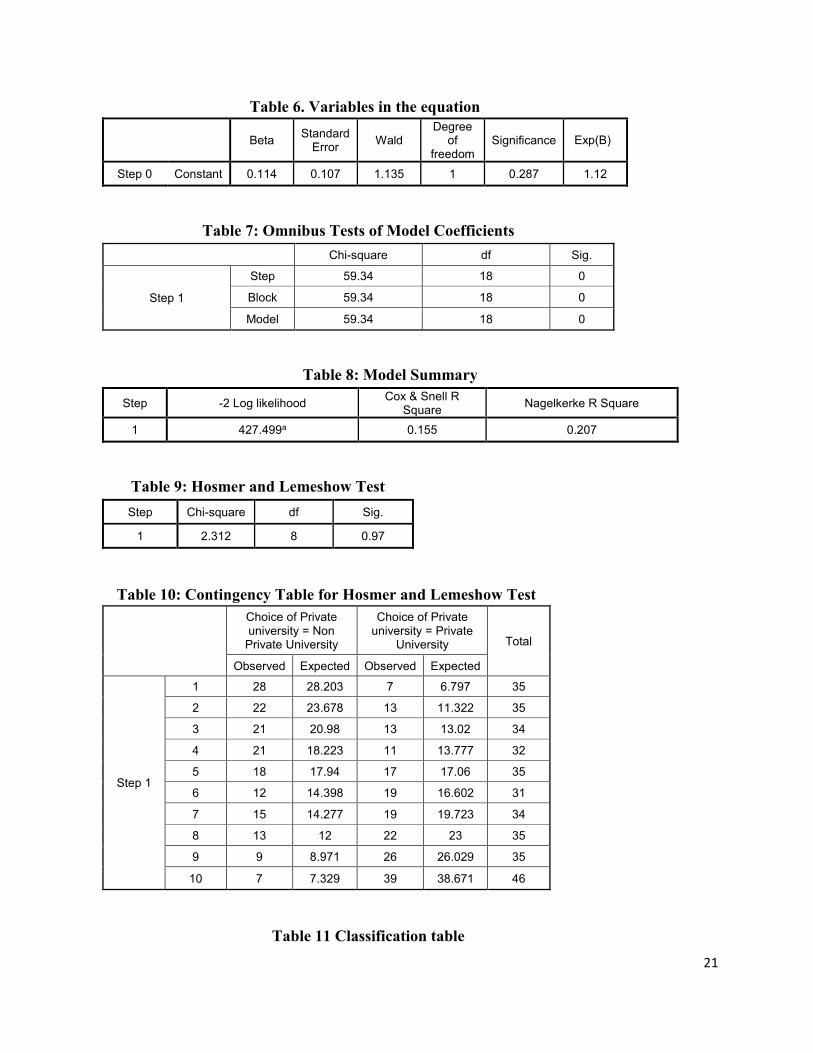
Table 6 shows the variables in the equation for the intercept model with no other predictive
variables, an odds ratio of 1.120 is seen, which denotes that there is 1.12 times likelihood that a
student migrant will choose private university for higher education in Karnataka
Table 7 shows the results of Omnibus Tests of Model Coefficients. The model chi-square is 59.340
and is statistically significant at 5 percent level of significance with 18 degrees of freedom.
The Nagelkerke R Square value is 0.207 (Table 8). We can conclude that approximately 21 percent
of the variance associated with the selection of private university is explained by all the
independent variables considered in the model. R squared value equal to or above 0.20in research
relating to social science are considered substantial (Cohen, 1998).
The Hosmer and Lemeshow Test assess how well the predicted probabilities match the observed
probabilities using the Chi-square goodness of fit statistic. The goal is to obtain a non-significant
p-value (Mayers, Gamst, Guarino, 2013).
Table 9 shows a chi-square value of 2.312 with a p-value of 0.97, which is non-significant at 5
percent level of significance. This shows that there is no significant variance between the predicted
and actual probabilities.
Insert table 5 here
Insert table 6 here
Insert table 7 here Insert table 8 here
Insert table 9 here

10
The table 10 shows the contingency table for Hosmer and Lemeshow Test. From table 9, it is clear
that the observed value and expected value of the choice of private university selection are
approximately equal.
The classification Table 11 shows the overall predictive accuracy of the model to be 66.2 percent
with various independent variables introduced in the model.
The table 11 indicates 130 cases has observed cases of ‘selecting private university’ and is
correctly predicted as the case of success and 103 cases are observed to be ‘not selecting the private
university’ and are correctly predicted as failure. However, 63 cases observed to be ‘not selecting
the private university’ are predicted as ‘selecting private university’ and similarly 56 cases are
observed as success instead of failure. This it shows that approximately 66 percentage of students
who migrate to Karnataka would have chosen the private university for higher education in
Karnataka.
The table 12 shows the variables in the equation, significance levels and their odds ratio.
Significance of predictive variables and the support for hypothesis is provided in table 13
Thus the Logistic model can be written as below
P(success) = A/(1+A), where A=e(log(odds of choice 1(selecting private university)))
Insert table 10 here
Insert table 11 here
Insert table 12 here
Insert table 13 here

11
If the value of probability is greater than 0.5 then the respondent is considered to select private
university else the respondent selects a university other than private which could be state, central
or deemed university.
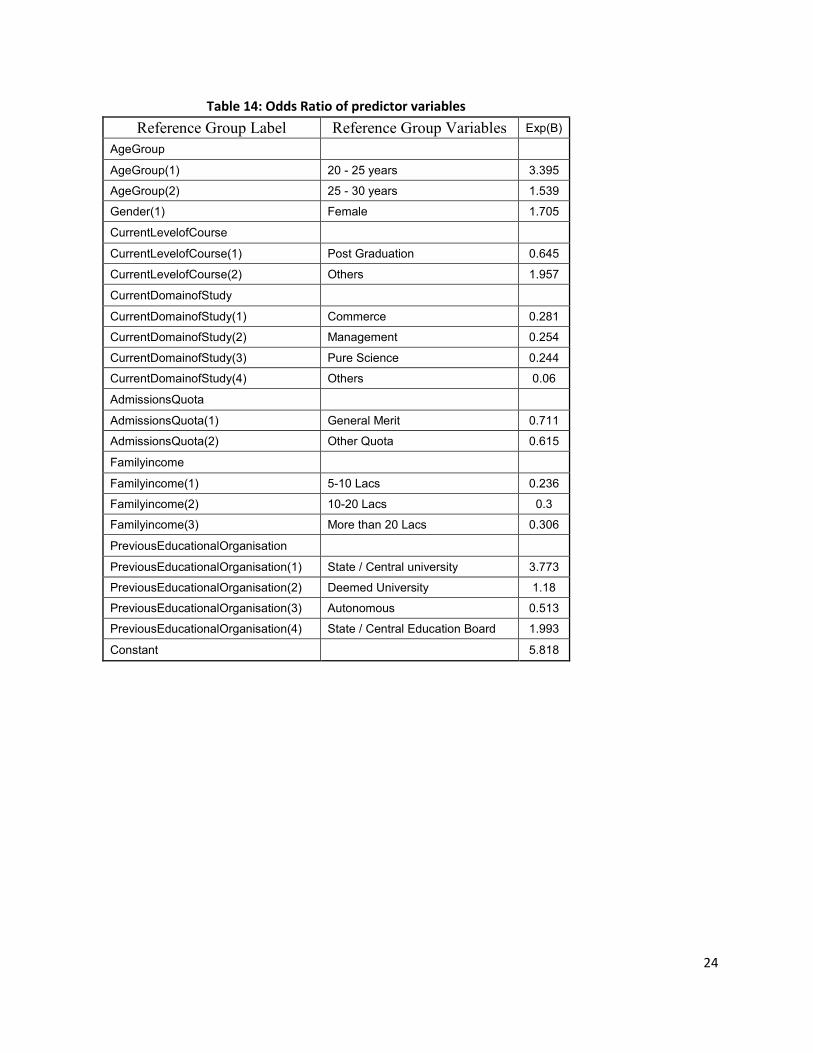
Exp(B) column in table 14 shows the odds ratio associated with each predictor at 5% level of
significance. The odds ratio for age group 20 - 25 years is 3.395, can be interpreted as the odds of
respondents belonging to this age group selecting private university is 3.395 times the odds of the
age group 15 – 20 years, controlling all other explanatory variables. The odds ratio of female to
male is 1.705, the odds of students studying in state/central university for selecting private
university is 3.773 when compared to those already studying in private university and finally the
odds of students studying post – graduation to select private university is 0.645 than those studying
under graduate programs.
Discussion
This paper predicts the likelihood of respondents’ choice between two outcome categories of
‘selecting private university’ or ‘not selecting private university’ when migrating to Karnataka for
higher education using predictor variables like age, gender, current level of course, current domain
of study, admissions quota, family income and previous educational institution. The Nagelkerke
R Square value shows approximately 21 percent of the variance associated with the selection of
private university is explained by all the independent variables taken in the model and the Hosmer
and Lemeshow Test shows an overall predictive accuracy of the model to be 66.2 percent with
various independent variables introduced in the model. While all the factors tested for hypothesis
Insert table 14 here
12
shows significant effect on predicting the selection of private university for higher education in
Karnataka by migrant students, Admission Quota has no significant effect.
The Odds ratios for choice of private universities shows that odds of respondents belonging to this
20-25 years group selecting private university is 3.395 times the odds of the age group 15 – 20
years. Similarly, female has an odds ratio of 1.705, Post-graduation (current level of course) has
an odds ratio of 0.645, respondents who studied in State / Central university previously has an
odds ratio of 3.773 when compared to those who studied in private university previously.
Conclusion
Understanding the choice of university is important for private educational institutions as it
provides them the necessary data to probe further into how they could improve their admissions
and also better formulate their promotion strategies. While private institutions are keen on this, the
government of both the migration destination and origin states can use the information to analyze
the impact of state policies on Higher education. At the base level we have shown how the odds of
Admissions Quota has little influence on the choice of university type especially for the migrating
students. So, the question to ask here is whether the ‘Quota’ system in one’s own state is influencing
migration, or how effective this system is in achieving its intended objectives.
References
Arpan, L. M., Raney, A. A., & Zivnuska, S. (2003). A cognitive approach to understanding
university image. Corporate Communications: An International Journal, 8(2), 97-113.
Baharun, R. (2002). A study of market segmentation in tertiary education for local public higher
learning institutes. Universiti Teknologi Malaysia.
Baharun, R., Awang, Z., & Padlee, S. F. (2011). International students choice criteria for selection
of higher learning in Malaysian private universities. African journal of Business management,
5(12), 4704-4714.
13
Baksh, A., & Hoyt, J. E. (2001). The effect of academic scholarships on college attendance.
College and University, 76(4), 3.
Bers, T. H., & Galowich, P. M. (2002). Using survey and focus group research to learn about
parents' roles in the community college choice process. Community College Review, 29(4), 67-
82.
Bezmen, T., & Depken, C. A. (1998). School characteristics and the demand for college.
Economics of Education Review, 17(2), 205-210.
bin Yusof, M., binti Ahmad, S. N. B., bin Mohamed Tajudin, M., & Ravindran, R. (2008). A study
of factors influencing the selection of a higher education institution. UNITAR e-journal, 4(2), 27-
40.
Braxton, J. M. (1990). How students choose colleges. The strategic management of college
enrollments, 57-67.
Chapman, S., McNeill, P., & Mcneill, P. (2005). Research methods. Routledge.
Churchill Jr, G. A. (1979). A paradigm for developing better measures of marketing constructs.
Journal of marketing research, 64-73.
Ciriaci, D., & Muscio, A. (2014). University choice, research quality and graduates' employability:
Evidence from Italian national survey data. European Educational Research Journal, 13(2), 199-
219.
Cohen, J. 1988. Statistical power analysis for the behavioral sciences, 2nd ed. Hillsdale, NJ:
Lawrence Erlbaum Associates.
DesJardins, S. L., Dundar, H., & Hendel, D. D. (1999). Modeling the college application decision
process in a land-grant university. Economics of Education Review, 18(1), 117-132.
Du Plooy, A. T., & De Jager, J. W. (2006). Student's expectations of service quality in tertiary
education: A comparison between prospective and current students. Professional Accountant, 6(1),
10-19.
Espinoza, S., Bradshaw, G., & Hausman, C. (2002). The importance of college choice factors from
the perspective of high school counselors. College and University, 77(4), 19.
El George Bradshaw, S. E., & Hausman, C. (2001). The college decision-making of high achieving
students. College and University, 77, 2.
Fernandez, j.(2010). An exploratory study of factors influencing the decision of students to study
at universitisains Malaysia. Kajian Malaysia: Journal of Malaysian studies, 28(2).
14
Ford, J. B., Joseph, M., & Joseph, B. (1999). Importance-performance analysis as a strategic tool
for service marketers: the case of service quality perceptions of business students in New Zealand
and the USA. Journal of Services marketing, 13(2), 171-186.
Galotti, K. M., & Mark, M. C. (1994). How do high school students structure an important life
decision? A short-term longitudinal study of the college decision-making process. Research in
Higher Education, 35(5), 589-607.
Geoffrey, N. S., & Julia, P. T. (2002). Students' preferences for university: a conjoint analysis. The
International Journal of Educational Management, 16(1), 40-45.
Gutman, J., & Miaoulis, G. (2003). Communicating a quality position in service delivery: an
application in higher education. Managing Service Quality: An International Journal, 13(2), 105-
111.
Hagel, P., & Shaw, R. (2007). The influence of delivery mode on consumer choice of university.
ACR European Advances.
Harrison, J. S., & Freeman, R. E. (1999). Stakeholders, social responsibility, and performance:
Empirical evidence and theoretical perspectives. Academy of management Journal, 42(5), 479-
485.
Heller, D. E. (1997). Student price response in higher education: An update to Leslie and
Brinkman. The Journal of Higher Education, 68(6), 624-659.
Hossler, D., Schmit, J., & Vesper, N. (1999). Going to college: How social, economic, and
educational factors influence the decisions students make. JHU Press.
Hoyer, W. D., and D. J. MacInnis. 2001. Consumer Behaviour,Second edition. Boston: Houghton
Mifflin.
Hoxby, C. M., & Terry, B. (1999). Explaining rising income and wage inequality among the
college educated (No. w6873). National Bureau of Economic Research.
Jackson, G. A. (1982). Public efficiency and private choice in higher education. Educational
evaluation and policy analysis, 4(2), 237-247.
James, R. (2000). Non‐ traditional students in Australian higher education: Persistent inequities
and the new ideology of ‘student choice’. Tertiary Education & Management, 6(2), 105-118.
James, R., Baldwin, G., & McInnis, C. (1999). Which University?: The factors influencing the
choices of prospective undergraduates (Vol. 99, No. 3). Canberra: Department of Education,
Training and Youth Affairs.

15
Joseph, M., & Joseph, B. (2000). Indonesian students’ perceptions of choice criteria in the
selection of a tertiary institution: Strategic implications. International Journal of Educational
Management, 14(1), 40-44.
Keskinen, E., Tiuraniemi, J., & Liimola, A. (2008). University selection in Finland: how the
decision is made. International Journal of Educational Management, 22(7), 638-650.
Kusumawati, A., Yanamandram, V. K., & Perera, N. (2010). Exploring student choice criteria for
selecting an Indonesian public university: A preliminary finding.
Long, B. T. (2004). How have college decisions changed over time? An application of the
conditional logistic choice model. Journal of econometrics, 121(1-2), 271-296.
Litten, L. H. (1982). Different strokes in the applicant pool: Some refinements in a model of
student college choice. The Journal of Higher Education, 53(4), 383-402.
Mansfield, P. M., & Warwick, J. (2006). Gender differences in students' and parents' evaluative
criteria when selecting a college. Journal of Marketing for Higher Education, 15(2), 47-80.
Mansfield, P. M., & Warwick, J. (2006). Gender differences in students' and parents' evaluative
criteria when selecting a college. Journal of Marketing for Higher Education, 15(2), 47-80.
Martin, C. (1994). How do rural students choose a university?: A case study of a regional campus.
Rural Society, 4(2), 22-26.
Meyers, L. S., Gamst, G. C., & Guarino, A. J. (2013). Performing data analysis using IBM SPSS.
John Wiley & Sons.
Mazzarol, T. (1998). Critical success factors for international education marketing. International
Journal of Educational Management, 12(4), 163-175.
Mazzarol, T., & Soutar, G. N. (2002). “Push-pull” factors influencing international student
destination choice. International Journal of Educational Management, 16(2), 82-90.
Mazzarol, T. W., & Soutar, G. N. (2008). Australian educational institutions' international markets:
a correspondence analysis. International Journal of Educational Management, 22(3), 229-238.
McDonough, P. M. (1997). Choosing colleges: How social class and schools structure opportunity.
Suny Press.
Nagaraj, S., Munisamy, S., Jaafar, N. I. M., Wahab, D. A., & Mirzaei, T. (2008). How do
undergraduates choose their university? A study of first year University of Malaya students (No.
2008-8). FEA Working Paper.
16
Oosterbeek, H., Groot, W., & Hartog, J. (1992). An empirical analysis of university choice and
earnings. De Economist, 140(3), 293-309.
Palmer, M., Hayek, J., Hossler, D., Jacob, S. A., Cummings, H., & Kinzie, J. (2004). Fifty years
of college choice: Social, political and institutional influences on the decision-making process.
Paulsen, M. B. (1990). College Choice: Understanding Student Enrollment Behavior. ASHE-
ERIC Higher Education Report No. 6. ASHE-ERIC Higher Education Reports, The George
Washington University, One Dupont Circle, Suite 630, Dept. RC, Washington, DC 20036-1183.
Price, I.F., Matzdorf, F., Smith, I. & Aghai, H. 2003. ‘The impact of facilities on student choice of
university’, Facilities, 21(10): 212–230.
Punnarach, S. (2004). The image of private universities from high school students and
occupational students’ viewpoint. Unpublished DSc thesis. Bangkok: Kasem Bundit University.
Sevier, R. A. (1993). Recruiting African-American Undergraduates. A National Survey of the
Factors That Affect Institutional Choice. College and University, 68(1), 48-52.
Sheth, J. N., Mittal, B., & Newman, B. I. (1999). Consumer behavior and beyond. NY: Harcourt
Brace.
Shin, J. C., & Milton, S. (2004). The Effects of Performance Budgeting and Funding Programs on
Graduation Rate in Public Four-Year Colleges and Universities. education policy analysis
archives, 12(22), n22.
Sidin, S. M., Hussin, S. R., & Soon, T. H. (2003). An exploratory study of factors influencing the
college choice decision of undergraduate students in Malaysia. Asia Pacific Management Review,
8(3), 259-280.
Table 1: Summary of Literature
Serial
Number Variables Identified (literature Review) Reference
17
1
Learning environment, political environment,
concern for students, cost of education, facilities,
location parental preference and influence of peers,
Baharun, et al., 2011
2
Field of study, course preferences ,institutional
reputations, course entry scores, easy access to home
and institutional characteristics
James et al.1999
3 Type of school attended Hoxby and Long, 1999
4 Familial groups such as parents,relatives and
teachers
Oosterbeek, et al.,1992;
Hossler, et al., 1999
5
Academic reputation, course availability, location,
tuition costs as well as campus amenities ,study
mode, tuition fees and the university itself
Hagel and Shaw 2007
6 Reputation of the institution Kusumwati et al. 2010
7
Degree program flexibility, academic reputation ,
prestige reflecting national and international
recognition, physical aspects of the campus such as
the quality of the infrastructure and services, career
opportunities upon completion, location of the
institution and the time required for the completion
of the program.
Joseph and Ford 1999
8 Income or the socioeconomic status of students Heller 1997
9 Academic achievement of students or standardized
examination results Braxton, 1990
10 Excellence in teaching
Keskinen et al., 2008; Sidin,
et al.,2003; Soutar& Turner,
2002
11 Demand for private universities tends to be higher
level of price sensitivity than public ones Bezmen & Depken, 1998
12 Importance of price depends on the income and
quality of the student Long’s 2004
13 Gender differences Paulsen, 1990; McDonough,
1997
14
Women view safety as an important determinant
factor of choice while men place more importance on
scheduling and sporting activities. Females prefer
information regarding institutions from close social
connections more than males
Baharun et al., 2011
15 Females also prefer information provided by the
institutions above males. Joseph and Joseph 2000
16 Attending a private university Ciriaci, 2014
18
17
Lack of access to higher education in certain regions,
a commonality of languages as well as availability of
technology based programs
Mazzarol and Soutar 2002 &
2008
18
Types of academic programmes available, quality of
education, administration standards, faculty
qualifications and convenient accessible location
Baharun 2002
19 Institution’s good image Mazzarol, 1998; Gutman and
Miaoulis, 2003.
20
Good job prospects, the reputation of the university,
the availability of programmes desired by students
and the reputation of the programmes
Nagaraj, 2008; Jacqueline
Fernendez 2010
21
Availability of required programme, academic
reputation of university/college, quality of the
faculty/lecturers and financial assistance offered by
university/college
Mohar, Siti Nur Bayad,
Musyer and Ravindran 2008
22
Field of study preferences, course and institutional
reputations, course entry scores, easy access to home
and institutional characteristics
James et al. 2000
23
Quality and responsiveness of staff, research
activities, social opportunities, economic
considerations and the size of the institution
Baksh and Hoyt 2001;
Bradshaw, et al 2001
24 Campus safety and flexibility in course offering Espinoza et al 2002
25 Academic rating Arpan, et al 2003
26 Famousness of the university, public relations and
stability Punnarach 2004
27
Reputation and prestige, career preparation, specific
academic programmes, distance from home, quality
of research programmes and library resources
Martin, 1994
28 Auxiliary services, reputation of the institution and
admission De Jager & Du Plooy, 2006
29
Gender roles are changing- males and females differ
in terms of consumer traits, information processing,
decision-making styles and buying patterns
Hoyer and MacInnis
2001:384
30 Gender influences both purchase and consumption
situations
Sheth, Mittal &Newmand,
1999
31 Variety of gender differences Galotti & Mark, 1994;
Desjardins et al, 1999
32
Females rated residential life as a more important
factor in the selection process than their male
counterparts
Litten 1982
19
33 Importance of financial aid, security, academics,
atmosphere and religious culture Mansfield’s research 2006
34 Female students view security as a more important
choice factor than their male counterparts De Jager & Du Plooy, 2006
Table 2 : Focus group and their Reference categories of Predictive variables
Predictive Variable Focus Group Reference Group
Age Group 15 – 20 years 20 – 25 years
25 – 30 years
Gender Male Female
Current Level of
Course Under Graduate
Post-Graduation
Others
Current Domain of
Study Engineering
Commerce
Management
Pure Science
Others
Admissions Quota Management Quota General Merit
Other Quotas
Family income Less than 5 hundred
thousand
5 – 10 hundred thousand
10 –20 hundred thousand
Above 20 hundred thousand
Previous Educational
Organization Private University
State / Central university
Deemed university
Autonomous
State / Central Education Board
Table 3. Case processing summary
Unweighted Cases* N Percent
Selected Cases
Included in Analysis
352 100
Missing Cases 0 0
Total 352 100
Unselected Cases 0 0
Total 352 100
* If weight is in effect, see classification table for the total number of cases.

20
Table 4. Categorical variable codings
Frequency Parameter coding
-1 -2 -3 -4
Previous Educational Organisation
Private university 75 1 0 0 0
State /Centel university 92 0 1 0 0
Deemed university 6 0 0 1 0
Autonomous 16 0 0 0 1
State / Centa I Education Board 163 0 0 0 0
Current Domain of Study
Engineering 207 1 0 0 0
Commerce 31 0 1 0 0
Management 67 0 0 1 0
Pure Science 30 0 0 0 1
Others 17 0 0 0 0
Family Income
Less than 5 hundred thousand 112 1 0 0
5-10 hundred thousand 115 0 i 0
10-20 hundred thousand 88 0 0 1
More than 20 hundred thousand 37 0 0 0
Addmission Quota
Management Quota 179 I 0
General Merit 162 0 1
Other Quota 11 0 0
Current Leavel of Course
UG 290 1 0
PG 53 0 1
Others 9 0 0
Age Group
15-20 years 181 1 0
20-25 years 156 0 1
25-30 years 15 0 0
Gender Male 263 1
Female 89 0
Table 5. Classification table
Observed
Predicted
Choice of private university
Non-private university
Private university
Percentage correct
Step 0 Choice of
private university
Non-private
university 0 166 0
Private university
0 186 100
Overall percentage 52.8
21
Table 6. Variables in the equation
Beta Standard
Error Wald
Degree of
freedom Significance Exp(B)
Step 0 Constant 0.114 0.107 1.135 1 0.287 1.12
Table 7: Omnibus Tests of Model Coefficients
Chi-square df Sig.
Step 1
Step 59.34 18 0
Block 59.34 18 0
Model 59.34 18 0
Table 8: Model Summary
Step -2 Log likelihood Cox & Snell R
Square Nagelkerke R Square
1 427.499a 0.155 0.207
Table 9: Hosmer and Lemeshow Test
Step Chi-square df Sig.
1 2.312 8 0.97
Table 10: Contingency Table for Hosmer and Lemeshow Test
Choice of Private university = Non
Private University
Choice of Private university = Private
University Total
Observed Expected Observed Expected
Step 1
1 28 28.203 7 6.797 35
2 22 23.678 13 11.322 35
3 21 20.98 13 13.02 34
4 21 18.223 11 13.777 32
5 18 17.94 17 17.06 35
6 12 14.398 19 16.602 31
7 15 14.277 19 19.723 34
8 13 12 22 23 35
9 9 8.971 26 26.029 35
10 7 7.329 39 38.671 46
Table 11 Classification table

22
Observed
Predicted
Choice of Private university
Percentage Correct
Non Private
University
Private University
Choice of Private Step 1
university
Non Private University
103 63 62
Private University 56 130 69.9
Overall Percentage 66.2
a. The cut value is .500
Table 12. Variables in the equation
B S.E. Wald df Sig. Exp(B)
95% C .1.foi EXP(B)
Lower Upper
Step 1
Age Group 9.844 2 0.007
Age Group (1) 1.222 0.605 4.083 1 0.043 3.395 1.037 11.113
Age Group (2) 0.431 0.605 0.507 1 0.478 1.539 0.47 5.038
Gender (1) 0.534 0.291 3.366 1 0.087 1.705 0.964 3.016
Current Level of Course 5.713 2 0.057
Current Level of Course (1) -
0.438 0.862 0.258 1 0.611 0.645 0.119 3.494
Current Level of Course (2) 0.671 0.926 0.526 1 0.468 1.957 0.319 12.01
Current Domain of Study 13.932 4 0.008
Current Domain of Study (1) -
1.268 0.698 3.299 1 0.069 0.281 0.072 1.105
Current Domain of Study (2) -1.37 0.792 2.992 1 0.084 0.254 0.054 1.2
Current Domain of Study (3) -
1.409 0.764 3.403 1 0.085 0.244 0.055 1.092
Current Domain of Study (4) -2.82 0.825 11.682 1 0.001 0.06 0.012 0.3
Admissions Quoia 0.666 2 0.717
Admissions Quoia (1) 0.341 0.715 0.228 1 0.633 0.711 0.175 2.885
Admissions Quoia (2) 0.486 0.719 0.456 1 0.499 0.615 0.15 2.52
Family income 9.504 3 0.023
Family income (1) -
1.442 0.469 9.462 1 0.002 0.236 0.094 0.593
Family income (2) -
1.205 0.466 6.693 1 0.01 0.3 0.12 0.747
Family income (3) -
1.183 0.478 6.114 1 0.013 0.306 0.12 0.782
Previous Educational Organisation 17.731 4 0.001

23
Previous Educational Organisation (1) 1.328 0.334 15.83 1 0 3.773 1.962 7.258
Previous Educational Organisation (2) 0.165 0.3 0.304 1 0.581 1.180 0.655 2.123
Previous Educational Organisation (3) -
0.667 0.986 0.457 1 0.499 0.513 0.074 3.545
Previous Educational Organisation (4) 0.69 0.631 1.195 1 0.274 1.993 0.579 6.862
Constant 1.761 1.511 1.357 1 0.244 5.818
a. Variables(s) entered on step 1: Age Group, Gender, Current Level of Course, Current Domain Study, Admission Quota, Family income, Previous Educationl Organisation.
Table 13: Significance and Hypotheses support
Null hypotheses P Values Level of
significance
Hypotheses
support
H1
Age has no significant effect on
predicting the selection of private
university for higher education in
Karnataka by migrant students.
0.007 5% Yes
H2
Gender has no significant effect on
predicting the selection of private
university for higher education in
Karnataka by migrant students.
0.067 10% Yes
H3
Current level of course has no significant
effect on predicting the selection of
private university for higher education in
Karnataka by migrant students.
0.057 10% Yes
H4
Current domain of study has no
significant effect on predicting the
selection of private university for higher
education in Karnataka by migrant
students.
0.008 5% Yes
H5
Admission Quota has no significant effect
on predicting the selection of private
university for higher education in
Karnataka by migrant students.
0.717 10% NO
H6
Annual income of family has no
significant effect on predicting the
selection of private university for higher
education in Karnataka by migrant
students.
0.023 5% Yes
H7
Previous educational organization has no
significant effect on predicting the
selection of private university for higher
education in Karnataka by migrant
students.
0.001 5% Yes
24
Table 14: Odds Ratio of predictor variables
Reference Group Label Reference Group Variables Exp(B)
AgeGroup
AgeGroup(1) 20 - 25 years 3.395
AgeGroup(2) 25 - 30 years 1.539
Gender(1) Female 1.705
CurrentLevelofCourse
CurrentLevelofCourse(1) Post Graduation 0.645
CurrentLevelofCourse(2) Others 1.957
CurrentDomainofStudy
CurrentDomainofStudy(1) Commerce 0.281
CurrentDomainofStudy(2) Management 0.254
CurrentDomainofStudy(3) Pure Science 0.244
CurrentDomainofStudy(4) Others 0.06
AdmissionsQuota
AdmissionsQuota(1) General Merit 0.711
AdmissionsQuota(2) Other Quota 0.615
Familyincome
Familyincome(1) 5-10 Lacs 0.236
Familyincome(2) 10-20 Lacs 0.3
Familyincome(3) More than 20 Lacs 0.306
PreviousEducationalOrganisation
PreviousEducationalOrganisation(1) State / Central university 3.773
PreviousEducationalOrganisation(2) Deemed University 1.18
PreviousEducationalOrganisation(3) Autonomous 0.513
PreviousEducationalOrganisation(4) State / Central Education Board 1.993
Constant 5.818


