

University of Arkansas, FayettevilleScholarWorks@UARK
Technical Reports Arkansas Water Resources Center
6-1-1986
Long-term Effects of Tillage on the Retention andTransport of Soil WaterH. D. ScottUniversity of Arkansas, Fayetteville
L. S. WoodUniversity of Arkansas, Fayetteville
W. M. MileyUniversity of Arkansas, Fayetteville
Follow this and additional works at: http://scholarworks.uark.edu/awrctr
Part of the Fresh Water Studies Commons, Hydrology Commons, Soil Science Commons, andthe Water Resource Management Commons
This Technical Report is brought to you for free and open access by the Arkansas Water Resources Center at ScholarWorks@UARK. It has beenaccepted for inclusion in Technical Reports by an authorized administrator of ScholarWorks@UARK. For more information, please [email protected], [email protected].
Recommended CitationScott, H. D.; Wood, L. S.; and Miley, W. M.. 1986. Long-term Effects of Tillage on the Retention and Transport of Soil Water. ArkansasWater Resources Center, Fayetteville, AR. PUB125. 45
0 0 D 0 D D D D 0 0 0 D 0 8 D 0 0 0 0
LONG-TERM EFFECTS OF TILLAGE ON THE RETENTION AND TRANSPORT OF SOIL WATER
H. D. Scott L. S. Wood W. M. Miley
Department of Agronomy University of Arkansas Fayetteville, AR 72701
Research Project Technical Completion Report
Project G-1004-05
The research on which this report is based was financed in part by the United States Department of the Interior as authorized by the Water Research and Development Act of 1978, (P. L. 95-467).
Arkansas Water Resources Research Center University of Arkansas
223 Ozark Hall Fayetteville, AR 72701
Publication No. 125
June, 1986
Contents of this publication do not necessarily reflect the views and policies of the U. S. Department of the Interior, nor does mention of trade names or co11111ercial products constitute their endorsement or recommendation for use by the U. S. Government.
The University of Arkansas, in compliance with federal and state laws and regulations governing affirmative action and nondiscrimination, does not discriminate in the recruitment, admission and employment of students, faculty and staff in the operation of any of its educational programs and activities as defined by law. Accordingly, nothing in this publication should be viewed as directly or indirectly expressing any limitation, specification or discrimination as to race, religion, color or national origin; or to handicap, age, sex, or status as a disabled Vietnam-era veteran, except as p~ovided by law. Inquiries concerning this policy may be directed to the Affirmative Action Officer.

D D {]
0 0 a 0 D ~
0 0 0 Q
D 0 D Q 0
ABSTRACT
LONG-TERM EFFECTS OF TILLAGE ON THE RETENTION ANO TRANSPORT OF SOIL WATER
Quantitative measurements were made of the physical and chemical properties of two virgin prairie soils, Crowley and Jay, that remain in their native Arkansas environments and of similar soils that had been tilled extensively. Comparisons were made of soil properties at several depths. When compared with the tilled soils the virgin soils had higher organic matter contents, saturated hydraulic conductivities and water retained at several applied pressures. Bulk densities and hydraulic resistances were lower in the virgin soils. For the Crowley silt loam, values of pH and elemental contents of the virgin soil were higher than those of the tilled soil.
Determinations also were made of the effects of a 14-year addition of winter cover crops on a Dubbs-Dundee soil in continuous cotton production. In general, the winter cover crops tended to increase hydraulic conductivity~. ·porosity and organic matter content. These results indicated that the detrimental effects of long-term tillage on soil hydraulic properties could partially be overcome with the planting of these crops during the winter. However, the rate of improvement in the hydraulic properties was not dramatic.
H. D. Scott, L. S. Wood and W. M. Miley
Completion Report to the U. S. Department of the Interior, Reston, VA, June 1986
Keywords -- Green Manure/Soil Conservation/Irrigation Requirements/ Soil Water Transport/Water Quality
i

0 0 0 (
0 ~
0 a 0 r
...
TABLE OF CONTENTS
Abstract . . . • . . . . . . . . . . . . i
. . . . . . . . . . . . . . . . • iii List of Figures
List of Tables • . • • • iv
Acknowledgements
Introduction • • •
A. Purpose and Objectives
B. Related Research or Activities
Methods and Procedures . . . • • • • •
A. Sampling of the Crowley Site
B. Sampling of the Jay Site •..
C. Sampling of the Dubbs-Dundee Site
. . . . . . . . .
. . . . . .
D. Detennination of the Soil Physical and Chemical Properties • • • • • • ••••
E. Statistical Analyses • • •
Principal Findings and Significance
A. Crowley Results
8. Jay Results . . c. Dubbs-Dundee Results
Conclusions . . . Literature Cited •
Appendices •••
. .
. .
. . .
.
.
.
. . . . . . . .
. . . . . . . . .
. . . . . . . .
v
1
2
2
5
5
6
7
8
9
9
9
22
27
32
36
38

n ll 0 0
0 0 a
1 ,
0 0
LIST OF FIGURES
Figure 1. Relationship between bulk density and organic matter content of the virgin and cultivated Crowley silt loam .••••.•••.•••.
Figure 2. Water retention curves of the virgin and cultivated Crowley silt loam between the surface
Page
14
and 15 cm depth in the profile. . . • • • • . . 16
Figure 3. Water retention curves of the virgin and cultivated Crowley silt loam between the 15 cm and 30 cm depths. • • • • • • • • . • • • • . . 17
Figure 4. Relationships between plant available water and organic matter content for the Crowley soil 20
i i i

.J
LIST OF TABLES
Table 1. Organic matter contents, hydraulic conductivities and bulk densities of the virgin and cultivated
Page
Crowley soils • . . • . • . . • • • . . . • 10
Table 2. Water retained by the virgin and cultivated Crowley soils • • • • • • . • • • • • • • .
Table 3. A surrmary of the parameters of the fit of the model to the soil water retention curves of the
Table 4.
Crowley soi 1 • • • • • • • • • • • • • • • • • •
Selected chemical contents of the virgin and tilled Crowley soils ••••••••.....
Table 5. Organic matter contents, saturated hydraulic conductivities and bulk densities of the virgin Jay soil and the similar but extensively cultivated
11
19
21
soil, Captina. • • • • . • • • • • . . . • . . . 23
Table 6. Water retained at three depths by the virgin Jay soil and the similar but extensively cultivated soil, Captina •.•.•...•..•••••..
Table 7. A surrmary of the parameters of the fit of the mathematical model to the soil water retention curves of the virgin Jay and the extensively cultivated
24
Captina soils . . • • • • • . • • • . . . . . . . 26
Table 8. Selected chemical contents at three depths of the virgin Jay soil • • • • • • • . • • • . . . . • • 26
Table 9. Organic matter, saturated hydraulic conductivities and bulk densities of the Dubbs-Dundee soil in the three treatments ..•••.••••..•...
Table 10. Water retention of the Dubbs-Dundee soil at the
28
three depths and treatments . • • • . • • • . . 29
Table 11. Summary of the fit of the mathematical model to the water retention of the Dubbs-Dundee soil. . • • • . . 33
Table 12. Summary of the chemical analyses of the Dubbs-Dundee soil at three depths and treatments . . • • . • • . . 34
iv

n
D Q 0
0
a a
ACKNOWLEDGEMENTS
Appreciation is expressed to Jim McKown for the determination
of many of the soil properties, and to Glenn Wilson, Adam Suliman,
Julian De Angulo, Hank Chaney and Wallace Williams for assistance
in sampling of the soils.
Appreciation is also extended to the Arkansas Natural Heritage
Comnission, and in particular to Mr. Tom Foti, for permissi~n to
sample the Konecny prairie and to Mr. Truee Rice for permission to
sample the Rice prairie.
The support of the U. S. Department of· the Interior, Geological
Survey, who provided the funds for this study, is gratefully acknowl
edged.
v

1 ]
INTRODUCTION
Traditionally, agriculture has been the base of the economy of
Arkansas. During the turn of this century, the dominant philosophy
of many fanners was to grow as much cotton as possible and sell it
for whatever price it would bring (Duvall, 1973). At the same time,
in flat and swampy areas in eastern Arkansas where cotton, corn and
other grains were not well suited, rice production was introduced.
Extensive production of soybeans came in later years (Von Steen and
Brantner, 1981).
Production of these agronomic crops was possible with extensive
tillage of the soil. Tillage was necessary for seedbed preparation,
weed control and for increased aeration. Over the years, many tillage
operations using either moldboard plows, disks or chisels, or a com
bination of disk-chisels or disk-cultivators hav.e been used within a
growing season. As a result of the varied equipment required and the
numerous trips over the field, tillage of agronomic crops such as cot
ton, rice and soybeans is one of the major production costs and re
quires extensive amounts of equipment, fuel, time and maintenance.
Several reasons are usually expressed by fanners as to why tillage
of the soil is necessary. These reasons center around providing a
soil environment that optimizes crop growth and development. Examples
include: controlling weeds; the need to cover surface residues for
decomposition; the aesthetic value provided by emerging seedlings in
a totally clean soil surface environment; improved aeration of the soil
possibly necessary due to compaction created by heavy equipment as a
I

result of many passes over wet soil; pest control through the cover
ing of crop residues in short crop rotations or sequences; leveling
or shaping of the field by plowing and disking needed after cultiva
tion or harvesting operations during periods of heavy rainfall creat
ing unfavorable conditions; incorporation of fertilizers and other
soil amendments; increase in soil temperature; stimulation of root
growth; and tradition developed from years of successful production by
using implements and practices accepted and unchallenged by either the
scientific or the farm community. All of these reasons for tillage
have validity when one considers alternatives or options available to
the fanner at that time. The crop production demands were met using
these proven methods until the need for food and fiber associated with
World War II, which placed great stress on world soil resources (Phil
lips, 1984). Industrialization, population explosions and economic
changes continued to increase demands on land resources with predictable
further expansions and demands for more food and fiber.
A. Purpose and Objectives
The purpose and objectives of this study were as follows: (i) to
determine the relationships between duration of tillage and the reten
tion and transport of water in three soils in Arkansas, and (ii) to
evaluate the effects of potential management practices on the ability
of one of these soils to retain and transmit water.
B. Related Research or Activities
There is general agreement that on a short-term basis, tillage is
beneficial in crop production to some degree (Baver et al., 1973).
2
0 0 f] D 0 0 0 [
0 0 0 D 0 u 0
0 0 0

]
]
.J
Moderate amounts of tillage mainta·ln tht:! uµµer layers of the sofl in
an aggregated state, which facilitates adequate aeration and infiltra
tion of water for the crop development. Modern tillage practices,
however, have imposed a considerable traffic load on these aggregated
beds. In response to the vehicular loads, the soil aggregates have
been either crushed and/or reoriented, which causes the aggregated bed
to become compacted and less favorable to crop growth. The reported
detrimental effects of tillage-caused compaction on crop establishment
and yields often cannot be alleviated by natural forces or further til
lage operations. Extensive tillage over long periods of time tends to
reduce soil productivity by the development of compacted layers and re
ductions in the soil organic matter content (Bouma and Hole, 1971).
These factors in turn reduce the transmission and retention of water
in the soil near the surface. Many biological systems have the capac
ity to regenerate after substantial change has taken place. Most soil
systems differ, however, in that they develop their characteristics
over thousands of years (Foss and Moran, 1984). Since tillage primarily
effects the surface 15 cm of soil, loss of productive surface soils may
expose unfavorable subsurface soil materials. This loss is, therefore,
a somewhat permanent change from the standpoint of our civilization . . There have been several recent studies conducted that compare virgin
soils with similar soils that have been cultivated. Bauer and Black
(1981) in North Dakota indicated that as virgin grasslands were put
under cultivation, organic carbon and total N concentrations declined
rapidly during the initial ten years of cultivation. Decline continued
3

until an equilibrium level was reached after approximately 40 years
in cultivation. Their results showed that the equilibrium concentra
tions can be affected by tillage practice. Tillage practices emphasiz
ing stubble mulching over conventional tillage management had higher
carbon and nitrogen concentrations. Bulk density of the surface to
the 30 cm depth ranged from 7 to 20 percent higher in the cropland than
in the virgin grasslands. Scott et al. (1983) in Arkansas showed that
virgin Dubbs and Sharkey soils contained higher organic matter contents
and volumes of water retained at all pressures, had lower bulk densities
and were darker in color than similar soils that had been extensively
cultivated. Skidmore et al. (1975) in Kansas compared the physical
properties of a Keith silt loam when in a buffalograss pasture and an
adjacent field which had been in cultivation for 60 years. They found
a greater stability of the aggregates and much lower bulk densities in
the pasture as compared with the cultivated field. The infiltration
rates of water were seven times higher in the pasture than in the cul
tivated field. Hadas (1987) found the tensile strength of aggregated
samples in a cultivated field was greater than that of samples taken
from a virgin soil site of the same soil. Internal strength of the
basic soil aggregation units was quadrupled under cultivation as com
pared to that determined from virgin samples. These finding suggest
that cultivation and traffic-caused compaction affect to a greater
extent the basic $maller structural units of the soil and less so for
the larger aggregation units.
4
0 0 n D 0 0 0 Q 0 0 0 D 0 Q D
0 u 0 0

1
J
METHODS AND PROCEDURES
The in situ physical properties of soils from three locations in
Arkansas were determined. Two of the sampling sites were located on
virgin prairies which had been managed with haying operations over the
years. Characterization of the third site compared the physical status
of a soil in continuous cotton with that of continuous cotton with win
ter cover crops.
A. Sampling of the Crowley Site
The Crowley soil was sampled on May 14, 1985 and on April 24, 1986
at the Sam Konecny farm near Slovak. There were two sampling sites at
this location: an area in virgin prairie and another area in production
of rice or soybeans or wheat. The virgin area is preserved and managed
by the Arkansas Natural Heritage Commission. According to the Lonoke
and Prairie County Soil Survey (USDA, 1981), four soil series are found
within the virgin prairie and nearby areas. These soils, which are Crow
ley, Calloway, Loring and Stuttgart, are somewhat similar in that they
have silt loam textures near the soil surface and are classified as
Alfisols. They differ primarily in their drainage characteristics and
texture of the B horizon. Crowley and Stuttgart soils, which are poorly
drained and moderately well drained, respectively, were formed in loamy
windblown material underlain by clayey alluvium. The Calloway and Lor
ing soils are somewhat poorly drained and moderately well drained soils
formed in loamy windblown and alluvial sediments. All of these soils
are wet and have slow water permeability. In general, they are well
suited to production of cultivated crops such as soybeans, wheat and rice.
The sampling procedures in the virgin prairie initially involved
the careful removal of the above-ground cover from the soil surface
5

from an area having dimensions of approximately U.o m by 0.6 m. Un
disturbed cores of soil were taken at 5 cm increments to the 30 cm
soil depth. At each depth, there were four replicates of samples
taken, resulting in 24 cores in the virgin prairie. Disturbed soil
samples for chemical analyses were also taken at each depth interval
at this site. Undisturbed cores were also taken from the cultivated
site which was located approximately 150 m away. Since the cultivated
site had recently been plowed, only the three depths below 15 cm were
sampled at this time. The two 5-cm depth increments near the soil
surface were sampled on April 24, 1986, when the field was under wheat
production. At this same time, from both the virgin and tilled sites,
10 cm length undisturbed core samples were obtained for the determi
nation of hydraulic conductivities by the falling-head method.
B. Sampling of the Jay Site
The second site of virgin prairie was located immediately west of
the Siloam Springs airport on Arkansas Highway 59. The area is owned
by Mr. Truee Rice, who reported that the land has not been cultivated
since 1902, when his dad purchased the property. Recently, the land
has been used for hay and has not been burned. The soil at the sampling
site is a Jay silt loam and contains a considerable number of mounds.
Extensive evidences of burrows exists around the soil mounds.
The Jay soils are moderately well drained, nearly level soils on
broad uplands of the Springfield plateau (USDA, 1977). These soils
formed in loamy material overlying cherty limestone. The native vege
tation was tall prairie grasses. Jay soils have moderate fertility,
6
[
0 r
0 0 0 0 0 0 0 0 0 0 Q
0 u l 0 0

~
t
J J
J l J
J
]
J
J J J
slow permeability and medium water capacity. They are easy to till
and can be cultivated over a wide range of soil moisture contents.
Undisturbed samples of soil were taken of the 0 to 5, 5 to 10,
and 10 to 15-cm depth intervals. There were at least five core samp
les per depth. No samples were taken of an adjacent cultivated site
since Mr. Rice does not own that property.
C. Sampling of the Dubbs-Dundee Site
The third site sampled was located on the Delta Branch Experiment
Station near Clarkedale. The site had been in continuous cotton since
1973 and had, for the most part, been in cotton research for 30 years.
Samples of soil were taken on November 11, 1985 within a research ex
periment in which the objective was to determine the influence of cover
crops grown during the winter and early spring on continuous production
of cotton. The samples were taken in the row of treatments having (i)
continuous cotton with no cover crops and with 3 lb/A/yr of cotoran
(a herbicide), (ii) continuous cotton with cover crops and with 3 lb/A/yr
of cotoran, and (iii) continuous cotton with cover crops and with no
cotoran applied. This sampling scheme allowed for comparisons of soil
properties with and without cover crops during the winter, as well as,
with and without the annual application of the herbicide cotoran.
The soil at the site was in a Dubbs-Dundee association. Dubbs
soils are well drained and have moderate permeability, whereas, Dundee
soils are somewhat poorly drained and have moderately slow permeability.
Both soils have silt loam Ap horizons and were formed in stratified
beds of loamy sediments. They are well suited to cotton production,
7

are moderate to high in natural fertility and moderate to low 1n or
ganic matter contents. Usually, the Dundee soils occur in the lower
landscape positions and the Dubbs soils occur in the higher lying
areas. About 96 percent of the Dubbs-Dundee association is in culti
vation (USDA, 1974).
Undisturbed cores of soil were taken from the 0 to 5, 5 to 10,
and 10 to 15-cm depth intervals. In addition, undisturbed cores hav
ing 10-cm core lengths were taken from the soil surface for the deter
mination of hydraulic conductivities by the falling-head method .
D. Determination 6f the Soil Physical and Chemical Properties
The undisturbed soil core samples were brought to the laboratory
for analyses of selected soil physical and chemical properties. The
length and diameter of these cylindrical cores were 5 and 6 cm, re
spectively. Soil physical properties determined included saturated
hydraulic conductivity by the constant-head method, soil water reten
tion at pressures of 10, 20, 30, 50, 80, 100 and 1500 kPa, bulk density
and organic matter content. These determinations were made according
to the standard procedures published in Black et al. (1965). The or
ganic matter contents were determined by a variation of the Walkley
Black method with ferrous arrmonium sulfate substituted for ferrous sul
fate. The organic matter content was determined by titration. Soil
chemical properties determined included pH, and elemental contents of
N, K, P, Ca, Mg and Na. The elemental contents were determined by the
Soil Testi ng Laboratory at the University of Arkansas, Fayetteville.
In some cases, the saturated hydraulic conductivity was determined
8
[
[
r
l~
0 0 0 a 0 il 0 0 0 0 0 0 Li
0 0

by the fal11ng-head technique (Black et aL, 1965). Tht:! hmyLh crn<l
diameter of these cylindrical undisturbed cores were 10 and 8.4 cm,
respectively. These falling-head cores of soil were, therefore, twice
as long as the other cores.
E. Statistical Analyses
The experimental data were subjected to several statistical anal
yses. For example, the water retention results were modeled with sev
eral mathematical equations that contained curve fit parameters. These
parameters were used not only to describe the data but to detennine the
influence of cultivation and/or management on soil water retention. In
addition, linear regressions were made between organic matter content
and the dependent variables bulk density and plant extractable water.
PRINCIPAL FINDINGS AND SIGNIFICANCE
A. Crowley Results
Quantitative comparisons of the physical properties of the virgin
and tilled Crowley soils are presented in Tables 1 and 2. These results
show that tillage associated with the production of rice, soybeans and
wheat during the last 37 years has detrimentally affected several phys
ical properties of the Crowley soil and that these effects were great
est in the 0 to 5-cm depth increment. For example, in the 0 to 5-cm
depth increment, the organic matter content and hydraulic conductivity
of the virgin soil was approximately 2.6 and 128 times greater than that
in the tilled soi _l, respectively. Bulk density, which is an indicator
of compaction, was lower in the virgin soil at all depths. When consid
ering the 0 to 30 cm as the soil profile, the virgin soil contained 1.7
9

0
Table 1. Organic matter contents9 hydraulic conductivities and bulk 0 densities of the virgin and cultivated Crowley soils.
0 0
Ti 1 lage Depth Organic Hydraulic Bulk
0 Condition Interval Matter Conductivity 1 Density
cm % cm hr-l g cm-3 0 Virgin 0 - 5 4.5 7.67 1.08 0 5 - 10 2.6 7.46 1.21
10 - 15 2.6 1.37 1.21 0 15 - 20 1.6 3.55 1.25
20 - 25 1.5 1.44 1.25 0 25 - 30 1.1 4.74 1.29 D
Cultivated 0 - 52 1.7 0.06 1.31 0 5 - 102 1.7 0.06 1.35
10 - 15 1.6 0.84 1.58 0 15 - 20 1.4 0.10 1.59
0 20 - 25 0.9 0.35 1.56
25 - 30 0.6 3.05 1.48 a 1 The natural logarithm of these core values were averaged. 0 2 Sampled in April 1986 when the field was in wheat.
0 0 0
10 0

L,_ , '---.J ....___,,
Table 2. Water retained by the virgin and cultivated Crowley soils .
Tillage Depth Water Retained at Applied Pressure (kPa)
Condition Interval 0 5 10 20 35 50 80 100 1500
cm cm cm-3
Virgin 0 - 5 .594 .526 .500 .479 .465 .387 .376 . 340 .149 5 - 10 .545 .434 .414 .380 .366 .318 .277 .263 .163
10 - 15 .544 .403 .383 .357 .347 .335 .326 .318 .148
- 15 - 20 .529 .380 .358 .326 .299 .269 .261 .249 .158 ..... 20 - 25 .527 .382 .379 .331 .320 .294 .287 .282 .171 25 - 30 .515 .364 . 348 .315 .290 .258 .253 .247 .175
Cultivated 0 - 5 .505 .383 .372 .356 .350 .337 .311 .305 .127 5 - 10 .493 .405 .396 .379 .374 .363 . 348 .342 .136
10 - 15 .404 .366 . 361 .347 .339 .328 .316 .311 .200 15 - 20 .402 .368 .362 .355 .346 .341 . 332 .325 .235 20 - 25 .416 .381 . 373 .361 .353 .345 .339 .330 .257 25 - 30 .448 .368 .360 .342 .322 .306 .275 .256 .197

and 1.4 times more organic m~ttPr on a WP.ight and volumP. ha~i~, rP
spectively, had a saturated hydraulic conductivity which was 49 times
higher, and a bulk density that was 0.8 times as high as compared with
the tilled soil.
The thickness of each depth increment divided by the saturated
hydraulic conductivity is known as the hydraulic resistance. For
these two sites, the average resistance to flow of water in the surface
30 cm was 1.82 +/- 1.38 and 39.76 +/- 37.81 in the virgin and tilled
sites, respectively . Therefore, the tilled soil profile had a resis
tance to flow of water that was 21.8 times greater than in the virgin
soil profile. Variability of the hydraulic resistance also was greater
in the tilled profile. The greatest differences in hydraulic resis
tance between the two sites was found in the 0 - 5 and 5 - 10-cm depth
increments where the average resistance to flow of water was 126 times
higher in the tilled soil.
Saturated hydraulic conductivities (Ksat) also were detennined by
the falling-head method during the second sampling of the sites in April
1986. From these larger cores, Ksat values were 2.69 and 0.27 cm hr-l
for the virgin and tilled soils, respectively. These falling-head Ksat
results indicated that the rate of movement of water through the virgin
Crowley was an order of magnitude faster than through the tilled soil.
Since organic matter acts as a binding agent for aggregation, the higher
organic matter contents of the virgin Crowley soil contributed to the
greater structure of the soil, which resulted in greater transmission
rates and lower compaction.
12
0 0 0 0 B 0 0 0 0 0 0 0 0
0 0 0 0 0

]
J ]
]
The relationships between organic matter contenL, $d.Lurdted hy
draulic conductivity and bulk density were detennined with regression
techniques. Most of these regressions were not significant and are
presented in Appendix Table 1. For the virgin soil, however, a linear
relationship was found between bulk density and organic matter content
with a slope of -0.059 g cm-3 %-l of organic matter (Figure I). The
high coefficient of detennination (r2 = 0.983) indicates that organic
matter was a significant factor in determining the soil compaction and
structure at the virgin site. Structure and compaction of the soil
are important in the determination of the magnitude of the porosity.
For the cultivated soil, no relationship was found between bulk density
and organic matter content, as indicated by the low coefficient of de
termination (0.155). In the cultivated soil, bulk density varied from
1.31 to 1.59 g c~-3 , while the organic matter content varied from 1.7
to 0.6 percent. The higher bulk densities and lower organic matter con
tents in this soil indicate that factors other than organic matter were
involved in determining the magnitude of the bulk density in the culti
vated soil. Therefore, it appears that the loss of organic matter as a
result of cultivation results in other factors besides organic matter
content alone determining the bulk densities. These factors include the
occurrence of traffic loads from tillage.
The retention of water varied with tillage condition and with soil
depth (Table 2). In the 0 to 5 cm depth increment, the virgin soil re
tained greater amounts of water at all applied pressures, despite the
lower bulk density, than in the cultivated soil. This can be attributed
13

[
f r
Figure 1. Relationship between bulk density and organic matter content ~ of the virgi n and cultivated Crowley silt loam. l~
('l)E .g O>
> .... -VJ z w Q
~ ...I :> ~
CROWLEY SILT LOAM 0 VIRGIN
0 CULTIVATED 1.6
0 oc
0
1.4
0 0
Yv: 1.35 - 0.059X r2s0.983
1.2
0 1.0-.. ____________________________________ _. ____ ___
0 1.0 2.0 3.0 4.0
ORGANIC MATTER, %
14
r: [
l
0 0 0 0 (]
0 Q
0 0 0 0 D
J
] ]
J
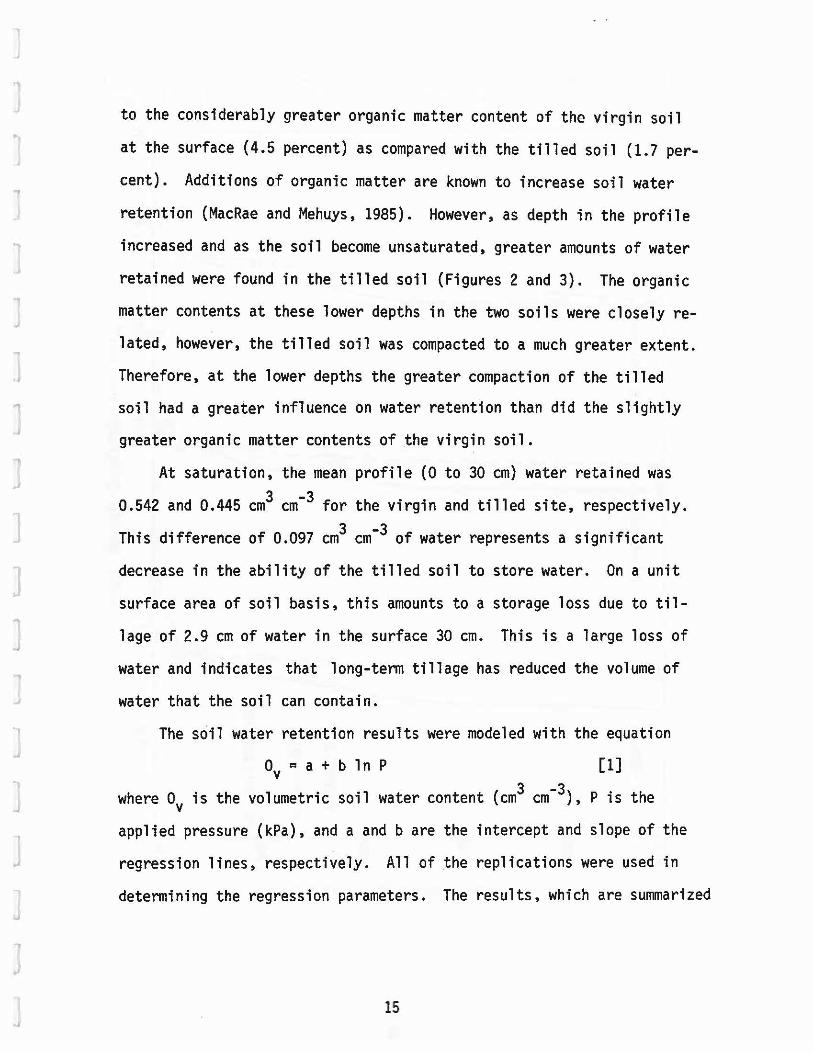
to the considerably greater organic matter content of the virgin soil
at the surface (4.5 percent) as compared with the tilled soil (1.7 per
cent). Additions of organic matter are known to increase soil water
retention (MacRae and Mehuys, 1985). However, as depth in the profile
increased and as the soil become unsaturated, greater amounts of water
retained were found in the tilled soil (Figures 2 and 3). The organic
matter contents at these lower depths in the two soils were closely re
lated, however, the tilled soil was compacted to a much greater extent.
Therefore, at the lower depths the greater compaction of the tilled
soil had a greater influence on water retention than did the slightly
greater organic matter contents of the virgin soil.
At saturation, the mean profile (0 to 30 cm) water retained was
0.542 and 0.445 cm3 cm-3 for the virgin and tilled site, respectively.
This difference of 0.097 cm3 cm-3 of water represents a significant
decrease in the ability of the tilled soil to store water. On a unit
surface area of soil basis, this amounts to a storage loss due to til
lage of 2.9 cm of water in the surface 30 cm. This is a large loss of
water and indicates that long-term tillage has reduced the volume of
water that the soil can contain.
The soil water retention results were modeled with the equation
0 = a + b ln P v [1]
where Ov is the volumetric soil water content (cm3 cm-3), Pis the
applied pressure (kPa), and a and bare the intercept and slope of the
regression lines, respectively. All of ~he replications were used in
determining the regression parameters. The results, which are summarized
15

r Figure 2'. Water retention curves of the virgin and cultivated Crowley [
silt loam between the surface and 15 cm depth in the profile.
-E ()
~ I
U') N
E c.>
~ I
0 N
--
- -o - - -..- _,, - ----a---_.
---0- ._. - ---- -.,_,o- -
-o---o-
-o-- ---c-- -
~ r
"! CW)
o 'e ()
Cl?E c.> .. .. ~
0 z w ~ z 0 (.)
a: w ~ ;= ..J -0 U)
N 0
r J
[
~
0 0 0 0 0 0 0 0 0 0 0 0

J ]
]
Figure 3. Water ~etention curves of the virgin and cultivated Crowley silt loam between the 15 cm and 30 cm depths.
,-.------------------..,.....--------....... --------...... --------..... co
--e CJ
an ,... I
0 ,...
e CJ
0 ,...
-~
---o--E (,)
an I
0
---
- ,__. ,_,.. -c ~ - -o--o---
z a a:: > 0
Q w ti > -!:; ~ (.)
c
~..d
0
(')
'e (,)
M • E 0 CJ
....... z w ... z 0 (.)
a:: w ... ~ -' -• 0
0 CJ)
N 0
.._ ___________________ ..______________________________ 0
8 ,... 0 a)
0 0 0 CO "It N 0
ed>t '3~nss3~d a311dd\f
17

in T~ble 3, show that excellent fits with the model were obtained on
the virgin soil. The fit of the model on the tilled water retention
was not as good. In general, the slopes and intercepts were lower
with the tilled soil water retention curves than with the virgin soil
water retention curves. This indicates that the virgin soil had higher
water contents near saturation and was more responsive to changes in
pressure than the tilled soil.
Plant available water in the surface 30 cm was estimated by sub
tracting from the water retained at 10 kPa (the upper limit) the water
retained at 1500 kPa. The thought was that 10 kPa represents "field
capacity", or the upper drainage limit for this poorly drained soil,
and that 1500 kPa represents the lower limit of plant extractable water.
The relationship between plant available water and organic matter con
tent is shown in Figure 4 and the regression equations are presented
in Appendix Table 1. Two regression lines are shown in Figure 4. The
regression analysis with the virgin soil shows a highly significant
linear relationship. For each one percent organic matter content in
the soil, the plant available water increased by 0.051 cm3 cm-3• All
of the data from the virgin and cultivated sites were combined and used
in the second regression line in Figure 4, which shows that each one
percent organic matter content increased plant available water by
0.056 cm3 cm-3• Linear regression between plant available water and
organic matter content in the tilled soil was nonsignificant.
A comparison by depth of selected chemical properties for the vir
gin and tilled Crowley soils is presented in Table 4. These results
18
0 0 0 0 0 0 0 0 0 D 0 0 0 0 0 0 0 D LI

1-t
'°
Table 3. A su1TUT1ary of the parameters of the fit of the model to the soil water retention curves of the Crowley soil.
Tillage Soil Standard Standard Coefficient d>f
Condition Depth Intercept Error Slope Error Determination
cm cm3 cm-3 kPa-l
Virgin 0 - 5 0.570 0.0128 -0.047 0.0032 0.831 5 - 10 0.487 0.0067 -0.044 0.0017 0.941
10 - 15 0.472 0.0065 -0.040 0.0016 0.931 15 - 20 0.444 0.0020 -0.042 0.0005 0.994 20 - 25 0.451 0.0035 -0.040 0.0009 0.979 25 - 30 0.428 0.0019 -0.040 0.0005 0.994
Tilled 0 - 5 0.467 0.0070 -0.038 0.0018 0.902
5 - 10 0.473 0.0090 -0.034 0.0023 0.820 10 - 15 0.469 0.0080 -0.042 0.0020 0.913 15 - 20 0.402 0.0098 -0.023 0.0024 0.663 20 - 25 0.412 0.0090 -0.023 0.0023 0.706 25 - 30 0.413 0.0063 -0.032 0.0018 0.908

0.4
('I')
·e " 0.3
M e · " ci w ti ~ 0.2 w ...J al ct ...J -~ ct 0.1 1-z ct ...J Q.
Figure 4. Relationships between plant available water and organic matter content for the Crowley soil.
0
CROWLEY
O VIRGIN
0 CULTIVATED
B
Yvt: 0.11+0.056X
r2 = 0.738
1.0 2.0 3.0
ORGANIC MATTER, %
20
Yv = 0.12 + 0.051 X
r 2= 0.993
4.0
0
0 0 0 0 0 0 0 0 0 0 0 0 [
0 0 0 0 D 0

1--J
Table 4. Selected chemical contents of the virgin and tilled Crowley soils.
Tillage Depth Soil Test Values Electrical
Condition Interval pH p K Ca Na Mg Conductivity
cm kg ha-1 umhos cm-l
Virgin 0 - 5 4.6 11 78 448 179 34 84 5 - 10 4.7 7 45 448 157 34 55
10 - 15 4.7 3 45 336 190 34 65
N 15 - 20 4.7 7 34 336 168 34 55 .... 20 - 25 4.8 6 34 336 213 34 50 25 - 30 4.8 3 34 336 202 34 50
Tilled 0 - 5 5.3 45 157 1568 190 347 86 5 - 10 5.3 46 168 1680 202 347 100
10 - 15 5.4 45 157 1792 190 358 85
15 - 20 5.3 34 78 1680 224 336 85 20 - 25 5.8 7 45 1904 258 414 95 25 - 30 5.1 9 45 784 258 190 95

show that the Crowley sof 1 in its natfve or virgin state is relatively
infertile and that long-tenn tillage along with the associated crop
management practices such as fertilization and deposition of Caco3 from irrigation water have increased the pH and elemental contents.
No significant difference was found in the electrical conductivity in
which all values are considered to be in the low range. Therefore,
from a soil chemical view, tillage associated with the production of
rice, soybeans and wheat has tended to increase the chemical fertility
of the Crowley soil.
These results show that long-tenn tillage of the Crowley soil
has lowered its organic matter content, saturated hydraulic conduct
ivity, saturated soil water content and plant available water. Tillage
and the associated crop management activities have increased the com
paction, hydraulic resistance and elemental content . Retention of
water was dependent on the applied pressure, organic matter content
and bulk density.
B. Jay Results
Surrmaries of the physical properties of the Jay soil are present
ed in Tables 5 and 6. Since there was no cultivated Jay soil for com
parison, these data can be compared with the results of Thiesse (1984),
who determined several physical properties of Captina soils. Captina
soils have similar textures in the surface as the Jay and were fanned
in loamy material overlying cherty limestone or siltstone. They have
slow permeabilities primarily because of a fragipan in the lower parts
of the profile. Captina soils are found in the Ozarks on broad uplands
22
0 c 0 0 B 0 D 0 0 0 0 0 0 0 0 0 0 D 0

Table 5. Organic matter contents, saturated hydraulic conductivities and bulk densities of the virgin Jay soil and the similar but extensively cultivated soil, Captina.
Depth Organic Hydraulic Bulk Soil Interval Matter Conductivity Density
cm % cm hr- g cm
Jay 0 - 5 4.2 25 .6 1.08 5 - 10 4.0 8.0 1.05
10 - 15 3.4 1.8 1.26
Captina 0 - 5 2.5 1.4 1.28 10 - 15 0.9 1.2 1.38
and ridges. These soils were some of the first to be cultivated in the Ozark plateau region.
In both soils, the highest organic matter contents and saturated
hydraulic conductivities were found in the 0 to 5-cm depth interval
(Table 5). The Ksat of 25.6 cm hr-l in the virgin soil indicates that
this layer can rapidly transmit water. Values of Ksat declined with
depth in both soils. The resistance to flow of water for the three
depths in the virgin Jay was 3.6 hr; for the two depths in the culti
vated Captina, the resistance was 7 .7 hr. When the same two depths
were compared, the results indicated that the resistance to transport
of water was more than 2.5 times higher in the cultivated soil as
compared with the virgin soil. As a rule, the extensively cultivated
Captina had higher bulk densities and lower Ksats and organic matter
23

Table 6. Water retained at three depths by the virgin Jay soil and the similar but extensively cultivated soil, Captina.
Depth Water Retained at Applied Pressure (kPa} Interval 0 5 10 15 20 30 50 80 100 1500
cm cm N
~ ~
0 - 5 .593 .461 .397 .378 .367 .332 .306 .257 .246 .o·a3
5 - 10 .604 .416 .353 .338 .328 .301 .281 .253 .247 .077 10 - 15 .525 .427 .377 .362 .353 .323 .294 .258 .251 .093
Captina 0 - 5 .537 .450 .406 . 393 .363 .333 .306 - .266
10 - 15 .479 .381 .350 .336 .314 .291 .263 - .225
c:::J CJ c:l CJ c:::::> CJ CJ CJ c::J c=l CJ C> CJ c:J CD c:J CJ CJ CJ

]
contents ~s comp~rad with tho virgin Jay soil. The relationship bet
ween bulk density (BO) and organic matter content (OM) for the results
in Table 5 could be described with the regression equation
BO = 1.494 - 0.0948 OM [2]
where the coefficient of determination was 0.827. This linear equation
shows that compaction of the layers near the soil surface was indirectly
correlated with the organic matter content of these layers. A similar
result was found with the Crowley soil.
The water retention results of the Jay and Captina soils are pre
sented in Table 6. At saturation, the virgin Jay contained about 5 per
cent more water than the cultivated Captina. This was primarily due to
its lower bulk density and higher organic matter contents. As the ap
plied pressure increased, both soils retained less amounts of water.
At 100 kPa and in the 0 to 5-cm depth interval, the virgin Jay contained
about 2 percent more water than the extensively cultivated Captina. In
the 10 to 15-cm depth interval, the Captina soil retained 2.6 percent
more water than the Jay at this same pressure. This difference in water
retained at the two depths can be attributed to the greater compaction
(i.e., higher bulk density) of the Captina soil.
For the Jay and Captina soils the water retention results were also
fit to equation [1] and the results are presented in Table 7 and Appen
dix Table 2. Excellent fits of the regression model to the experimental
data were obtained. As soil depth increased, the slope of the equation
decreased, which indicated that the water retention curves were less
sensitive to changes in pressure. When all of the Jay data were combined,
25

Table 7. A summary of the parameters of the fit of the mathematical model to the soil water retention curves of the virgin Jay and the extensively cultivated Captina soils.
Soil Standard Standard Coefficient of Depth Intercept Error Slope Error Determination
cm cm3 cm-3 kPa-l
~ 0 - 5 .505 .0028 -.0561 .0007 .987 5 - 10 .488 .0016 -.0544 .0004 .996
10 - 15 .468 .0049 -.0455 .0013 .944 Captina
0 - 5 .482 -.0406 .919 10 - 15 .422 -.0377 .943
N
°' Table 8. Selected chemical contents at three depths of the virgin Jay soil.
Depth Soil Test Values Electrical Interval pH p K Ca Na Mg Conductivity
kg ha-1 umhos -cm cm 0 - 5 4.8 42 235 1568 190 302 200 5 - 10 4.7 34 190 1680 190 246 200
10 - 15 4.6 33 90 1344 179 224 200
CJ c:::J CJ CJ co c::::i CJ CJ CJ CJ CJ C:J c::J CJ c::l c:J c:J CJ ,..__
]
J
]
]
]
]
]
]
J J J ]
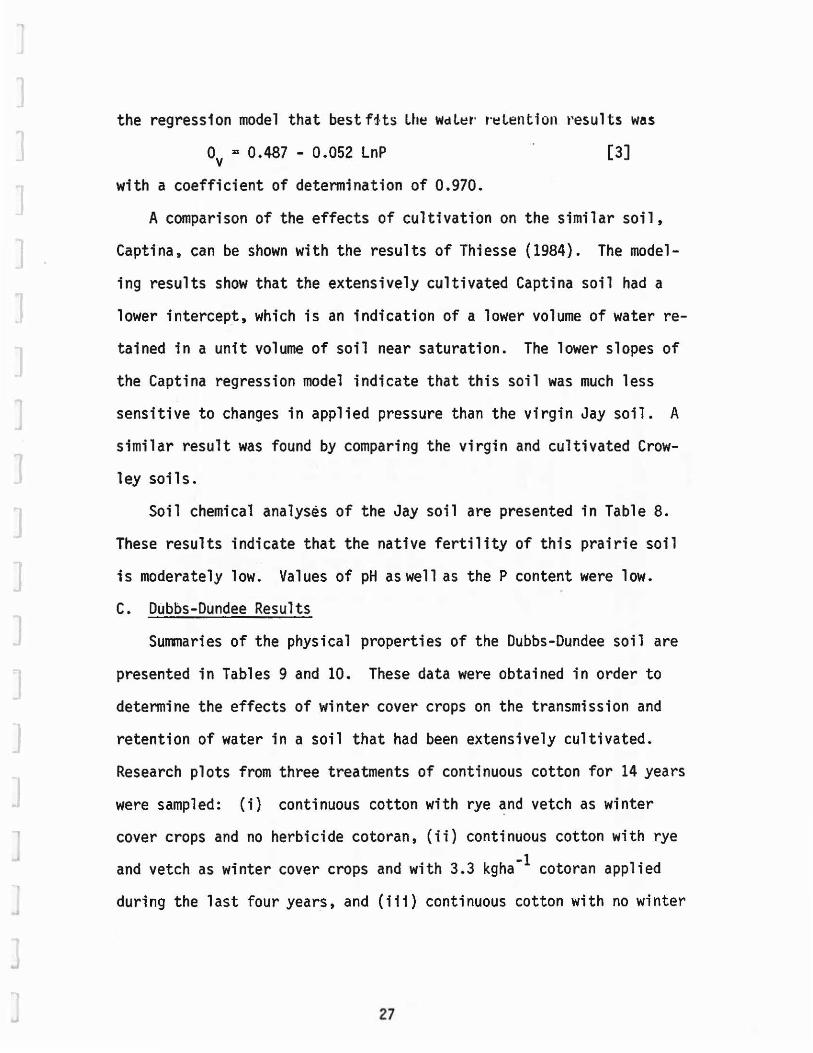
the regression model that best f1·ts Lh~ Wdlt:H' r·t:!Lention results was
Ov = 0.487 - 0.052 LnP [3]
with a coefficient of determination of 0.970.
A comparison of the effects of cultivation on the similar soil,
Captina, can be shown with the results of Thiesse (1984). The model
ing results show that the extensively cultivated Captina soil had a
lower intercept, which is an indication of a lower volume of water re
tained in a unit volume of soil near saturation. The lower slopes of
the Captina regression model indicate that this soil was much less
sensitive to changes in applied pressure than the virgin Jay soil . A
similar result was found by comparing the virgin and cultivated Crow
ley soils.
Soil chemical analyses of the Jay soil are presented in Table 8.
These results indicate that the native fertility of this prairie soil
is moderately low. Values of pH as well as the P content were low.
C. Dubbs-Dundee Results
Surrmaries of the physical properties of the Dubbs-Dundee soil are
presented in Tables 9 and 10. These data were obtained in order to
determine the effects of winter cover crops on the transmi ssion and
retention of water in a soil that had been extensively cultivated.
Research plots from three treatments of continuous cotton for 14 years
were sampled: (i} continuous cotton with rye and vetch as winter
cover crops and no herbicide cotoran, (ii) continuous cotton with rye
and vetch as winter cover crops and with 3.3 kgha-l cotoran applied
during the last four years, and (iii) continuous cotton with no winter
27

N co
Table 9. Organic matter, saturated hydraulic conductivities and bulk densities of the Dubbs-Dundee soil in the three treatments.
Depth Organic Hydraulic Treatment Herbicide Interval Matter Conductivity
kgha-1 cm % cmhr- gcm3
Rye/Vetch 0 0 - 5 1.9 3.46 5 - 10 1.3 4.49
10 - 15 0.9 5.13
Rye/Vetch 3.3 0 - 5 1.8 5.62 5 - 10 1.5 2.90
10 - 15 1.1 2.97
Cultivated 3.3 0 - 5 1.4 2.08 5 - 10 1.1 2.31
10 - 15 1.1 1.43
Bulk Density
1.26 1.29 1.34
1.22 1.33 1.33
1.28 1.39 1.39
CJ c:::J c:::J c::J c:::J c::::i c::::n c:J CJ C'.:j CJ c=l CJ CJ C:J c:J CJ CJ CJ

Table 10. Water retention of the Dubbs-Dundee soil at the three depths and treatments.
Depth Water Retained at the Applied Pressure Tillage Interval 0 5 10 15 20 30 50 80 1500
Rye/Vetch 0 - 5 .525 .433 .396 .363 .347 .333 .307 .285 .053
( 0 herb . ) 5 - 10 .513 .419 .388 .362 .359 .332 .284 .273 .077 10 - 15 .494 .391 .366 .342 .339 .312 .279 .260 .098
Rye/Vetch 0 - 5 .540 .446 .407 .373 .370 .334 .309 .290 .071 (3 herb.) 5 - 10 .498 .392 .358 .331 .322 .302 .286 .279 .067
N 10 - 15 .498 .423 .388 .358 .339 .305 .267 .251 .077 IO
Check 0 - 5 .517 .411 .375 .346 .329 .296 .268 .255 .070 5 - 10 .476 .396 .378 .358 .357 .350 .339 .338 .081
10 - 15 .476 .407 .378 .353 .336 .300 .261 .238 .088

cover crops but w1 th cotoran app 1i ed d L Lht:! r·t:!t.;UllDllt:!ll<l~J r·a Le. The
purpose of the sampling of the plots with and without cotoran was to
detennine if annual applications during the last four years affected
the retention and transmission of water in the soil.
The organic matter contents were typical of those silt loam soils
that have been extensively cultivated in eastern Arkansas (Table 9).
As expected, the highest organic matter contents were found in the
O - 5-cm depth increment. There seemed to be no difference in organic
matter content due to winter cover treatment.
The average saturated hydraulic conductivities, determined by the
constant-head method, were about 50 percent lower in the plots that
had no winter cover. These results indicate that under continuous cot-
ton production, the addition of winter cover such as rye and vetch in
creased the ability of the soil to transmit water under saturated con
ditions. Average Ksats from the plots with winter cover and cotoran
were only about 12 percent lower than those with winter cover. Although
not significantly different, this reduction may be due to the effects
of cotoran on the microorganism population and, in particular, the earth
wonns. Earthworms are known to increase the sizes of pores near the
soil surface.
Saturated hydraulic conductivities also were determined by the fal
ling-head method and averaged 1.53, 0.83 and .27 cm hr-1 in the rye/
vetch with no herbicide, rye/vetch with herbicide and no winter cover
crops, respectively. Therefore, in these larger cores, the soil planted
to winter cover crops had values of Ksat that were 5.5 and 3.0 times
30
0 0 D D B 0 D
0 0 0 0 0 0 0 0 0 0 0 0

h1gher than those in continuous cultivation of cotton. The plots of
continuous cotton but with no cotoran had values of Ksat that were 1.8
times higher than that with the herbicide. This indicates that the
trend found with the smaller cores in the steady-state experiment was
more evident in the larger cores, i.e., the application of the herbi
cide reduced the Ksat.
Bulk densities increased with depth in the profile. As a general
rule, the bulk densities were slightly higher in the continuous cotton
without winter cover crops (1.35 g cm-3) than in the plots with the
cover crops (1.3 g cm-3).
The relationship between bulk density and organic matter content
in the Dubbs-Dundee soil was determined by regression to be
BO = 1.50 - 0.134 OM [4]
with a coefficient of determination of 0.633. This r2 indicated that
organic matter alone could explain 63 percent of the variation in the
variation of bulk density of the top 15 cm of soil.
Soil water retention results for the three treatments are presented
in Table 10. Differences due to treatment were small and nonsignifi
cant. There was, however, a tendency for the soil that had been in
continuous cultivation of cotton to have slightly lower volumes of wa
ter retained to 80 kPa. The differences in water retained were not
dramatic and indicates that the planting of winter cover crops and
subsequent incorporation of the residues into the soil during the spring
has not dramatically affected the volume of water retained by a unit
volume of soil.
31

The results of the fitting of equation [1] to the experimental
data are presented in Table 11. Based upon the values of the r2 , ex
cellent fits to the experimental data were obtained. There were little
differences in the intercepts and slopes that can be attributed to
treatment affects. A sunvnary of the data when combined across the three
depths is presented in Appendix Table 3.
A surrmary of the soil chemical status of the three treatments is
presented in Table 12. The results indicate that the soil has high
fertility, which is due primarily to the annual applications of fertil
izer for cotton production. No generalizations can be made concerning
the effects of treatment on the chemical status of the soil since the
plots were fertilized similarly.
CONCLUSIONS
This study was conducted to determine the effects of cultivation
on soil physical and chemical properties. Two soils in their native
environments were sampled and compared with similar soils that had been
extensively cultivated. A decrease in the physical fertility of the
soils was found due to tillage and the associated crop production prac
tices. An improvement in the chemical fertility was found. The tilled
soils had lower organic matter contents, lower Ksats, lower porosities,
but higher bulk densities and hydraulic resistances. Linear relations
were determined between organic matter content and the dependent vari
ables bulk density and extractable water for the virgin soils.
The results of the analyses of the continuous cotton plots indi
cated that the addition of winter cover crops such as rye and vetch
32
0 0 0 0 n D 0 0 0 0 D 0 D 0 0 0 0 0 0

L.--J t--.1
Table 11. Summary of the fit of the mathematical model to the water retention of the Dubbs-Dundee soi 1.
Depth Standard Standard Coefficient of Treatment Interval Intercept Error Slope Error Determination
Rye/Vetch 0 - 5 .479 .0089 -.0482 .0024 .907 w 5 - 10 .462 .0056 -.0461 .0015 .958 w
10 - 15 .440 .0055 -.0410 .0014 .950
Rye/Vetch 0 - 5 .490 .0085 -.0485 .0022 .916 5 - 10 .442 .0067 -.0433 .0018 .933
10 - 15 .455 .0083 -.0448 .0022 .906
Cultivated 0 - 5 .456 .0062 -.0470 .0016 .950 5 - 10 .450 .0112 -.0369 .0029 .784
10 - 15 .437 .0077 -.0416 .0020 .907

Table 12. Sut11Tlary of the chemical analyses of the Dubbs-Dundee soil at three depths and treatments.
Depth Soil Test Values Electrical Tillage Interval pH p K Ca Na Mg Conductivity
kg ha-1 umhos cm-l
Rye/Vetch 0 - 5 5.2 218 784 1792 246 325 82
w (0 herb.) 5 - 10 5.3 159 224 2352 224 325 80
~ 10 - 15 5.7 87 202 3136 246 448 100
Rye/Vetch 0 - 5 5.6 214 818 1568 246 325 80 { 3 herb.) 5 - 10 5.2 178 515 1904 168 336 120
10 - 15 5.3 148 202 2464 190 482 304
Check 0 - 5 6.2 192 482 1792 146 403 75 5 - 10 5.9 125 258 2464 157 381 62
10 - 15 5.9 158 190 3024 179 414 70
CJ CJ c::::::J c:::l c:::J c:J c:=i C::J CJ c::::J (=:J Cl CJ c:::J c::J c::J c::J c::J c::::J

] ]
] ] ] ]
] ]
increased the organic matter contents and Ksats and decreased the bulk
density. Although the eff~cts were not dramatic and rapid, this indi
cates that improvements in the soil physical status can be obtained
over a number of years. These results also have implications on the
volume of water available during the season for the growth of crops
such as cotton. Higher values of Ksat indicate that the transmission
coefficients of water through the soil near the surface are higher and
this tends to reduce runoff from rainfall and irrigations . Therefore,
more efficient use can be made of the water. Higher values of porosity
indicate that the soil can store more of the water within a given input
of water.
35
LITERATURE CITED
Bauer, A. and A.L. Black. 1981. Soil carbon, nitrogen and bulk density comparisons in two cropland tillage systems after 25 years and in virgin grassland. Soil Sci. Soc. Amer. J. 45:1166-1170.
Baver, L.D., W. Gardner and W. Gardner. 1973. Soil Physics. 4th Edition. John Wiley and Sons, Inc. New York.
Black, C.A., D.D. Evans, J.L. White, L.E. Ensminger and F.E. Clark. 1985. Methods of Soil Analysis. I: Physical and Mineralogical Properties, Including Statistics of Measurement and Sampling. American Society of Agronomy, Inc. Madison, WI.
Bouma, J. and F.D. Hole. 1971. Soil structure and hydraulic conductivity of adjacent virgin and cultivated pedons at two sites: a typic argiudoll (silt loam) and a typic eutrochrept (clay). Soil Sci. Soc. Amer. Proc. 35:316-319.
Duvall, L. 1973. Arkansas: Colony and State. Rose Publishing Company, Inc. Little Rock, AR.
Foss, J.E. and G. Moran. 1984. We must face the soil erosion problem. North Dakota Fann Research 41(6):25-27.
Hadas, A. 1987. Long-term tillage practice effects on soil aggregation modes and strength. Soil Sci. Soc. Amer. J. 51: (in Review).
MacRae, R.J. and G.R. Mehuys. 1985. The effect of green manuring on the physical properties of temperate-area soils. Adv. Soil Sci. 3:71-94.
Phillips, S.H. 1984. Introduction. In No-Tillage Agriculture: Principles and Practices. R.E. Phil,,-ps and S.H. Phillips, Ed. Van Nostrand Reinhold Company, New York.
~
l 0 n 0 0 D 0 0 0 0 0 0
Scott, H.D., E.M. Rutledge and W.N. Milley. 1983. Effects of tillage 0 on soil physical properties. Ark. Farm Res. 32(6):5.
Skidmore, E.L., W.A. Carstensen and E.E. Banbury . 1975. Soil changes O resulting from cropping. Soil Sci. Soc. Amer. Proc. 39:964-967.
Thiesse, B.R. 1984. Variability _of the physical properties of Captina soils. M.S. Thesis. University of Arkansas, Fayetteville. ~
United States Department of Agriculture. 1974. Soil Survey of Critten-den County, Arkansas. Soil Conservation Service. · ~
D 36 0

United States Department of Agriculture. 1977. Soil Survey of Benton County, Arkansas. Soil Conservation Service.
United States Department of Agriculture. 1981. Soil Survey of Lonoke and Prairie Counties, Arkansas. Soil Conservation Service.
Von Steen, D.H. and C.R. Brantner. 1981. Arkansas Crop Statistics. Crop Reporting Service. United States Department of Agriculture. Arkansas Agricultural Experiment Station Report Series 261.
37

0 Q
0 ~
0 IJ
APPENDICES
d 0 D r I 0 0 [J
0 0 LI
0 D
38 [J

Appendix Table 1. A sull1Tlary of the regression analyses of the virgin {v) and tilled (t) Crowley soils.
Relationships between Ksat Yv = 1.081 + 1.463 X yt = 3.257 - 1.909 x
(Y} and Organic Matter (X) r2 = 0.413
Relationships between Ksat (Y) Yv = 29.707 - 20.852 x yt = -1.494 - 1.514 x
Relationships between Bulk Density (Y) Yv = 1.347 - 0.0588 X Yt = 1.615 - 0.1037 X Yvt = 1.552 - 0.1153 X
r2 = 0.570
and Bulk Density (X) r2 = 0.295
r2 = 0.025
and Organic Matter (X) r2 = 0.983 r 2 = 0 .155 r2 = 0.481
Relationships between Plant Available Water (Y) and Organic Matter (X) 2 Yv = 0.122 + 0.051 X r = 0.993
Vt = 0.074 + 0.079 X r2 = 0.369
Yvt = 0.108 + 0.056 X r2 = 0.738
Appendix Table 2. A summary of the regression analyses of the virgin Jay. ..
Relationships between Ksat (Y) Yv = 1.440 - 0.0167 X
and Organic Matter (X) r 2 = 0.444 r2 = 0.359 Yvt = 1.367 - 0.0133 X
Relationships between Bulk Density (Y) and Organic Matter (X) Yv = 2.11 - 0.2538 X r2 = 0.866
Appendix Table 3. Relationship between water retained and applied pressure combined across depths for the three treatments in the Dubbs-Dundee soil. rye/vetch - no herbicide
Ov = 0.460 - 0.045 lnP rye/vetch - 3.3 kg/ha of cotoron
Ov = 0.462 - 0.046 lnP check
Ov = 0.488 - 0.042 lnP
r2 = 0.928
r 2 = 0.902
r 2 = 0.868


