

Making Incentives Work: Biometric Monitoring ImprovesHealthcare Provision and Reduces Misreporting -
Experimental Evidence from TB Control in India
Thomas Bossuroy (World Bank)
with Clara Delavallade (IFPRI) and Vincent Pons (HBS)
World Bank, January 25th, 2017

Motivation
Poor performance of health care in low and middle income countries isdue partly to:
I insu�cient provider e�ort, translating into high absenteeism rates(Chaudhury and Hammer 2004, Banerjee et al. 2004)
I low-quality data reporting
This paper's focus: Tuberculosis (TB)I Ending the global TB epidemic by 2030 is one of the targets of the
SDGs adopted by the UN in 2015I WHO End TB Strategy calls for a 90% reduction in TB deaths and an
80% reduction in the TB incidence rate by 2030, compared with 2015I Poor service delivery plagues e�orts to control the spread of
Tuberculosis

Large incidence of TB in the world
In 2015, 1.4 million people died of TB (source: WHO Global TB
Report, 2016).
10.4 million new TB casesI 56% among men, 34% among women, and 10% among childrenI people living with HIV accounted for 11% of all new cases
0.5 million new cases of multidrug-resistant TB (MDR-TB) and an
additional 0.1 million with rifampicin-resistant TB (RR-TB).
Rate of decline in TB incidence remained at only 1.5%I This needs to accelerate to a 4�5% annual decline by 2020 to reach the
�rst milestones of the End TB Strategy.

TB in the world

TB in the world

TB in the world

TB in India
India accounts for more than one quarter of the world's TB cases and
deaths.
About 1,000 Indians die of TB every day (TB deaths in 12 days in
India = death toll of entire 2014-2015 Ebola outbreak)
97% of the new TB cases are drug susceptible strains of disease.

TB in India
India accounts for more than one quarter of the world's TB cases and
deaths.
About 1,000 Indians die of TB every day (TB deaths in 12 days in
India = death toll of entire 2014-2015 Ebola outbreak)
97% of the new TB cases are drug susceptible strains of disease.
TB in India
India accounts for more than one quarter of the world's TB cases and
deaths.
About 1,000 Indians die of TB every day (TB deaths in 12 days in
India = death toll of entire 2014-2015 Ebola outbreak)
97% of the new TB cases are drug susceptible strains of disease.

TB and its treatment
TB is an infectious disease.I It typically a�ects the lungs (pulmonary TB) but can also a�ect other
sites (extrapulmonary TB).I Disease spreads when people who are sick with pulmonary TB expel
bacteria into the air, for example by coughing
Without treatment, death rate is about 70% within 10 years.
Treatment:I WHO recommended treatment: 6-month regimen of four �rst-line
drugs (isoniazid, rifampicin, ethambutol and pyrazinamide); about US$40 per person
I success rate: 85% for new cases of drug-susceptible TB.I treatment for RR-TB and MDR-TB is longer, and requires more
expensive and more toxic drugs.

Main challenges to eradicate TB
Timely Detection: TB often stays undetected and untreated
Treatment Compliance: TB treatment is long, with side e�ects.Symptoms disappear after 2 months. Defaults lead to high mortalityand drug resistance (MDR, RR).
I Uniquely identifying and tracking patientsI Improving health worker's e�ort and performance

The DOTS system
The DOTS system (WHO):
I Directly Observed Treatment every other day � Ű daily compliance �Ű e�ectiveness of treatment and treatment completion
I 1st challenge: E�ectively monitor patients
Can't ask weak patients to walk one hour back and forth every other
day!
I � Need large number of small treatment centers, operated in part byNGOs (PPP)
I 2nd challenge: E�ectively monitor health workers operating the centers(principal-agent relationship)

Technological innovations in India
Nikshay:I Government of India digitized Treatment Cards to create web-based
centralized database of all TB patientsI includes information on test results, prescribed medication, and daily
pill intakeI increased case noti�cations from the private sectorI limits
F quality of the database depends on the quality of information on thetreatment cards
F information only entered with a lag, preventing quick corrective actionto ensure compliance
AadhaarI aim: biometrics-based Unique Identi�cation (UID) to all the 1.2 billion
residentsI already covers 70% adultsI identity of anyone can be can be veri�ed through �ngerprint scan, iris
scan and registered cellphone number

Technological innovations in India
Nikshay + Aadhar could be combined into biometric recognitiontechnology linked in real time to an integrated database of carebene�ciaries �
I improve the reliability of recordsI rapid follow-up on patients who miss pills
System studied in this paper can be seen as a pilot for a national
system based on the integration of Nikshay + Aadhar

Research question
Do biometric devices improve treatment compliance and
treatment outcome?
Biometric devices installed in TB treatment centers may
1 facilitate patients' monitoring (digital register of patients per center,daily monitoring of pill intake)
2 improve health workers' monitoring (job attendance; accuracy ofreporting)
3 � improve treatment compliance, completion, and patient health
However, biometric devices may
1 decrease e�ort on other dimensions of health workers' job2 � worsen other outcomes (e.g. patient detection)

Outline of the results
Biometric devices improved real outcomes
I reduced fraction of defaulting patients (23%)I improved compliance with the DOTS system and daily pill intake (29%)I mechanisms
F renewed e�ort by counselors: Ű counselors' attendance (21% morepresent) and e�ort (home visits)
F counselors' work facilitated
I did not come at the cost of decreasing detections
Reduced forgeryI in data reported by OpAshaI and in o�cial data available in public hospitals' TB registers

Outline
1 Research question and strategy
2 Context of the experiment
3 Impact on �real� outcomes
4 Impact on data forgery
5 Conclusion

Outline
1 Research question and strategy
2 Context of the experiment
3 Impact on �real� outcomes
4 Impact on data forgery
5 Conclusion

Setting
Northern India, 4 states, 9 cities
I MP: Bhopal, Gwalior, Indore, SagarI Delhi: East DelhiI Chattisgarh: Korba, Raipur, Durg-BhilaiI Odisha: Bhubaneswar

Setting
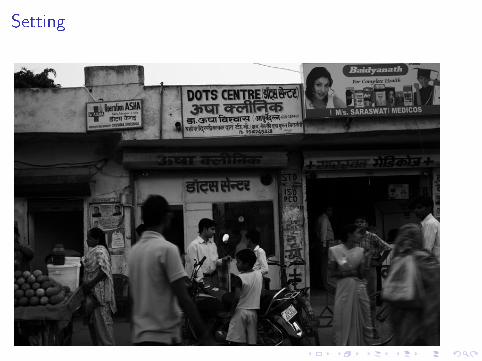
Partner NGO: Operation ASHA, an NGO operating DOTS centers in
urban slums
March 2013 - September 2014
Centers managed by health workers
I responsible for patient detection and complianceI incentivized on both outcomes (following preliminary results of our
other RCT)
Sample size
I 65 clusters spanning 129 DOTS centers and 85 health workersI 1 year of repeated observationsI 4,911 patients
Randomization at the cluster level, after strati�cation by city

Setting
Partner NGO: Operation ASHA, an NGO operating DOTS centers in
urban slums
March 2013 - September 2014
Centers managed by health workers
I responsible for patient detection and complianceI incentivized on both outcomes (following preliminary results of our
other RCT)
Sample size
I 65 clusters spanning 129 DOTS centers and 85 health workersI 1 year of repeated observationsI 4,911 patients
Randomization at the cluster level, after strati�cation by city
Setting

Setting

Setting

Setting

Biometric monitoring system
Fingerprint scanner
I registers the health worker's �ngerprints; records daily arrivals anddeparture times
I registers the patients �ngertips; records any time they come to takemedicine
Data stored twofold:
I in a terminal in the health centerI in a server in New Delhi
By Operation ASHA + Microsoft Research India

Biometric monitoring system
Data
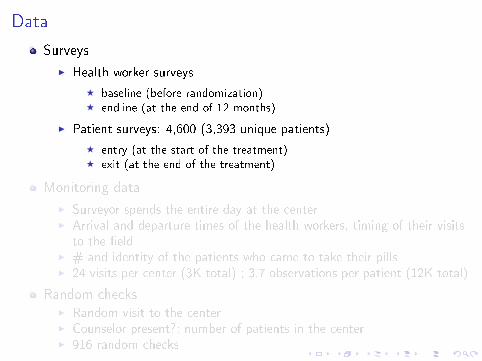
Surveys
I Health worker surveys
F baseline (before randomization)F endline (at the end of 12 months)
I Patient surveys: 4,600 (3,393 unique patients)
F entry (at the start of the treatment)F exit (at the end of the treatment)
Monitoring data
I Surveyor spends the entire day at the centerI Arrival and departure times of the health workers, timing of their visits
to the �eldI # and identity of the patients who came to take their pillsI 24 visits per center (3K total) ; 3.7 observations per patient (12K total)
Random checksI Random visit to the centerI Counselor present?; number of patients in the centerI 916 random checks

Data
Surveys
I Health worker surveys
F baseline (before randomization)F endline (at the end of 12 months)
I Patient surveys: 4,600 (3,393 unique patients)
F entry (at the start of the treatment)F exit (at the end of the treatment)
Monitoring data
I Surveyor spends the entire day at the centerI Arrival and departure times of the health workers, timing of their visits
to the �eldI # and identity of the patients who came to take their pillsI 24 visits per center (3K total) ; 3.7 observations per patient (12K total)
Random checksI Random visit to the centerI Counselor present?; number of patients in the centerI 916 random checks

DataQualitative surveys
I 47 patientsI 45 health workers
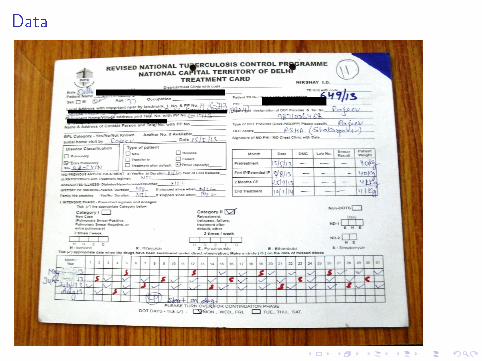
Administrative data
I NGO data: # detections and defaults per center per monthI Patients' treatment cards: daily pills' intake as recorded by health
workerI TB registers maintained by the public health system
Patients matched across datasets based onI names (�rst name, last name, father's name)I TB numberI lab number
Patient treatment start date obtained for 99.8% patients, frommultiple sources
I process dataI patient surveysI treatment cards

DataQualitative surveys
I 47 patientsI 45 health workers
Administrative data
I NGO data: # detections and defaults per center per monthI Patients' treatment cards: daily pills' intake as recorded by health
workerI TB registers maintained by the public health system
Patients matched across datasets based onI names (�rst name, last name, father's name)I TB numberI lab number
Patient treatment start date obtained for 99.8% patients, frommultiple sources
I process dataI patient surveysI treatment cards
Data

Analysis
Comparing these di�erent data sources, we noticed mismatch between
data reported by the health workers to their headquarter and what we
could verify independently.
Our analysis includes 2 parts1 Impact on �real� outcomes (veri�ed by us)2 Impact on data misreporting (di�erence between real outcomes and
outcomes reported by the health workers)
Regressions include strata �xed e�ects (city x type of counselor) ;
clustered at the level of a health worker

Outline
1 Research question and strategy
2 Context of the experiment
3 Impact on �real� outcomes
4 Impact on data forgery
5 Conclusion

Randomization check (health workers)

No di�erential attrition (health workers)

Randomization check (patients detected before)

Randomization check (patients detected before)
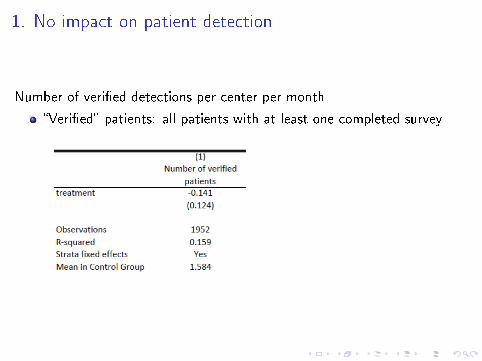
1. No impact on patient detection
Number of veri�ed detections per center per month
�Veri�ed� patients: all patients with at least one completed survey

1.1 No impact on patient selection (Patients detected after)

2. Improved treatment outcome
All veri�ed patients, exit survey

3. Improved daily compliance
All veri�ed patients, last survey or exit survey

3. Improved daily compliance
Monitoring data

4. Improved service delivery
Health worker surveys

4. Improved service delivery
Monitoring data

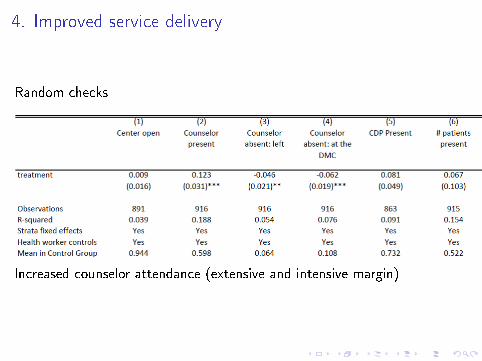
4. Improved service delivery
Random checks
Increased counselor attendance (extensive and intensive margin)
4. Improved service delivery
Random checks
Increased counselor attendance (extensive and intensive margin)

4. Improved service delivery
Patient surveys

Outline
1 Research question and strategy
2 Context of the experiment
3 Impact on �real� outcomes
4 Impact on data forgery
5 Conclusion

Monthly data reported by OpAsha
Monthly centerwise reports (also used to compute health workers' salaries)

To be compared to true e�ects (detection)
Interpretation: decreased over-reporting of detections

To be compared to true e�ects (detection)
Interpretation: decreased over-reporting of detections

To be compared to true e�ects (default)
Interpretation: decreased under-reporting of treatment interruption
Qualitative evidence con�rms under-reporting of defaults and
over-reporting of detections

To be compared to true e�ects (default)
Interpretation: decreased under-reporting of treatment interruption
Qualitative evidence con�rms under-reporting of defaults and
over-reporting of detections

1. Forgery on patient detection
Likelihood of successfully surveying a patient declared by OpAsha

1. Forgery on patient detection
Likelihood of surveying a patient found in the TB register

2. Forgery on daily compliance
Monitoring data

2. Forgery on daily compliance
Treatment card data

3. Forgery on counselors' presence
Random checks vs. salary data

Outline
1 Research question and strategy
2 Context of the experiment
3 Impact on �real� outcomes
4 Impact on data forgery
5 Conclusion

Conclusion
Biometric devices improved real outcomes
I reduced fraction of defaulting patients (23%)I improved compliance with the DOTS system and daily pill intake (29%)I mechanisms
F renewed e�ort by counselors: Ű counselors' attendance (21% morepresent) and e�ort (home visits)
F counselors' work facilitated
I did not come at the cost of decreasing detections
Reduced forgeryI in data reported by OpAshaI and in o�cial data available in public hospitals' TB registers

Scalability?
Intervention reduced salaries in T relatively to C since1 reduced number of fake detections2 improved treatment compliance not re�ected in o�cial data
Nonetheless, biometrics devices make work so much easier that
counselors remain equally satis�ed
� this type of intervention could be scaled up without facing too
much resistance

Take-away
Work in progressI Additional work needed on data misreportingI Additional outcomes, including patient health and productivity
One general take-away, beyond this studyI interventions often have the potential to a�ect outcome reporting as
much as real outcomes (by making forgery easier/harder, more/lessdesirable)
I � need to carefully interpret impacts, and if possible collect andcompare independent data sources


