
CALEDONIA MINING CORPORATION AUGUST 08, 2011
Management’s Discussion and Analysis
This discussion and analysis of the consolidated operating results and financial position of Caledonia
Mining Corporation ("Caledonia”) is for the fiscal quarter ended June 30, 2011 and the period until
August 8, 2011. It should be read in conjunction with the Unaudited Condensed Consolidated Financial
Statements as at June 30, 2011 and the Annual Report for the year ended December 31, 2010, all of which
are available from the System for Electronic Data Analysis and Retrieval at www.sedar.com or from
Caledonia’s website at www.caledoniamining.com. These Unaudited Condensed Consolidated Financial
Statements and related notes have been prepared using accounting policies consistent with IFRS and in
accordance with International Accounting Standard 34 (“IAS 34”) – Interim Financial Reporting. A
reconciliation of the previously disclosed comparative periods’ financial statements prepared in
accordance with Canadian generally accepted accounting principles to IFRS is set out in Note 21 to these
condensed financial statements.
Note that all currency references in this document are to Canadian Dollars.
Contents of the MD&A
1. Forward Looking Statements
2. Overview
3. Highlights for the Quarter ended June 30, 2011 (2nd
Quarter 2011)
4. Summary Financial Results for the 2nd
Quarter 2011
5. Operations at the Blanket Gold Mine, Zimbabwe
5.1. Safety, Health and Environment
5.2. Social Investment
5.3. Gold Production
5.4. Operating Costs
5.5. Underground
5.6. Capital Projects
5.7. Mineral Reserves and Resources
5.8. Indigenization
5.9. Risks
5.10. Opportunities
5.11. Outlook
6. Exploration and Project Development
6.1. Base Metals: Nama Cobalt/Copper Project – Zambia
6.2. Gold: Zimbabwe
6.3. PGE/Ni/Cu: Rooipoort (including Grasvally) and Mapochsgronde - South Africa
7. Investing
8. Financing
9. Liquidity and Capital Resources
10. Off-Balance Sheet Arrangements
11. Related Party Transactions
12. Critical Accounting Policies
13. Securities Outstanding
14. Controls
15. Qualified Persons

2
1. FORWARD LOOKING STATEMENTS
This Management Discussion and Analysis contains certain forward-looking statements relating but not
limited to Caledonia’s expectations, intentions, plans, and beliefs. Forward-looking information can often
be identified by forward-looking words such as “anticipate”, “believe”, “expect”, “goal”, “plan”, “intend”,
“estimate”, “could”, “should”, “may” and “will” or similar words suggesting future outcomes, or other
expectations, beliefs, plans, objectives, assumptions, intentions or statements about future events or
performance. Forward-looking information may include reserve and resource estimates, estimates of future
production, unit costs, costs of capital projects and timing of commencement of operations, and is based on
current expectations that involve a number of business risks and uncertainties. Factors that could cause
actual results to differ materially from any forward-looking statement include, but are not limited to, failure
to establish estimated resources and reserves, the grade and recovery of ore which is mined varying from
estimates, capital and operating costs varying significantly from estimates, delays in obtaining or failures to
obtain required governmental, environmental or other project approvals, inflation, changes in exchange
rates, fluctuations in commodity prices, delays in the development of projects and other factors. Forward-
looking statements are subject to risks, uncertainties and other factors that could cause actual results to
differ materially from expected results.
Potential shareholders and prospective investors should be aware that these statements are subject to known
and unknown risks, uncertainties and other factors that could cause actual results to differ materially from
those suggested by the forward-looking statements. Shareholders are cautioned not to place undue reliance
on forward-looking information. By its nature, forward-looking information involves many assumptions,
risks and uncertainties, both general and specific, that contribute to the possibility that the predictions,
forecasts, projections and various future events will not occur. Caledonia undertakes no obligation to
update publicly or otherwise revise any forward-looking information whether as a result of new
information, future events or other such factors which affect this information, except as required by law.
2. OVERVIEW
Caledonia is an exploration, development and mining corporation focused on Southern Africa. The
Corporation’s primary assets are an operating gold mine in Zimbabwe (the “Blanket Mine”), a base metals
exploration project in Zambia (the “Nama Property”) and platinum and base metal (PGE) projects in South
Africa (“Rooipoort/Mapochs”).
Caledonia’s shares are listed on the Toronto Stock Exchange as “CAL”, on London’s AIM as “CMCL” and
are also traded on NASDAQ-OTCBB as “CALVF”.
The Corporation’s business model is to identify and/or acquire properties or projects early in the
development cycle which have the potential to become viable operations, and then add value by developing
the asset, either as an operator or through joint venture agreements. The possibility of divestiture in whole
or part will be considered at different points in time and will be governed by the benefit to shareholders.
3. HIGHLIGHTS FOR THE QUARTER ENDED JUNE, 30 2011 (“2nd
QUARTER 2011”)
Gold produced at the Blanket Mine in Zimbabwe increased by 12% to 8,226 ounces from the 7,322
ounces produced in the preceding quarter. Gold production in the quarter was 141% higher than the
3,408 ounces of gold produced in 2nd
quarter 2010.
The average price per ounce of gold sold in the 2nd
quarter of 2011 was US$1,512 compared to
US$1,192 in the 2nd
quarter of 2010.
Gross Profit (i.e. before depreciation, amortization and administrative expenses) was $6,226,000
compared to $1,534,000 in the 2nd
quarter of 2010.
Caledonia recorded net profit before tax of $3,836,000 compared to $413,000 in the 2nd
quarter of 2010.
Average gold recovery increased to 92.9% from 92.2% in the first quarter 2011, reflecting the recent
investment in the milling and Carbon-in-Leach (“CIL”) circuits.

3
Cash operating costs at the Blanket Mine in the quarter were US$585 per ounce of gold produced,
compared to US$648 per ounce in the 1st quarter of 2011 and US$816 per ounce in the 2
nd quarter of
2010.
Blanket made statutory payments in the quarter totalling US$3,307,000 (US$1,442,000 – Q1 2011) in
respect of direct and indirect taxes, royalties, licence fees and other payments to the Government of
Zimbabwe.
At June 30, 2011 the Corporation had cash and cash equivalents (net of the bank overdraft) of
$2,612,000 (March 31, 2011 $1,406,000).
The 2011 drilling program commenced in March 2011 at the Konkola West area of the Nama base
metals project in Zambia to identify whether typical copper-belt type mineralisation, which is the
primary type of mineralisation found in Zambian copper and cobalt deposits, exists similar to that on the
adjacent property to the east of the Nama Licence Area. This initial phase of the drilling programme,
which comprises 4 holes, continues. At the end of the 2nd quarter, 2 holes had been drilled and the drill
rig was being moved to the 3rd
hole. The conclusions arising from this program will be made available
when management has received and evaluated all of the results of this stage of the program. This is
anticipated to be in the 4th Quarter of 2011.
4. SUMMARY FINANCIAL RESULTS FOR 2nd
QUARTER 2011
The table below set out the unaudited condensed consolidated profit and loss for the three months and the
six months ended June 30, 2011 and 2010.
Condensed Consolidated Statement of Comprehensive Income (unaudited)
(In thousands of Canadian dollars except per share amounts)
For the 3 months
ended June 30
For the 6 months
ended June 30
2011 2010 2011 2010
$ $ $ $
Revenue 11,990 4,154 23,216 8,614
Royalty (593) (147) (1,048) (292)
Production costs (5,171) (2,473) (10,121) (5,755)
Amortization (633) (575) (1,206) (1,160)
Gross profit 5,593 959 10,841 1,407
Administrative expenses (1,733) (469) (2,679) (895)
Share-based payment - - (1,102) -
Results from operating activities 3,860 490 7,060 512
Finance income - 63 - 162
Finance expense (24) (140) (179) (154)
Profit before income tax 3,836 413 6,881 520
Income tax expense (962) (2) (2,112) (2)
Profit for the period 2,874 411 4,769 518
Profit/(loss) on foreign currency translation (361) 575 (1,075) (101)
Total comprehensive income for the period 2,513 986 3,694 417
Earnings per share (cents)
Basic 0.58 0.08 0.96 0.10
Diluted 0.54 0.08 0.88 0.10
Weighted average number of common
shares outstanding (thousand)
Basic 500,313 500,169 500,241 500,169
Diluted 542,853 500,169 542,781 500,169

4
Administrative expenses in the 2nd
quarter included regional office expenses of $226,000 ($68 - 2010),
withholding taxes paid $1,010,000 (nil – 2010), management contract fee $207,000 ($196,000 – 2010)
audit fees $120,000 ($65,000 – 2010) and other expenses of $170,000 ($140,000 – 2010).
The taxation charge in the 2nd quarter is made up of an income tax estimate of $853,000 ($2,000 – 2010)
and an increase in deferred tax of $109,000 (nil – 2010).
The table below sets out the unaudited condensed statement of cash flows for the six months to June 30,
2011 and 2010.
Condensed Consolidated Statement of Cash Flows (unaudited)
(In thousands of Canadian dollars)
For the 6 months ended June 30
2011 2010
$ $
Cash flows from operating activities
Profit for the period 4,769 518
Adjustments for:
Reconcile net cash from operations 4,580 957
Changes in non-cash working capital (512) 139
Income tax paid (1,312) (2)
Net cash from operating activities 7,525 1,612
Cash flows from investing activities
Property, plant and equipment additions (5,171) (3,438)
Sale of investment - 51
Net cash used in investing activities (5,171) (3,387)
Cash flows from financing activities
Bank overdraft increase 1,675 1,766
Finance expense (179) (154)
Finance income - 162
Shares issued 38 -
Net cash from (used in) financing activities 1,534 1,774
Net increase in cash and cash equivalents 3,888 (1)
Cash and cash equivalents at beginning of period 1,145 1,623
Cash and cash equivalents at end of period 5,033 1,622
Cash generated by operations at the Blanket Gold mine in Zimbabwe increased substantially due to the
increased gold production, higher gold prices and lower cash operating costs. Blanket made significant
income tax payments in the quarter due to increased profitability. The increase in the bank overdraft is
largely due to a Zimbabwe tax payment at the end of the quarter. Additions to capital equipment primarily
relates to the remaining generators which were installed at Blanket; the raise boring of the ventilation raise
at Blanket, and the drilling at Nama, all of which is set out in sections 5.3 and 6.1.
The table below sets out the unaudited, condensed, consolidated statement of Caledonia’s financial position
at June 30, 2011 and December 31, 2010.
5
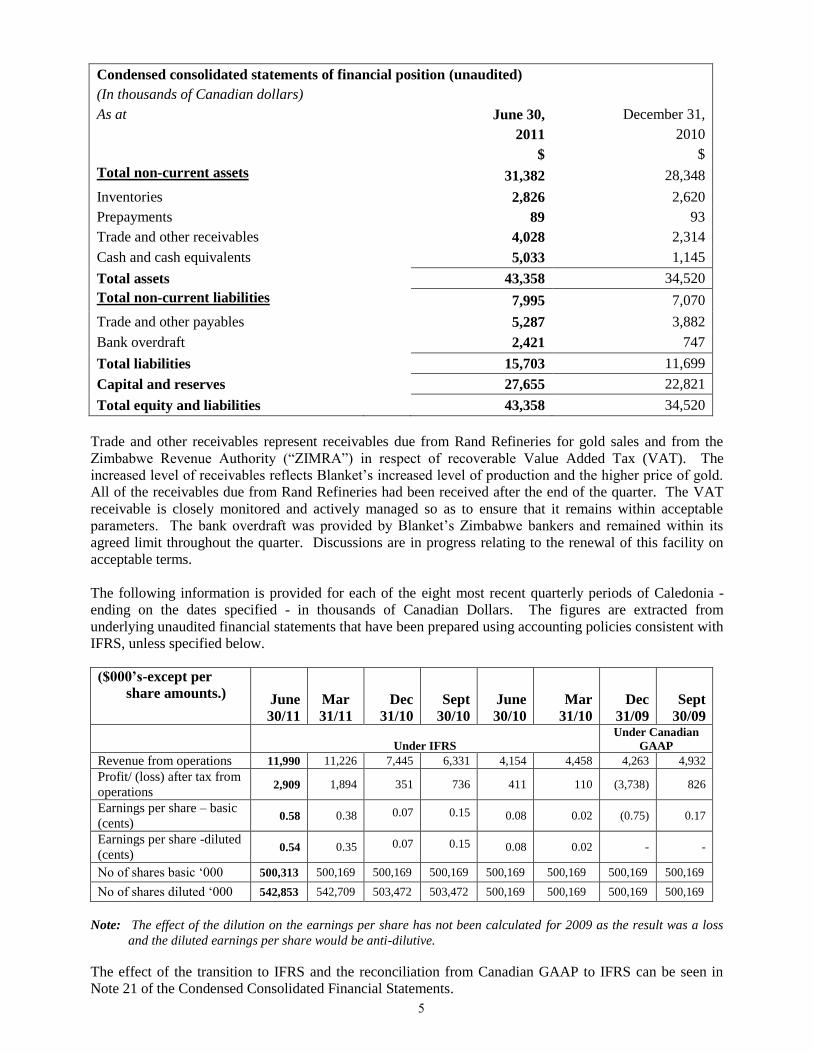
Condensed consolidated statements of financial position (unaudited)
(In thousands of Canadian dollars)
As at June 30, December 31,
2011 2010
$ $
Total non-current assets 31,382 28,348
Inventories 2,826 2,620
Prepayments 89 93
Trade and other receivables 4,028 2,314
Cash and cash equivalents 5,033 1,145
Total assets 43,358 34,520
Total non-current liabilities 7,995 7,070
Trade and other payables 5,287 3,882
Bank overdraft 2,421 747
Total liabilities 15,703 11,699
Capital and reserves 27,655 22,821
Total equity and liabilities 43,358 34,520
Trade and other receivables represent receivables due from Rand Refineries for gold sales and from the
Zimbabwe Revenue Authority (“ZIMRA”) in respect of recoverable Value Added Tax (VAT). The
increased level of receivables reflects Blanket’s increased level of production and the higher price of gold.
All of the receivables due from Rand Refineries had been received after the end of the quarter. The VAT
receivable is closely monitored and actively managed so as to ensure that it remains within acceptable
parameters. The bank overdraft was provided by Blanket’s Zimbabwe bankers and remained within its
agreed limit throughout the quarter. Discussions are in progress relating to the renewal of this facility on
acceptable terms.
The following information is provided for each of the eight most recent quarterly periods of Caledonia -
ending on the dates specified - in thousands of Canadian Dollars. The figures are extracted from
underlying unaudited financial statements that have been prepared using accounting policies consistent with
IFRS, unless specified below.
($000’s-except per
share amounts.)
June
30/11
Mar
31/11
Dec
31/10
Sept
30/10
June
30/10
Mar
31/10
Dec
31/09
Sept
30/09
Under IFRS
Under Canadian
GAAP
Revenue from operations 11,990 11,226 7,445 6,331 4,154 4,458 4,263 4,932
Profit/ (loss) after tax from
operations 2,909 1,894 351 736 411 110 (3,738) 826
Earnings per share – basic
(cents) 0.58 0.38 0.07 0.15 0.08 0.02 (0.75) 0.17
Earnings per share -diluted
(cents) 0.54 0.35 0.07 0.15 0.08 0.02 - -
No of shares basic ‘000 500,313 500,169 500,169 500,169 500,169 500,169 500,169 500,169
No of shares diluted ‘000 542,853 542,709 503,472 503,472 500,169 500,169 500,169 500,169
Note: The effect of the dilution on the earnings per share has not been calculated for 2009 as the result was a loss
and the diluted earnings per share would be anti-dilutive.
The effect of the transition to IFRS and the reconciliation from Canadian GAAP to IFRS can be seen in
Note 21 of the Condensed Consolidated Financial Statements.

6
5. OPERATIONS AT THE BLANKET GOLD MINE, ZIMBABWE
The primary focus of the Blanket Mine in Zimbabwe for the quarter under review was on the completion of
the ore pass from 18 to 22 Level, the commissioning of the standby generator system, the completion of the
ventilation raise between 14 and 22 Level and achieving further increases in production. Further major
capital investment at Blanket and the satellite projects has been largely curtailed pending clarification of the
implementation of the indigenization policy of the Government of Zimbabwe.
5.1 Safety, Health and Environment (“SHE”)
The following safety statistics have been recorded for the three months and six months to June 30, 2011 and
2010.
Blanket Mine Safety Statistics
For the 3 months
ended June 30
For the 6 months
ended June 30
2011 2010 2011 2010
Lost time injury 1 0 1 0
Occupational illness 0 0 0 1
Medical aid 2 0 5 3
Restricted work activity 5 2 14 5
First aid 10 5 12 8
Total 18 7 32 17
Incidents 8 14 14 25
Near misses 1 6 8 19
Man-hours worked 630,259 508,161 1,241,902 1,077,694
During the 2nd
quarter, Blanket’s employees received 951 training modules either in respect of their
designated role, and/or on general health, safety procedures and first aid.
There were no adverse environmental issues during the quarter. Water sampling results from the 14
monitoring holes downstream of the tailing dams continue to verify satisfactory environmental controls.
Water usage in the quarter was 6% lower than in the previous quarter and 12% higher than the comparable
quarter of 2010 due to the increased tonnes mined and processed.
5.2 Social Investment
During the quarter, Blanket Mine spent approximately US$205,000 on community and social investment
projects which are not directly related to the operation of the mine or the welfare of Blanket’s employees.
In the quarter, Blanket made total payments to the Zimbabwean Government and its agencies of over
US$3.3 million in respect of mining royalties, taxes and other non-taxation charges. Blanket also made
payments to the Zimbabwe Electricity Supply agency (“ZESA”) in the quarter totalling US$1.14 million, of
which US$0.63 million represents the premium payment which is required to secure a reasonably reliable
electricity supply.
5.3 Gold Production
8,226 ounces of gold were produced in the 2nd
quarter, a 12.3% increase on gold produced during the 1st
quarter of 2011 and a 141 % increase on gold produced during the 2nd
quarter of 2010. Tonnes milled,
average grades, recoveries and gold produced during July 2011, the 2nd
quarter 2011, and the preceding 4
quarters are shown in the table below.

7
Blanket Mine Production Statistics
Year
Tonnes
Milled
Gold Head
(Feed)
Grade(g/t) Recovery
Gold
Ounces
Produced
Average sales
price per
ounce of gold
sold (US$/oz)
July 2011 24,988 3.69 92.0 2,761 1,630
Second quarter 2011 60,913 4.52 92.9% 8,226 1,512
First quarter 2011 61,437 4.02 92.2% 7,322 1,397
Fourth quarter 2010 51,313 4.15 91.1% 6,235 1,384
Third quarter 2010 41,594 4.04 91.3% 4,935 1,241
Second quarter 2010 30,788 3.79 90.8% 3,408 1,192
Production during the 2nd
quarter of 2011 and in July 2011was higher than the period April to July 2010
due to the continued ramp-up in production following the completion of the #4 shaft project in 2010. The
tonnes mined were lower than originally planned due to the constraints experienced during the quarter in
the movement of materials underground, particularly on 22 Level (750 m below surface datum). All waste
material generated by the raise boring operations had to be removed on a continuous basis via the 22 Level
haulage which caused tramming congestion and restricted production. Work on raise boring the ore pass
commenced on February 10th and was completed in late May, with the final equipping of the ore pass on 18
and 22 Level being completed by late July. This ore pass will remove the production constraints and the
costs of double handling ore mined on 18 Level. The ventilation raise was completed on July 28, 2011.
The raise-boring contractor encountered a number of unexpected equipment-related delays during the raise
boring project which took 2.5 months longer than anticipated and disrupted production throughout the
period of operation. The dismantling, removal and hoisting of the raise borer and its rods to surface was
underway at the end of July and should be completed by mid-August.
Additional factors which adversely affected mining production during the quarter included a shortage of
spare parts for certain key items of equipment, and the need to improve some sections of the underground
haulages to allow for increased locomotive shunting speeds. The historic lack of investment due to the
shortage of funding, which is common to virtually all mines in Zimbabwe, contributed to the unexpected
increased incidence of equipment breakdowns at the higher production levels. These problems and their
causes have been clearly identified and actions implemented to reduce the potential for reoccurrence. This
action plan will be an area of key focus for underground management in the 3rd
quarter.
In the metallurgical plant, the installation of a second new gyratory crusher, a new triple-deck screen and
the commissioning of the standby generators required a 5 day planned interruption in production during the
2nd
Quarter. The new crushers and screen are operating well and are capable of providing adequate sized
crushed ore for the mill feed well in excess of the 1000 tonnes per day (tpd) requirement. Their installation
and the improved product size delivered to the mills has also contributed to the improvement in mill gold
recovery and reduced plant operating costs.
The gold grade of the mined ore in the quarter was 4.52 g/t which was higher than the mine plan of 3.83g/t,
although this was partially reversed in July as a result of a normalisation to Blanket’s mine plan. The plant
operated at below the planned target due mainly to ore shortages caused by the various underground
constraints detailed above.
Gold recoveries increased to 92.9%, which is higher than the planned recovery of 91% and the recovery of
92.2% which was achieved in the previous quarter. The higher overall gold recovery reflects the improved
consistency of the input material to the CIL circuit, which was due to the major improvements in the
crushing and milling circuit and was achieved despite a reduction in the gravity plant gold recovered at
44% of the total gold recovered (normally about 50%). Higher gold recoveries were also a result of recent

8
investment in the CIL plant, including new agitator gearboxes and mixers, and the installation of an
automated cyanide dosing system.
Power availability in the quarter remained reasonably stable following the new supply agreement which
was signed with ZESA in October 2010. As anticipated, ZESA was unable to maintain un-interrupted
supply. The standby generators, which were commissioned in early May, operated as designed for just 51
hours during the quarter and allowed Blanket to maintain full operations during the interruptions to normal
electricity supply. Generally, the plant consumables were at or below their planned consumption levels
during the quarter.
5.4 Operating costs
The operating cash costs per ounce of gold produced during the quarter and the preceding 4 quarters are set
out in the table below.
Blanket Mine Cash Costs
(cost in US$ per ounce of gold produced)
Q2
2010
Q3
2010
Q4
2010
Q1
2011 Q2
2011
Labour 324 232 211 208 175
Consumables 301 249 329 247 212
Electricity (incl. diesel) 97 105 167 145 154
Other admin costs 94 65 84 48 44
Total US$ cost/oz gold produced 816 651 791 648 585
Gold Ounces produced 3,408 4,935 6,235 7322 8,226
The average cost per ounce of gold produced is sensitive to production volumes and the 12% increase in
gold production between the 1st and 2
nd quarters of 2011 contributed to the 10% reduction in the cost per
ounce of gold produced. The improved recovery rate and more efficient usage of consumables, particularly
grinding media and cyanide, also contributed to the reduced cost per ounce. The completion of the new ore
pass between 18 Level and 22 Level and the installation of the tipping station on 18 Level removed the
requirement for multiple handling of ore and waste, thereby reducing handling costs further.
The extent of the overall cost reduction was adversely affected by a significant increase in labour costs.
Wage negotiations for the year to 31 December 2011 had reached deadlock and this matter was referred to
arbitration in terms of Zimbabwe law. The arbitrator awarded a pay rise of approximately 20% backdated
to January 2011. The Chamber of Mines has lodged an appeal against the arbitration award. However, it is
likely that there will be a further significant increase in labour rates for 2011.
In May 2011 the price of electricity supplied by ZESA increased to 12.77 cents/kWh from 10.5c/kWh in
terms of the October 2010 supply agreement. Electricity supplied in terms of this agreement, although
expensive, is still considerably cheaper than the cost of electricity generated by the mine’s standby
generators.
Further strengthening of the South African Rand against the US dollar second quarter – R6.77/US$1 ( first
quarter – R6.98/US$1) also adversely affected the US dollar-denominated cost of consumables and capital
items imported from South Africa.
5.5 Underground
The AR South ore body continued to provide the majority of ore during the quarter. Average daily
production from AR South above 18 Level (630m BMSL) provided approximately 30% of average daily
ore. Production from this area benefitted from the completion of the ore pass which means that ore can
now be moved from the draw points on 18 Level to the 18 Level grizzlys and dropped directly via the raise
9
bored ore pass onto the 22 Level (750m below surface datum) grizzlies feeding the ore bins above the
crushing station (765m below surface datum) and the automated skip loading system (780m below surface
datum). Production from AR South mining area above 18 Level is scheduled to increase from the 2nd
quarter level of 230 tpd to 350 tpd in Q3. Production from AR South between 22 Level and 18 Level
provided approximately 20% of average daily production in the 2nd
quarter. During the quarter a long hole
drilling mining method was successfully introduced to parts of this area. The balance of the stopes in this
area will be converted from underhand stoping to long hole drilling during the 3rd
quarter and this will
result in increased production. The up-dip development of the AR Main ore body continues on 18 Level
and new production from this area is expected to commence in the 3rd
quarter. The balance of mining
production came from the Lima and Eroica ore bodies, which averaged daily production in the quarter of
110 tonnes and 120 tonnes respectively. Development at Lima and Eroica ore bodies continued during the
quarter.
5.6 Capital Projects
Raise Boring
As noted in the 2010 MD&A, subsequent to the completion of the No. 4 Shaft Expansion Project, certain
ore handling and ventilation limitations existed on 18 and 22 Levels. The ore handling limitations have now
been addressed by raise boring an ore pass connecting 18 Level to the No. 2 grizzly tip on 22 Level above
the ore bin. The 120 meter long and 1.5 meter diameter ore pass was completed in late May. The self-
tipping ramp and grizzly on top of the ore pass on 18 Level was completed and commissioned by the end of
May and the dead-box and discharge arrangement onto the Grizzly #2 on 22 Level was completed at the
end of July. This new ore pass has vastly improved the efficiency of delivering ore to the new underground
crushing and hoist loading station by eliminating the necessity to double handle ore and waste generated on
18 Level via the No 6 winze down to 22 Level before it can be crushed and hoisted from the underground
loading station to surface.
750m AR – Lima Haulage
Subsequent to the completion of the No. 4 Shaft Expansion Project, the development work recommenced
on the 22 Level Haulage Extension Project. This project will link the Blanket and Lima shafts on 22 Level
and will also allow for the further down-dip exploration of the Blanket Mine’s known ore bodies.
Crosscuts (side tunnels) will be mined from the 18 and 22 Level Haulages to provide the required drilling
platforms from which the ore bodies below the 22 Level can be drilled. If this exploration is successful,
this haulage will also allow for the rapid commencement of mining on any new mining areas defined.
Included in the 22 Level Haulage Extension Project scope of work was a 230 meter long ventilation raise
between 14 and 22 Level to provide satisfactory ventilation on 22 Level, which would then allow double-
shift blasting and will accelerate the daily rate of development advance. This ventilation raise was
completed on the 28th July. It is planned that all of the work on the 22 Level Haulage Extension Project and
its cross-cuts will be carried out simultaneously with normal mining production with completion anticipated
by the end of 2012. The budgeted cost of the 22 Level Haulage Extension Project utilizing internal
resources is about US$900 per meter advanced and equipped. The estimated capital cost for the planned
2,400 meter development, including the raise boring of the ventilation raise is approximately US$2.4
million, which will be funded from internal cash flows.
10MW x 33KV Standby Diesel Generating System
The erection of the new standby power generation building with its 20 tonne overhead travelling gantry and
the installation of the four standby generators, transformers, the required incoming and outgoing 33KV
reticulation and control systems was commissioned during the 2nd
quarter. The standby generating system
allows Blanket to maintain full operations during interruptions to the normal electricity supply arising from
load-shedding, line faults and other supply problems. During the quarter, the standby generating system
operated as designed during several interruptions to the normal electricity supply which totalled 51 hours
and vindicates management’s decision to proceed with the installation of full standby generating capacity.

10
5.7 Mineral Reserves and Resources
An independent mineral reserve and resource report for the Blanket Mine calculated as at 31st December
2010 was prepared by the MSA Group, as the independent qualified person, in compliance with Canadian
National Securities Instrument 43-101, and was published during the 2nd
quarter. The new report was
prepared primarily for regulatory reasons and does not reflect any significant exploration work in recent
years, due the lack of available funds for exploration activity in Zimbabwe. Further NI 43-101 reports are
expected to be issued from time to time in order to disclose the results of on-going operations and
exploration work.
Mr. Mike Robertson, Pr. Sci. Nat., and Mr. Bruno Bvirakare, Pr. Sci. Nat., both consultants with The MSA
Group are the “Independent Qualified Persons” for Blanket’s reserves and resources as required by
National Instrument 43-101 of the Canadian Securities Administrators.
5.8 Indigenization
In 2008 the Zimbabwean parliament passed the Indigenization and Economic Empowerment Act 2007
(“Act”) that stipulated that 51% ownership of all companies had to reside in the hands of Indigenous
Zimbabwean citizens. In February 2010, Statutory Instrument 21 of 2010 was released which dealt with
the regulations around the implementation of the Act. In terms of the regulations Blanket will have to
submit an implementation plan which outlines how Blanket proposes to comply with the requirements of
the Act within a 5 year period.
Blanket submitted its Indigenisation Implementation Plan to the Zimbabwe Government on May 9, 2011
in terms of the Indigenisation and Empowerment Act and associated Regulations. We await a formal
response from the Zimbabwe Government.
The Corporation will continue to monitor the situation and is consulting widely on this issue.
MINERAL RESERVES as at December 31, 2010 (based on a Gold Price of US$ 1100/oz)
Classification Tonnes Grade (Au
g/t) Gold Content (oz)
Proven Ore
Total Proven Ore including
Pillars* 1,326,100 4.02 171,400
Probable Ore
Operating and Development
Areas 2,513,700 3.66 295,800
Total Proven + Probable
Ore 3,839,800 3.78 467,200
MINERAL RESOURCES (based on a Gold Price of US$ 1100/oz)
Classification Tonnes Grade (Au
g/t) Gold Content (oz)
Indicated 510,000 3.79 62,100
Inferred 2,408,200 5.01 **
Tonnages and ounces are rounded to the nearest 100
Note * Pillar tonnages are discounted by 50%
Note ** In keeping with the requirements of NI 43-101, Inferred Resources are reported without estimates of
metal quantities.

11
5.9 Risks
Future risks are identified as set out below.
Indigenization: Indigenization legislation continues to be high on the Government’s political agenda
making Zimbabwe an exceptionally difficult investment environment. Uncertainty regarding Blanket’s
obligations in respect of the implementation of Indigenization and the general climate of uncertainty that
indigenization policies have created, creates multiple risks which include: investor uncertainty;
uncertainty as to the level of any indigenization shareholding; uncertainty as to the terms on which any
indigenization may be concluded; the identity of indigenization partners; uncertainty as to any future
revenue obligations that may be required to offset a requirement for direct equity participation by
indigenous parties and uncertainty as to any potential taxation implications of any indigenisation
transaction.
Illegal mining: During the quarter there has been an increase in illegal mining activities at surface on
properties controlled by Blanket. This gives rise to increased security costs and an increased risk of
theft and damage to equipment.
Increasing costs and taxes: notwithstanding the dollarization of the Zimbabwean economy. Blanket
continues to experience significant upward cost pressures from labour, the state-owned electricity
supplier, and from local and national government for levies, fees, royalties and other direct and indirect
taxes. The continued strength of the South African Rand against the United States Dollar also increases
the US Dollar-denominated cost of materials and equipment which are imported to Zimbabwe from
South Africa.
Succession planning: the limited availability of mining and other technical skills and experience in
Zimbabwe and the difficulty of attracting appropriately skilled employees to Zimbabwe creates a risk
that appropriate skills may not be available if, for whatever reason, the current skills base at the Blanket
mine is depleted.
Regulatory uncertainty: Blanket’s existing licences and permits are in good standing. However, in the
context of political uncertainty and the lack of administrative transparency in Zimbabwe, there is the
risk that licences and permits may be revoked or not renewed.
Reserve replacement: exploration activities at Blanket may not identify sufficient resources of an
adequate grade and metallurgical composition to replace ore which has been depleted by mining
activities. Blanket has embarked on development and exploration programmes as set out in sections 5.7
(Lima Haulage) and 6.2.
5.10 Opportunities
Increased production: Completion of underground development works during the quarter and further
attention to some ongoing maintenance issues during the 3rd
and 4th quarters of 2011 should allow
quarterly gold production to increase to a level of approximately 10,000 ounces by the start of the 4th
quarter of 2011. Blanket’s existing reserves and resources could support a further increase in production
provided the necessary investments in the resource development are able to be made.
Surplus capacity: The mine currently has a daily average mining capacity of over 1,000 tonnes per day;
the crushing and milling plant has the capacity to process approximately 1,800 tonnes of ore per day and
the CIL plant has capacity of 3,800 tonnes per day. Any increased production arising from increased
mining throughput could therefore be achieved with little or no capital investment and incurring only
increased consumable costs to treat the increased throughput.
12
Exploration success: Blanket’s main exploration objectives are to accelerate the 22 Level Haulage
Development Project and the related exploration of the down-dip extensions of the known ore bodies
and to develop the GG and Mascot satellite exploration projects as rapidly as the investment climate in
Zimbabwe allows. Depending on exploration success, Blanket may be able to further increase its
production levels within its proven and probable resource base.
Cost reductions: Blanket has several opportunities to further reduce its current operating costs:
o the present crushing and milling plant currently has the capacity to treat approximately 1,800
tonnes of ore per day when mining is able to supply additional ore from the Blanket mine
underground and from its exploration/development properties; and
o Management has identified and estimated the essential underground expenditures that will be
required to attain higher than the 1,000 tonnes per day currently targeted mining production levels.
Subject to a sustainable and satisfactory investment climate prevailing in Zimbabwe after an
acceptable clarification of the Government’s indigenization requirements, capital could be allocated
to upgrade certain metallurgical circuits, upgrade surface and underground facilities in order to
further increase gold production, optimize the operations and reduce operating costs.
5.11 Outlook
As daily production levels have risen, Blanket has experienced more frequent breakdowns of key items of
equipment, particularly compressors and underground loaders. Blanket also needs to upgrade several areas
of the underground haulages so that it can increase tramming speeds. This will facilitate the tramming of
the increased tonnages of ore now being mined underground to the 22 Level grizzlys for, crushing and
loading. It is now anticipated that production will increase to the targeted annualized production rate of
about 40,000 ounces of gold per annum by the start of the 4th quarter.
The capacity of the Blanket crushing and milling plant of approximately 1,800 tonnes per day enables it to
immediately treat additional feed material from the Blanket underground and from the GG and Mascot area
mines if the planned exploration/development work is successful.
6 EXPLORATION AND PROJECT DEVELOPMENT
6.1 Base Metals: Nama Cobalt/Copper Project – Zambia
Three main styles of cobalt (“Co”) mineralization occur in the Nama area, the “A-type” cobalt oxide
mineralization, the ‘D-type’ iron oxide bodies which are mostly enriched in Co, and the copper (“Cu”)
dominated Ore Shale hosted Cu-Co mineralization, more common elsewhere in the Copperbelt, which is
being exploited by neighbouring mines to the east and south of Nama. Exploration activities at Nama have
defined two resource targets (being “Konkola East” and “Kafwira”) characterized as belonging to the Ore
Shale-hosted Cu-Co style of mineralization. The Konkola East target is currently being investigated further
with diamond drilling to confirm the existence of Copperbelt stratigraphy and drilling the first of four
sequential holes at the Konkola East target area commenced in mid-March 2011. As at the end of July the
first hole has yet to be bottomed due to limitations of the drilling rods being used. The driller has arranged
for suitable replacement rods and the hole will be completed with these new rods once they arrive on site.
The second hole has been completed, and the third hole is being drilled and should be completed by the end
of August. This initial drilling program is expected to be completed early in the 4
th quarter and the
conclusions arising from this initial drilling program will be communicated during the 4th quarter once all
the results have been evaluated. Thereafter, depending on the results of this initial drilling program on
Konkola East, drilling will continue on at Konkola East or on the Kafwira area and possibly on an
additional, but similar, target we have recently defined.

13
6.2 Gold: Zimbabwe
The Corporation’s primary exploration activities in Zimbabwe are at the Blanket Mine, which are discussed
in section 5.6 (Lima Haulage) Other than at Blanket itself, Blanket’s current exploration title holdings in
the form of registered mining claims in the Gwanda Greenstone Belt total 78 claims, including a small
number under option, covering an area of about 2,500 hectares. Blanket’s main exploration efforts on its
satellite properties continue to be focused at this stage on the GG prospect and the Mascot Project Area,
which are believed to have the greatest potential of success and which are both within easy and economic
trucking distance of the Blanket plant.
Drilling programs were carried out at GG over the past 5 years. Thirteen diamond cored holes were drilled
amounting to 2,336 meters of drilling. Two zones of potentially economic gold mineralization have been
established down to a depth of approximately 200 m. A prospect shaft has been sunk down to the first level
as a first step to exposing the mineralization. Once the ZESA substation has been established which ZESA
expects to have completed by early 2012 the deepening of the existing prospect shaft can be accelerated and
underground development on the first and second levels will be advanced to expose the extent of the
mineralization and to facilitate evaluation, sampling and mine planning. Depending on the successful
outcome of exploration work, production could be trucked to the Blanket plant for processing as the plant
has existing surplus capacity.
The Mascot Project Area comprises three existing shafts (Mascot, Penzance and Eagle Vulture) each of
which extend down to depths of up to 450 meters and other infrastructure, much of which is in need of
extensive rehabilitation. Each of these shafts operated until the mid-1960’s after which production ceased
due to the increasing political difficulties at that time and the limitations of the technology that was then
available. Blanket management believes that the application of modern exploration and processing
techniques may allow some or all of these shafts to operate profitably on a sustainable basis, and not just at
the prevailing high gold price. The rehabilitation and installation of infrastructure at Mascot and Eagle
Vulture mines continues although work at Mascot has been delayed by the failure of ZESA to provide a
connection to the electricity grid. ZESA expects to complete this connection by early 2012. Depending on
the outcome of exploration work, production could be trucked to the Blanket plant for processing as the
plant has existing surplus capacity.
The rate of investment at GG and the Mascot Project Area has been reduced pending clarification of the
intentions of the government of Zimbabwe regarding Blanket’s indigenization obligations and concluding
an agreement with ZESA regarding the equipment costs and the time they require to construct the power
lines.
6.3 PGE/Ni/Cu: Rooipoort and Mapochsgronde (including Grasvally) - South Africa
An application in terms of the provisions of the applicable Act is in progress to treat the 5 adjoining
prospecting rights at Rooipoort as a single right and to extend the period of this consolidated right for a
further three years. The prospecting rights granted to the Corporation to prospect for Platinum Group
Elements (PGE’s) on the major portions of the Mapochsgronde tribal trust land are currently in the process
of registration. A further application has been made for an adjoining property to the north of the rights
granted above. The Corporation is awaiting the issue of the prospecting right.
Activities at Rooipoort/Mapochs properties were suspended during 2010 due to the continued complete
lack of progress on the part of the South African Department of Mineral Resources in registering the
licence areas in the names of Caledonia’s local subsidiaries. Without secure title transfers the Company
does not wish to expend further funds on these properties until the tenure matter has been satisfactorily
resolved, after which a revised exploration budget can be compiled and presented to the Board for its
consideration.

14
7. INVESTING
During 2nd
quarter 2011 Caledonia invested $1,648,000 ($2,362,000 – 2010) in capital assets and mineral
properties. Of the amount invested in 2011, $612,000 ($147,000 – 2010) was spent at Nama and
$1,036,000 ($2,200,000 – 2010) at Blanket.
8. FINANCING
Caledonia financed its operations using funds on hand and those generated by its operations. No equity
fund raising is currently planned during 2011. Blanket’s US$2.5 million loan facility from its bankers in
Zimbabwe fell due for repayment on July 30, 2011. Subject to acceptable terms and conditions being
offered, Blanket is seeking a further renewal of this facility, and at the end of the 2nd
quarter, $2,421,000
($2, 355,000 – 2010) was owed by Blanket on this overdraft. The majority of the increase in the overdraft is
as a result of the timing of the 2nd
quarter income tax payment in Zimbabwe.
The remaining three diesel generators which were commissioned in the 2nd
quarter have been funded by the
supplier. It is planned that all outstanding amounts in respect of these generators will be paid before the end
of 2011.
9. LIQUIDITY AND CAPITAL RESOURCES
As of June 30, 2011, Caledonia had a working capital surplus of $4,268,000 ($2,261,000 – March 2011).
Current assets, particularly trade receivables, increased significantly during the quarter reflecting the
increased level of trading activity at Blanket. Short term borrowings from Blanket’s Zimbabwean bankers
increased by $1,675,000 to $2,421,000, which is within the limit of that facility. As of June 30, 2011
Caledonia had potential liabilities for rehabilitation work on the Blanket and Eersteling Mines - if and when
those Mines are permanently closed - at an estimated cost of $1,878,000 ($1,919,000 – 2010).
10. OFF-BALANCE SHEET ARRANGEMENTS
There are no off balance sheet arrangements.
11. RELATED PARTY TRANSACTIONS
Caledonia had the following related party transactions:
Six months ended
June 30
2011 2010 2009
$’000 $’000 $’000
Management fees, and expense allowances paid or accrued to a
company which provides the services of the Corporation’s
President
315 276 281
Rent paid to a Company owned by members of the President’s
family 25 27 23
Legal fees paid to a law firm where a Director is a partner 48 12 41
12. CRITICAL ACCOUNTING POLICIES
The major areas where accounting estimates are made are asset impairment, asset retirement obligations
and future tax liabilities. As significant impairment provisions have already been made against the assets

15
and there is a reasonable level of certainty around the estimate it is considered unlikely that any change in
estimate would result in a material impact on the results of Caledonia. The asset retirement obligations are
also considered to be estimated with a reasonable degree of certainty, although the original estimations
were calculated some years ago. The asset retirement obligations estimation for Blanket was recalculated
before December 31, 2010. The estimations are accreted annually at rates between 1.7% and 5% and thus
any change in circumstances is considered unlikely to have a material impact on the results of Caledonia or
its operations.
There have been no accounting policy changes adopted since January 1, 2010, except for IFRS.
12.1. Adoption of Accounting Standards and Pronouncements under IFRS
The Company’s first financial statements prepared under IFRS are the interim financial statements for the
three months ended March 31, 2011, which includes full disclosure of its new IFRS policies in Note 3 to
these financial statements. These financial statements also include reconciliations of the previously
disclosed comparative periods financial statements prepared in accordance with Canadian generally
accepted accounting principles (“GAAP”) to IFRS as set out in Note 22.
The most significant effect of the transition to IFRS is the increase in the carrying value of the fixed assets
at the transition date. As Caledonia adopted IFRS after its subsidiary companies it has to report the assets
and liabilities at the values shown at subsidiary level. The increase in fixed asset values is mainly
attributable to the inclusion of the Blanket Mine fixed assets at their IFRS deemed cost which resulted in an
increase of $13.9 million with corresponding reductions in Eersteling and Zambia on exploration
properties.
The increase in the deemed cost for Blanket Mine also resulted in an annual increase in the amortization
charge of approximately $1.5 million.
13. SECURITIES OUTSTANDING
As at August 8, 2011 the following securities were outstanding:
(1) 500,549,280 common shares issued;
(1) Options and warrants as follows:
Number Description Exercise
Price Expiry Date
26,080,000 Common share purchase
options $0.07 Various until May 11, 2016
16,460,000 Common share purchase
options $0.13 January 31, 2016
As Caledonia’s Option Plan allows the granting of options on a number of shares equal to 10% of the
issued shares, Caledonia could grant options on a further 7,514,928 shares.
14. CONTROLS
Disclosure controls and procedures are designed to provide reasonable assurance that all relevant
information is gathered and reported to senior management, including the Corporation's President and Chief
Financial Officer, on a timely basis so that appropriate decisions can be made regarding public disclosure.
Management of the Corporation, with the participation of the Chief Executive Officer and the Chief
Financial Officer, have evaluated the effectiveness of the Corporation's disclosure controls and procedures

16
as at December 31, 2010 as required by Canadian securities laws pursuant to the certification requirements
of Multilateral Instrument 52-109.
The Corporation's internal controls over financial reporting (“ICFR”) are intended to provide reasonable
assurance regarding the reliability of financial reporting and the preparation of financial statements for
external purposes in accordance with applicable Canadian GAAP.
Because of its inherent limitations, the Corporation's ICFR may not prevent or detect any or all
misstatements. Also, projections of any evaluation of effectiveness to future periods are subject to the risk
that controls may become inadequate because of changes in conditions, or that the degree of compliance
with the policies or procedures may deteriorate.
The Corporation previously engaged independent consultants to carry out an assessment of the
effectiveness of its internal controls over financial reporting using an internationally acceptable framework.
Prior to this engagement, management concluded that the following disclosable material weaknesses
existed and still exist as at June 30, 2011.
Segregation of duties
Prior to the end of 2009, due to limited personnel resources at the Corporation’s Africa office in
Johannesburg, adequate segregation of duties within the accounting group was not achieved. This created a
risk that inaccurate entries could be made and not identified or corrected on a timely basis. The result is
that the Corporation was highly reliant on the performance of mitigating procedures during its financial
close processes in order to ensure the financial statements present fairly in all material respects. The
Corporation continued to enhance and monitor this process to ensure that its financial accounting reporting
system was able to prevent and detect potentially significant errors.
As a consequence of the above, an additional accounting member of staff was recruited in November 2009
to the Corporation’s Africa office in Johannesburg. This has improved but not entirely eliminated the
segregation of duties and lightened the work load of existing staff and improved control of the accounting
function.
Management has concluded, and the Audit Committee has agreed that taking into account the present stage
of the Corporation’s development, the Corporation does not have sufficient size and scale or requirement to
warrant the hiring of additional staff to correct further segregation of duties weakness at this time. There
have been no changes in the Corporation’s internal controls over financial reporting since the year ended
December 31, 2010 that have materially affected, or are reasonably likely to materially affect, its internal
controls over financial reporting.
The Corporation has a Disclosure Committee consisting of three Directors, and has disclosure controls and
procedures which it follows in an attempt to ensure that it complies with all required disclosures on an
adequate and timely basis. The Corporation’s Directors and Management, and the Disclosure Committee,
are making all reasonable efforts to ensure that the Corporation’s disclosures are made in full compliance
with all of the applicable rules, regulations and requirements. All reasonable efforts are also being made to
ensure that the Corporation’s disclosure controls and procedures provide reasonable assurance that material
information relating to the Corporation, including its consolidated subsidiaries, is made known to the
Corporation’s Certifying Officers by others within those entities.
15. QUALIFIED PERSONS
Dr. Trevor Pearton, BSc Eng. (Mining Geology), PhD (Geology) FGSSA, VP Exploration is the
Corporation’s qualified person as defined by NI 43-101. Dr. Pearton is responsible for the technical
information provided on this MD&A except where otherwise stated.


