
The University of Manchester Research
On the attractiveness of product recovery: The forces thatshape reverse marketsDOI:10.1111/jiec.12473
Document VersionAccepted author manuscript
Link to publication record in Manchester Research Explorer
Citation for published version (APA):Stindt, D., Quariguasi Frota Neto, J., Nuss, C., Dirr, M., Jakowczyk, M., Gibson, A., & Tuma , A. (2016). On theattractiveness of product recovery: The forces that shape reverse markets. Journal of Industrial Ecology.https://doi.org/10.1111/jiec.12473
Published in:Journal of Industrial Ecology
Citing this paperPlease note that where the full-text provided on Manchester Research Explorer is the Author Accepted Manuscriptor Proof version this may differ from the final Published version. If citing, it is advised that you check and use thepublisher's definitive version.
General rightsCopyright and moral rights for the publications made accessible in the Research Explorer are retained by theauthors and/or other copyright owners and it is a condition of accessing publications that users recognise andabide by the legal requirements associated with these rights.
Takedown policyIf you believe that this document breaches copyright please refer to the University of Manchester’s TakedownProcedures [http://man.ac.uk/04Y6Bo] or contact [email protected] providingrelevant details, so we can investigate your claim.
Download date:12. Dec. 2021

1
On the attractiveness of product recovery:
The forces that shape reverse markets
Abstract Product recovery is a major contributor for implementing sustainable business practices. Within
such operations, which are either driven by legislation or economic rationales, practitioners face
strategic issues concerning reverse market entry and positioning. Although the complexity of
acting on reverse markets is widely acknowledged, a comprehensive framework to facilitate
decision-making in this area is lacking. In an attempt to fill that gap, we develop a model that
supports Original Equipment Manufacturers’ (OEMs’) assessment of the attractiveness of
reverse markets. We identify, from a comprehensive literature analysis, in-depth interviews, and
engagement with a dozen companies from different countries, factors that influence key
characteristics of reverse markets, and consolidate this lengthy list into a comprehensive model
intuitively applicable to business practice. The model combines five forces that drive reverse
markets: Access to recoverable products, Threat of independent recovery companies’ (IRCs’)
market entry, Rivalry for recoverable products, Adverse effects on core business, and
Remarketing opportunities. We propose for each a set of attributes that influences its power and
direction. To demonstrate the efficacy of the model, we apply it in two industry settings,
recovery of white goods in the United Kingdom and paper recycling in Germany. The present
research enables OEMs to understand the structure and forces that drive reverse markets, identify
levers to influence those markets, anticipate market developments, and formulate resilient
strategies for product recovery.
Keywords: Reverse logistics; Closed-loop supply chain management; Strategy development;
Market analysis; Sustainability; Case studies

2
<heading level 1> Introduction Product take-back and recovery have been shown, in numerous implementations of
sustainable business operations, to generate significant revenue streams (Maslennikova and
Foley 2000). Original Equipment Manufacturers (OEMs) that extend their core business through
product recovery operations are usually seeking either to generate profits from replacement of
primary inputs (recycling, retrieval) or to enter new market segments with reprocessed products
(reuse, remanufacturing, refurbishing) (Stindt and Sahamie 2014). On the downside, product
backflows increase the complexity of supply chains (Kapetanopoulou and Tagaras 2011), posing
management challenges associated with, among other things, acquisition of collectable goods in
sufficient volume and of suitable quality, peculiarities of the secondary market, and interplay
with the marketing of new products (Nuss et al. 2015). The uncertainties that attend such
considerations frequently discourage OEMs’ active involvement in markets for recoverable
goods, which we term reverse markets.
Informed decision-making on the part of OEMs regarding entry and repositioning in
reverse markets would benefit greatly from a structured assessment of the attractiveness of
reverse markets, yet prior research has paid scant attention to the development of relevant
models. Absence of this knowledge is posited as one reason “many companies are unwilling to
enter the reverse logistics” arena (Krumwiede and Sheu 2002, 325) and thus miss profitable
business opportunities (Geyer and Jackson 2004) that could enhance their competitiveness
(Toffel 2003).
The present article attempts to fill this knowledge gap by systematically identifying,
analyzing, and integrating, from the perspective of the OEM, the forces that shape the
attractiveness of reverse markets. This research is informed by existing literature and by
interviews and information gathered in industry projects conducted over the past decade

3
involving a dozen companies in diverse industry sectors located in different countries. The
fundamental strategic decisions being evaluated are whether an OEM should generally engage in
product recovery and how it should position itself on respective reverse markets. These decisions
are strongly connected to the attractiveness of a reverse market, which in turn is a function of
influencing factors that shape these markets. The research process was guided throughout by the
following research question:
How can an OEM evaluate the attractiveness of a reverse market to support strategic
decision-making?
Specifically:
Question 1 (Q1): What factors influence the attractiveness of a reverse market?
Question 2 (Q2): How can these factors be integrated into a comprehensive model?
Question 3 (Q3): How can such a model be integrated into a strategic decision-making
process that considers both market knowledge and corporate capabilities?
These questions, which drove our development of what we have termed the “Reverse
Five Forces” (R5F) model for assessing the attractiveness of reverse markets, are addressed
successively in the article. The factors (Q1) are identified at the beginning of the section headed
“Forces in Reverse Markets” and are subsequently developed into the R5F model (Q2) in the
remainder of that section. The model’s value for strategic decision-making with respect to
reverse market positioning is demonstrated in the section headed “Empirical Validation: Case
Studies,” and insights into its integration into a holistic corporate decision-making process
4
informed by a thorough understanding of target markets and corporate capabilities (Q3) related
in the section headed “Discussion.”
<heading level 1> Assessing the Attractiveness of Reverse Markets – Review and Outlook A well-established model for analyzing the attractiveness of markets in the traditional
“forward-oriented” supply chain exists. “Porter’s Five Forces” model (Porter 1979; Porter 2008)
characterizes a market’s attractiveness in terms of five forces—threat of new entrants, threat of
substitute products or services, rivalry among existing competitors, bargaining power of
suppliers, and bargaining power of buyers—that can be further subdivided into different factors.
This model can help a company match core competencies and capabilities with market
characteristics to reveal business opportunities and lay the foundation for strategic (re-)
positioning as well as generate insights into how these forces can be influenced to actively
reshape the market. But although widely accepted for traditional markets, the model cannot be
directly applied to markets for recoverable products, as we explain below.
Within a closed-loop supply chain (CLSC) system, supplier, primary, and secondary
markets are all perceived as traditional markets that follow similar principles (figure 1). Reverse
markets exhibit substantially different characteristics (Wu and Cheng 2006), as shown below
(see also table 1).
--------------------------------------Insert figure 1 approximately here--------------------------------------
In reverse markets, both business-to-business (B2B) and business-to-consumer (B2C)
customers offer recoverable goods, such as end-of-use products, to recovery companies,
including OEMs and independent recovery companies (IRCs). The actors’ roles are thus
reversed, the consumers of traditional markets becoming suppliers to corporations, which
effectively become the consumers. In contrast to traditional supply chains, however, consumers
5
do not perceive themselves as suppliers and often do not actively participate in such markets.
This presents increased difficulties for OEMs with regard to both identification of potential
suppliers and relationship management in the reverse market. Common procurement measures
like contracting are hardly applicable in reverse markets characterized by large numbers of
diversified suppliers, few demanding actors (Fleischmann et al. 2000), and limited goods
availability. Moreover, “[t]he collection of goods from the marketplace is a supply-driven flow,
rather than a demand-driven flow” (Guide et al. 2000, 137), the quality of returned products is
non-uniform, mostly unknown, and dependent on both initial product design and utilization
patterns, and some obsolete products do not enter the market at all due to dissipations such as
export or improper disposal. As well, the definition of market scope differs. Traditional markets
are commonly defined by a distinct function provided with specific products. For instance, the
market for portable music entertainment comprises all devices that satisfy the respective demand
of customers, including MP3 players, smartphones, and iPods. In this sense, traditional markets
are functionality- or customer-oriented. Contrastingly, reverse markets are defined by the focal
product or material that is targeted for recovery. A metal smelting company may choose a broad
market definition that encompasses all materials that contain significant amounts of steel, while a
computer OEM may consider a much smaller market focusing on its own end-of-life products.
--------------------------------------Insert table 1 approximately here--------------------------------------
These differences in key characteristics between traditional and reverse markets lead us
to conclude that models for assessing the former, especially Porter’s Five Forces, will be more
useful for OEMs considering product take-back if tailored to the reverse market. Nor do specific
models exist, prior research on strategic decision-making in product recovery having focused
almost exclusively on frameworks that support company-specific analyses (e.g., de Brito and

6
Dekker 2004; Geyer and Jackson 2004; Nuss et al. 2015; Subramoniam et al. 2010), and the
broader field of sustainable supply chain management as well being devoid of models or
frameworks that address the focal challenge (Brandenburg et al. 2014; Carter and Easton 2011;
Carter and Rogers 2008; Seuring and Müller 2008). To the best of our knowledge, the only
attempt to evaluate the profitability of remanufacturing industries is presented in a book chapter
by Ferguson et al. (2010). The authors list a set of descriptive categories motivated by three
existing frameworks including Porter’s Five Forces. We extend previous research in developing,
from close examination of what constitutes and shapes reverse markets, a tool, amenable to
integration in OEMs’ corporate decision-making processes, for making structured assessments of
forces that shape such markets.
<heading level 1> Methodological Approach Our exploratory research follows an inductive approach that progresses through three
stages (figure 2). We ensure academic rigor in the first and second stages by applying Strauss
and Corbin’s (1990) proposed methodology for qualitative research, which requires open, axial,
and selective coding of information.
--------------------------------------Insert figure 2 approximately here--------------------------------------
The first stage involves two parallel analyses that identify relevant factors that influence
the attractiveness of a reverse market. We review the literature on obstacles to, and drivers and
dynamics of, reverse markets. For this purpose an archival research (Searcy and Mentzer 2003)
following the structured approach presented by vom Brocke et al. (2009) is implemented. In a
first step, we conduct a keyword search in Google Scholar and Web of Science limited to peer-
reviewed management science journals. The initial selection process encompasses a review of
title and abstract. Afterwards, a content analysis was conducted with at least two of the involved
7
researchers evaluating each article. In parallel, we adopt a mix of case study approach, using the
interview method, and action research. This way, we combine what Coughlan and Coghlan
(2002) define as research ‘in action’ with research ‘about’ action. We employed theoretical
sampling to select studies that span multiple types of reverse market players that differ with
respect to industry sector, organizational structure, and business model. The rationale for such an
approach is to strengthen the validity of the findings, as asserted in Voss et al. (2002) and Boyer
and Swink (2008). It is worth noting that our approach is qualitative in nature, as defined by
Ketokivi and Choi (2014), i.e. our intention is not to quantify each of the forces described in this
paper, but rather to outline the factors that affect the attractiveness of the reverse market.
The first source of industry experience involved four, 4- to 16-month projects,
transformational in nature, in which at least one of the authors participated. Eight semi-structured
interviews with corporate decision-makers involved in product recovery comprised the second
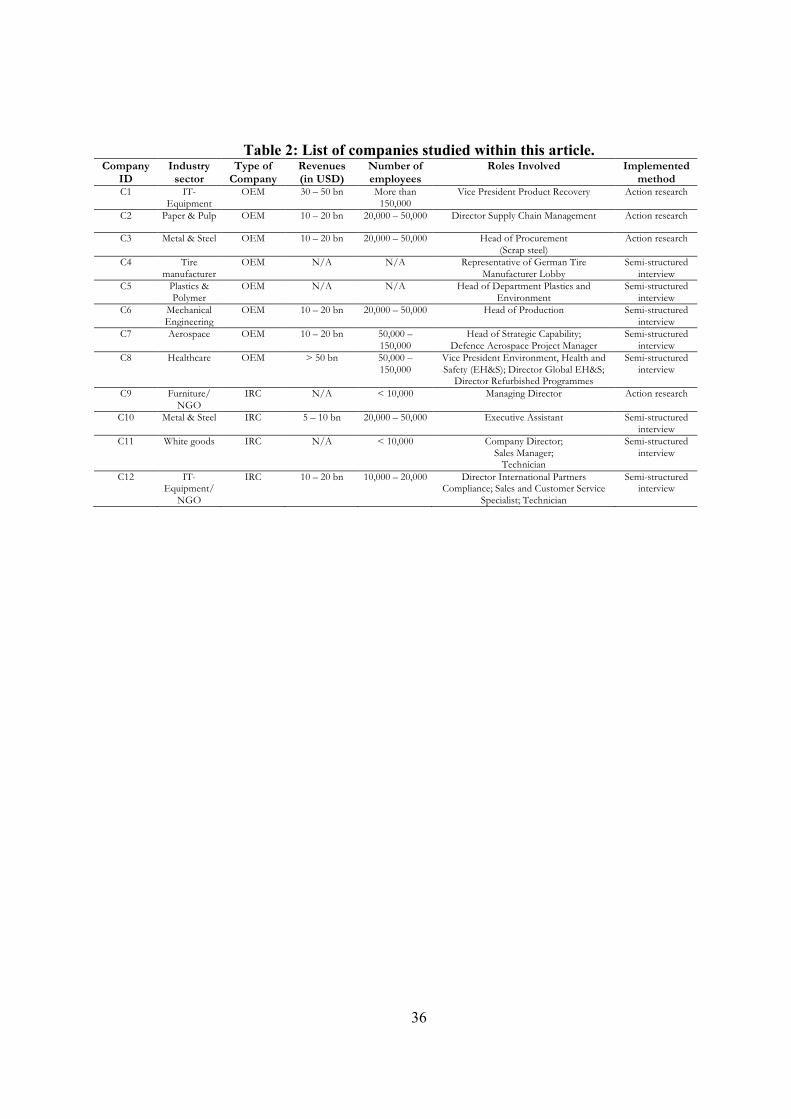
source. The 12 companies from which we drew experience were divided between OEMs (8) and
IRCs (4), the latter included because they provide perspectives on reverse markets that are
relevant but commonly not recognized by the former. An anonymized overview of the
participant companies along with key information, involved roles and implemented method is
provided in table 2.
--------------------------------------Insert table 2 approximately here--------------------------------------
Having compiled the factors identified in the literature and case studies (open coding), we
commenced the second stage of developing the model, through consolidation of the insights
generated. We first classified, after eliminating redundant and merging similar, factors into
logical groups that affect similar areas of reverse markets (axial coding). We then developed a

8
two-level hierarchical order to represent interrelations between these factors (selective coding),
the top level, the forces that shape the market, the lower level the underlying attributes.
Validation of the R5F model through observational field cases in two reverse markets,
white goods and paper and pulp, was performed in the third stage.
We accounted for both scientific and multiple case perspectives to assure the
development of a generalizable model adaptable to manifold applications, and employed an
international and interdisciplinary research team in order to account for common patterns across
industry sectors, business models, and regional peculiarities.
<heading level 1> Forces in Reverse Markets We elaborate here the first and second stages of our research methodology (figure 2).
Please note that our arguments are backed up by either prior research, our case studies and
industrial collaborations, or both. To improve readability, we refer to the companies as C1 to
C12 (table 2).
In the first stage, we identify factors that influence the attractiveness of reverse markets.
For this, we supplemented with industry insights and interviews analyses of frameworks for
company-specific strategic decision-making and further studies of CLSC decision-making that
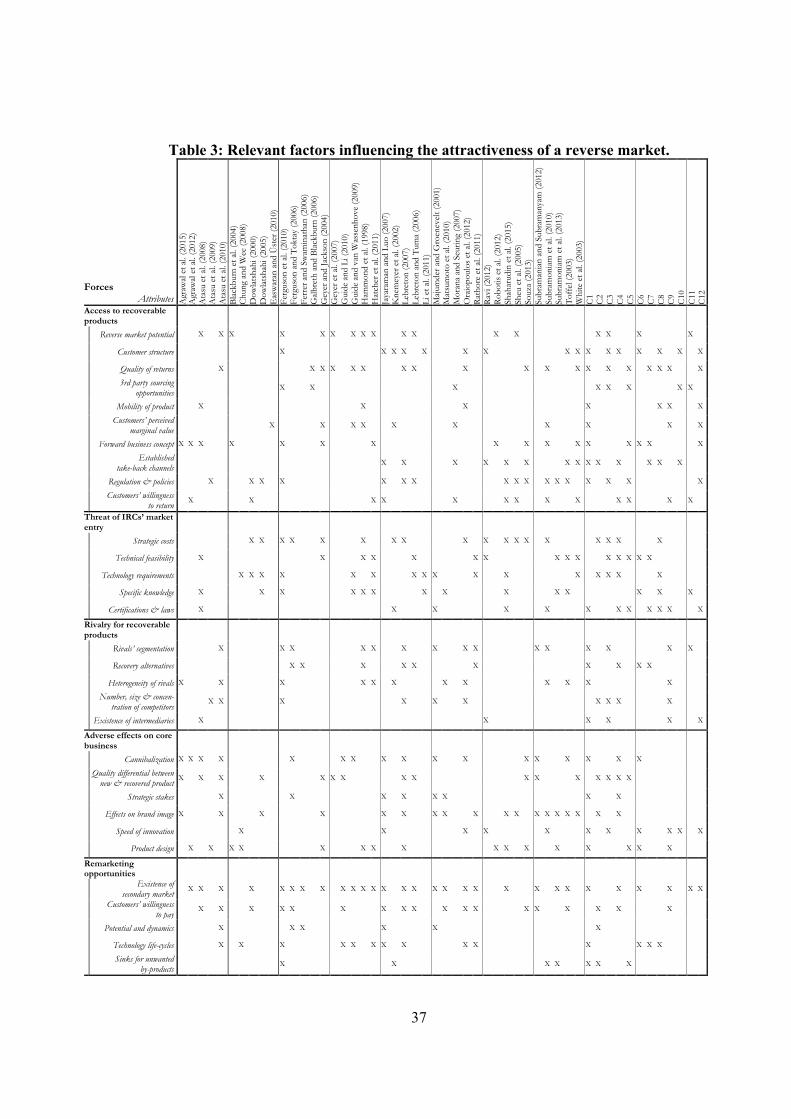
casually mention relevant factors. The lengthy list of factors generated by these activities yielded
the attributes we aggregated into the forces that shape reverse markets (table 3).
--------------------------------------Insert table 3 approximately here--------------------------------------
In the second step, we build on the insights gathered in the first stage and consolidate the
identified factors, which results in five forces—Access to recoverable products, Threat of IRCs’
market entry, Rivalry for recoverable product, Adverse effects on core business, and
Remarketing opportunities (figure 3)–as well as a set of subordinate attributes that determine the
9
power and direction of each force. We depict the influence of a particular force in a given
instance in terms of a positive or negative connector; for example, increasing threat of IRCs’
market entry reduces (a “minus” sign), access to an abundance of recoverable product increases
(a “plus” sign), the attractiveness of a reverse market. Descriptions of these forces, which in the
aggregate determine how attractive recovery of a given product or product group is from the
perspective of OEMs, are provided below.
--------------------------------------Insert figure 3 approximately here--------------------------------------
<heading level 2> Access to recoverable products The effort expended on the acquisition and collection of products by companies involved
in reverse markets is well documented (Matsumoto et al. 2010) and constitutes a critical issue
(Geyer and Jackson 2004; Jayaraman and Luo 2007; Ravi 2012), hence the importance of
identifying the factors that influence the accessibility of these products.
We designate as reverse market potential the total volume of end-of-life and end-of-use
goods in a market. This number represents the upper bound of products that is theoretically
collectable and can be approximated from a product’s lifecycle and average length of use (Geyer
et al. 2007). Long lifecycle products in a mature stage are likely to generate a steady flow of
recoverable goods, especially when the period of use is relatively short. The metal and steel
industry, for instance, obtains secondary raw material largely from the building and automotive
sectors, both extremely mature industries that generate a constant and predictable flow of
material that can be collected at any time (C3). We analyze below factors that influence the
reverse market potential.
10
Customer structure in the primary market exerts a major influence on ease of access to
goods (Li et al. 2011; White et al. 2003). The complexity of the collection process is reduced in
B2B, relative to B2C, segments because the former produce substantial quantities of recoverable
goods at fewer sites, thereby improving the ability to forecast the timing, quantity, and quality of
backflows and facilitating active management of the reverse market suppliers (Knemeyer et al.
2002; Lebreton and Tuma 2006). That service agreements are common accounts, in part, for this
circumstance (C7). Acquisition and backflow forecasting are perceived as less challenging for
products commonly bought by corporate customers (C6; C8). Although IT equipment as well as
scrap metal and steel are supplied by both the B2B and B2C segments, C1 and C10 rely mostly
on corporate customers to feed their reprocessing systems. Companies that rely on B2C segments
(C9) should expect to collect smaller fractions of reverse market potential.
Product design and degree of degradation as well as length and intensity of customer use
affect the quality of returns (Oraiopoulos et al. 2012; C1; C7). The influence of these factors
varies widely across customer segments. Some indemnification of supply risks is possible in the
presence of 3rd party sourcing opportunities interposed between recovery companies and the
customer segments (Galbreth and Blackburn 2006). Reverse markets for such commodities as
metals (C3; C10) and plastics (C5), and goods discarded to the municipal waste stream, rely
almost entirely on collection by 3rd parties.
Access to recoverable goods is also determined by the mobility of a product. Smaller,
lighter weight products facilitate handling and transportation, but dissipate through use (e.g.,
mobile phones), becoming difficult to trace and localize, which complicates supplier targeting
and product acquisition. Dissipation may accrue to trade among customers or improper disposal.

11
Lesser degrees of dissipation are observed for immobile products like server racks (C1) and
computer tomography scanners (C8).
Dissipation is also a factor in customers’ perceived marginal value of a recoverable
product (Morana and Seuring 2007). If, for example, marginal value is perceived to be higher
than actual market value, consumers are likely to offer end-of-life products to one another (C9),
negotiate with various demanding actors (C1), or simply store products at home (C12).
The dominant forward business concept of the involved OEMs may also affect reverse
market potential. Leasing contracts and product-service-systems, such as are observed in the
aerospace (C7) and mechanical engineering industries (C6) and IT sector (C1), limit the free
flow of goods in reverse markets. Equally important are established take-back channels, which
may be constituted by means of OEMs’ trade-in programs (C1; C6; C7) or public collection of
goods like WEEE or waste paper (C1; C2). Established take-back channels may limit the number
of products freely offered in reverse markets, even as they reduce transaction costs and generate
a steady flow of core for those involved. Further analysis of take-back channels may yield
insights relevant to the development of promising take-back concepts (Morana and Seuring
2007).
Regulation & policies have also been determined to “impact the amount of product
returns to a great extent” (Srivastava and Srivastava 2006, 534). As regulations, we refer here to
mandatory laws that may limit access to particular products for purposes of reprocessing or
constrain collection, as for reasons associated, for example, with toxicity (C1; C12). Policies are
somewhat less overt attempts to influence market patterns or alter the mindsets or behavior of
market actors (Tan et al. 2014). Policy initiatives may increase customers’ willingness to

12
return products, an example being “Dual system Germany” (www.gruener-punkt.de), a plastic
waste collection initiative that was successfully supported by an awareness campaign in schools
and using billboard advertisements, among other measures (C5). Customers’ willingness-to-
return product may also be positively influenced by (financial) incentives (Guide and Van
Wassenhove 2001).
<heading level 2> Threat of IRCs’ market entry This force summarizes factors on reverse markets that may serve as barriers to prevent a
future market entry of IRCs. Among these barriers is the need for a reverse network to support
implementation of reverse logistics activities, the development of which requires investment in
various assets (e.g., specific facilities and equipment) that “did not exist previously”
(Dowlatshahi 2005, 3459). Such strategic costs may be higher for IRCs, which typically lack a
forward-supply-chain-oriented infrastructure at least partly suitable for reverse logistics. As
“reverse distribution is not necessarily a symmetric picture of forward distribution”
(Fleischmann et al. 1997, 6), even OEMs face strategic costs in the form of investment in
specialized infrastructure. Such costs being subject to economies of scale, smaller actors
particularly experience this barrier. In process industries, for example, product recovery is almost
entirely the domain of OEMs (C2; C3; C5), related industries naturally having invested heavily
in equipment, and integration of secondary inputs into primary production being well
established.
The technical feasibility of product recovery is a fundamental consideration,
reprocessing of some goods being extremely complex or even impossible (e.g., breaking
chemical bonds). Recovery of carbon fiber composites, for example, is not possible in the
desired quality due to fiber length issues (C7), and gradual contamination of scrap with

13
undesired elements is a major problem in steel recycling (Geyer and Jackson 2004; C3).
Remanufacturing of some products is rendered financially unviable for IRCs by OEMs’
monopolistic price setting for spare parts (e.g., control boards) (C11).
Even for products for which recovery is technically feasible, high technology
requirements may pose a barrier to IRCs’ market entry (C2; C3; C5). This barrier mainly
depends on the ease of reprocessing (C8; C11). For instance, “[s]pecialist equipment is […]
required, especially for running diagnostics and testing of components” (Chapman et al. 2010,
42). Apart from equipment, product recovery may depend on product-related specific
knowledge including particulars of product composition and utilization and location of products
in use, and/or a specific skillset for inspection and reprocessing (Hammond et al. 1998). Lack of
the requisite skillset can render remanufacturing by IRCs virtually impossible (C8; C11). Large
complex products “often composed of tens of thousands of components and parts” pose a
“technical challenge” to recovery (Guide and Van Wassenhove 2009, 13). OEMs not only enjoy
an information advantage over IRCs with respect to recovering certain products (Ferguson and
Browne 2001), but may also incorporate features specifically designed to deter third party
remanufacturing (Hammond et al. 1998; Majumder and Groenevelt 2001).
Entry to reverse markets can also be impeded by framework conditions in the form of
certifications & laws. Disposal of products containing noxious substances is often subject to
tight control and reprocessing limited to certified actors (C1; C7; C8). Certification may also
pose a barrier to entry in the sense that certified organizations tend to be trusted by consumers to
recover products in a way that satisfies the ecological and societal zeitgeist (C9). A similar effect
is observable in the IT industry, consumers, owing to data security issues, preferring to surrender
post-use equipment to trusted market players that guarantee data deletion (C1).
14
<heading level 2> Rivalry for recoverable products Rivalry aims to assess the status-quo competitive structure in existing branches. In
traditional markets, rival companies offer the same or similar products or services to the same
markets (Carpenter and Sanders 2007). Understanding rivalry is less easy in reverse markets,
market players not being clear-cut and commonly more heterogeneous. Rivalry in reverse
markets centers on demand for the same kind of recoverable product (Knemeyer et al. 2002), and
rivals can include OEMs, IRCs, waste brokers, non-governmental organizations (NGOs), and
second-hand trading businesses, many of which, not being active in primary markets, are
frequently overlooked by executives used to forward-supply-chain-oriented analyses.
Assessment of rivalry must thus begin with a thorough, differentiated analysis of a
multiplicity of actors that employ different business models. Rivals’ segmentation can be
determined by analyzing their business models. An evaluation of the overall market for purposes
of market positioning is necessarily informed by an in-depth understanding of its segments, the
aims and scope of the players in each, and segment-specific competitive situations. Rivalry
among OEMs may be driven by take-back legislation. Collective take-back schemes tend to
increase competition, individual take-back by OEMs to result in monopolistic structures (Atasu
and Subramanian 2012). Rivalry is thus expected to increase more consequent to the
involvement of other OEMs than to that of other types of players (Ferguson and Toktay 2006).
Because IRCs and brokers collecting computers, among other goods, for purposes of retrieving
and trading valuable materials like copper and silver also constitute competition (Hatcher et al.
2011), other computer manufacturers must not be considered the only rivals (C1). Brokers
acquire for direct reuse a significant fraction of the functional cores available in the reverse
market, and various non-profit organizations (e.g., Create UK) are also involved in electronics

15
recovery. More familiar, perhaps, is charity organizations’ collection of used textiles and
furniture (C9). A significant portion of backflows may enter non-structured sinks that, albeit not
classified as rivals, should nevertheless be considered (e.g., municipal solid waste streams and
landfills and other forms of dissipation).
Development of segments and business models is influenced by the availability of
recovery alternatives. The desired quality and composition of backflows differs with the
recovery alternative represented by each segment. The quality level sought by OEMs primarily
interested in equipment at least partly functional to be remanufactured or used as a source of
components (C1; C6; C7), for example, differs from that which is acceptable to recycling-
oriented actors (C3; C5). Pure trading companies, on the other hand, collect almost exclusively
reusable cores. Degree of rivalry may thus differ across quality levels.
Diversity among the actors that originate reverse market demand, referred to as the
heterogeneity of rivals, may reduce market attractiveness by inducing greater effort with respect
to monitoring competitors’ actions and posing challenges with respect to projecting rivals’
strategic moves (C1; C9). A qualitative understanding of rival segments and patterns must thus
be supplemented with quantitative information including the number, size & concentration of
competitors within each segment (C2; C3; C9).
Competitive structure may also be influenced significantly by the existence of
intermediaries that may accumulate large quantities of recoverable items (C2; C3; C4). Brokers
and public waste collection institutions that offer product on the reverse market tend to prefer
business partners of considerable size that procure large quantities of diverse quality, rendering
the market most attractive to OEMs.
16
<heading level 2> Adverse effects on core business The interplay between primary and secondary products may affect the collection,
recovery, and remarketing of recovered products and resources, and product recovery influence
aspects of primary production and sales in primary markets. A major influence on sales of
primary products is referred to as cannibalization (Guide and Li 2010; Atasu et al. 2010).
Cannibalizing primary product sales diminishes reverse market attractiveness from the
perspective of OEMs. The perceived quality differential between new & recovered product
determines the extent of cannibalization. If the differential is marginal, reprocessed products are
seen as perfect substitutes and cannibalization is not a concern if, and only if, product returns are
collected exclusively by OEMs and customers cannot distinguish between the primary and
reprocessed product (Atasu et al. 2010). Cannibalization becomes a problem when OEMs
recover and remarket used product that is distinguishable from the primary product, which
decreases customers’ willingness to pay for the latter (Agrawal et al. 2012), and when recovered
goods offered on the secondary market by IRCs decrease OEMs’ primary sales. In the former
case, the resale must be balanced with the cannibalization effect (Oraiopoulos et al. 2012), in the
latter, strategic stakes as well as profitability may play a major role, as an “OEM may choose to
remanufacture for the sole purpose of discouraging an external firm from doing so” (Ferguson
and Toktay 2006, 361). In fact, the impetus for product recovery by companies active in an
industry is often prevention of third-party acquisition of technology and market share (C1; C8).
Product recovery’s effects on brand image must also be taken into account. Using
recovered inputs can benefit OEMs by contributing to a positive green image (C2); those that
neglect product recovery may even “seriously jeopardize their brand image and reputation”
(Jayaraman and Luo 2007, 56). In some industries, however, product recovery can have an
17
opposite, negative effect on brand image and is scrupulously avoided by OEMs. Customers’
perception that use of remanufactured components may compromise brand quality has been
observed, for example, in the healthcare and automotive (C4; C8). Product recovery may incur
additional operational risks as well as, for example, with respect to the earlier referenced issue of
data security in the recovery of computers (C1).
Decisions that impinge on primary products may also affect product recovery. With
respect to speed of innovation, for example, less frequent innovation in a primary product
increases the time frame during which recovered product can be remarketed (C2; C3; C10), and
vice versa (C1; C12). Product recovery also has implications for product design. Although
products are “typically not designed for end-of-life value recovery” (Geyer and Jackson 2004,
59), considering recovery issues during a product’s design-phase may “significantly
influence[…] the cost of disassembly, component inspection and repair, remanufacturing and
recycling” (Chung and Wee 2008, 528). Planned obsolescence, notwithstanding its negative
effects on consumers and the environment, as a design strategy can secure a steady flow of cores.
<heading level 2> Remarketing opportunities
Because companies’ voluntary participation in product recovery hinges on the profit
potential of remarketing (Quariguasi Frota Neto and Van Wassenhove 2013), the existence of a
secondary market is essential. Secondary markets can be internal, involving substitution of
recovered for primary inputs and generation of spare parts (Toffel 2003), as in the aerospace
sector, in which use of recovered components enables primary product to be maintained without
diverting manufacturing capabilities to spare parts production (C7), or external, in which
recovered products are offered on external secondary markets. The existence of such markets
depends on quality of reprocessed goods, cost structure, and price, among other factors.

18
Customers’ willingness to pay depends on customers’ perception of the value of a
recovered good. Products composed of recycled metals and plastics, for example, are often
indistinguishable from new products (C3; C5), whereas other recovered products are perceived
to be of lower quality (Geyer and Jackson 2004; Guide and Li 2010; Harms and Linton 2015;
C4). Willingness to pay for recycled commodities is largely determined by raw material prices
(Rathore et al. 2011; C10). Subramanian and Subramanyam (2012), Quariguasi Frota Neto et al.
(2016) and Pang et al. (2015) conducted empirical studies of price differentials between new and
recovered products based on eBay data, and Quariguasi Frota Neto and Bloemhof (2012, 102)
conclude that, for mobile phones and personal computers, willingness to pay “is a function of the
prices of the corresponding new products at launch, and years elapsed between launch and
remanufacturing.” Abbey et al. (2015a) and Abbey et al. (2015b) showed that for certain
products consumers would not be willing to purchase a remanufactured product, regardless of the
levels of discounting. Customer segment can also influence customers’ willingness to pay (Ferrer
and Ayres 2000). All else being equal, business customers’ focus on functionality leads them to
act more rationally and, as a result, to be more likely to buy reprocessed products (Lebreton and
Tuma 2006). For example, although remanufactured tires can be as-good-as-new, private
consumers tend to perceive them to be of lower quality and exhibit an unwillingness to pay a
price close to that for newly manufactured product, whereas business customers (e.g., truck
operators and airlines) are willing to pay near new tire prices for remanufactured product (C4).
Other aspects such as risk perception levels (Hamzaoui-Essoussi and Linton 2014), pricing
strategies (Ovchinnikov 2011), and consumer knowledge (Wang and Hazen 2015) were also
reported to affect willingness to pay.
19
Many secondary markets not yet being fully developed, their potential and dynamics
warrant consideration. Market size and growth rate must be projected as well as secondary
market potential including consumer sensitivity to new technologies in connection with
innovation (Rathore et al. 2011). Technology life-cycles may also afford opportunities for
remarketing secondary products. Although former technologies often become obsolete and are
no longer offered on the primary market as new technologies are introduced, specific customer
groups (‘laggards’), antithetical to adopting new technologies or unable to do so owing to
incompatibility with existing system infrastructure (e.g., VHS or cassette recorders) may demand
older product. Spare parts for long-lasting products like automobiles, aircraft, and manufacturing
equipment are similarly demanded long after production of the primary product has ceased (C6;
C7; C8). Short technology lifecycles not surprisingly may significantly diminish customer
willingness to pay for reprocessed product.
Because they also influence costs, sinks for unwanted by-products, which may
represent a significant part of overall backflow, also warrant examination. Unwanted products
include non-focal product types, focal product types that do not satisfy quality requirements, and
by-products generated by reprocessing (Knemeyer et al. 2002). The availability of appropriate
sinks can significantly influence the cost structure of recovery operations in either direction, by
adding costs (e.g., of dissipating toxic substances in CRTs; C1) or generating revenues (e.g.,
from the sale of cardboard; C2).
<heading level 1> Empirical Validation: Case Studies
We demonstrate the implementation and versatility of the R5F model by applying it to
two distinct markets. We analyzed the viability of white goods recovery for an OEM located in

20
the United Kingdom, and, for a large, global paper manufacturer in Germany, the market for
waste paper.
Application of the R5F to the reverse market for white goods reveals that it could be a
potentially attractive market for OEMs in the future, especially for those with high brand
recognition. Major challenges are the access to recoverable products and the adverse effects on
core business. Nevertheless, some levers are revealed that may help the OEM altering the reverse
market to its own advantage.
Application of the R5F to the reverse market for paper leads to the conclusion that it is
highly attractive for companies already involved in the primary business. One of the most
important points for this assessment are the considerable synergies that can be realized between
the primary and secondary manufacturing processes. These processes are not practically
distinguishable, which leads to another important point of very high entry barriers as a complete
set of primary manufacturing machinery is necessary to use secondary input material.
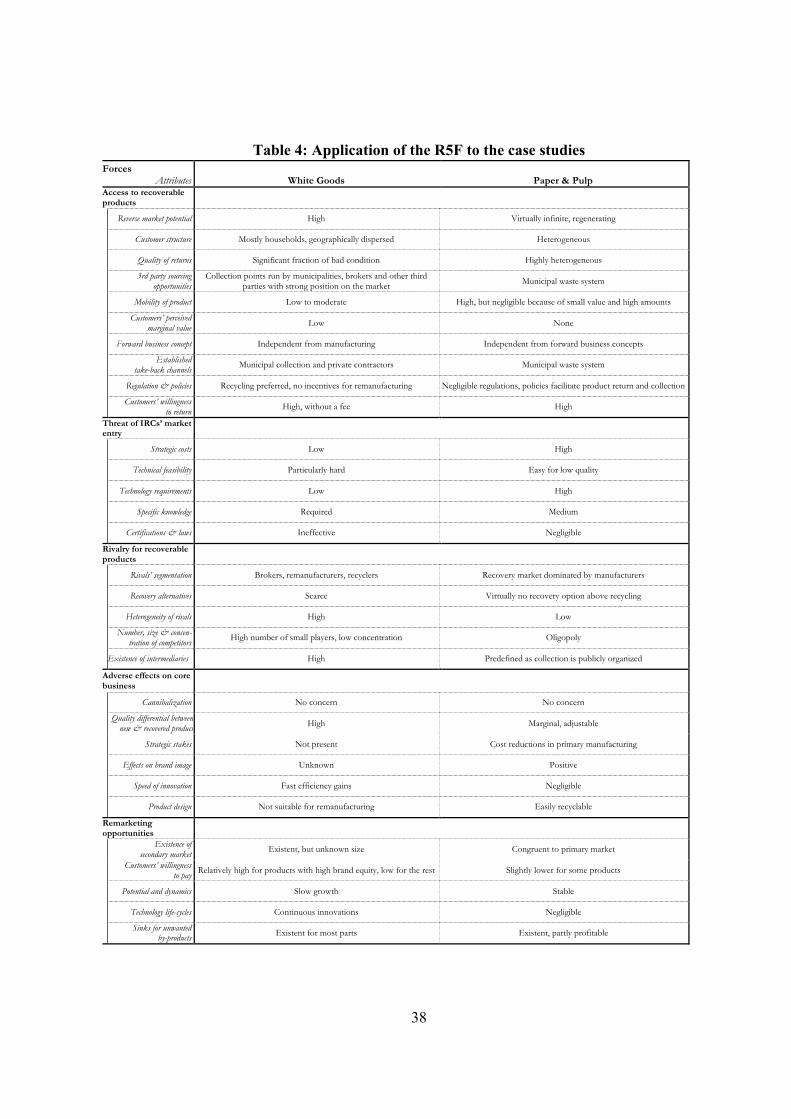
While table 4 gives a brief overview of the assessment of the according forces, detailed
descriptions of the cases are provided in the electronic appendix: www.insertlinkhere.com.
--------------------------------------Insert table 4 approximately here--------------------------------------
The case studies revealed the R5F model to be helpful in enabling corporate decision-
makers to derive a holistic picture, and thereby enhance their understanding, of all of the relevant
aspects of the respective markets.
<heading level 1> Discussion and limitations
The R5F model is a hands-on managerial tool that ensures that relevant market-shaping
factors are fully addressed in strategic decisions regarding market positioning. We demonstrate
in the cases how it can help OEMs develop a profound understanding of reverse markets. OEM
21
decision makers will find the model useful for identifying attractive and profitable segments of
reverse markets, detecting internal and external risks associated with product recovery,
evaluating potential market developments, and revealing levers that can be employed to
favorably re-shape a particular reverse market.
The model does not, however, address every aspect of strategic decision-making with
respect to product recovery. Although the forces that shape reverse markets are essentially the
same for all organizations, capabilities and resources vary across them, as the resource-based
view suggests (Wernerfelt, 1984). That means that the extent to which it is suitable to enter a
market will also vary across companies. Thus, besides market characteristics revealed by the
R5F model, company-specific characteristics must be considered. To revive results from the case
studies, OEMs for white goods with a positive brand reputation are likely to benefit from
entering the reverse market as customers’ willingness to pay is influenced by brand reputation. In
the case of paper manufacturing, primary production equipment and recycling equipment is
congruent and expensive. Hence, market entry requires either possession of primary production
equipment or substantial financial resources. Reverse market opportunities must be weighed
against corporate strengths and weaknesses to gauge a prospective market entrant’s position
relative to existing and potential future players. The R5F model thus constitutes a crucial part of
an extensive decision-making process that integrates reverse market analysis with a structured
evaluation of corporate capabilities. Integrating resources and capabilities is a natural extension
of the R5F model and an opportunity for future research. Helpful starting points for capability
analysis are articles on company-specific planning and decision-making, like Geyer and Jackson
(2004) and Nuss et al. (2015).
22
<heading level 1> Conclusion Product recovery, as a contributor to sustainable supply chains and, potentially, greater
profits, has captured the attention of decision-makers, politicians, and the general public. But
notwithstanding hundreds of articles devoted to the importance of markets for remanufactured
and recycled products, prior research has failed to provide a comprehensive approach to
evaluating the attractiveness of reverse markets. Reverse markets exhibit significant differences
that render approaches to assessing the attractiveness of traditional markets inadequate.
Understanding the forces that shape these markets is vital to strategic decision-making. Hence,
the present article’s contribution is the development of a dedicated model for assessing reverse
market attractiveness.
We identified, through interviews and industrial projects conducted with companies
engaged in product recovery in different countries, supplemented by prior research, factors that
affect the attractiveness of reverse markets (Q1). We then developed a comprehensive model,
which we term R5F (Q2), and discuss the integration of its analysis of reverse market
characteristics with the evaluation of internal capabilities and resources in a comprehensive
corporate decision-making process (Q3).
The R5F model affords management a hands-on managerial tool not only for assessing
market attractiveness, but also for identifying levers by which reverse markets might be reshaped
such that corporate capabilities and resources can be leveraged to achieve a competitive edge.
The model can also be used to justify engagement in product recovery to shareholders and other
stakeholders. Our research identifies characteristics that determine the attractiveness of reverse
markets, reveals the structure of those markets and levers by which they might be reshaped, and
yields insights that facilitate anticipation of market developments that can guide the formulation
of resilient strategies for entry and positioning. More broadly, the model can be used to inform
23
and suggest policy measures, beyond simple regulations, that might expand the magnitude and
scope of product recovery activities within particular industries. The R5F model is, for example,
currently used by the Bavarian State Ministry of the Environment and Consumer Protection in a
public project aimed at facilitating development of innovative approaches to increasing product
recovery quotas in southern Germany.
Our research into the forces that drive product recovery and influence reverse markets
has been validated in applications in which the R5F model has been effectively employed to
provide comprehensive assessment of reverse markets and it supports the formulation and
execution of strategies for reverse market entry and product recovery. The model contributes
“freshness in perspective to an already researched topic” (Eisenhardt 1989, 548) and may serve
as a catalyst for the genesis of a theoretical foundation for evaluating the attractiveness of reverse
markets.
<heading level 1> Acknowledgements The authors thank their industry contacts who provided valuable inputs and continuous
feedback during the development of this article. A special thanks is due Luk Van Wassenhove,
whose thoughtful observations and comments clearly served to improve the article.
<heading level 1> References
Abbey, J. D., J. D. Blackburn, and V. D. R. Guide. 2015a. Optimal pricing for new and
remanufactured products. Journal of Operations Management 36: 130–146.
Abbey, J. D., M. G. Meloy, V. D. R. Guide, and S. Atalay. 2015b. Remanufactured products in
closed-loop supply chains for consumer goods. Production and Operations Management
24(3): 488–503.
24
Agrawal, V. V., A. Atasu, and K. Van Ittersum. 2015. Remanufacturing, third-party competition,
and consumers' perceived value of new products. Management Science 61(1): 60–72.
Agrawal, V. V., M. Ferguson, L. B. Toktay, and V. M. Thomas. 2012. Is leasing greener than
selling? Management Science 58(3): 523–533.
Atasu, A., V. D. R. Guide, and L. N. Van Wassenhove. 2010. So what if remanufacturing
cannibalizes my new product sales? California Management Review 52(2): 56–76.
Atasu, A., M. Sarvary, and L. N. Van Wassenhove. 2008. Remanufacturing as a marketing
strategy. Management Science 54(10): 1731–1746.
Atasu, A. and R. Subramanian. 2012. Extended producer responsibility for e-waste: Individual or
collective producer responsibility? Production and Operations Management 21(6): 1042–
1059.
Atasu, A., L. N. Van Wassenhove, and M. Sarvary. 2009. Efficient take-back legislation.
Production and Operations Management 18(3): 243–258.
Blackburn, J. D., V. D. R. Guide, G. C. Souza, and L. N. Van Wassenhove. 2004. Reverse
supply chains for commercial returns. California Management Review 46(2): 6–22.
Boyer, K. K. and M. L. Swink. 2008. Empirical elephants—why multiple methods are essential
to quality research in operations and supply chain management. Journal of Operations
Management 26(3): 338–344.
Brandenburg, M., K. Govindan, J. Sarkis, and S. Seuring. 2014. Quantitative models for
sustainable supply chain management: Developments and directions. European Journal
of Operational Research 233(2): 299–312.
Carpenter, M. A. and W. G. Sanders. 2007. Strategic Management – A dynamic perspective.
New Jersey: Pearson Prentice Hall.
25
Carter, C. R. and P. L. Easton. 2011. Sustainable supply chain management: Evolution and
future directions. International Journal of Physical Distribution & Logistics Management
41(1): 46–62.
Carter, C. R. and D. S. Rogers. 2008. A framework of sustainable supply chain management:
Moving toward new theory. International Journal of Physical Distribution & Logistics
Management 38 (5): 360–387.
Chapman, A., C. Bartlett, I. McGill, D. Parker, and B. Walsh. 2010. Remanufacturing in the UK.
Centre for Remanufacturing and Reuse, Resource Recovery Forum.
Chung, C.-J. and H.-M. Wee. 2008. Green-component life-cycle value on design and reverse
manufacturing in semi-closed supply chain. International Journal of Production
Economics 113(2): 528–545.
Coughlan, P. and D. Coghlan. 2002. Action research for operations management. International
Journal of Operations & Production Management 22(2): 220–240.
de Brito, M. P. and R. Dekker. 2004. A framework for reverse logistics. In: Dekker, R., M.
Fleischmann, K. Inderfurth, and L. N. Van Wassenhove (Eds.), Reverse Logistics:
Quantitative Models for Closed-Loop Supply Chains. Berlin: Springer, 3–27.
Dowlatshahi, S. 2000. Developing a theory of reverse logistics. Interfaces 30(3): 143–155.
Dowlatshahi, S. 2005. A strategic framework for the design and implementation of
remanufacturing operations in reverse logistics. International Journal of Production
Research 43(16): 3455–3480.
Easwaran, G. and H. Üster. 2010. A closed-loop supply chain network design problem with
integrated forward and reverse channel decisions. IIE Transactions 42(11): 779–792.
26
Eisenhardt, K. M. 1989. Building theories from case study research. Academy of Management
Review 14(4): 532–550.
Ellram, L. M. 1996. The use of the case study method in logistics research. Journal of Business
Logistics 17(2): 93–138.
Ferguson, N. and J. Browne. 2001. Issues in end-of-life product recovery and reverse logistics.
Production Planning & Control: The Management of Operations 12(5): 534–547.
Ferguson, M. E., G. C. Souza, and L. B. Toktay. 2010. Examples of existing profitable practices
in product take-back and recovery. In: Ferguson, M. E. and G. C. Souza. (Eds.), Closed-
loop Supply Chains: New Developments to Improve the Sustainability of Business
Practices. Boca Raton: Taylor & Francis Group, 145–159.
Ferguson, M. E. and L. B. Toktay. 2006. The effect of competition on recovery strategies.
Production and Operations Management 15(3): 351–368.
Ferrer, G. and R. U. Ayres. 2000. The impact of remanufacturing in the economy. Ecological
Economics 32(3): 413–429.
Ferrer, G. and J. M. Swaminathan. 2006. Managing new and remanufactured products.
Management Science 52(1): 15–26.
Fleischmann, M., J. M. Bloemhof-Ruwaard, R. Dekker, E. A. van der Laan, J. A. E. E. van
Nunen, and L. N. Van Wassenhove. 1997. Quantitative models for reverse logistics: A
review. European Journal of Operational Research 103(1): 1–17.
Fleischmann, M., H. R. Krikke, R. Dekker, and S. D. P. Flapper. 2000. A characterisation of
logistics networks for product recovery. Omega 28(6): 653–666.
Galbreth, M. R. and J. D. Blackburn. 2006. Optimal acquisition and sorting policies for
remanufacturing. Production and Operations Management 15(3): 384–392.
27
Geyer, R. and T. Jackson. 2004. Supply loops and their constraints: The industrial ecology of
recycling and reuse. California Management Review 46(2): 55–73.
Geyer, R., L. N. Van Wassenhove, and A. Atasu. 2007. The economics of remanufacturing under
limited component durability and finite product life cycles. Management Science 53(1):
88–100.
Guide, V. D. R., V. Jayaraman, R. Srivastava, and W. C. Benton. 2000. Supply-chain
management for recoverable manufacturing systems. Interfaces 30(3): 125–142.
Guide, V. D. R. and J. Li. 2010. The potential for cannibalization of new products sales by
remanufactured products. Decision Sciences 41(3): 547–572.
Guide, V. D. R. and L. N. Van Wassenhove. 2001. Managing product returns for
remanufacturing. Production and Operations Management 10(2): 142–155.
Guide, V. D. R. and L. N. Van Wassenhove. 2009. The evolution of closed-loop supply chain
research. Operations Research 57(1): 10–18.
Hamzaoui-Essoussi, L. and J. D. Linton. 2014. Offering branded remanufactured/recycled
products: at what price? Journal of Remanufacturing 4(9): 1–15.
Hammond, R., T. Amezquita, and B. Bras. 1998. Issues in the automotive parts remanufacturing
industry – A discussion of results from surveys performed among remanufacturers.
International Journal of Engineering Design and Automation 4(1): 27–46.
Harms, R. and J. D. Linton. 2015. Willingness to pay for eco-certified refurbished products: The
effects of environmental attitudes and knowledge. Journal of Industrial Ecology. In
press: DOI: 10.1111/jiec.12301.
28
Hatcher, G. D., W. L. Ijomah, and J. F. C. Windmill. 2011. Design for remanufacture: A
literature review and future research needs. Journal of Cleaner Production 19(17-18):
2004–2014.
Jayaraman, V. and Y. Luo. 2007. Creating competitive advantages through new value creation:
A reverse logistics perspective. Academy of Management Perspectives 21(2): 56–73.
Kapetanopoulou, P. and G. Tagaras. 2011. Drivers and obstacles of product recovery activities in
the Greek industry. International Journal of Operations & Production Management
31(2): 148–166.
Ketokivi, M. and T. Choi. 2014. Renaissance of case research as a scientific method. Journal of
Operations Management 32(5): 232–240.
Knemeyer, A. M., T. G. Ponzurick, and C. M. Logar. 2002. A qualitative examination of factors
affecting reverse logistics systems for end-of-life computers. International Journal of
Physical Distribution & Logistics Management 32(6): 455–479.
Krumwiede, D. W. and C. Sheu. 2002. A model for reverse logistics entry by third-party
providers. Omega 30(5): 325–333.
Lebreton, B. 2007. Strategic Closed-loop Supply Chain Management. New York: Springer.
Lebreton, B. and A. Tuma. 2006. A quantitative approach to assessing the profitability of car and
truck tire remanufacturing. International Journal of Production Economics 104(2): 639–
652.
Li, K. J., D. K. H. Fong, and H. S. Xu. 2011. Managing trade-in programs based on product
characteristics and customer heterogeneity in business-to-business markets.
Manufacturing & Service Operations Management 13(1): 108–123.

29
Majumder, P. and H. Groenevelt. 2001. Competition in remanufacturing. Production and
Operations Management 10(2): 125–141.
Maslennikova, I. and D. Foley. 2000. Xerox's approach to sustainability. Interfaces 30(3): 226–
233.
Matsumoto, M., N. Nakamura, and T. Takenaka. 2010. Business constraints in reuse services.
IEEE Technology and Society Magazine 29(3): 55–63.
Morana, R. and S. Seuring. 2007. End-of-life returns of long-lived products from end
customer—Insights from an ideally set up closed-loop supply chain. International
Journal of Production Research 45(18-19): 4423–4437.
Nuss, C., R. Sahamie, and D. Stindt. 2015. The reverse supply chain planning matrix: A
classification scheme for planning problems in reverse logistics. International Journal of
Management Reviews 17(4): 413–436.
Oraiopoulos, N., M. E. Ferguson, and L. B. Toktay. 2012. Relicensing as a secondary market
strategy. Management Science 58(5): 1022–1037.
Ovchinnikov, A. 2011. Revenue and cost management for remanufactured products. Production
and Operations Management 20(6): 824–840.
Pang, G., F. Casalin, S. Papagiannidis, L. Muyldermans, and Y. K. Tse. 2015. Price determinants
for remanufactured electronic products: a case study on eBay UK. International Journal
of Production Research 53(2): 572–589.
Porter, M. E. 1979. How competitive forces shape strategy. Harvard Business Review 57(2):
137–145.
Porter, M. E. 2008. The five competitive forces that shape strategy. Harvard Business Review
86(1): 78–93.

30
Quariguasi Frota Neto, J. and J. Bloemhof. 2012. An analysis of the eco-efficiency of
remanufactured personal computers and mobile phones. Production and Operations
Management 21(1): 101–114.
Quariguasi Frota Neto, J. and L. N. Van Wassenhove. 2013. Original equipment manufacturers’
participation in take-back initiatives in Brazil. Journal of Industrial Ecology 17(2): 238–
248.
Quariguasi Frota Neto, J., J. Bloemhof, and C. Corbett. 2016. Market prices of remanufactured,
used and new items: Evidence from eBay. International Journal of Production
Economics 171(3): 371–380.
Rathore, P., S. Kota, and A. Chakrabarti. 2011. Sustainability through remanufacturing in India:
A case study on mobile handsets. Journal of Cleaner Production 19(15): 1709–1722.
Ravi, V. 2012. Evaluating overall quality of recycling of e-waste from end-of-life computers.
Journal of Cleaner Production 20(1): 145–151.
Robotis, A., S. Bhattacharya, and L. N. Van Wassenhove. 2012. Lifecycle pricing for installed
base management with constrained capacity and remanufacturing. Production and
Operations Management 21(2): 236–252.
Searcy, D. L. and J. T. Mentzer. 2003. A framework for conducting and evaluating research.
Journal of Accounting Literature 22: 130–167.
Seuring, S. and M. Müller. 2008. From a literature review to a conceptual framework for
sustainable supply chain management. Journal of Cleaner Production 16(15): 1699–
1710.

31
Shaharudin, M. R., S. Zailani, and K. C. Tan. 2015. Barriers to product returns and recovery
management in a developing country: Investigation using multiple methods. Journal of
Cleaner Production 96(1): 220–232.
Sheu, J. B., Y. H. Chou, and C. C. Hu. 2005. An integrated logistics operational model for green-
supply chain management. Transportation Research Part E – Logistics and
Transportation Review 41(4): 287–313.
Souza, G. C. 2013. Closed-loop supply chains: A critical review, and future research. Decision
Sciences 44(1): 7–38.
Srivastava, S. K. and R. K. Srivastava. 2006. Managing product returns for reverse logistics.
International Journal of Physical Distribution & Logistics Management 36(7): 524–546.
Stindt, D. and R. Sahamie. 2014. Review of research on closed loop supply chain management in
the process industry. Flexible Services and Manufacturing Journal 26(1): 268–293.
Strauss, A. and J. M. Corbin. 1990. Basics of Qualitative Research: Grounded Theory
Procedures and Techniques. Thousand Oaks: Sage Publications.
Subramanian, R. and R. Subramanyam. 2012. Key factors in the market for remanufactured
products. Manufacturing & Service Operations Management 14(2): 315–326.
Subramoniam, R., D. Huisingh, and R. B. Chinnam. 2010. Aftermarket remanufacturing strategic
planning decision-making framework: Theory & practice. Journal of Cleaner Production
18(16-17): 1575–1586.
Subramoniam, R., D. Huisingh, R. B. Chinnam, and S. Subramoniam. 2013. Remanufacturing
decision-making framework (RDMF): Research validation using the analytical
hierarchical process. Journal of Cleaner Production 40: 212–220.
32
Tan, Q., X. Zeng, W. L. Ijomah, L. Zheng, and J. Li. 2014. Status of end-of-life electronic
product remanufacturing in China. Journal of Industrial Ecology 18(4): 577–587.
Toffel, M. W. 2003. The growing strategic importance of end-of-life product management.
California Management Review 45(3): 102–129.
vom Brocke, J., A. Simons, B. Niehaves, K. Riemer, R. Plattfaut, and A. Cleven. 2009.
Reconstructing the giant: On the importance of rigour in documenting the literature
search process. Proceedings of the 17th European Conference on Information Systems.
Voss, C., N. Tsikriktsis, and M. Frohlich. 2002. Case research in operations management.
International Journal of Operations & Production Management 22(2): 195–219.
Wang, Y. and B. T. Hazen. 2015. Consumer product knowledge and intention to purchase
remanufactured products. International Journal of Production Economics (in press).
Wernerfelt, B. 1984. A resource-based view of the firm. Strategic Management Journal 5(2):
171–180.
White, C. D., E. Masanet, C. Meisner Rosen, and S. L. Beckman. 2003. Product recovery with
some byte: An overview of management challenges and environmental consequences in
reverse manufacturing for the computer industry. Journal of Cleaner Production 11(4):
445–458.
Wu, Y.-C. J. and W.-P. Cheng. 2006. Reverse logistics in the publishing industry: China, Hong
Kong, and Taiwan. International Journal of Physical Distribution & Logistics
Management 36(7): 507–523.
33
<heading level 1> About the Authors Dennis Stindt is a research assistant at the Chair of Production and Supply Chain
Management at the University of Augsburg in Augsburg, Germany.
Joao Quariguasi Frota Neto is a senior lecturer at the Alliance Manchester Business
School, University of Manchester, United Kingdom.
Christian Nuss is a research assistant at the Chair of Production and Supply Chain
Management at the University of Augsburg in Augsburg, Germany.
Martin Dirr is a research assistant at the Chair of Production and Supply Chain
Management at the University of Augsburg in Augsburg, Germany.
Marta Jakowczyk is a research assistant at the Sustainable Consumption Institute (SCI)
and the School of Mechanical, Civil and Aerospace Engineering (MACE) at the University of
Manchester in Manchester, United Kingdom.
Andrew Gibson is a professor at the School of Mechanical, Civil and Aerospace
Engineering (MACE) at the University of Manchester in Manchester, United Kingdom.
Axel Tuma is a professor at the Chair of Production and Supply Chain Management at
the University of Augsburg in Augsburg, Germany.

34
Figure 1: Markets in closed-loop networks.
Figure 2: Methodological approach for development of theoretical model.
Primary'market
Supply Demand
Dissipation
OEMs
Reverse'market
IRCs'/'OEMs
Secondarymarket
Customers'(B2B'/'B2C'/internal)
Suppliermarket
Supplier
SupplyDemand
SupplyDemandDemand Supply
Customers'(B2B'/'B2C)
Forward'flow
Reverse'flow
Waste /2Co4products

35
Figure 3: Reverse Five Forces Model (R5F).
Table 1: Comparison of market characteristics.
Primary/ secondary markets Reverse market Role of manufacturer Supplier Consumer Role of customer Consumer Supplier Origin of traded products Manufacturer Customer Sink of traded products Customer OEM, IRC, landfill, dissipation Product flow Diverging Converging Network structure Few-to-many Many-to-few Main source of uncertainty Demand side Supply side
Input quality Homogeneous, deterministic Heterogeneous, stochastic Scope of market Customer-/ Functionality-centered Product-/ Material-centered
36
Table 2: List of companies studied within this article. Company
ID Industry
sector Type of
Company Revenues (in USD)
Number of employees
Roles Involved Implemented method
C1 IT-Equipment
OEM 30 – 50 bn More than 150,000
Vice President Product Recovery Action research
C2 Paper & Pulp OEM 10 – 20 bn 20,000 – 50,000 Director Supply Chain Management Action research
C3 Metal & Steel OEM 10 – 20 bn 20,000 – 50,000 Head of Procurement (Scrap steel)
Action research
C4 Tire manufacturer
OEM N/A N/A Representative of German Tire Manufacturer Lobby
Semi-structured interview
C5 Plastics & Polymer
OEM N/A N/A Head of Department Plastics and Environment
Semi-structured interview
C6 Mechanical Engineering
OEM 10 – 20 bn 20,000 – 50,000 Head of Production Semi-structured interview
C7 Aerospace OEM 10 – 20 bn 50,000 – 150,000
Head of Strategic Capability; Defence Aerospace Project Manager
Semi-structured interview
C8 Healthcare OEM > 50 bn 50,000 – 150,000
Vice President Environment, Health and Safety (EH&S); Director Global EH&S;
Director Refurbished Programmes
Semi-structured interview
C9 Furniture/ NGO
IRC N/A < 10,000 Managing Director Action research
C10 Metal & Steel IRC 5 – 10 bn 20,000 – 50,000 Executive Assistant Semi-structured interview
C11 White goods IRC N/A < 10,000 Company Director; Sales Manager;
Technician
Semi-structured interview
C12 IT-Equipment/
NGO
IRC 10 – 20 bn 10,000 – 20,000 Director International Partners Compliance; Sales and Customer Service
Specialist; Technician
Semi-structured interview
37
Table 3: Relevant factors influencing the attractiveness of a reverse market.
Forces Attributes A
graw
al e
t al.
(201
5)
Agr
awal
et a
l. (2
012)
A
tasu
et a
l. (2
008)
A
tasu
et a
l. (2
009)
A
tasu
et a
l. (2
010)
B
lack
burn
et a
l. (2
004)
C
hung
and
Wee
(200
8)
Dow
lats
hahi
(200
0)
Dow
lats
hahi
(200
5)
Eas
war
an a
nd Ü
ster
(201
0)
Ferg
uson
et a
l. (2
010)
Fe
rgus
on a
nd T
okta
y (2
006)
Fe
rrer
and
Sw
amin
atha
n (2
006)
G
albr
eth
and
Bla
ckbu
rn (2
006)
G
eyer
and
Jack
son
(200
4)
Gey
er e
t al.
(200
7)
Gui
de a
nd L
i (20
10)
Gui
de a
nd v
an W
asse
nhov
e (2
009)
H
amm
ond
et a
l. (1
998)
H
atch
er e
t al.
(201
1)
Jaya
ram
an a
nd L
uo (2
007)
K
nem
eyer
et a
l. (2
002)
Le
bret
on (2
007)
Le
bret
on a
nd T
uma
(200
6)
Li e
t al.
(201
1)
Maj
umde
r and
Gro
enev
elt (
2001
) M
atsu
mot
o et
al.
(201
0)
Mor
ana
and
Seur
ing
(200
7)
Ora
iopo
ulos
et a
l. (2
012)
R
atho
re e
t al.
(201
1)
Rav
i (20
12)
Rob
otis
et a
l. (2
012)
Sh
ahar
udin
et a
l. (2
015)
Sh
eu e
t al.
(200
5)
Souz
a (2
013)
Su
bram
ania
n an
d Su
bram
anya
m (2
012)
Su
bram
onia
m e
t al.
(201
0)
Subr
amon
iam
et a
l. (2
013)
T
offe
l (20
03)
Whi
te e
t al.
(200
3)
C1
C2
C3
C4
C5
C6
C7
C8
C9
C10
C
11
C12
Access to recoverable products
Reverse market potential X X X X X X X X X X X X X X X X X
Customer structure X X X X X X X X X X X X X X X X
Quality of returns X X X X X X X X X X X X X X X X X X X
3rd party sourcing opportunities
X X X X X X X X
Mobility of product X X X X X X X
Customers’ perceived marginal value
X X X X X X X X X X
Forward business concept X X X X X X X X X X X X X X X X
Established take-back channels
X X X X X X X X X X X X X X
Regulation & policies X X X X X X X X X X X X X X X X X
Customers’ willingness to return
X X X X X X X X X X X X X
Threat of IRCs’ market entry
Strategic costs X X X X X X X X X X X X X X X X X X
Technical feasibility X X X X X X X X X X X X X X X
Technology requirements X X X X X X X X X X X X X X X X
Specific knowledge X X X X X X X X X X X X X X
Certifications & laws X X X X X X X X X X X X
Rivalry for recoverable products
Rivals’ segmentation X X X X X X X X X X X X X X X
Recovery alternatives X X X X X X X X X X
Heterogeneity of rivals X X X X X X X X X X X X
Number, size & concen-tration of competitors
X X X X X X X X X X
Existence of intermediaries X X X X X X
Adverse effects on core business
Cannibalization X X X X X X X X X X X X X X X X X
Quality differential between new & recovered product
X X X X X X X X X X X X X X X X
Strategic stakes X X X X X X X X
Effects on brand image X X X X X X X X X X X X X X X X X X
Speed of innovation X X X X X X X X X X X
Product design X X X X X X X X X X X X X X X X
Remarketing opportunities
Existence of secondary market
X X X X X X X X X X X X X X X X X X X X X X X X X X X X X
Customers’ willingness to pay
X X X X X X X X X X X X X X X X X X
Potential and dynamics X X X X X X
Technology life-cycles X X X X X X X X X X X X X X
Sinks for unwanted by-products
X X X X X X X
38
Table 4: Application of the R5F to the case studies
Forces Attributes White Goods Paper & Pulp
Access to recoverable products
Reverse market potential High Virtually infinite, regenerating
Customer structure Mostly households, geographically dispersed Heterogeneous
Quality of returns Significant fraction of bad condition Highly heterogeneous
3rd party sourcing opportunities
Collection points run by municipalities, brokers and other third parties with strong position on the market Municipal waste system
Mobility of product Low to moderate High, but negligible because of small value and high amounts
Customers’ perceived marginal value Low None
Forward business concept Independent from manufacturing Independent from forward business concepts
Established take-back channels
Municipal collection and private contractors Municipal waste system
Regulation & policies Recycling preferred, no incentives for remanufacturing Negligible regulations, policies facilitate product return and collection
Customers’ willingness to return
High, without a fee High
Threat of IRCs’ market entry
Strategic costs Low High
Technical feasibility Particularly hard Easy for low quality
Technology requirements Low High
Specific knowledge Required Medium
Certifications & laws Ineffective Negligible
Rivalry for recoverable products
Rivals’ segmentation Brokers, remanufacturers, recyclers Recovery market dominated by manufacturers
Recovery alternatives Scarce Virtually no recovery option above recycling
Heterogeneity of rivals High Low
Number, size & concen-tration of competitors
High number of small players, low concentration Oligopoly
Existence of intermediaries High Predefined as collection is publicly organized
Adverse effects on core business
Cannibalization No concern No concern
Quality differential between new & recovered product High Marginal, adjustable
Strategic stakes Not present Cost reductions in primary manufacturing
Effects on brand image Unknown Positive
Speed of innovation Fast efficiency gains Negligible
Product design Not suitable for remanufacturing Easily recyclable
Remarketing opportunities
Existence of secondary market
Existent, but unknown size Congruent to primary market
Customers’ willingness to pay
Relatively high for products with high brand equity, low for the rest Slightly lower for some products
Potential and dynamics Slow growth Stable
Technology life-cycles Continuous innovations Negligible
Sinks for unwanted by-products Existent for most parts Existent, partly profitable
Appendix:
On the attractiveness of product recovery in the white goods sector
This case considers, from the perspective of an OEM and in the context of the
application of the framework developed in this paper, the attractiveness of the reverse
market for washing machines in the United Kingdom. The case is distinguished from
the other case elaborated in the paper by the fact that the remanufacturing processes
are still not fully consolidated. That is, the focal OEM does not engage in product
remanufacturing. Notwithstanding the focus on the OEM, multiple conversations
were held with two IRCs and the remanufacturing facilities of them were visited at
least once by two of the researchers. Interviewing independent remanufacturers was
particularly important to gain an understanding of the dynamics of forces ‘Threat of
IRCs’ market entry’ as well as ‘Access to recoverable products’ and ‘Rivalry for
recoverable products’. While the OEM is a global brand, the independent
remanufacturers both located in Europe act domestically.
‘Access to recoverable products’ is a serious issue for the OEM. Although the
reverse market potential is high, obtaining high quality core is a challenge. The
customer structure mainly consists of geographically dispersed households.
Regarding the forward business concept, liaison with these B2C customers is via
retailers, which is not beneficial to OEMs seeking to collect core. A significant
fraction of returned core is of bad condition as the OEM observed that consumers
“use [their machines] until [...] [they] break down.” Quality of returns thus also
reduces the attractiveness of the market. 3rd party sourcing opportunities do exist,
but they hold strong positions in the market limiting the possibility of a good bargain.
On a positive note, mobility of the product is not a major issue as the product is
mostly heavy and of considerable size making it hard to transport. Moreover,
customers’ perceived marginal value is low, a segment of the customer population
shows a high willingness to return the product as long as no expense is incurred in
doing so. Established take-back channels are in place for one of the remanufacturers
and could potentially be useful should it decide to engage in remanufacturing.
Regulations & policies are geared towards recycling, and government-provided
financial incentives for remanufacturers seem to be lacking. In summary, with respect
to access to recoverable products, this is not an attractive market.
‘Rivalry for recoverable products’ is low if only the market for
remanufactured products is considered. There is, however, a group of well-established
rivals in the business of product take-back. These are segmented (rivals’
segmentation) into brokers that compete for any type of core, recyclers looking for
high- and low-quality core, and remanufacturers that tend to consider only high-
quality returns. This leads to a reverse market that exhibits high heterogeneity of
rivals comprising numerous players of different size and interests (number, size &
concentration of competitors). Recovery alternatives thus differ among these
players. With regard to intermediaries, retailers control much of the supply chain for
returned products. Intermediaries exist in large numbers. The intermediaries that sell
returns to remanufacturers may also be engaged in product recycling. Their power in
the supply chain fluctuates with, among other things, the price of metal. Obsolete
products are readily obtained when metal prices are low, but the balance tips in favor
of intermediates selling core when the price of metal increases.
‘Threat of IRCs’ market entry’, works in favor of the OEM as outlined below.
Strategic cost is not a major impediment to newcomers, not least because economies
of scale are difficult to achieve and the remanufacturing process is mainly conducted
manually. Therefore, the technology requirements are low in many cases.
Conversely, technical feasibility is a far greater barrier to IRCs, particularly for the
high-end spectrum of machines due to the ever-increasing complexity of the
electronics and software components. Independent remanufacturers find it difficult to
remanufacture washing machines when problems with defective returned core are
electronics-related, and OEMs can to a large extent, whether intentionally or not, lock
out new independent remanufacturers by controlling the supply of key spare parts and
employing proprietary software for control boards. These circumstances can make
IRCs’ market entry technically impossible for certain product types. Potential
competition from IRCs is further impeded by lack of specific knowledge, there being
a shortage of trained personnel. Acquisition of the required knowledge to
remanufacture low-end analog washing machines is straightforward, not so for newer,
more sophisticated models. Certification & laws are ineffective in reducing
impediments to or promoting future competition. In summary, technical feasibility
and specific knowledge issues pose relatively high entry barriers to IRCs and thereby
enhance the attractiveness of the market for OEMs.
With respect to ‘Adverse effects on core business’ our conversations with the
OEM did not reveal fear of cannibalization. With the focal OEM not having a
remanufacturing operation in place, our conversations with the IRCs have shown the
issue of quality differential between new & remanufactured products for certain
models of washing machines to be quite high. Strategic stakes not being present
unlike the case in which proper functioning of products is crucial (e.g., healthcare
equipment), the OEM is less concerned with driving competitors out of the reverse
market to prevent poorly remanufactured washing machines. The product design is
largely not suited for remanufacturing. Whether potential positive or negative effects
on brand image exist, is a question that could not be clearly answered by the OEM.
Speed of innovation is also relevant. In general, although the product can be
classified as functional, efficiency gains drive machines to rapid obsolescence, which
guarantees a steady flow of returns. Summing up, ‘Adverse effects on core business’
are marginal favoring the market attractiveness.
A new line of remanufactured products, in particular of high-end models,
would have a secondary market, but how large is unclear. A certain segment of the
population shows a high customers’ willingness to pay, as they perceive
remanufactured washing machines with high brand recognition to be of good quality,
but for most other washing machines that can potentially be remanufactured
willingness to pay is low and the market insufficiently large to attract OEMs’
participation. It is difficult to predict market potential and dynamics, but the OEM
stated that it continuously re-assesses the secondary market observing a slow growth.
Concerning technology life-cycles, we believe that OEMs will continue to drive
innovation in order to persuade consumers to buy new products, and that this will
only change if the current business model changes.
By conducting the analysis some major insights concerning the reverse market
could be revealed. First of all, it can be noted that the market is characterized by an
overall sufficient potential of recoverable products and a lucrative secondary market,
especially for remanufactured goods with high brand-recognition. Nevertheless, this
market is widely ignored by OEMs although the analysis suggests certain levers that
may help the OEMs to further increase the attractiveness of individual product
recovery. In particular, OEMs may mitigate the influence of IRCs on the market as
they have a monopoly for needed spare parts and have advantages on the technical
and informative knowledge necessary for recovery operations. Another lever may be
an alteration of the forward business concept, for example by introducing product-
service bundles, leasing contracts or old-for-new offers at retailers. The benefits for
an OEM with high brand recognition are threefold: First, by entering the reverse
market the OEM may tackle its low-brand competitors on their playing field with
limited risk of jeopardizing its primary market. Second, it may mitigate the risk from
IRCs that remanufacture their own products. Third, and probably most importantly, it
may offer the opportunity for earning additional profits. Surely and as already
mentioned in the article, these insights alone are not sufficient for a holistic decision-
making. Based on these initial observations and the thorough market understanding,
the OEM must further elaborate on the topic matching its own capabilities, assess
profit and loss effects in more detail and evaluate the needed changes within the
organizational structure.
On the attractiveness of product recovery in the paper and pulp sector
This case evaluates the attractiveness of waste paper recovery from the
perspective of a manufacturer that uses paper and pulp as inputs to the papermaking
process. Information for this case was derived from a collaborative project that re-
assessed a large paper manufacturer’s European sourcing strategy for secondary raw
material. Executives in charge of production planning, strategic purchasing, and
supply chain management were engaged in numerous conversations throughout the
project. In contrast to the white goods case, the focal manufacturer is already involved
in product reprocessing, and waste paper has a long tradition as an input in the
industry. The R5F model was consequently used primarily to enhance understanding
of the market and potential rivals as opposed to evaluate market entry, as was the case
for the white goods manufacturer.

Access to recoverable products is not a concern in reverse markets for paper.
Customer structure typically involves a distinction between pre- and post-consumer
waste paper, the former consisting largely of packing materials and other wastes
concentrated at manufacturing sites, the latter of more heterogeneous materials that
are highly dispersed. As both B2C and B2B customers regard used paper as waste,
customer’s perceived marginal value is negligible. Established take-back
channels commonly organized by local authorities as part of municipal waste systems
(3rd party sourcing opportunities) contribute to a high customers’ willingness to
return both pre- and post-consumer paper, and large amounts of pre-consumer waste
may be returned directly to the reprocessing facility. The recovery rate for paper is
consequently as high as 70% in Europe, and paper being used in manifold
applications and sold in large quantities on the primary market. The overall reverse
market potential is virtually infinite and continuously regenerating. Availability of
recoverable paper is not restricted by regulations, most waste paper being free of
toxic or otherwise harmful substances. Indeed, waste paper recovery is facilitated by
laws like the European Directive on Packaging and Packaging Waste. As leasing and
similar concepts are not common in paper trading the reverse market is totally
decoupled from the forward-business concept of primary manufacturers. Quality of
returns of post-consumer paper is highly heterogeneous as products include
packaging, newspaper as well as graphical and office paper, and many other varieties.
Although most authorities offer separate disposal channels for waste paper, returns
are also often contaminated with other products (staples, plastics, organic wastes,
etc.). Quality requirements in paper recovery are quite low and separation processes
are well established. Although the high mobility of the product gives rise to
numerous possibilities for dissipation (e.g., the general waste stream and the
fireplace), this concern is marginalized by the vast amounts of paper in use and
continuous replenishment via the primary market. In sum, access to recoverable
products registers as a positive factor with respect to the attractiveness of the reverse
market.
Degree of rivalry for recoverable product is low in the reverse market for
waste paper. There are fundamentally two recovery alternatives. Waste paper can
either be used as a secondary input to the primary production process or can be
energetically recovered. In practice (at least in central Europe), the latter occurs
mostly in connection with such grades that cannot be used as secondary inputs due to
technical restrictions (e.g., fiber length). Rivals’ segmentation hence focuses on
companies that demand waste paper to substitute primary inputs. As competition from
IRCs is negligible, primarily companies active in the primary market are left as rivals.
This market being characterized by a low level of heterogeneity of rivals, relevant
competitors are easily monitored, being well known to one another. The resulting
market can be best described as an oligopoly with few but large players (number,
size & concentration of competitors) able to exploit their position as the largest
consumers of waste paper collected and offered by intermediaries, whether local
authorities or private contractors. These attributes clearly favor the OEMs and
increase the attractiveness of the market.
Entry into the paper recovery business, technical feasibility notwithstanding
(washing, re-pulping, fractionation refining, and dispersion, among other reprocessing
steps, being well established and mature), is highly unattractive for IRCs. Waste paper
used as a secondary raw material in the primary production process can be mixed in
large quantities with primary raw material. Depending on the final product, the
fraction of secondary material may vary between 30% for office paper and 100% for
newspaper grades. The need for a player seeking to enter the waste paper reprocessing
business to invest in capabilities similar to those employed in primary production are
consequently impeded by strategic costs driven mainly by high technology
requirements. This is clearly the dominant attribute within this force. Paper
manufacturing on an industrial scale is highly automated and requires special
machinery costing several hundreds of million euros. Specific knowledge and
certification & laws play inferior roles in paper recovery. That the threat of market
entry by IRCs is consequently quite low increases the attractiveness of the market for
OEMs.
Although product design is not explicitly considering recovery, waste paper
is fully integrated into the primary manufacturing process. The quality differential
between totally new product and products containing secondary input generally being
marginal, distinct primary and secondary product does not exist, eliminating the risk
of cannibalization. Moreover, use of waste paper resulting in reduced costs and
being considered environmentally friendly contributes to positive effects on brand
image. Strategic stakes (beyond these positive effects) do not factor as an impetus
for entering reverse markets. Advances affecting recovery operations not being
anticipated, speed of innovation is not a consideration. We thus perceive no adverse
effects, and even some positive effects, on paper manufacturers’ core business.
The secondary market for products made from or with secondary input is
largely the same as for primary products. Only in specific niches is customers’
willingness to pay higher for high-quality paper containing lower fractions of
secondary material. At the other end, many environmentally conscious consumers
prefer paper with high fractions of secondary input, up to 100%. Relative to
secondary market potential and dynamics, demand for paper is considered to be
stable despite the print media seeming to be in enduring crisis, which is partly
compensated by increased demand for packaging materials in connection with mail
orders. Technology life-cycles likely to alter secondary market dynamics are not
observed on the horizon. Sinks for unwanted by-products generated in the
reprocessing of waste paper may in many cases be a source of additional profit
(staples and cardboard, for example, can be sold to brokers).
Summing up, the reverse market for paper is highly attractive for companies already
involved in the primary business mostly due to the considerable synergies that can be
realized between the primary and secondary manufacturing processes. Indeed, these
processes, being wholly symbiotic, are not practically distinguishable. Competition
for waste paper consequently occurs exclusively between OEMs, which command a
strong position vis-à-vis the intermediaries charged with waste paper collection. The
foregoing analysis suggests that disruptive changes that would alter the structure of
the market are not conceivable at present.


