

1.Mapinfo AutomatorBy Mazhar Kazi

1. Mapinfo Automator Mapinfo Automator is a mapbasic tool that does variety of task from Drive test analysis to Cluster KPI computing and much more.
The basic features of the tool are discussed below:-
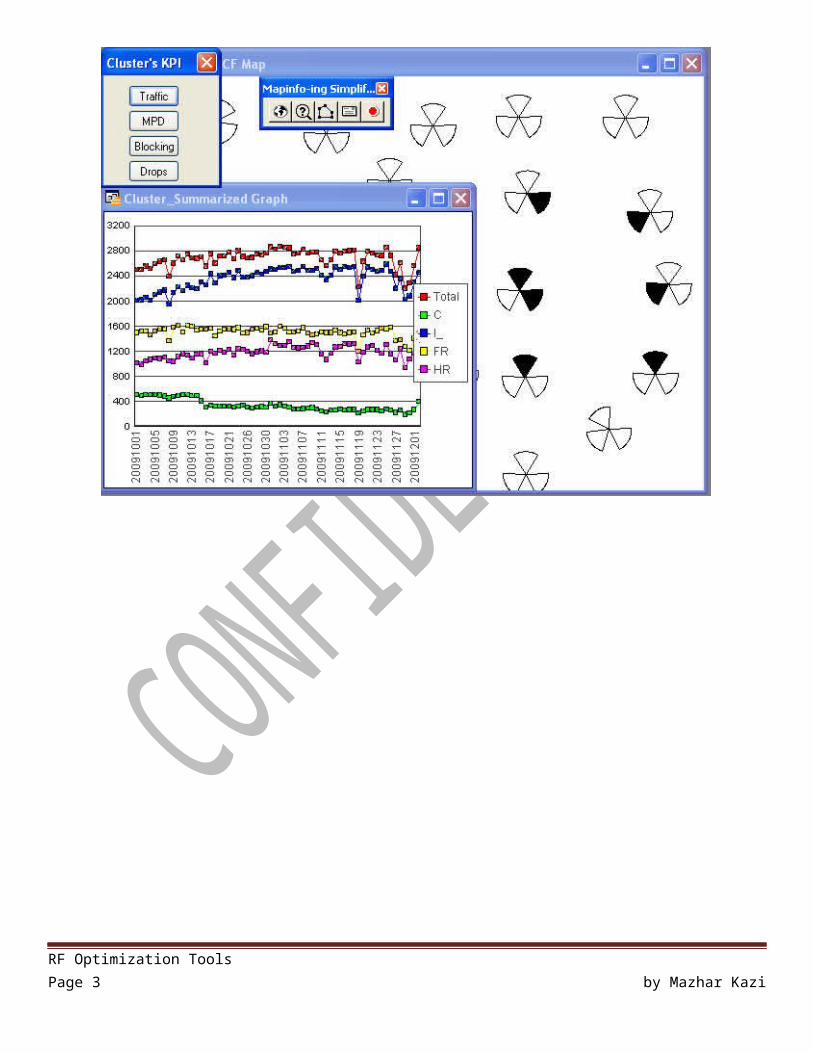
1.1. Cluster KPI ComputingThe Cluster KPI Computing function can be used to process raw stats on custom selection of cells and displays the graphical trend of major KPIs in Mapinfo. This is helpful in identifying cluster level improvement or degradation.
RF Optimization Tools Page 2 by Mazhar Kazi
Displays the Drive Selection Menu
Enable the Cell Selection Mode
Used for Cluster KPI Computing
About the Tool
RF Optimization Tools Page 3 by Mazhar Kazi

1.2. Drive Test Sample Reduction
RF Optimization Tools Page 4 by Mazhar Kazi
In the Drive Selection Menu select the Map File of the drive and click “Reduce Size” Button.
BSC Level Drive Test logs are difficult/extremely slow to work in mapinfo due to its huge size. This function can be used to remove all the redundant samples from the drive without losing any valuable information. It can approximately reduce a 500MB tems exported map file to 50MB. This significantly reduces the processing delay of the drive.
It can only reduce Dedicated and Scanned Drive.

2.2 Drive Analysis
2.2.1 Scanned Drive Analysis
2.2.1.1 Strongest Scanned Server
1.2.1.1.1. Filters a particular BCCH-BSIC from the drive
In the tool menu select the “Cell Selection Mode” Button and select any cell in the cell file to display its strongest server plot.
RF Optimization Tools Page 5 by Mazhar Kazi
Strongest Scanned Server Plot of this cell.
Select the below mentioned parameters in the drive selection menu and click button “Done”.
Select the Tems exported Map file.
Attribute (Levels) on which thematic will be applied.
Drive Attribute containing BCCH.
Drive Attribute containing BSIC.
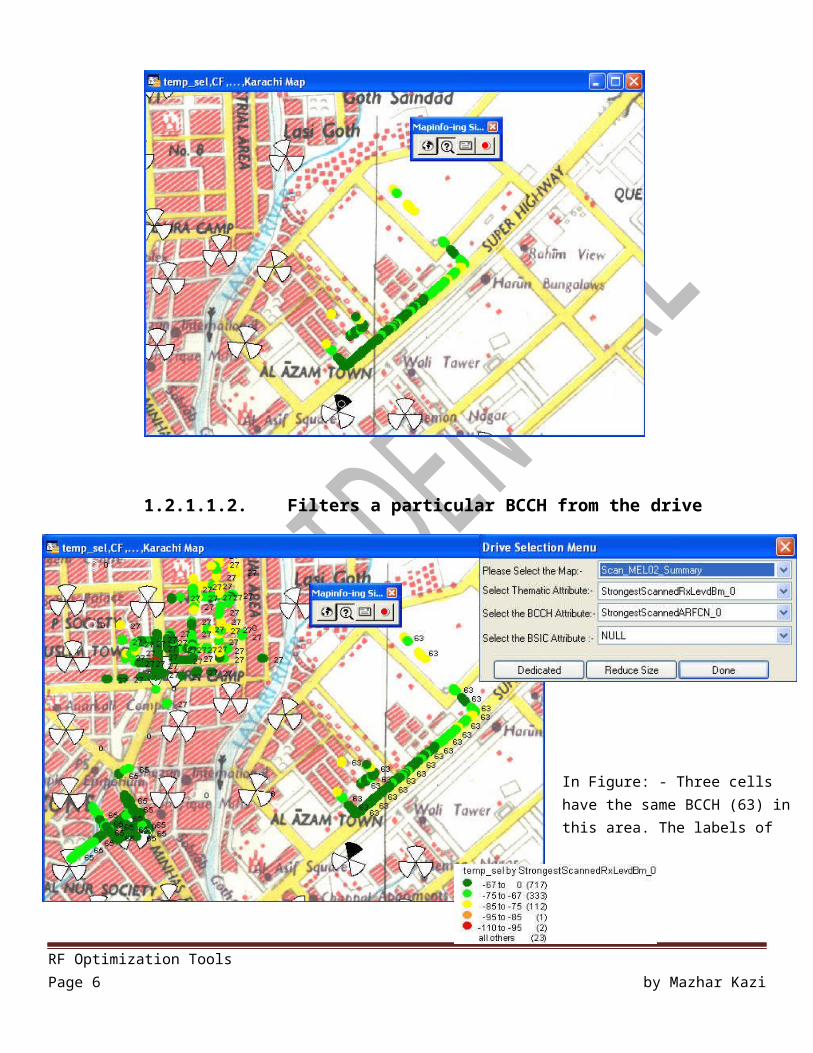
1.2.1.1.2. Filters a particular BCCH from the drive
It filters the BCCH of the cell that is selected irrespective of the BSIC.
1.2.1.2. Scanned Server
RF Optimization Tools Page 6 by Mazhar Kazi
In Figure: - Three cells have the same BCCH (63) in this area. The labels of 27, 65 & 63 are the BSIC of these cells.
Scanned Server Plot of this cell.

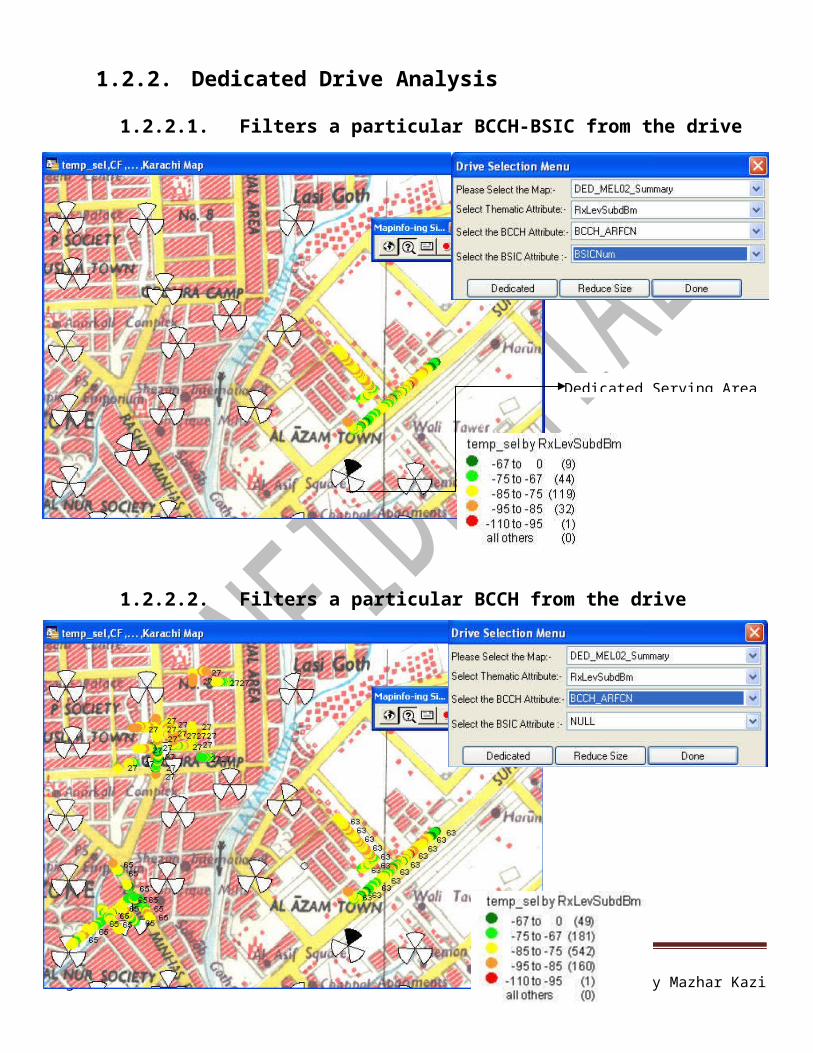
1.2.2. Dedicated Drive Analysis
1.2.2.1. Filters a particular BCCH-BSIC from the drive
1.2.2.2. Filters a particular BCCH from the drive
RF Optimization Tools Page 7 by Mazhar Kazi
Dedicated Serving Area of this cell.
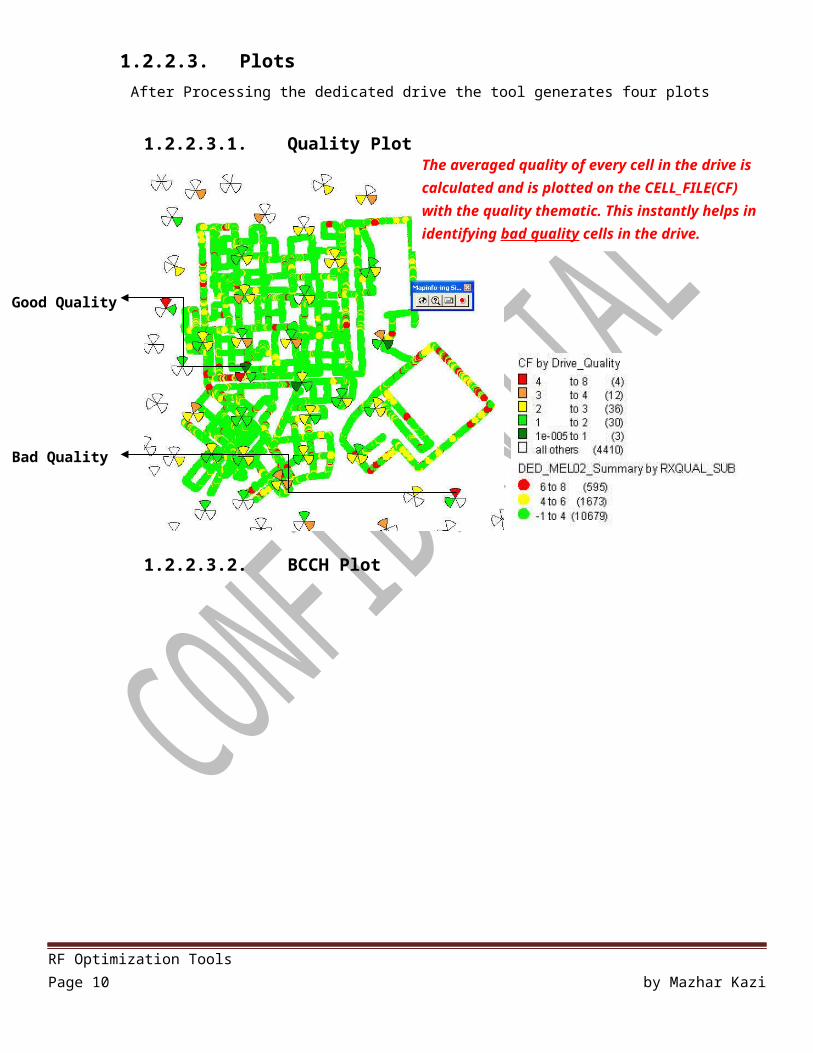
1.2.2.3. Plots
1.2.2.3.1. Quality Plot
1.2.2.3.2. BCCH Plot
RF Optimization Tools Page 8 by Mazhar Kazi
After Processing the dedicated drive the tool generates four plots which are described below:-
The averaged quality of every cell in the drive is calculated and is plotted on the CELL_FILE(CF) with the quality thematic. This instantly helps in identifying bad quality cells in the drive.
Good Quality Cell
Bad Quality Cell
The Cell_File(CF) and the drive thematic is based on the BCCH. It is helpful in determining the coverage area of a cell, overshooting and low dominance etc

1.2.2.3.3. TA Plot
1.2.2.3.4. Speech Codec Plot
RF Optimization Tools Page 9 by Mazhar Kazi
The averaged TA of every cell in the drive is calculated and is plotted on the CELL_FILE(CF) with the TA thematic. This instantly helps in identifying Overshooting cells in the drive.
Low TA Cell
High TA Cell
Note: All the above plots can be viewed with simple keyboard shortcut keys. “Z” – Quality Plot, “X” – BCCH Plot, “C” – TA Plot, “V” – Speech Codec Plot.
All cells on which the call is handed over during the drive is “Pink”.
Call is not handed over to this cell during the drive. Might be a missing neighbor, Unavailability etc.
2.2.2.4 InterCell HandoversEach Line represents a single InterCell Handover during the drive. The source point is the source cell i.e. from which the handover is initiated and the destination point is the location where the handover took place.
RF Optimization Tools Page 10 by Mazhar Kazi


